
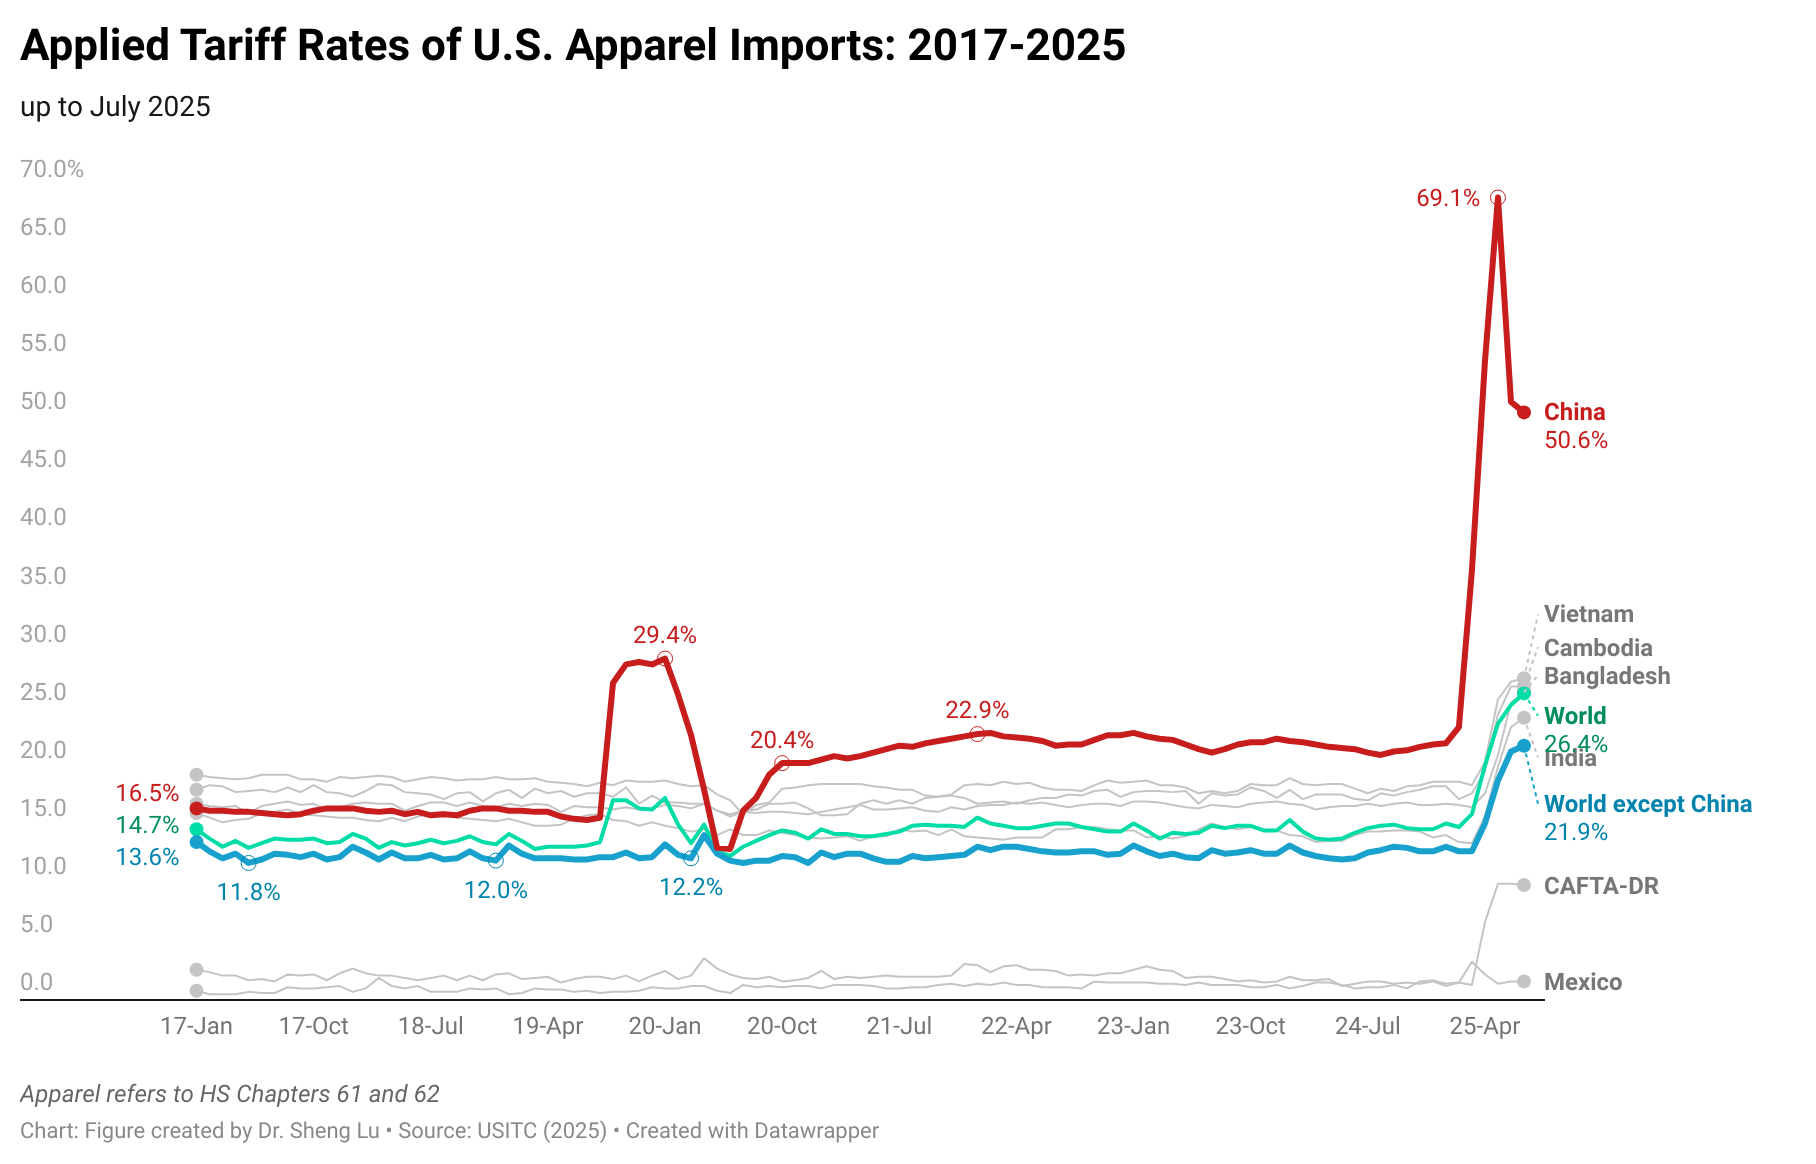
First, as a result of the IEEPA reciprocal tariff, the average tariff rate for U.S. apparel imports (HS Chapters 61 and 62) reached 26.4% in July 2025, marking a new high in decades (note: was 25.4% in June, 23.8% in May and 20.2% in April 2025), and a substantial increase from 14.7% in January 2025, prior to Trump’s second term. Even apparel imports from traditional U.S. free trade agreement partners, such as CAFTA-DR members, now have to be subject to about 10% applied tariffs. And apparel imports from Mexico still enjoyed a relatively low 1.6% tariff rate in July 2025. [Check the applied US apparel import tariff rate here]
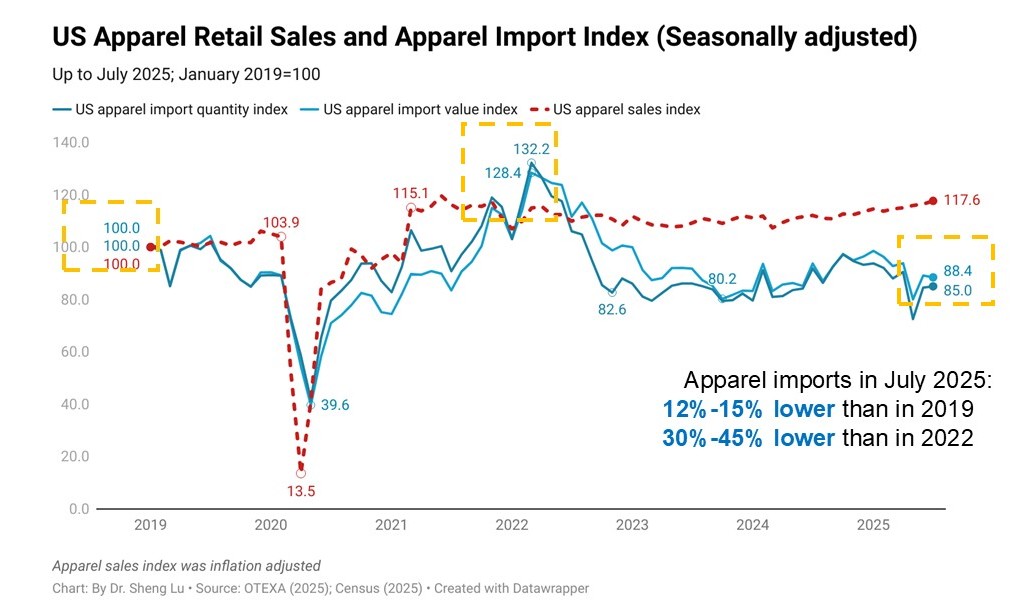
Second, U.S. apparel imports fell in July 2025, negatively impacted by the hiking of tariffs and consumers’ growing hesitancy in clothing spending amid uncertainty about their household financial outlook. Specifically, U.S. apparel imports in July 2025 decreased by 3.0% in value and 5.2% in quantity from a year ago, indicating both an overall shrinking import demand and a more notable import price increase. [Check U.S. apparel import index here]
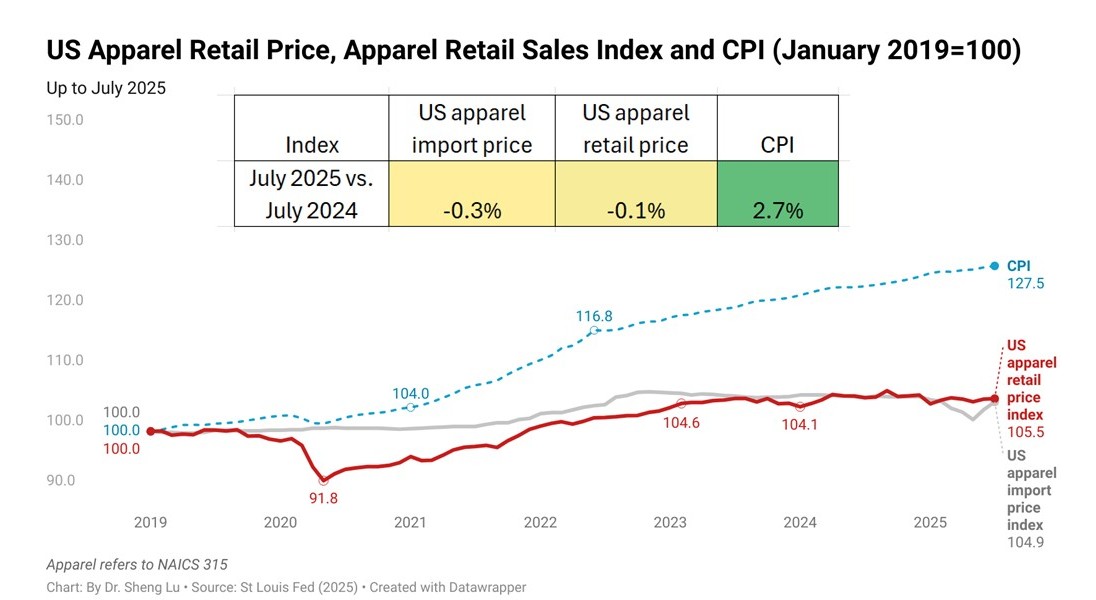
Statistics also show that after removing the seasonal factor, the average U.S. apparel import price went up by nearly 3% from April to July. This trend could become even worse in the coming months as more countries face even higher “reciprocal tariffs” starting from August 2025. However, the average U.S. apparel retail price has not significantly increased, likely because fashion companies fear losing sales at a time when consumers’ clothing spending is already weak. [Check the U.S. clothing retail price index here]
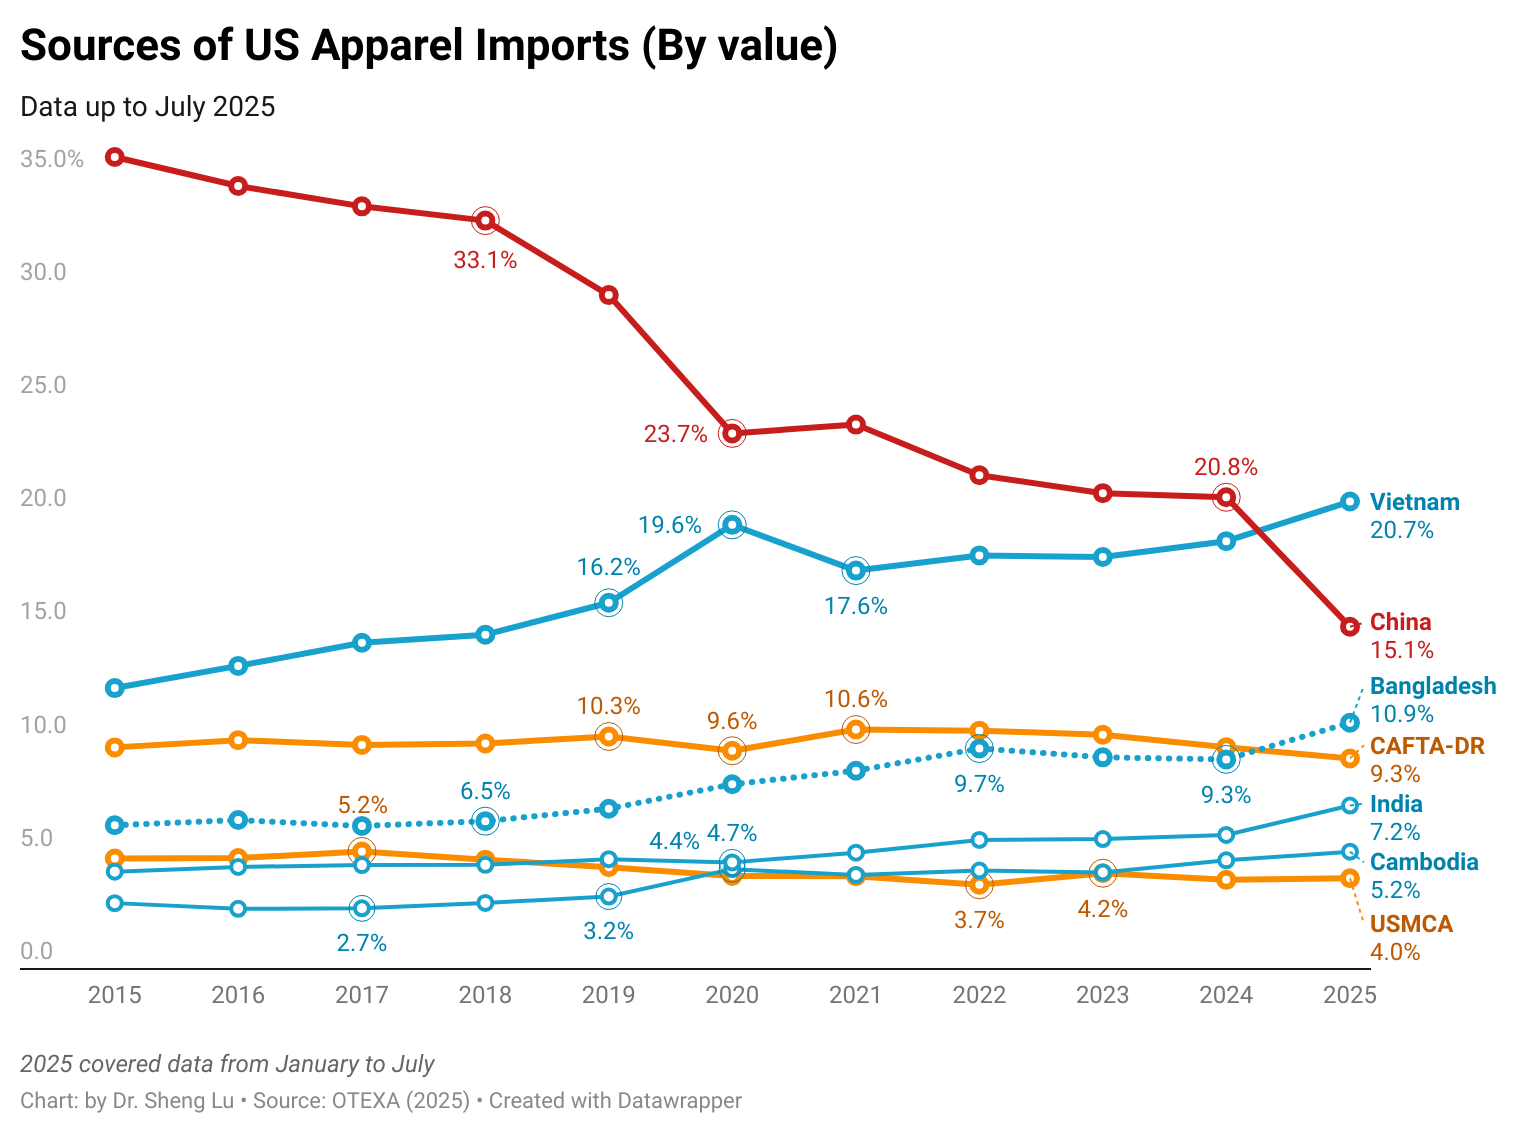
Third, continuing the trends from previous months, U.S. apparel imports from China again fell sharply in July 2025. Facing nearly 50% tariff rates—much higher than those applied to other sourcing countries—U.S. apparel imports from China decreased by 38.4% in value and 27.3% in quantity in July 2025 from a year ago. As a result, in value, China’s market share fell to just 15.6% in July 2025 (was 24.6% in July 2024), significantly lower than Vietnam’s 22.1% (was 19.1% in June 2024). In other words, it may signal a new era where China is no longer the top source of U.S. apparel imports. [Check market shares in U.S. apparel imports here]
Fourth, while Asia as a whole still dominates, trade data suggests more notable trends of sourcing diversification. In July 2025, about 72.9% of U.S. apparel imports came from China, far exceeding the Western Hemisphere (14.8%) and the rest of the world (12.4%). However, Asia’s market share in July 2025 was slightly lower than 74.7% a year ago, suggesting that more imports came from other regions. For example, at the country level, US apparel imports from several emerging Asian suppliers and those in the Middle East and Africa enjoyed fast growth, including Vietnam (up 12.5%), Cambodia (up 25.2%), Pakistan (up 14.7%), Jordan (up 21.6%), and Egypt (up 30.3%).
Meanwhile, U.S. apparel imports from India in July 2025 also increased by over 15%, although the newly imposed higher tariffs on India could alter the trend in the next few months.
Additionally, there is still no evidence that Trump’s tariff policy has meaningfully boosted nearshoring from the Western Hemisphere. On the contrary, in July 2025, U.S. apparel imports from Mexico grew by just 0.5%, despite the significant tariff advantage offered to USMCA-qualifying products. Similarly, imports from CAFTA-DR members decreased by 2.7%. The results revealed the adverse effects of uncertainty in the Trump administration’s tariff policy on encouraging long-term sourcing and investment commitment to the region.
(note: this post is not open for discussion)
By Sheng Lu

One thought on “Patterns of U.S. Apparel Imports (updated September 2025)”
Comments are closed.