
The full report is HERE.
Watch the USFIA webinar recording highlighting the study’s key findings
Key findings:
In 2026, U.S. fashion companies continued to operate in a highly uncertain business environment shaped by elevated tariffs, rising sourcing costs, geopolitical tensions, and increasingly complex regulatory requirements. However, compared with 2025, survey results suggest that companies are moving beyond short-term crisis response and increasingly adopting longer-term strategies focused on supply chain optimization, compliance capabilities, and operational resilience. [click here for top challenges]
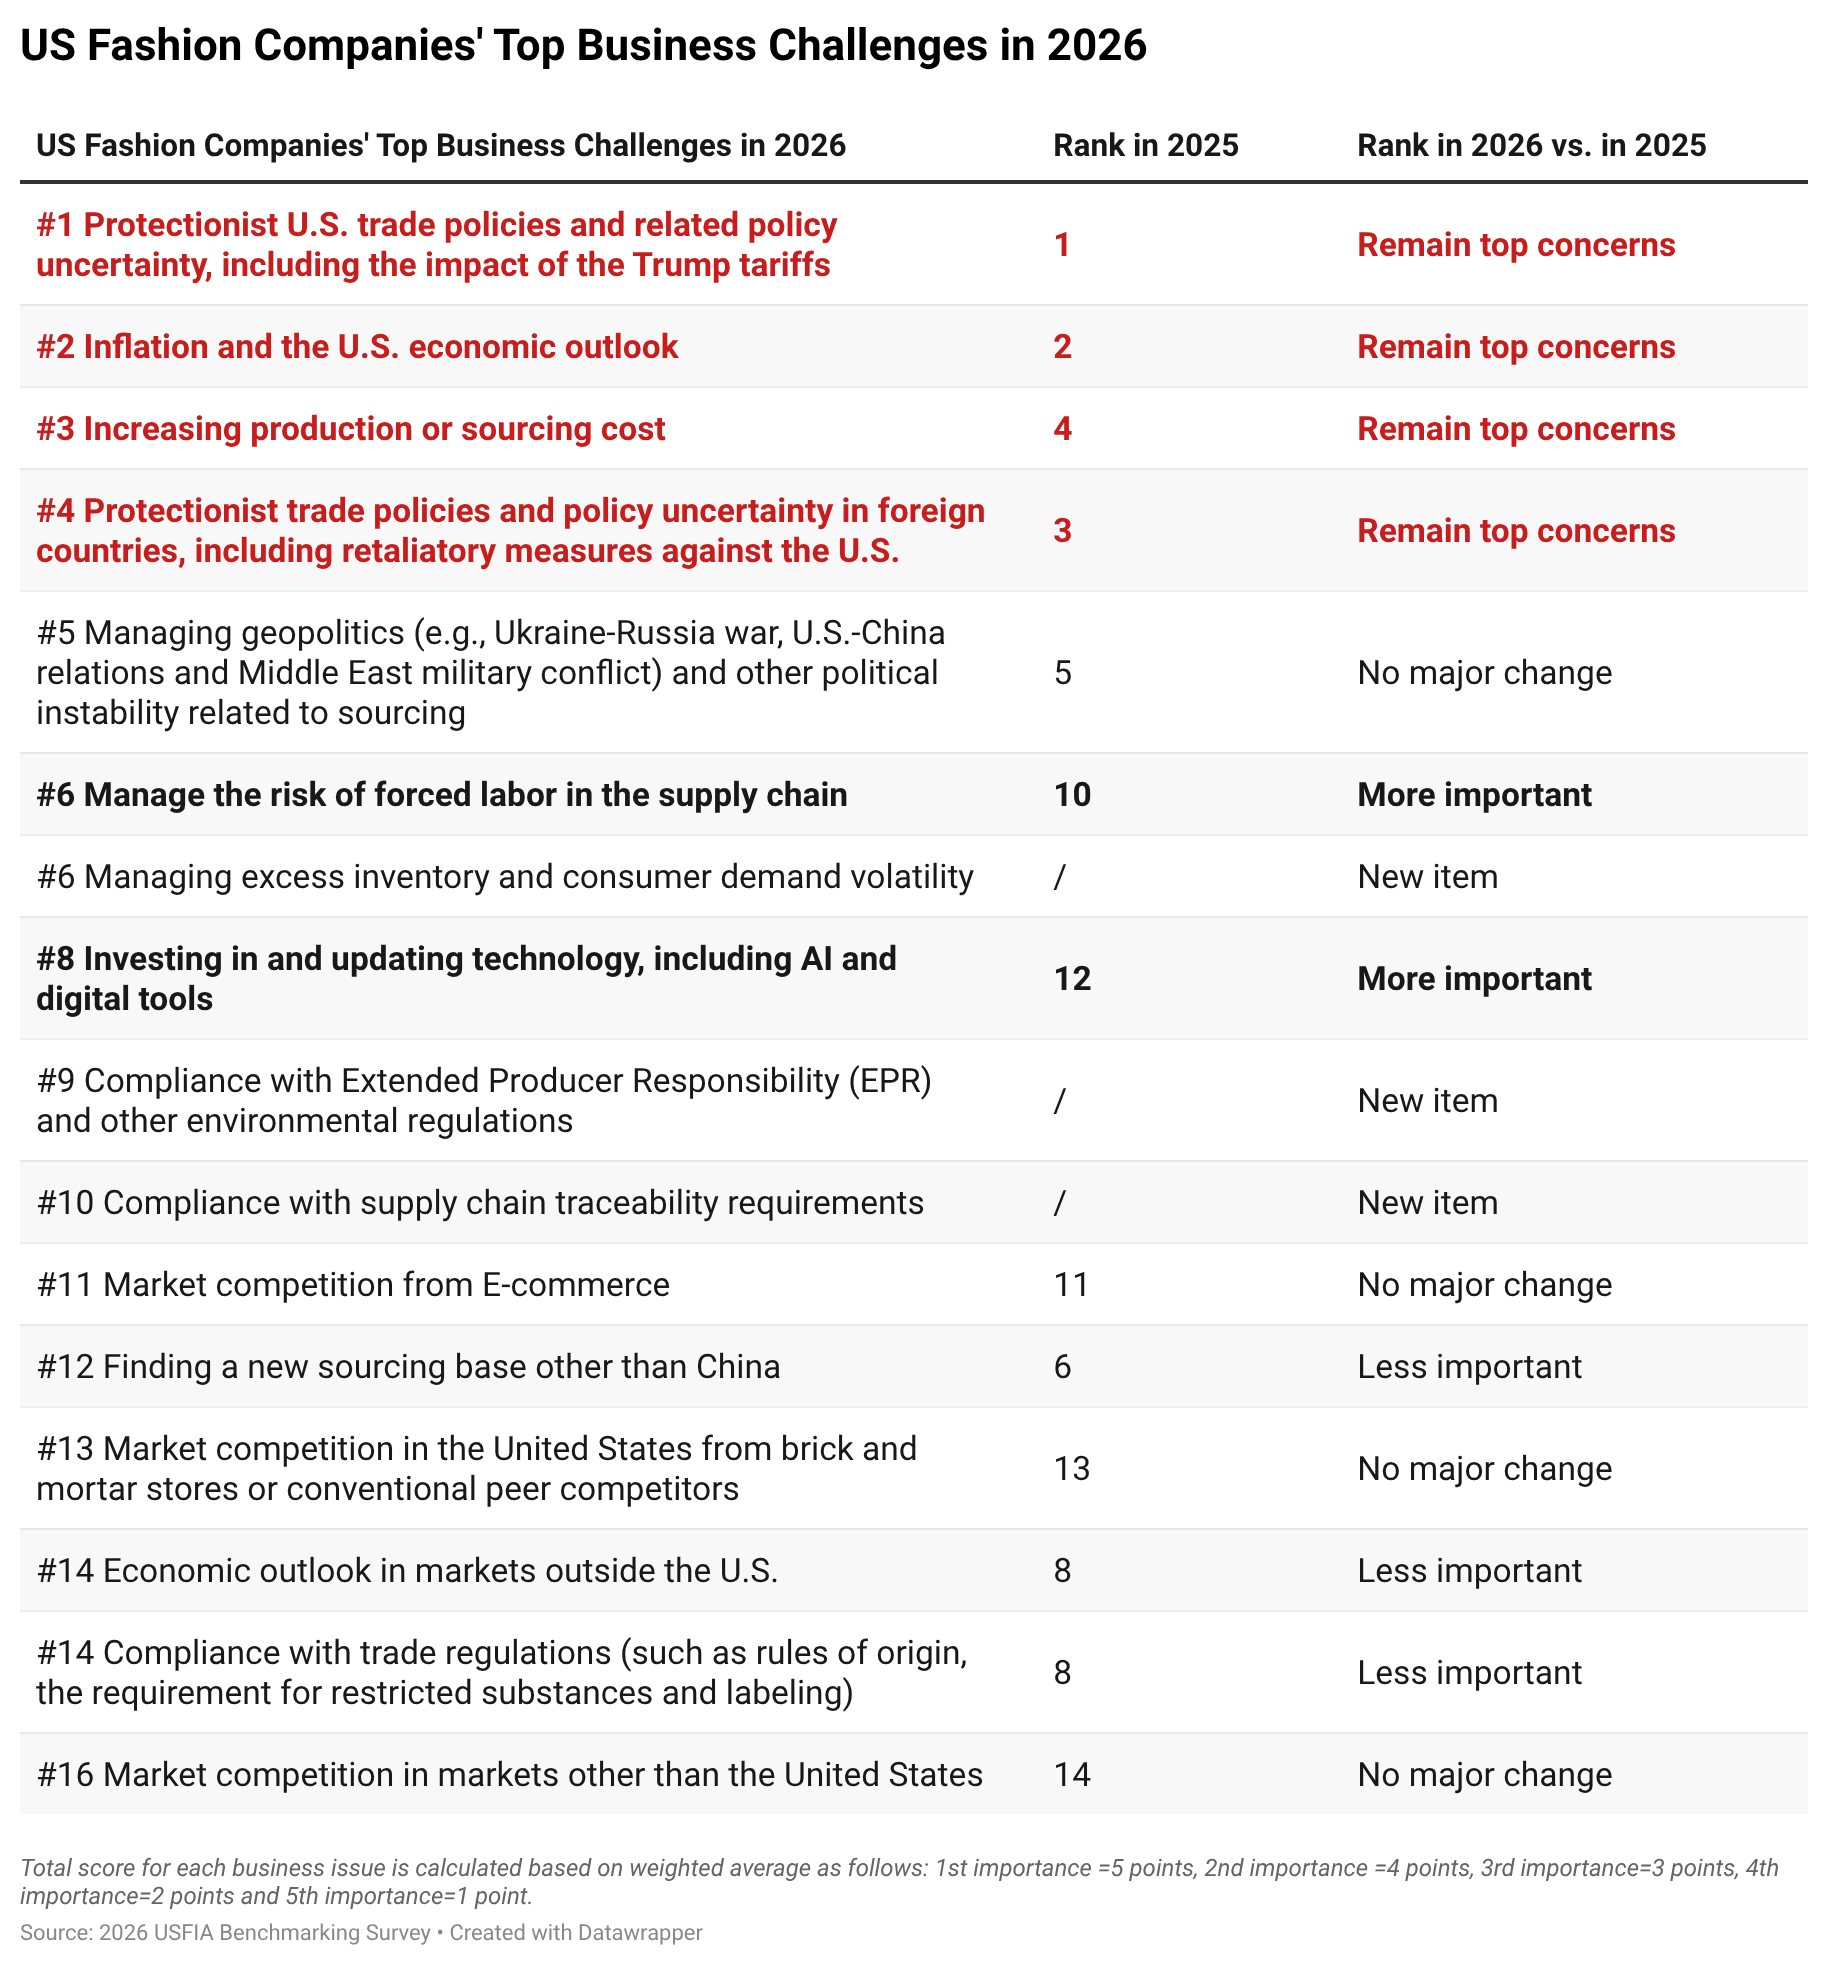
- Consistent with last year’s findings, respondents once again ranked “Protectionist U.S. trade policies and related policy uncertainty, including the impact of tariffs” as their top business challenge in 2026. However, several related concerns intensified this year. “Increasing production or sourcing costs” rose to the third most significant challenge, while “Protectionist trade policies and policy uncertainty in foreign countries” remained among respondents’ top concerns. In addition, managing forced-labor risks emerged as a significantly higher priority, rising from tenth place in 2025 to sixth place in 2026.
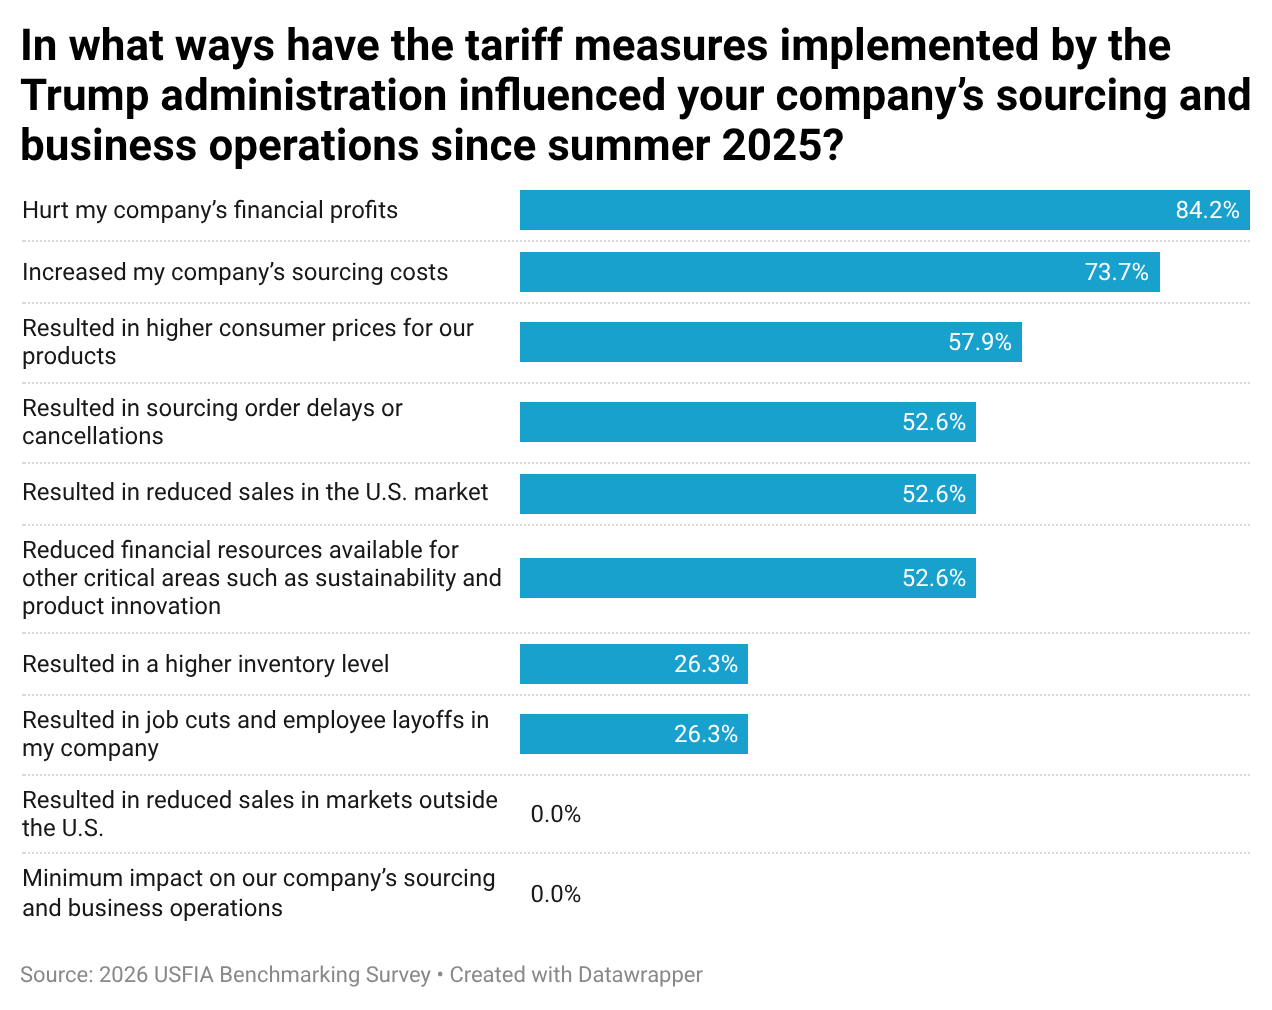
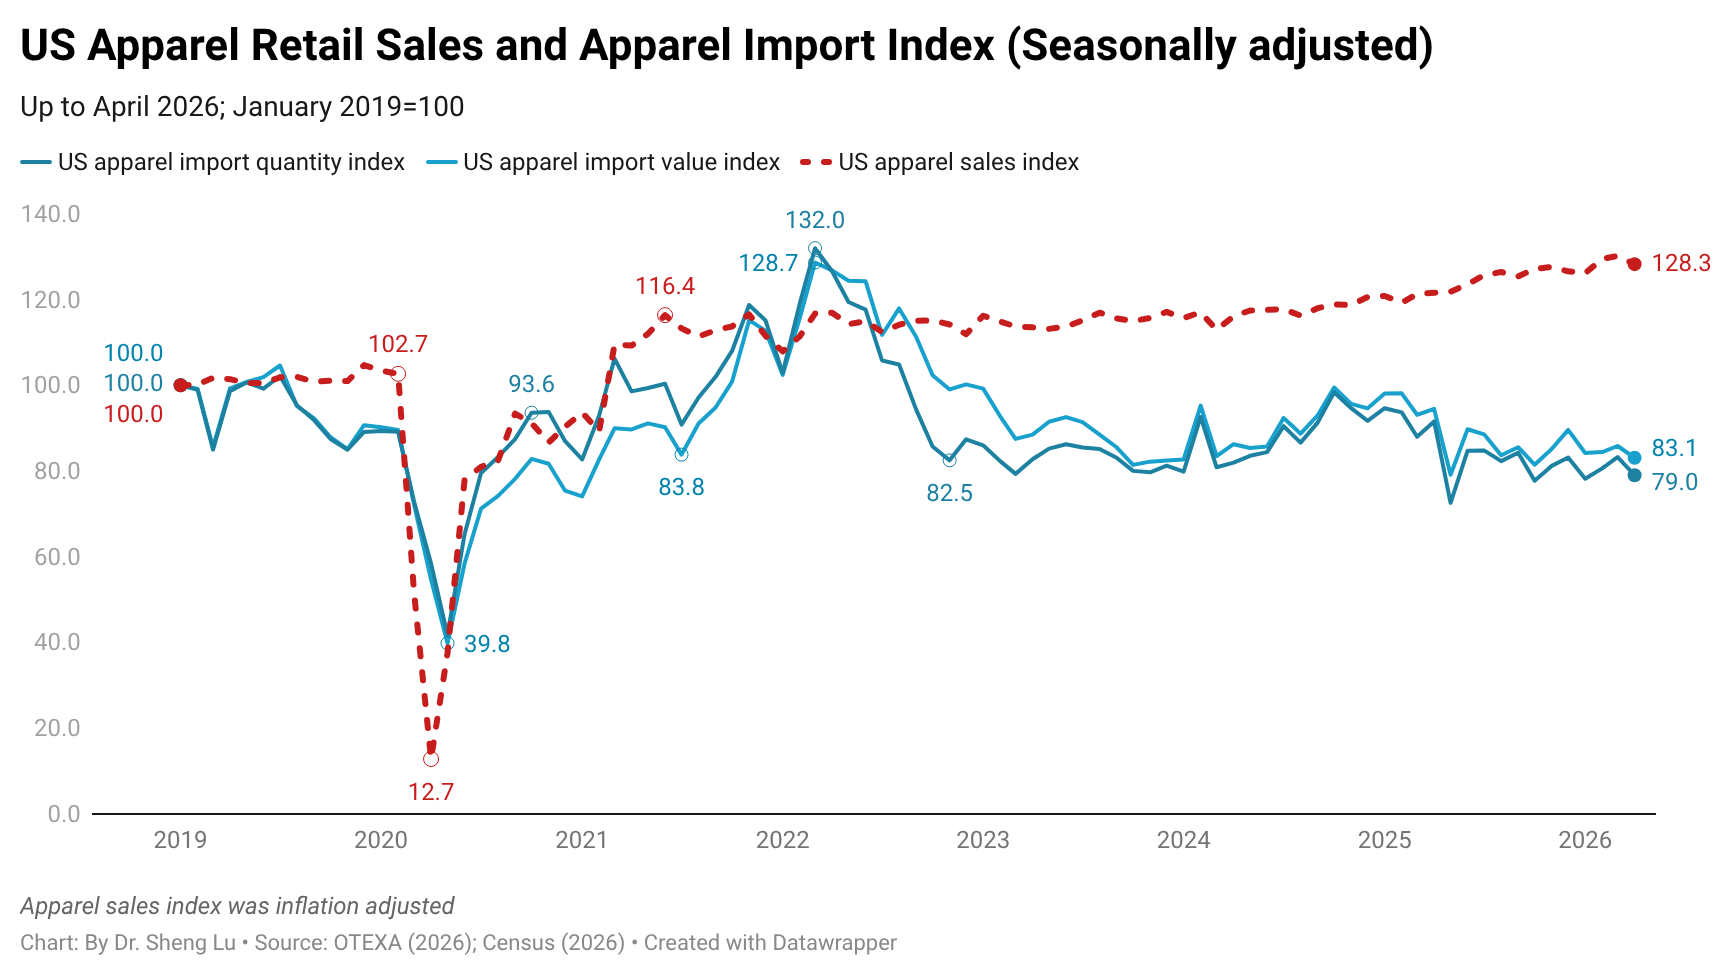
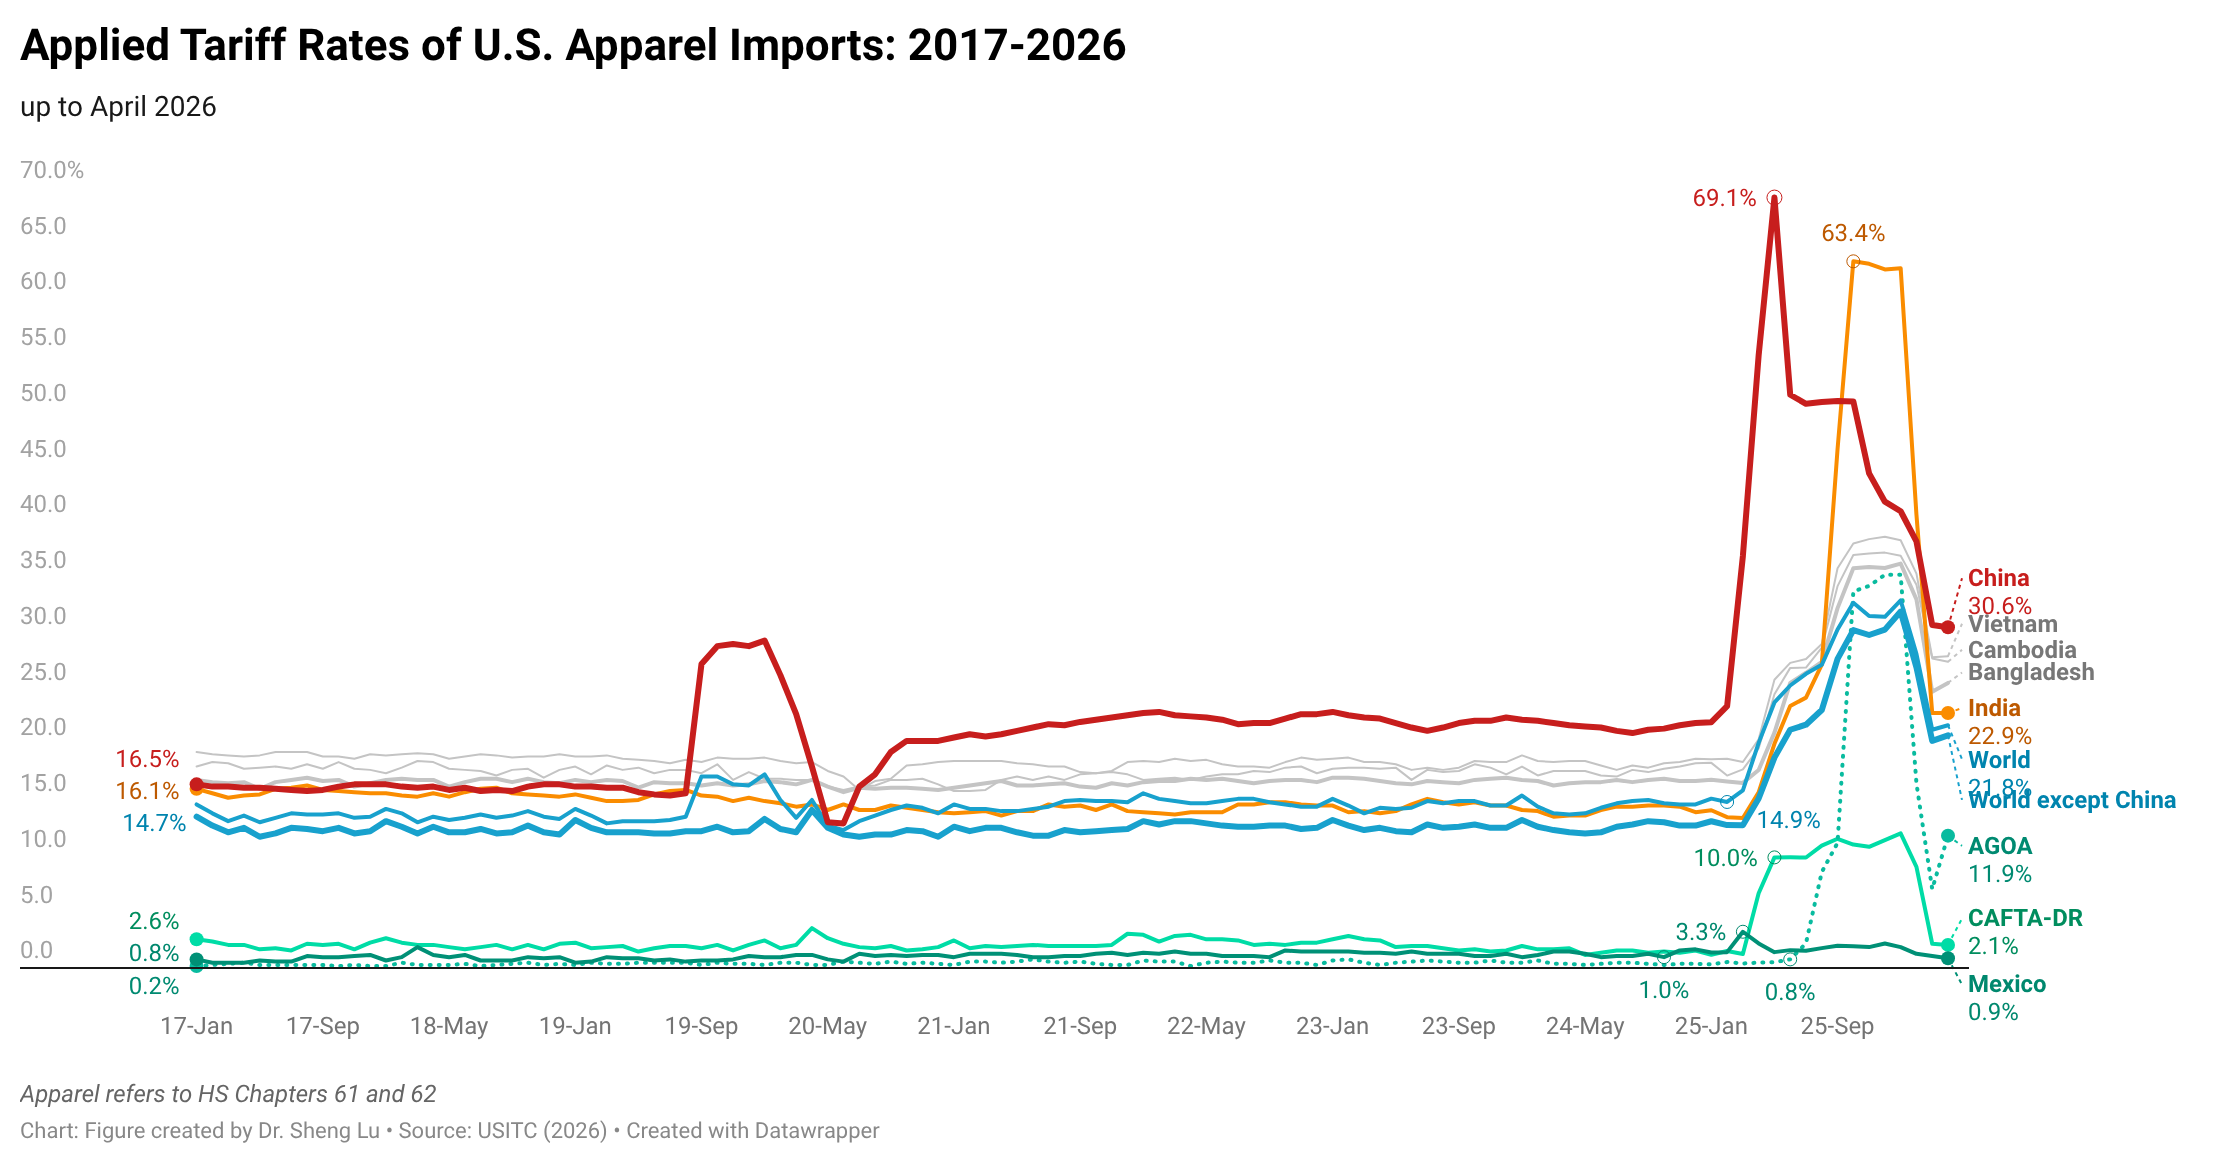
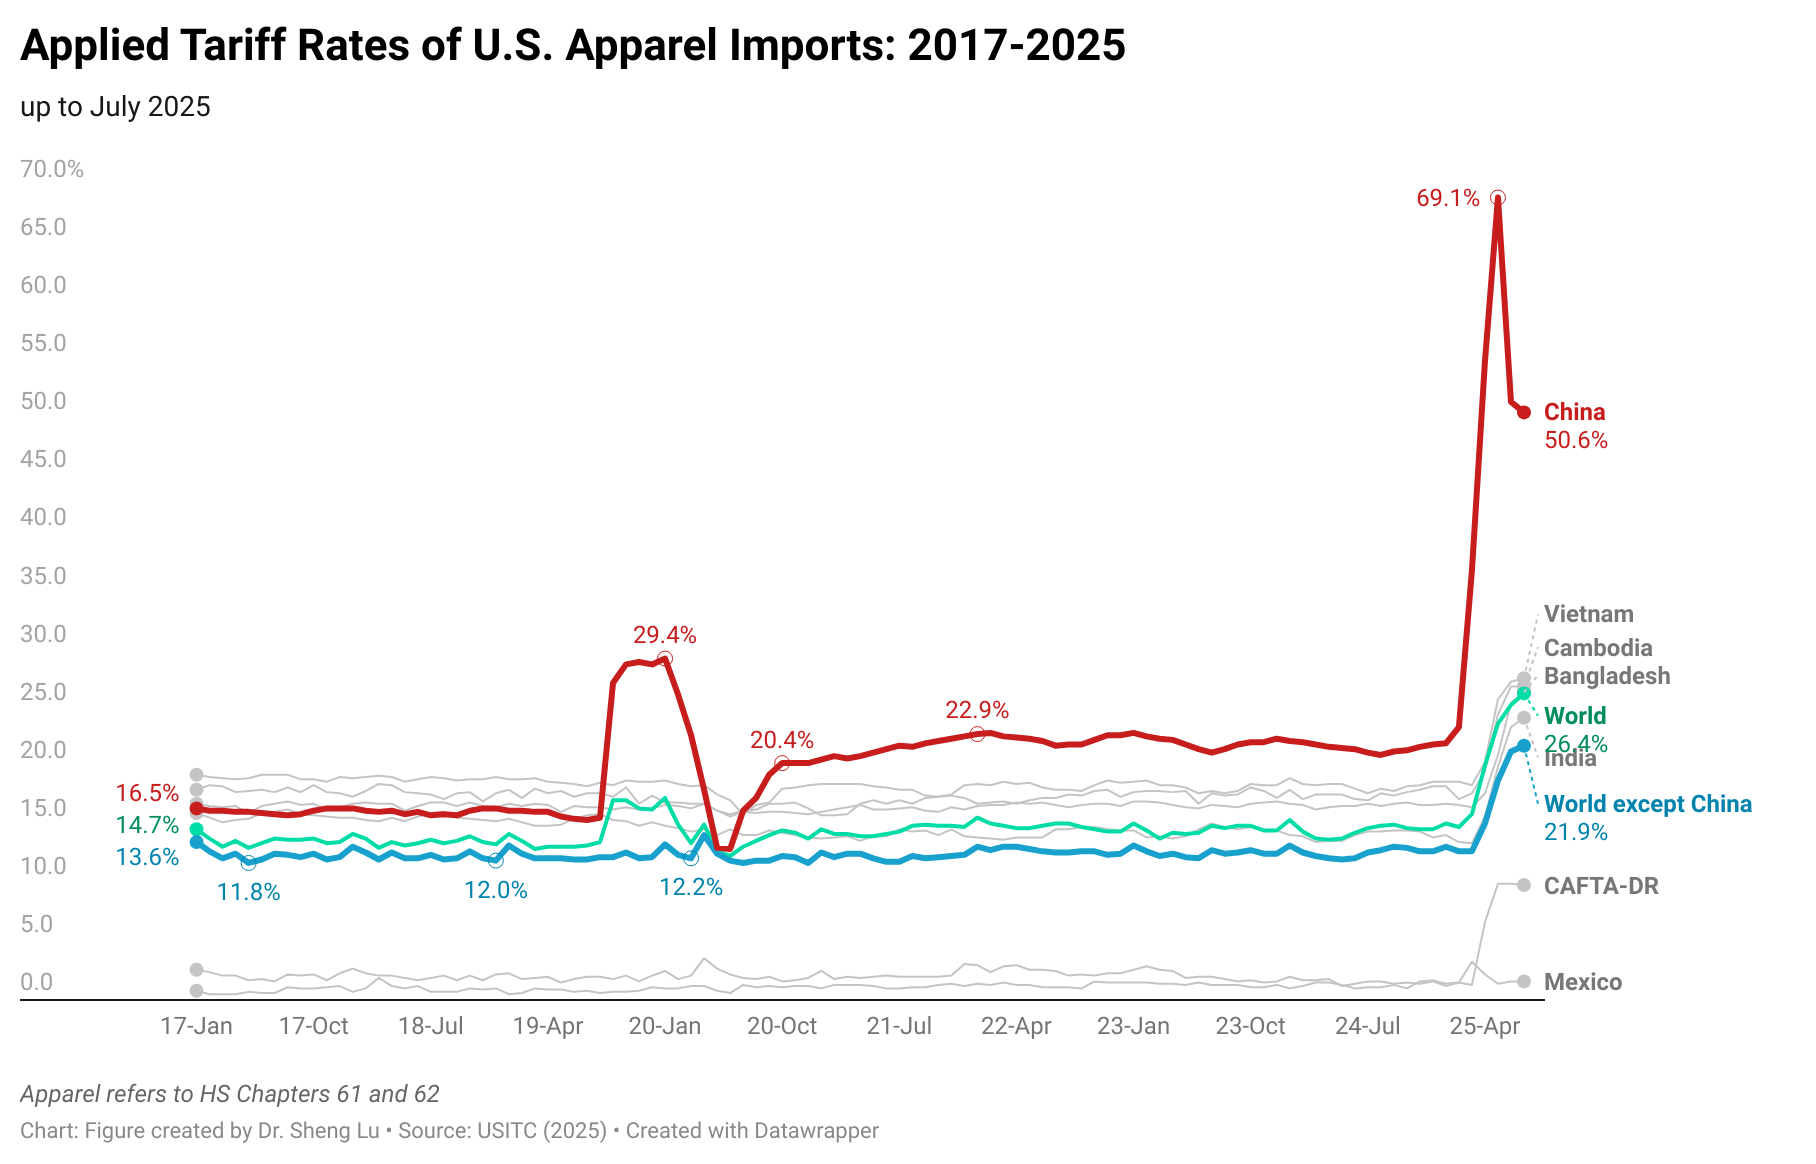
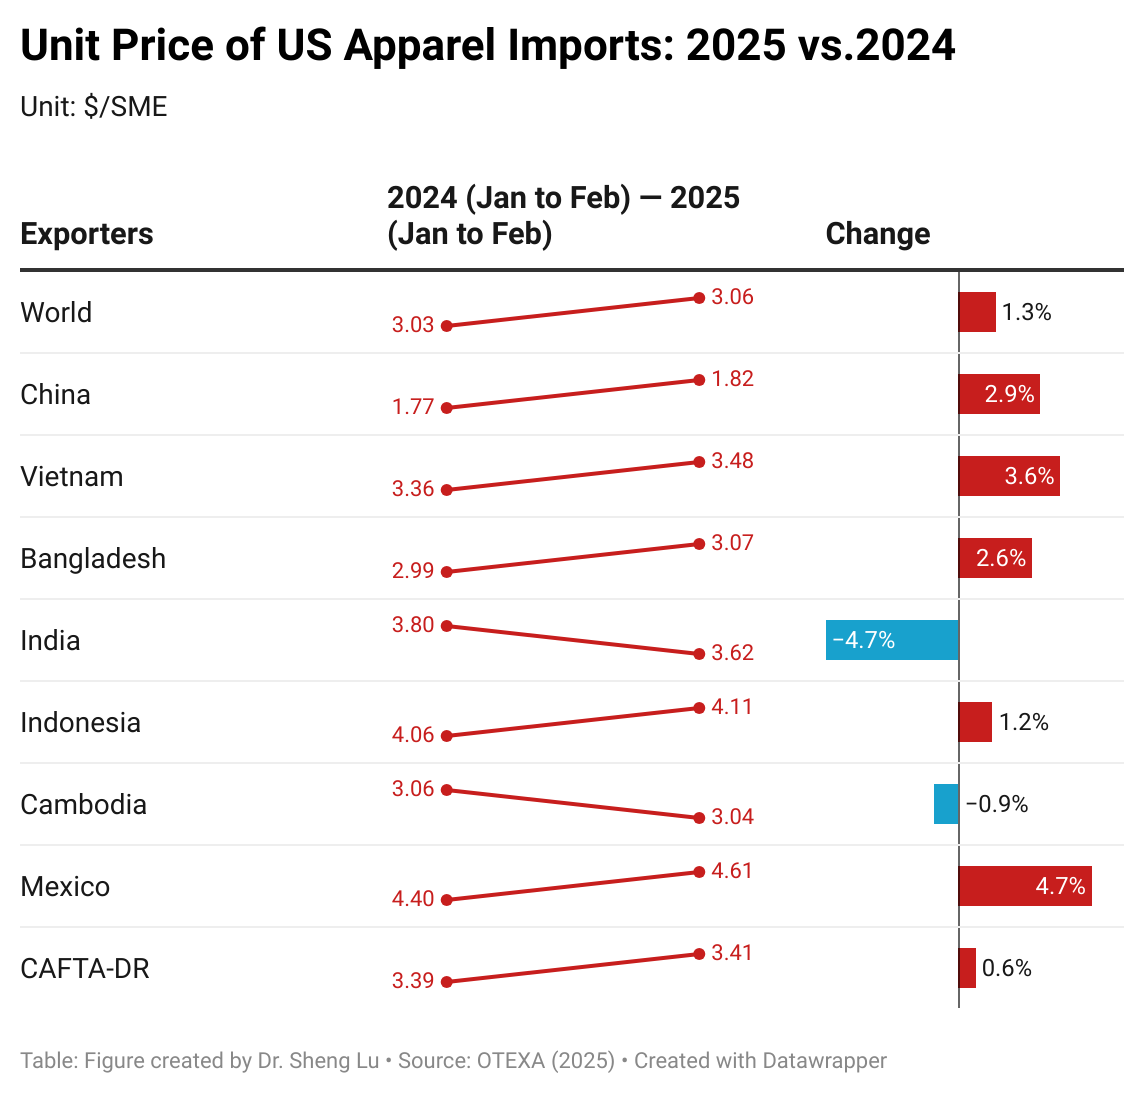
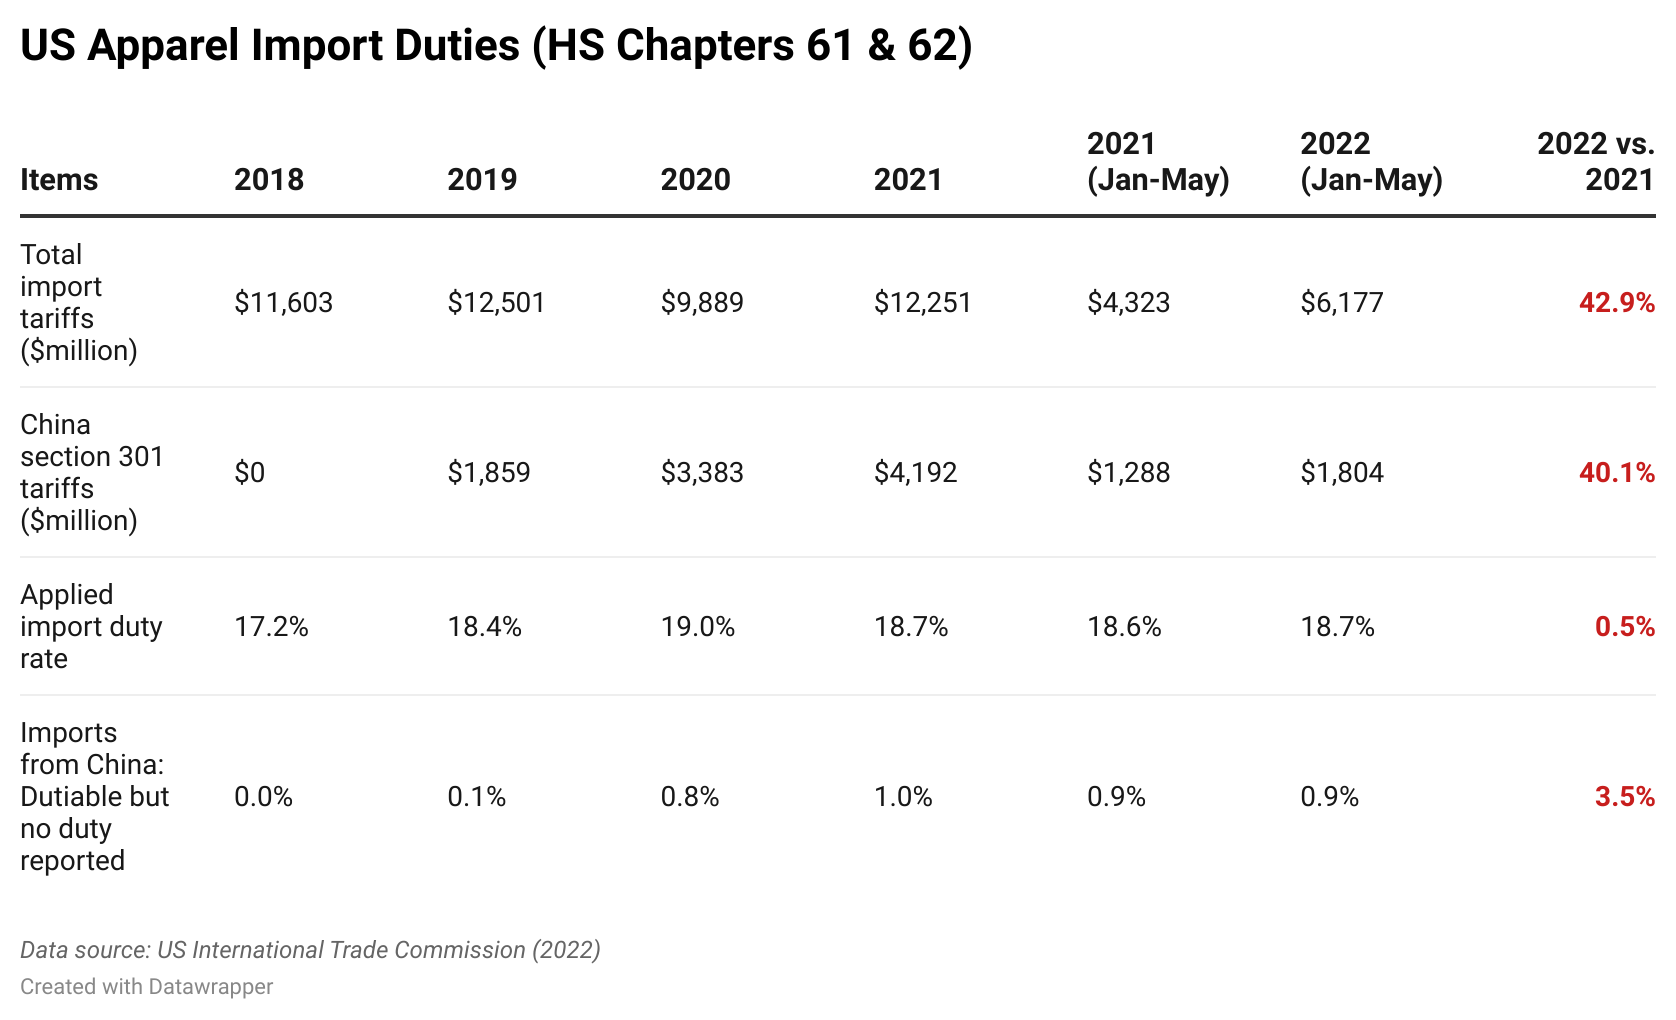
- Despite several changes in U.S. tariff policy during the year, the survey results indicate that tariffs continue to impose broad and evolving impacts on fashion companies’ sourcing and business operations. More respondents reported negative effects on company financial performance, higher sourcing costs, and reduced resources available for sustainability and product innovation compared with one year ago. At the same time, companies adopted a broader range of mitigation strategies, including applying for tariff refunds, utilizing first-sale valuation, renegotiating supplier contracts, and diversifying sourcing.
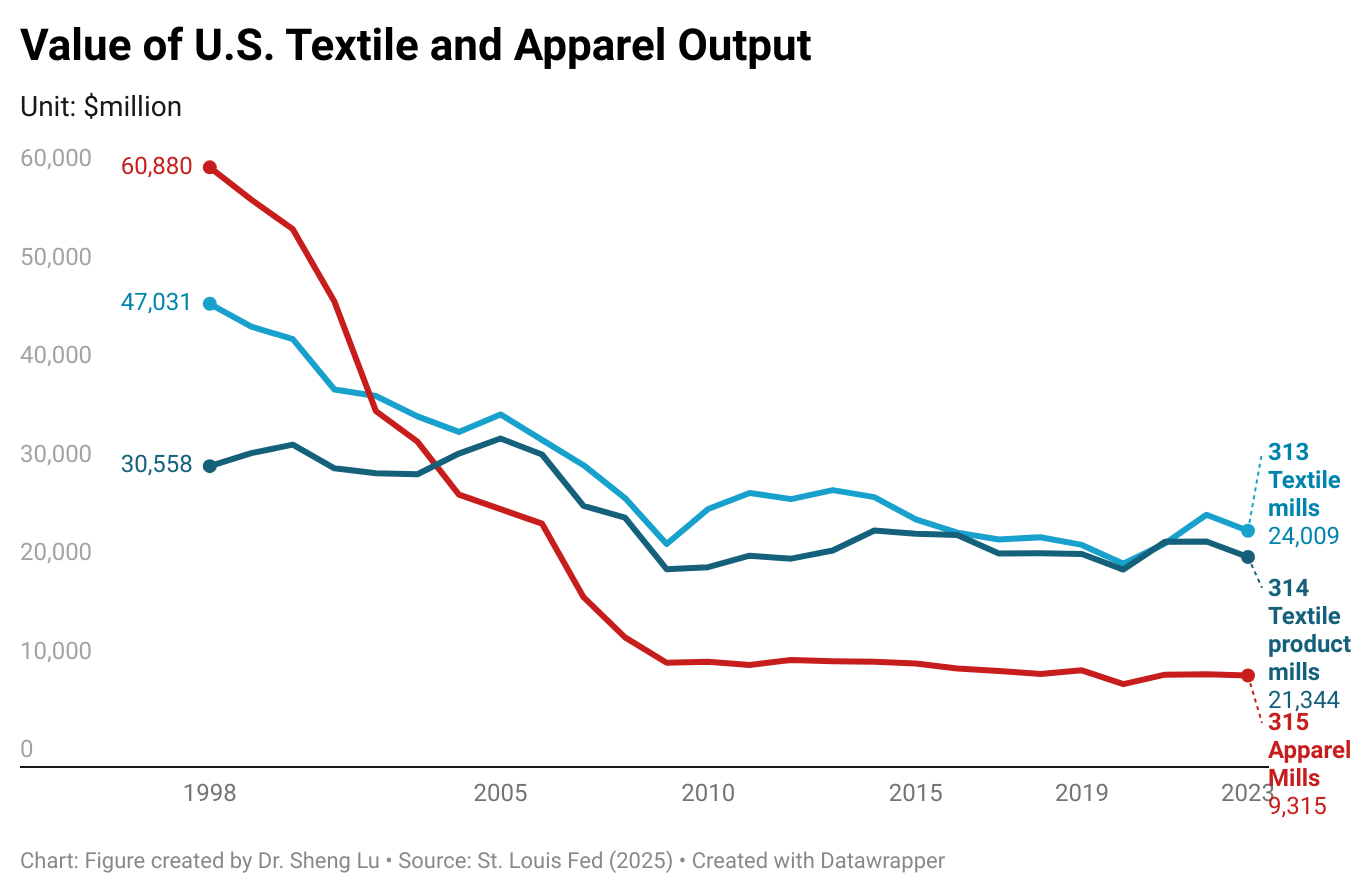
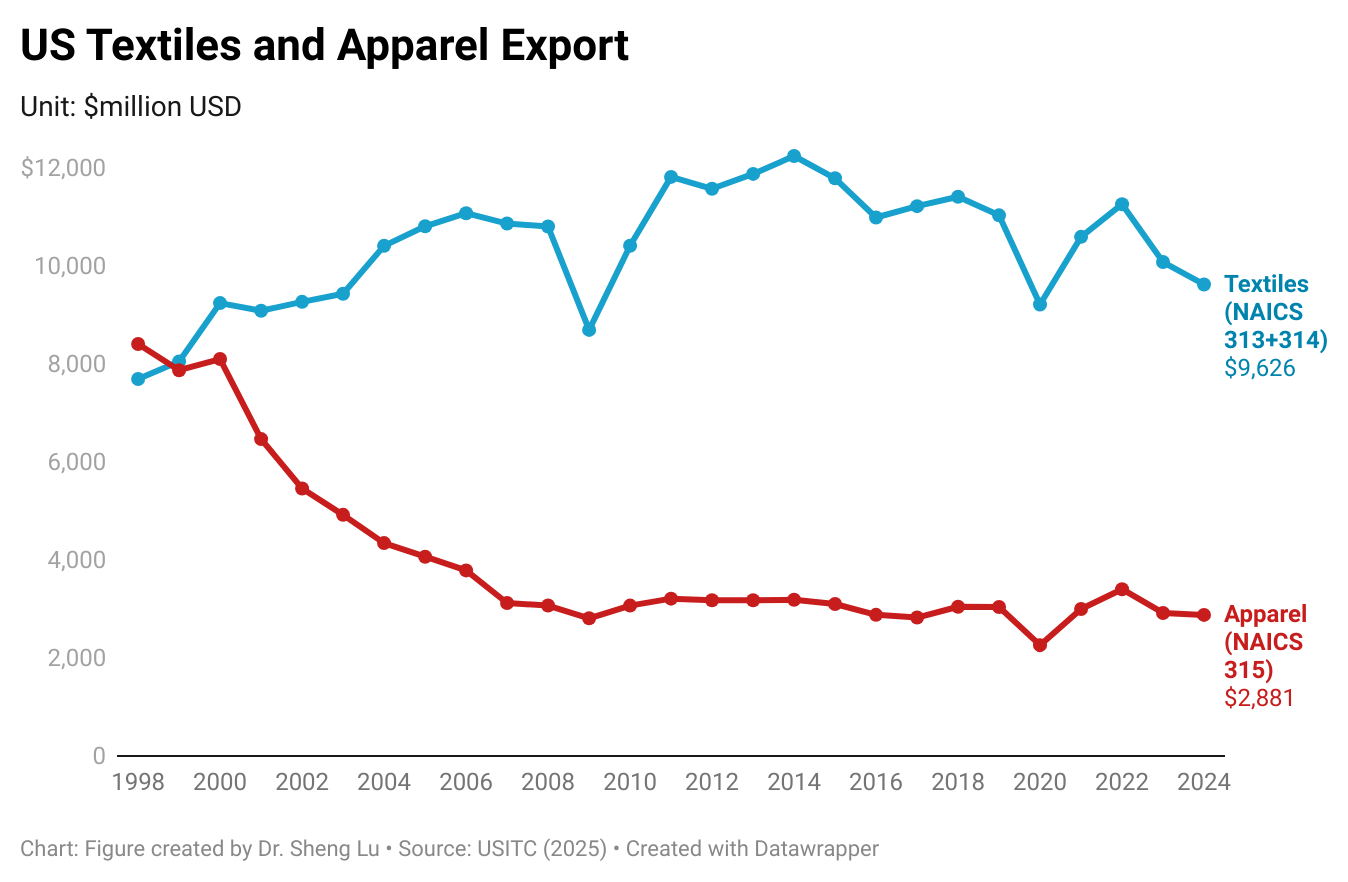
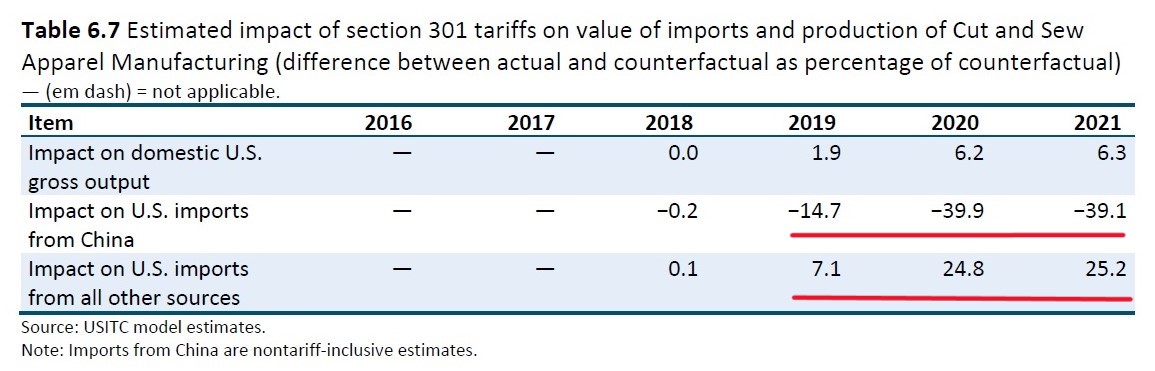
- The survey finds little evidence that higher tariffs have encouraged large-scale reshoring of apparel production to the United States. Only about 10 percent of respondents identified sourcing more “Made in the USA” products as a strategy to respond to tariff increases. Meanwhile, respondents were concerned that apparel sourcing under most U.S. free trade agreements and preference programs also became subject to additional tariff measures.
While most respondents remain optimistic about the five-year outlook for the U.S. fashion industry, a growing share have adopted a more cautious outlook amid persistent economic and policy uncertainty.
- While respondents generally expect apparel sourcing volume and value to increase in 2026, most anticipate only modest growth of lower than 5 percent.
- The optimism about the industry’s long-term outlook continued to somewhat soften. About 62 percent of respondents expressed optimism regarding the next five years, the lowest level recorded since the benchmarking study began tracking this measure.
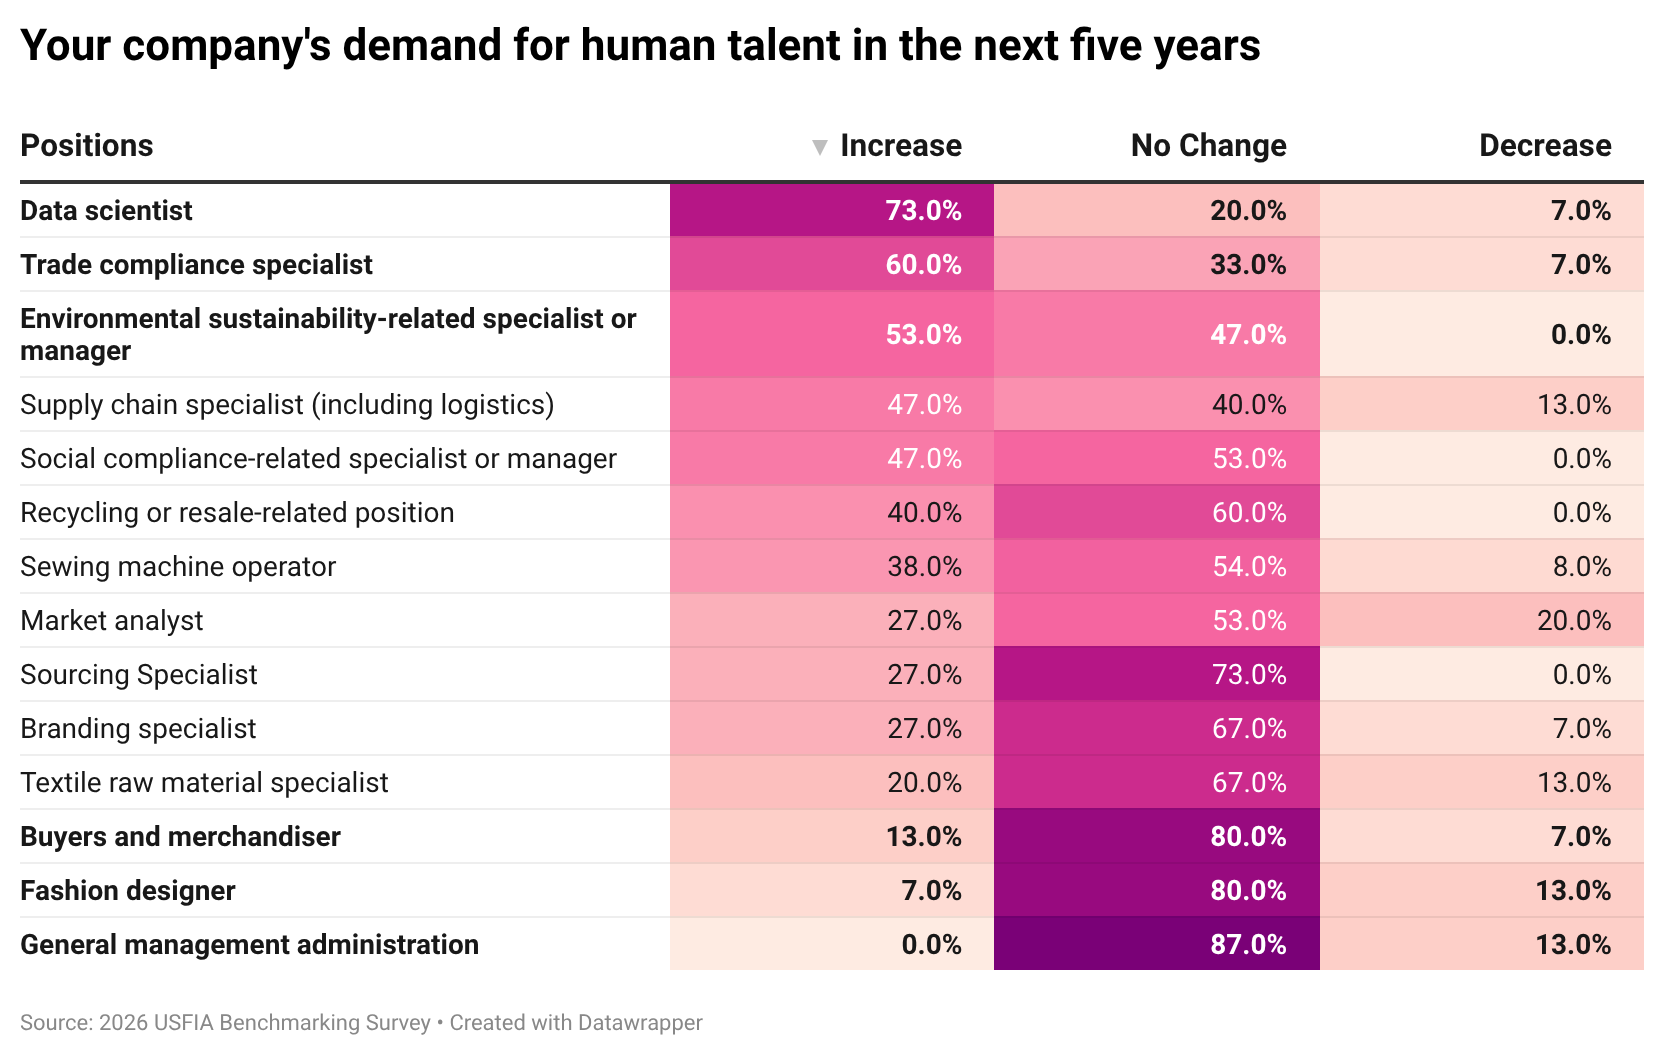
- The job market was a bright spot. About 87 percent plan to increase hiring over the next five years, up from 75 percent in the 2025 survey and matching the highest level recorded since the pandemic. Demand is expected to be strongest for data scientists, trade compliance specialists, and environmental sustainability specialists, reflecting the growing importance of AI and data analytics, trade compliance, sustainability management, and supply chain transparency across the fashion industry. [Click here for job demand]
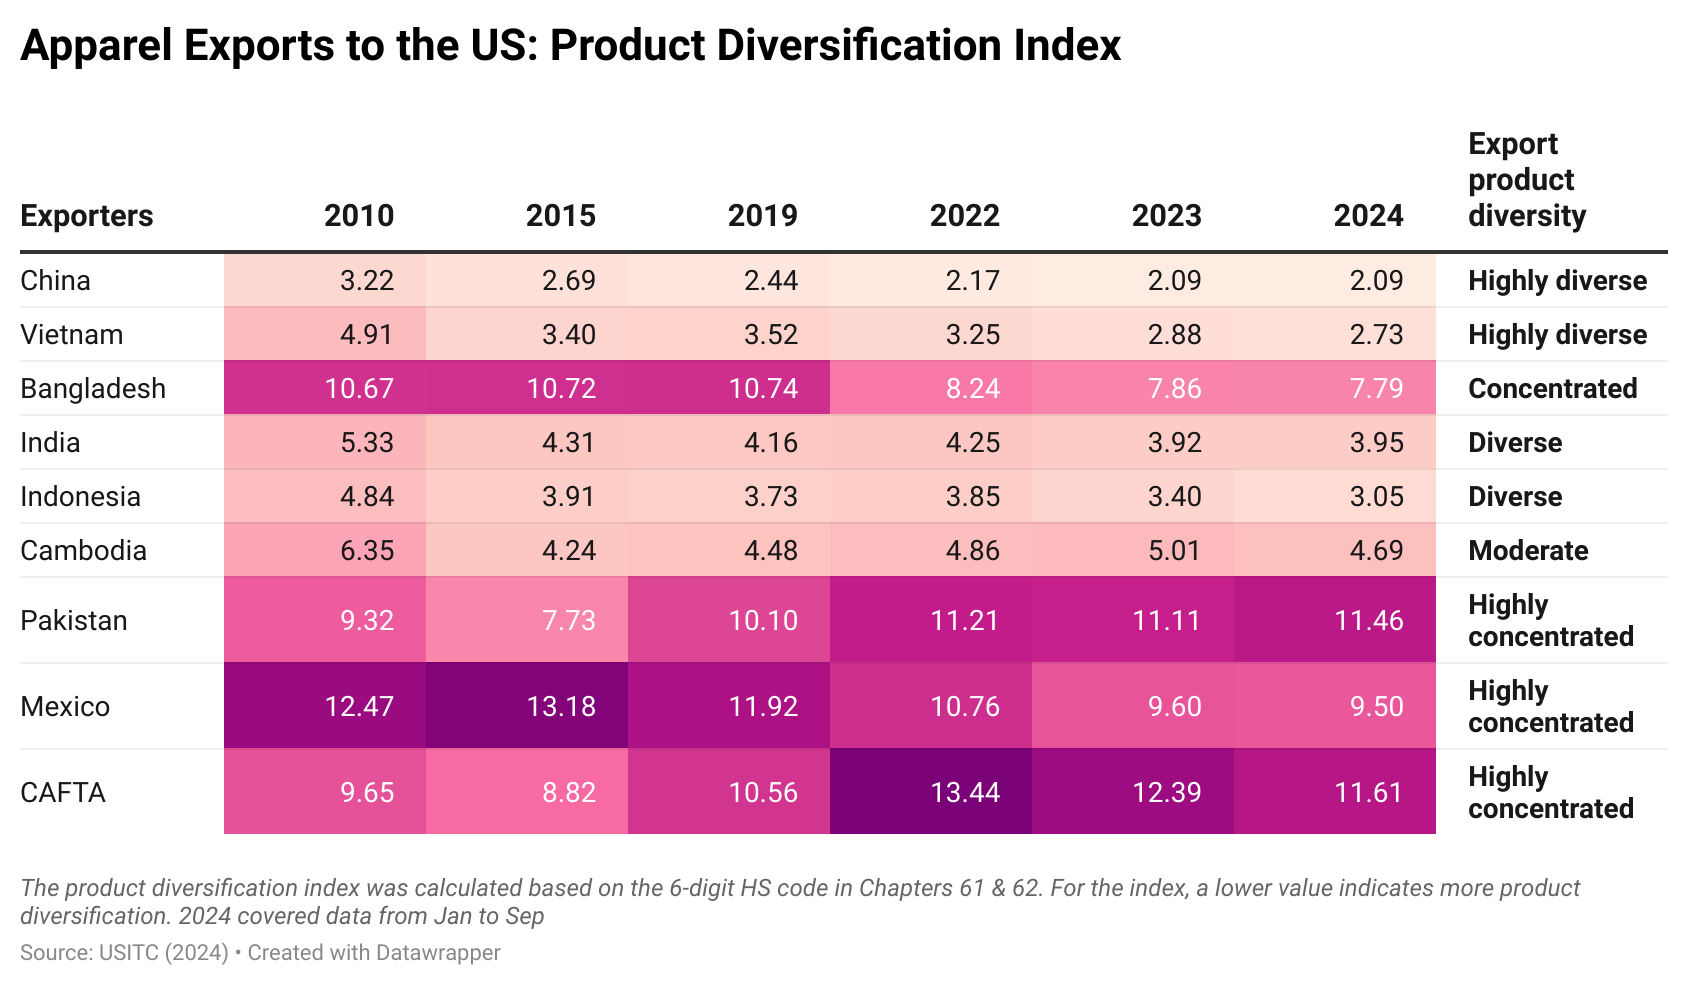
The way U.S. fashion companies adjust their sourcing is no longer simply about “Let’s replace country A with country B or C.” Instead, companies intentionally maintain a diverse sourcing base and prioritize capacity, flexibility, inventory agility, and regional balancing in their sourcing strategy
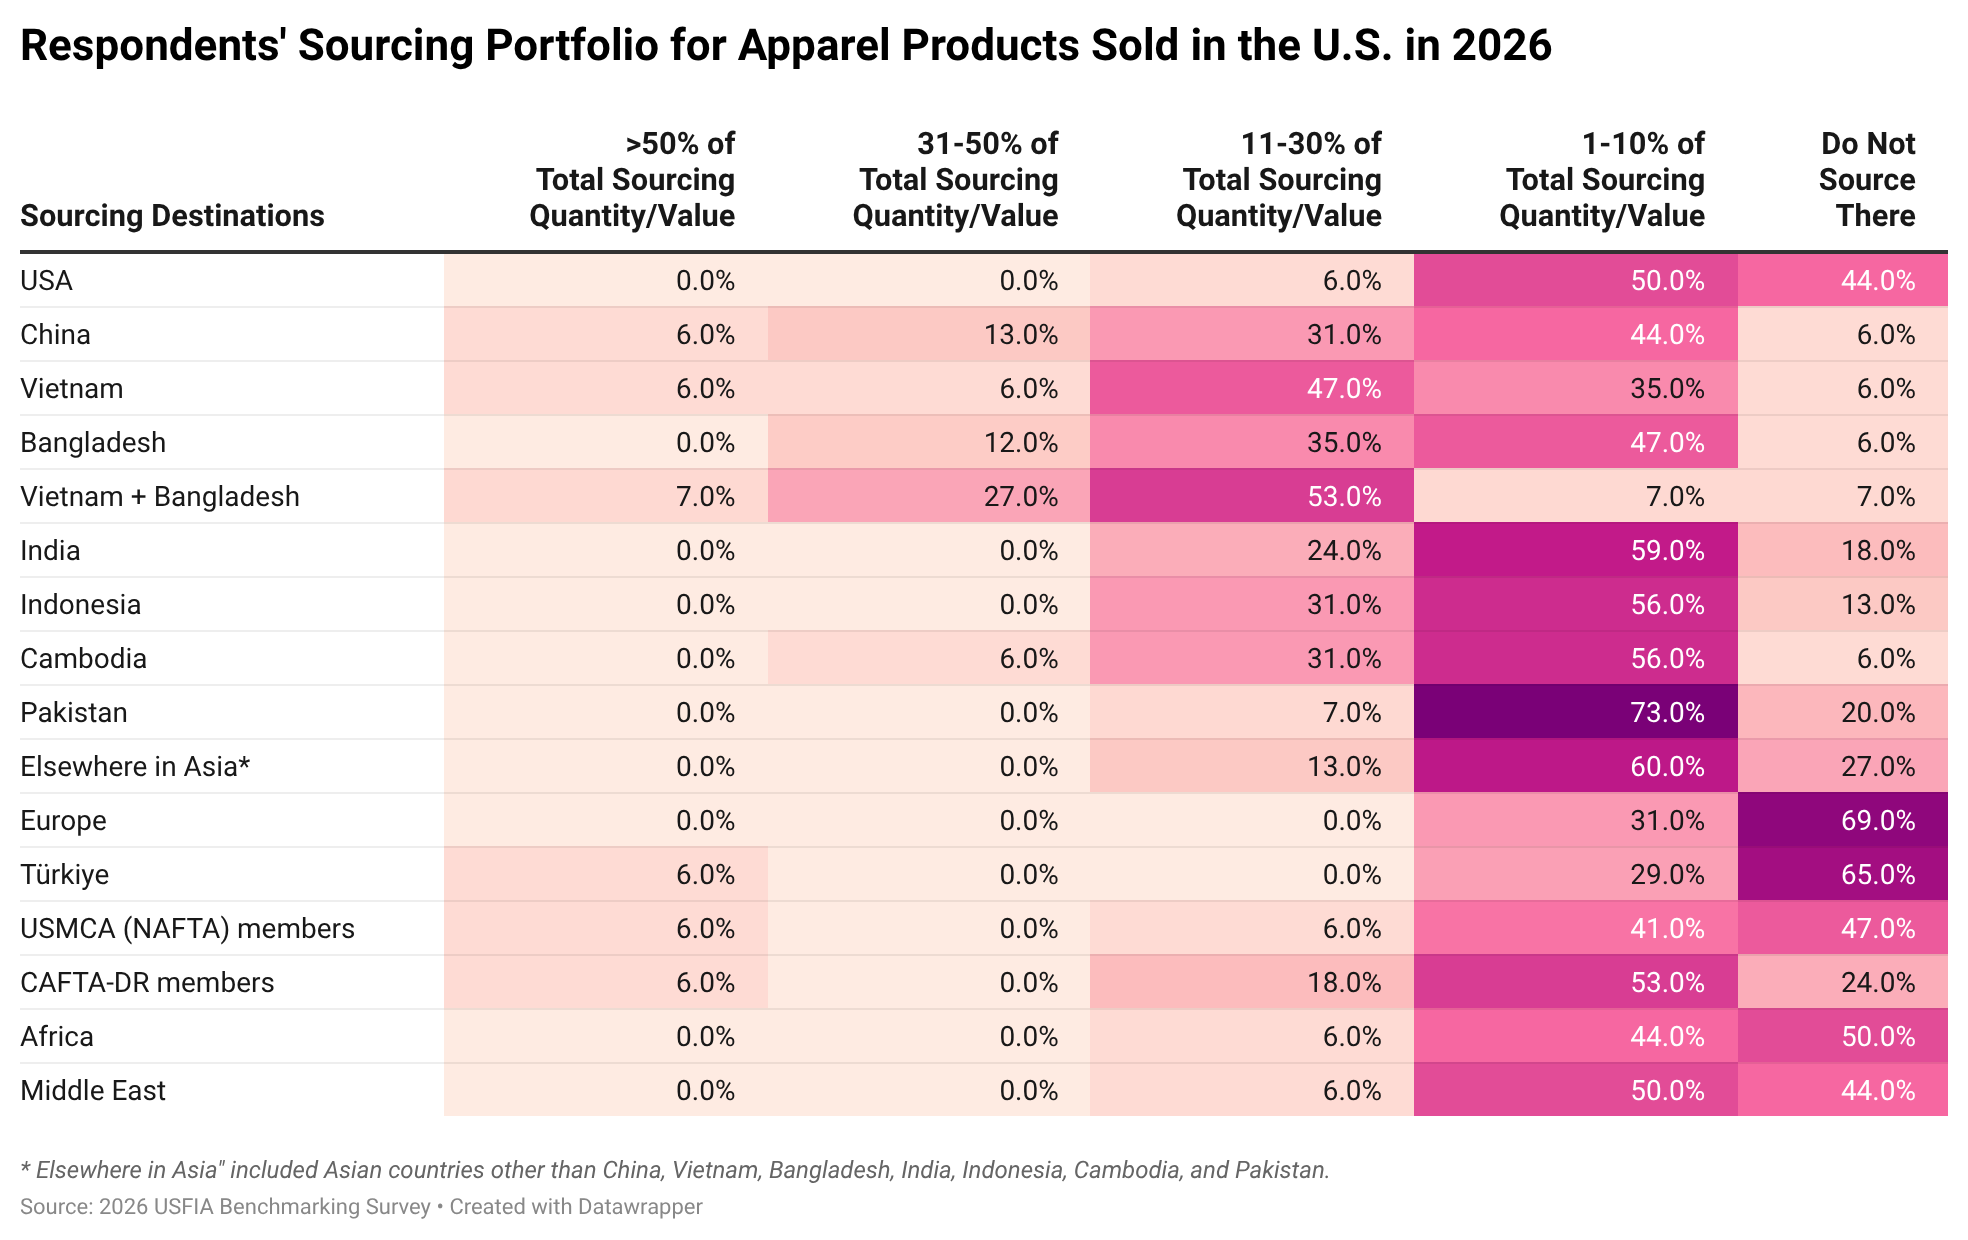
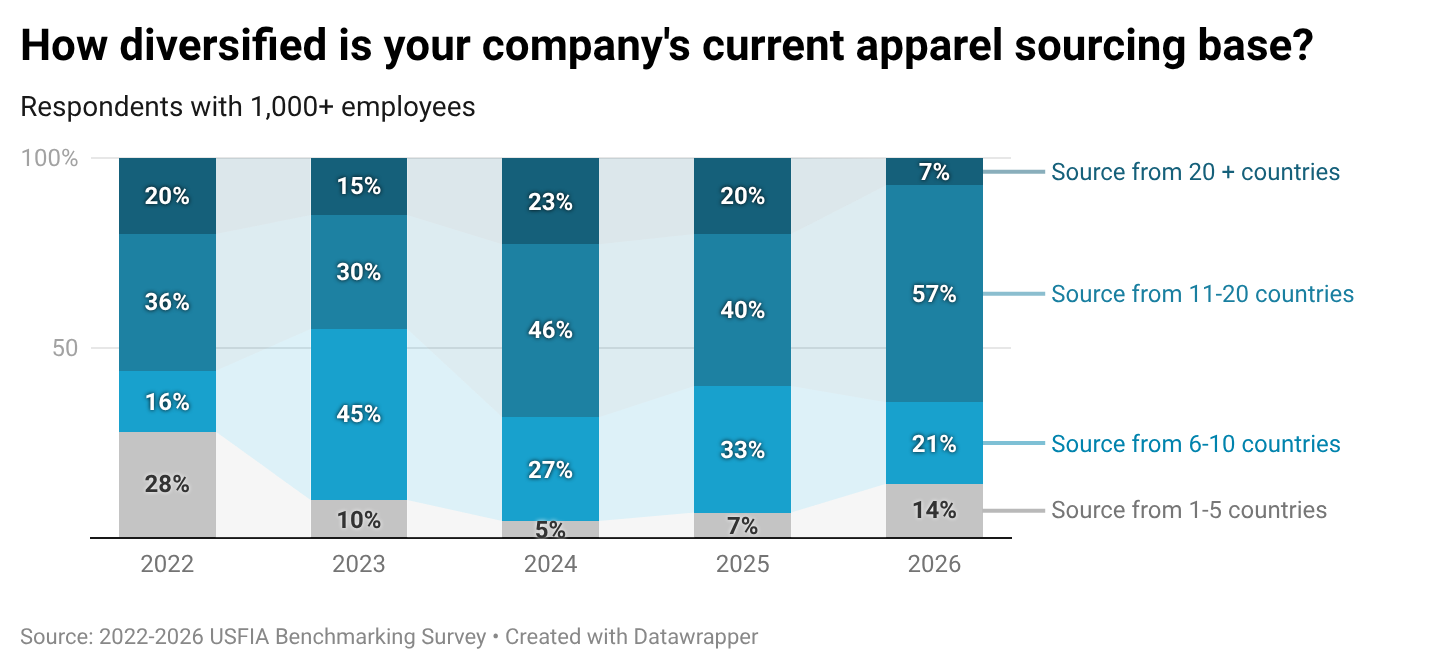
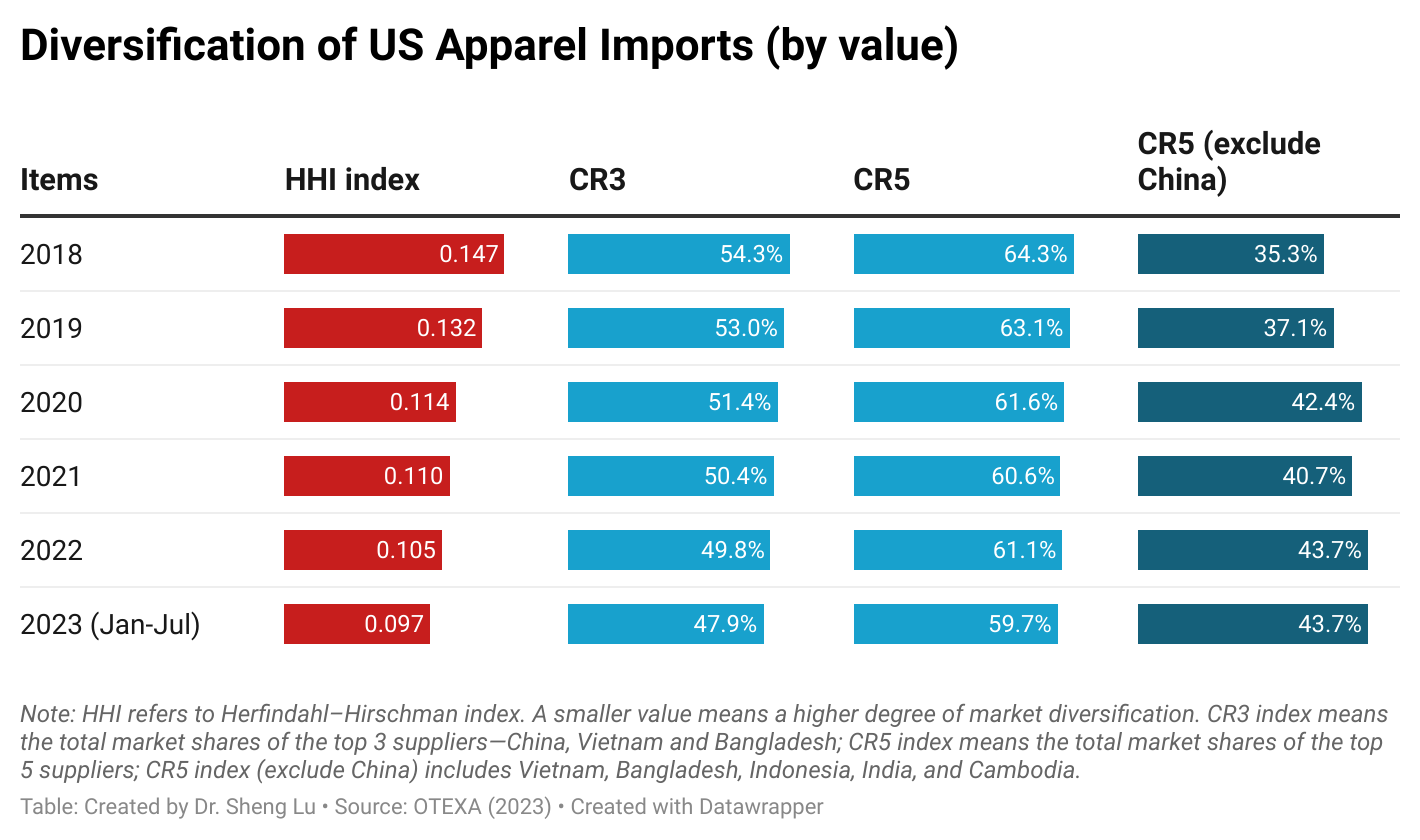
- Respondents reported sourcing apparel from 49 countries in 2026, up from 46 countries in 2025. Large companies continued to maintain particularly diversified sourcing portfolios, with approximately 65 percent sourcing from ten or more countries. [Click for detailed apparel sourcing portfolio in 2026]
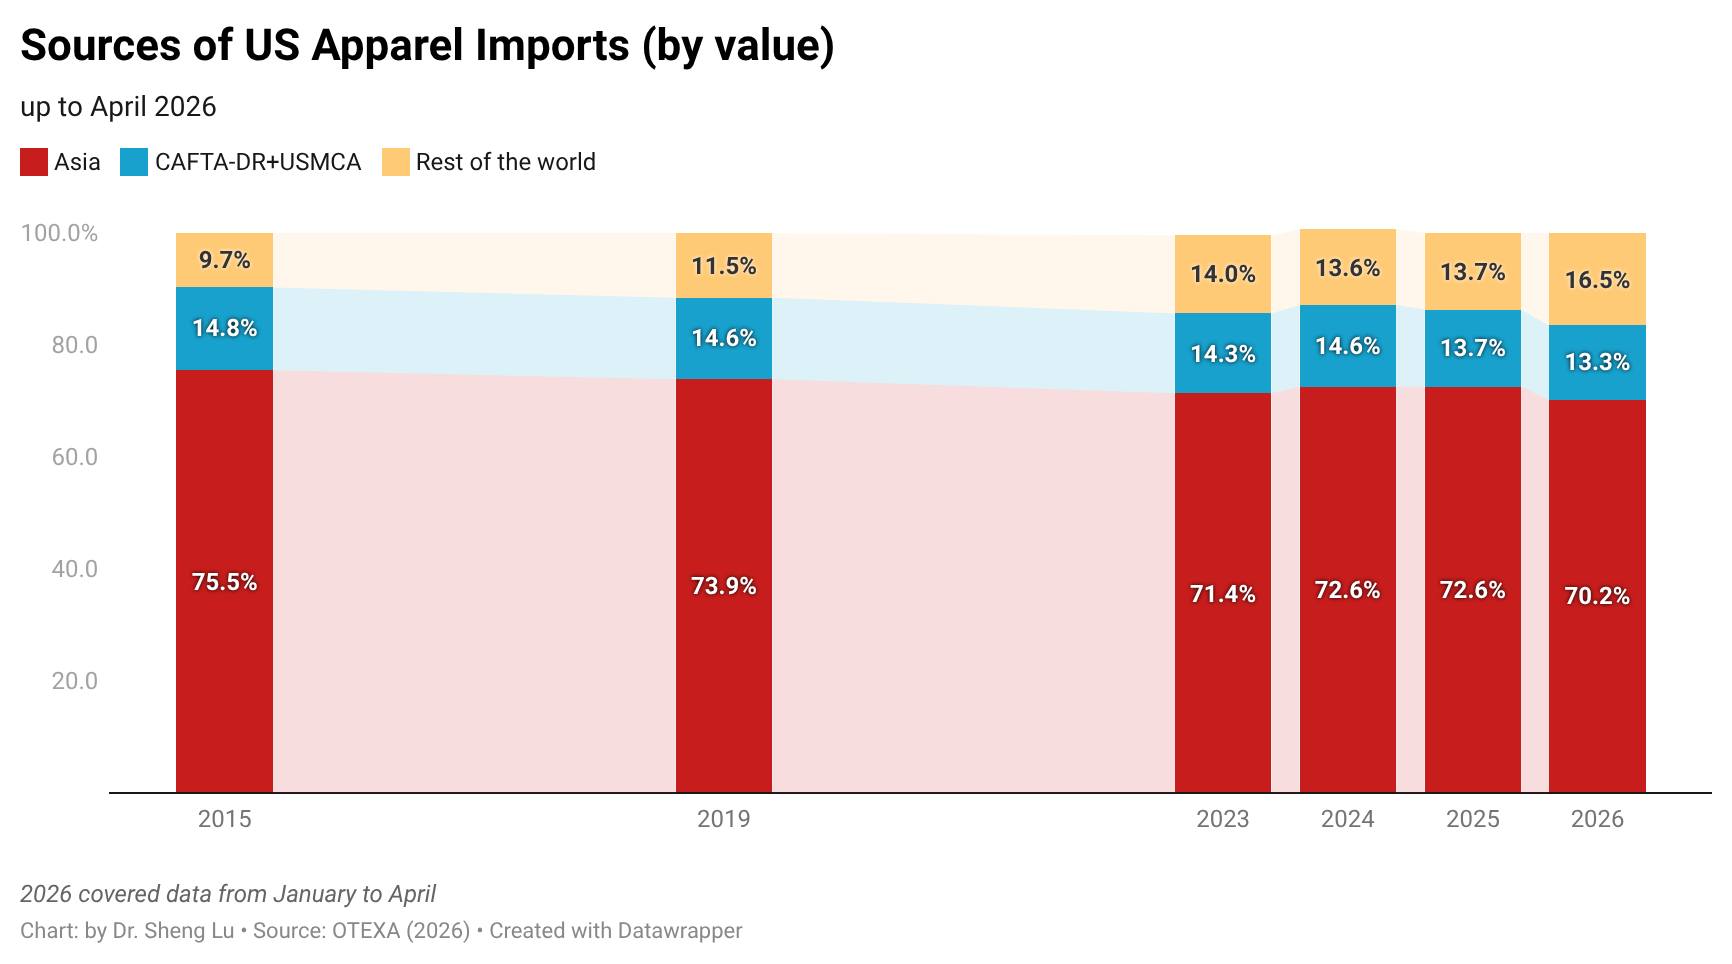
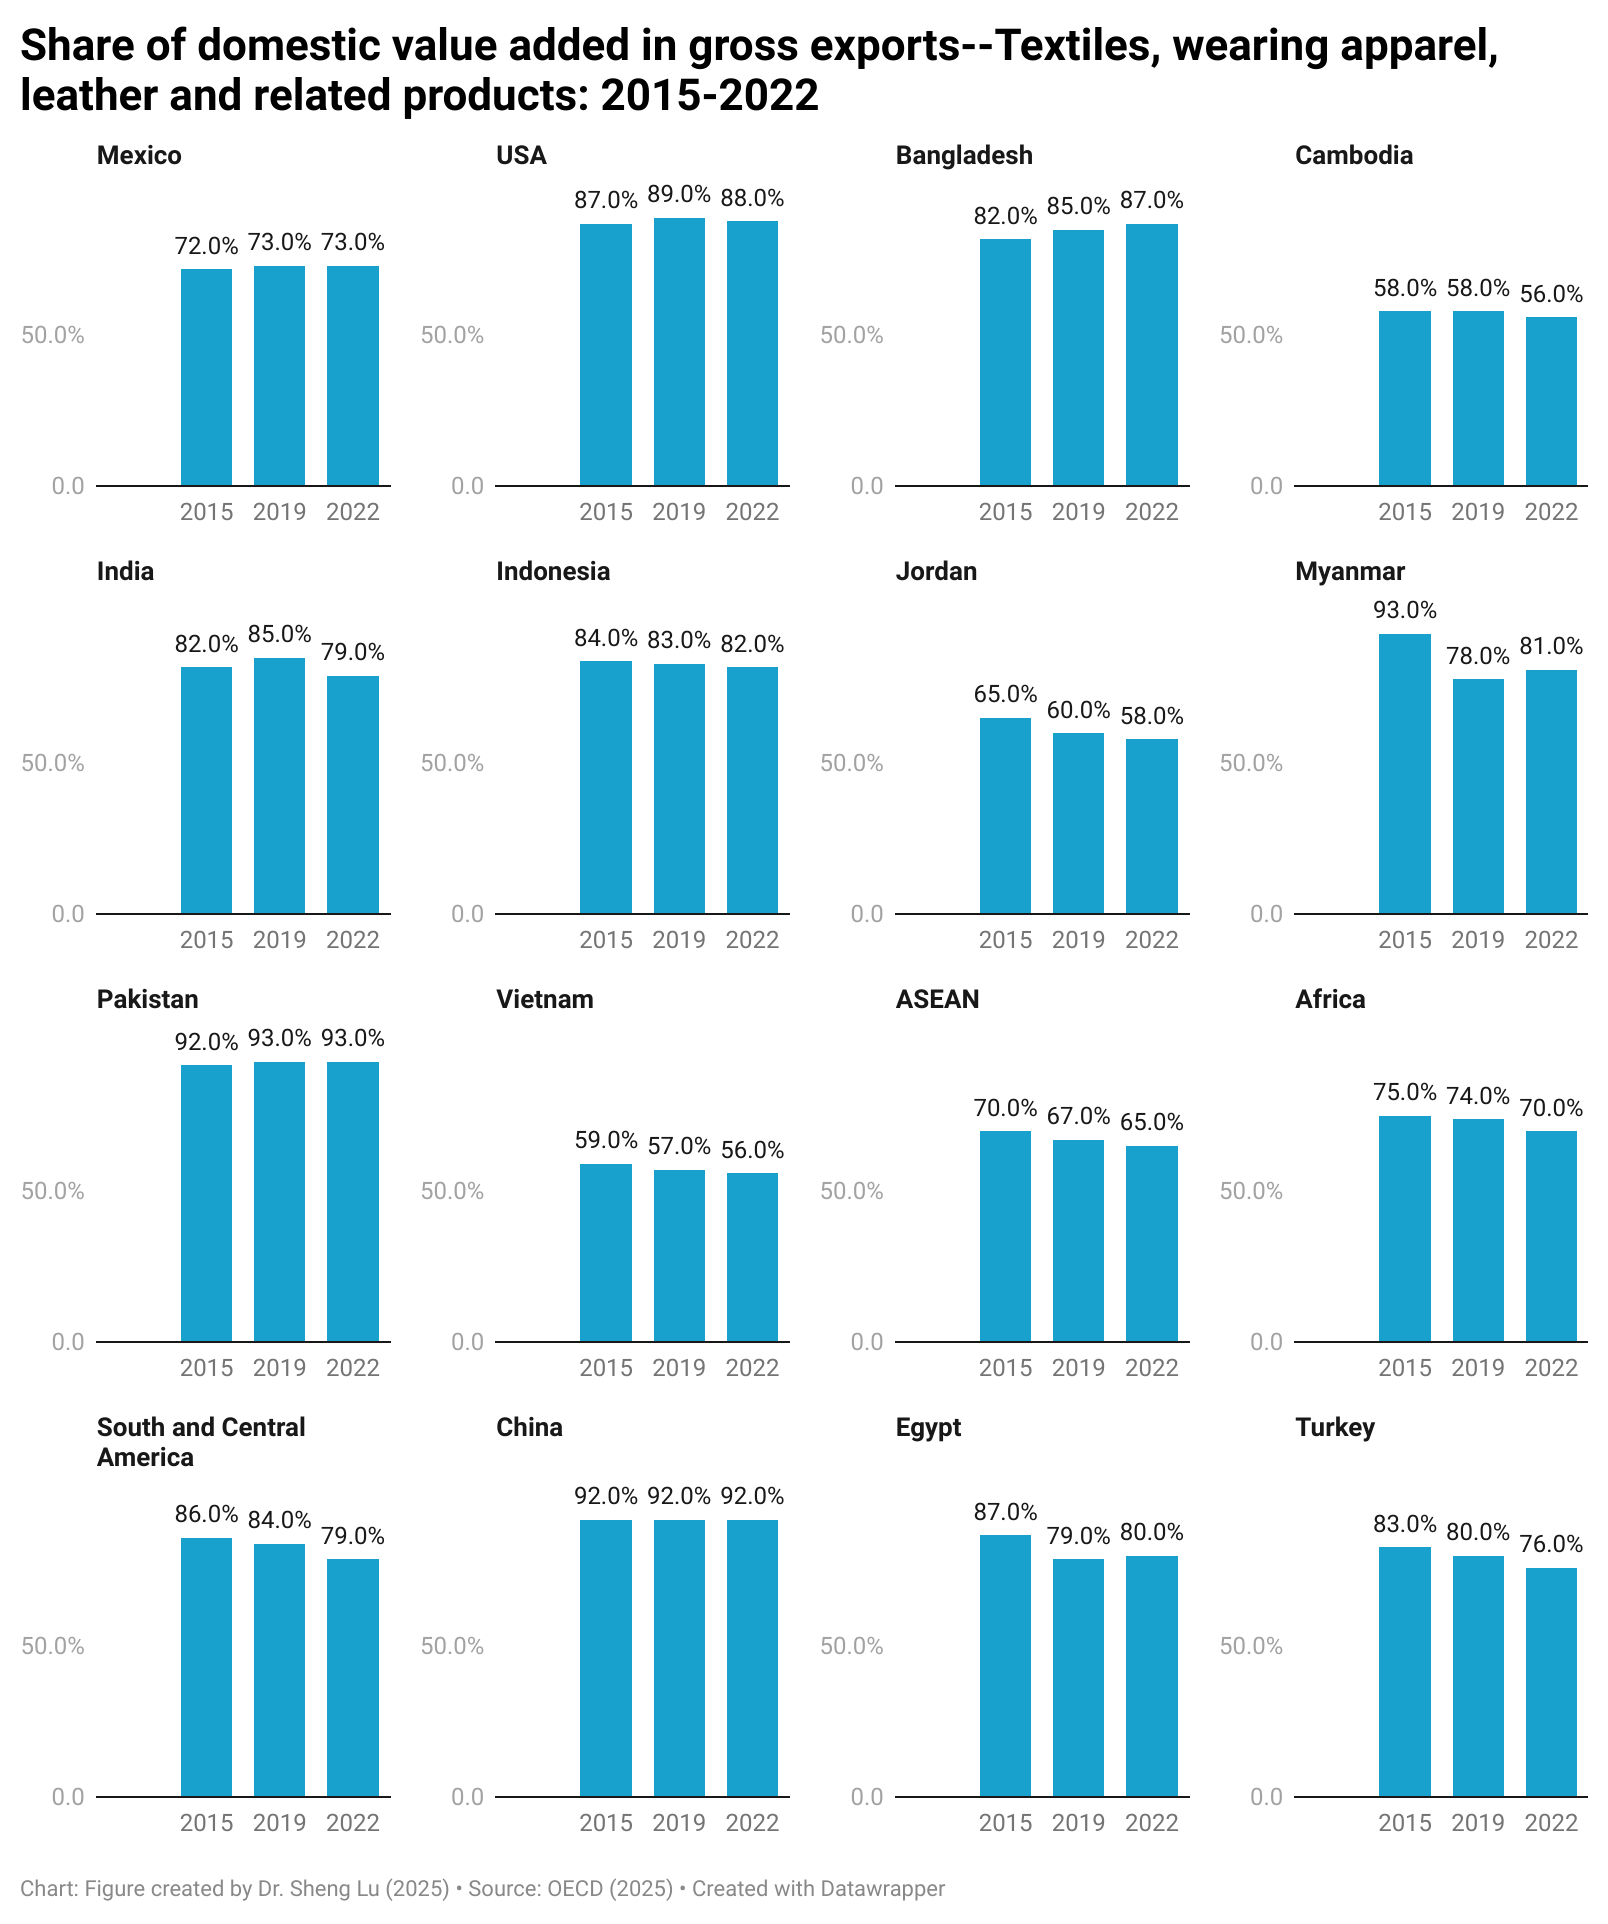
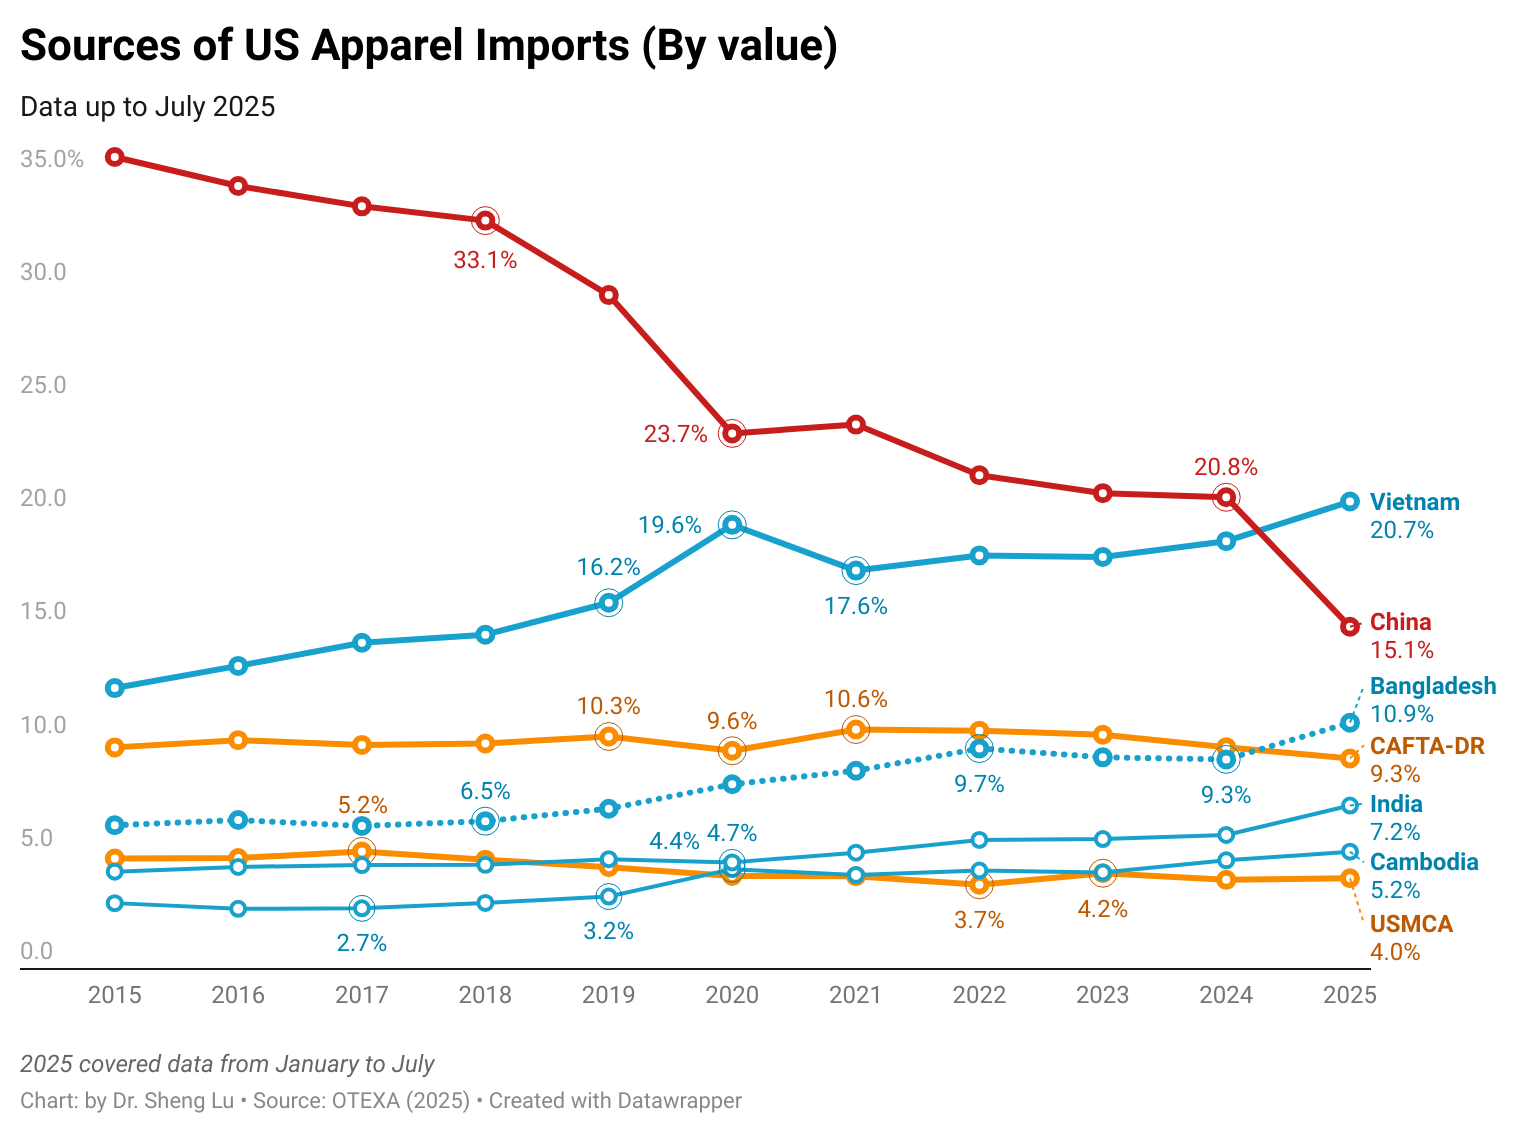
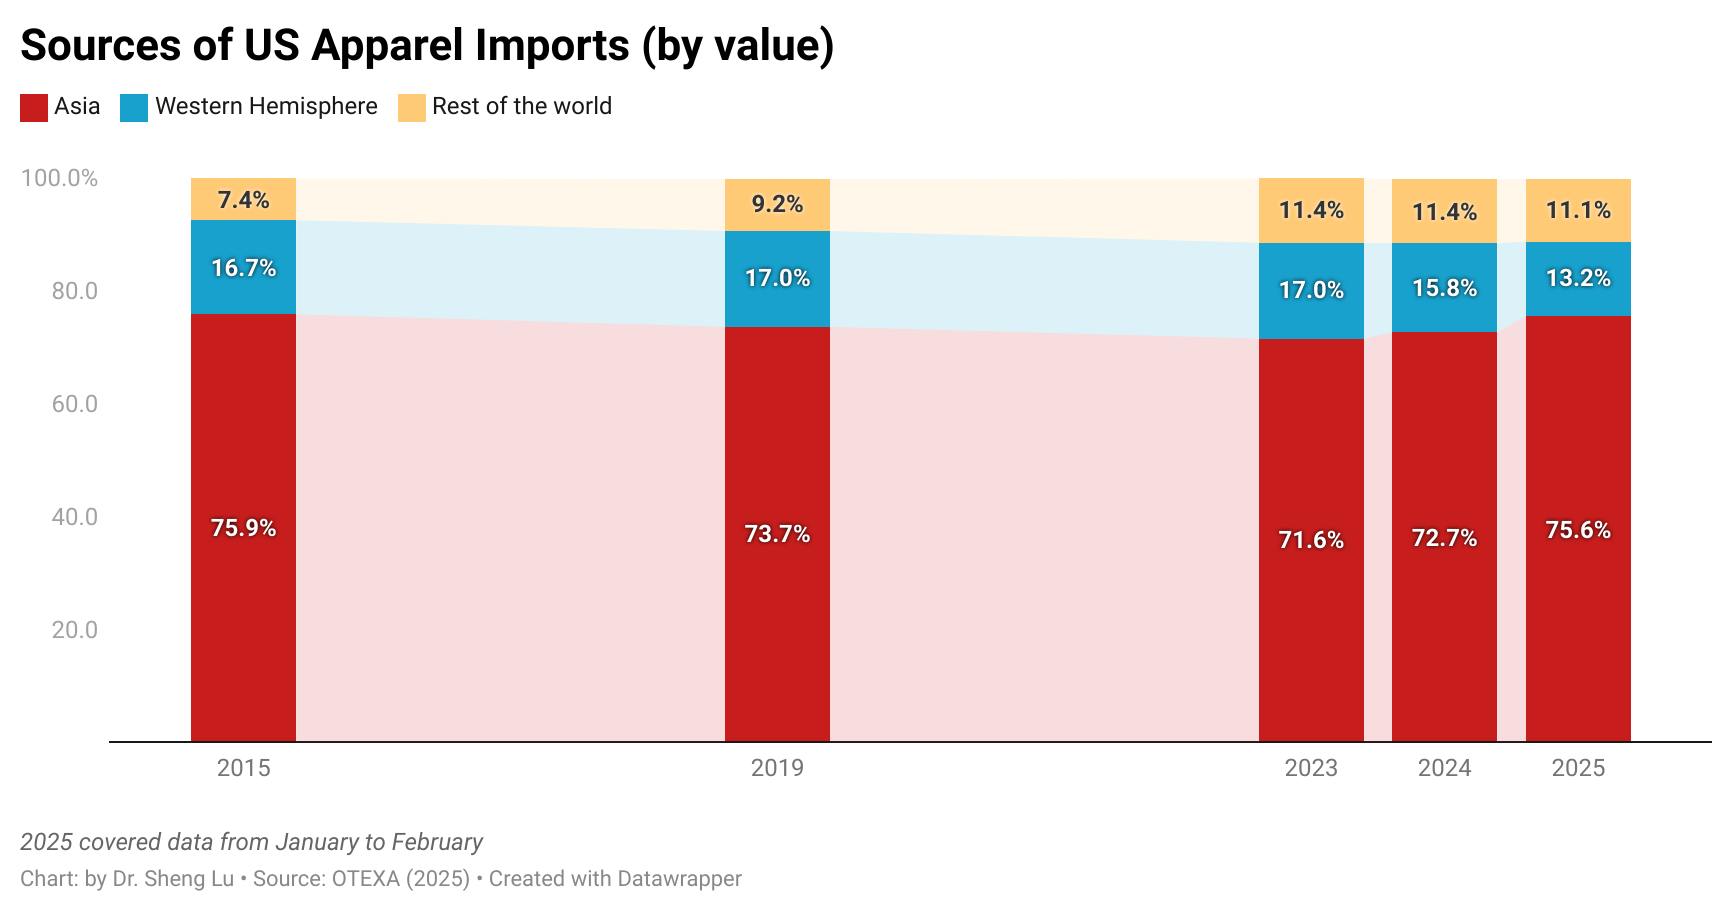
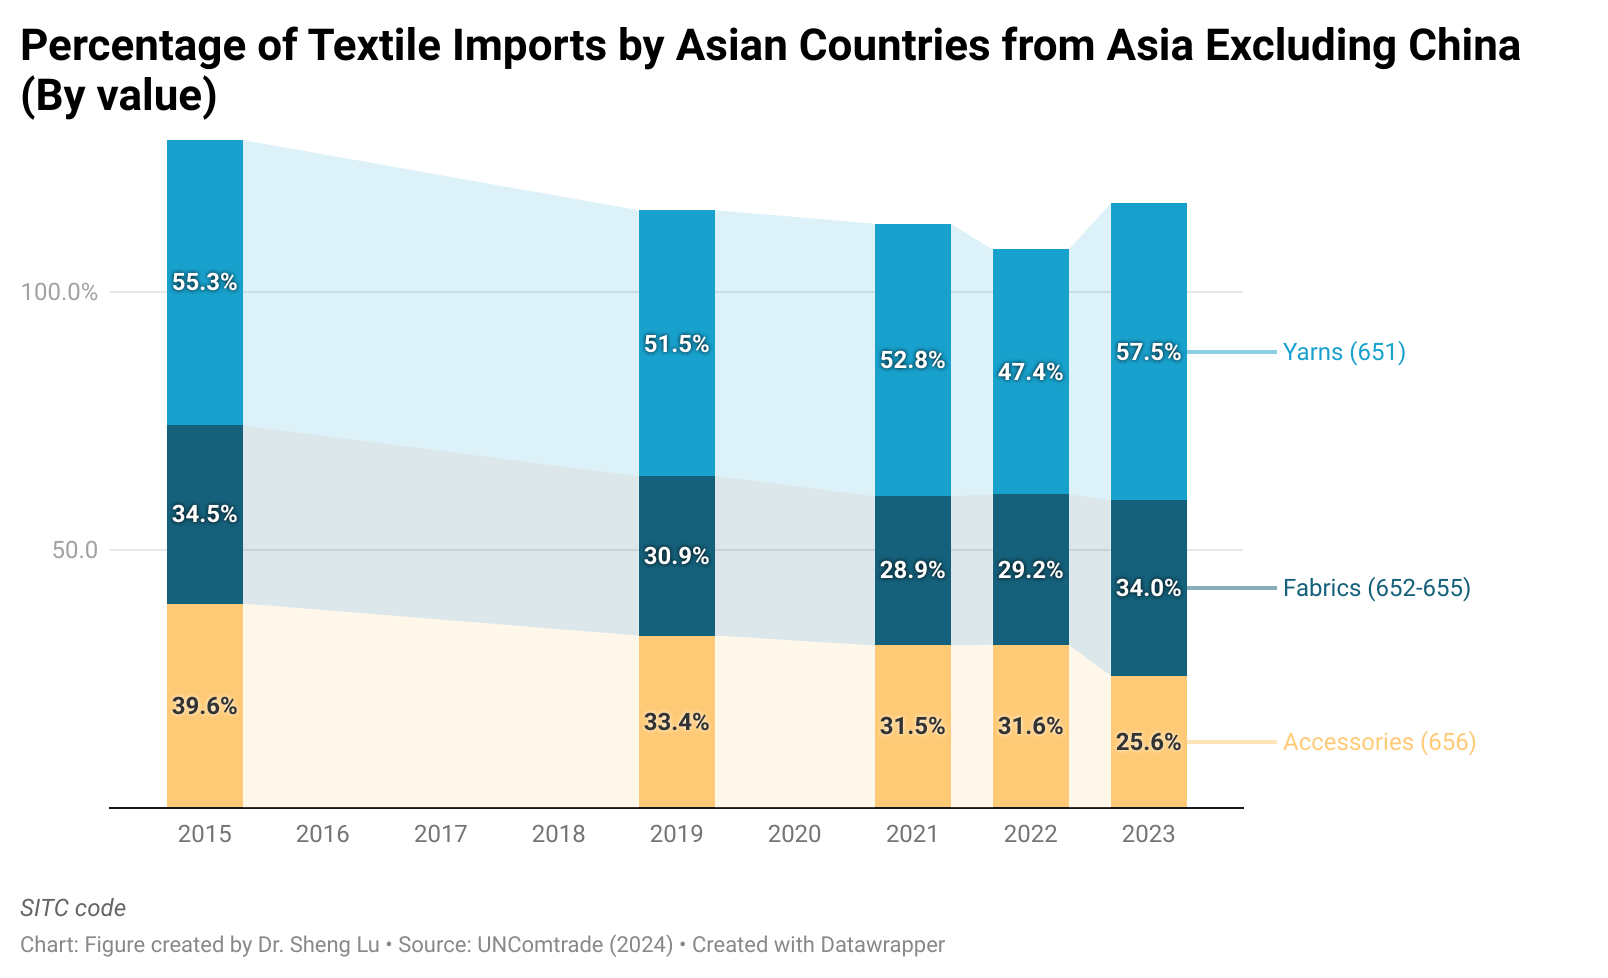
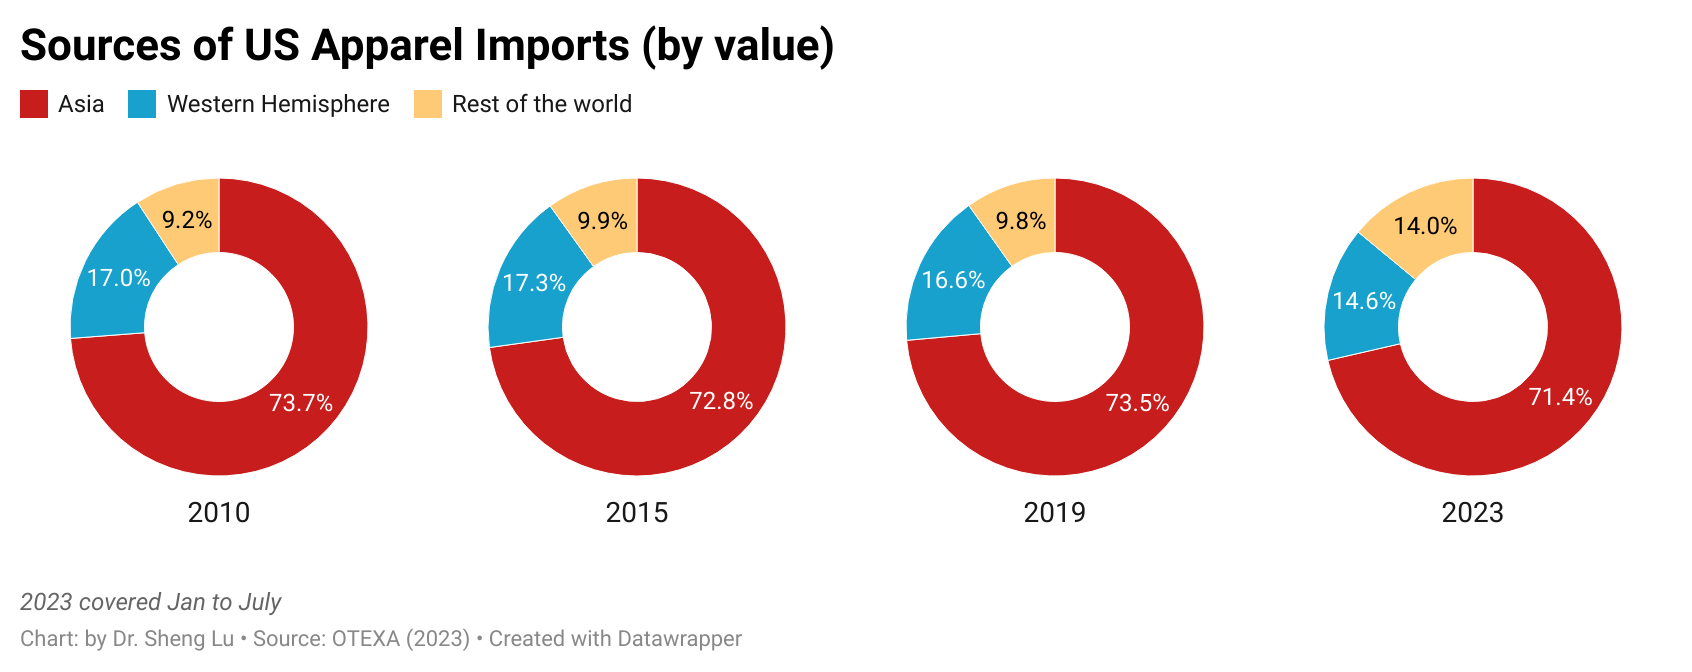
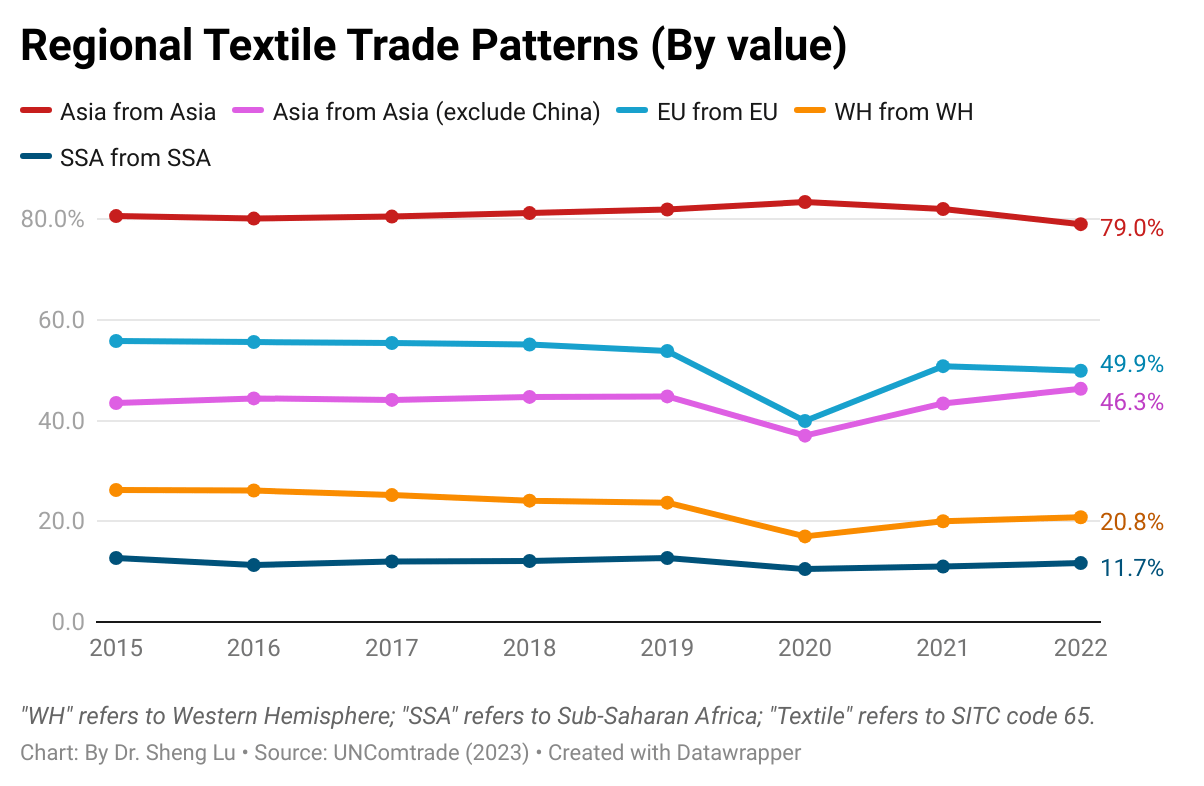
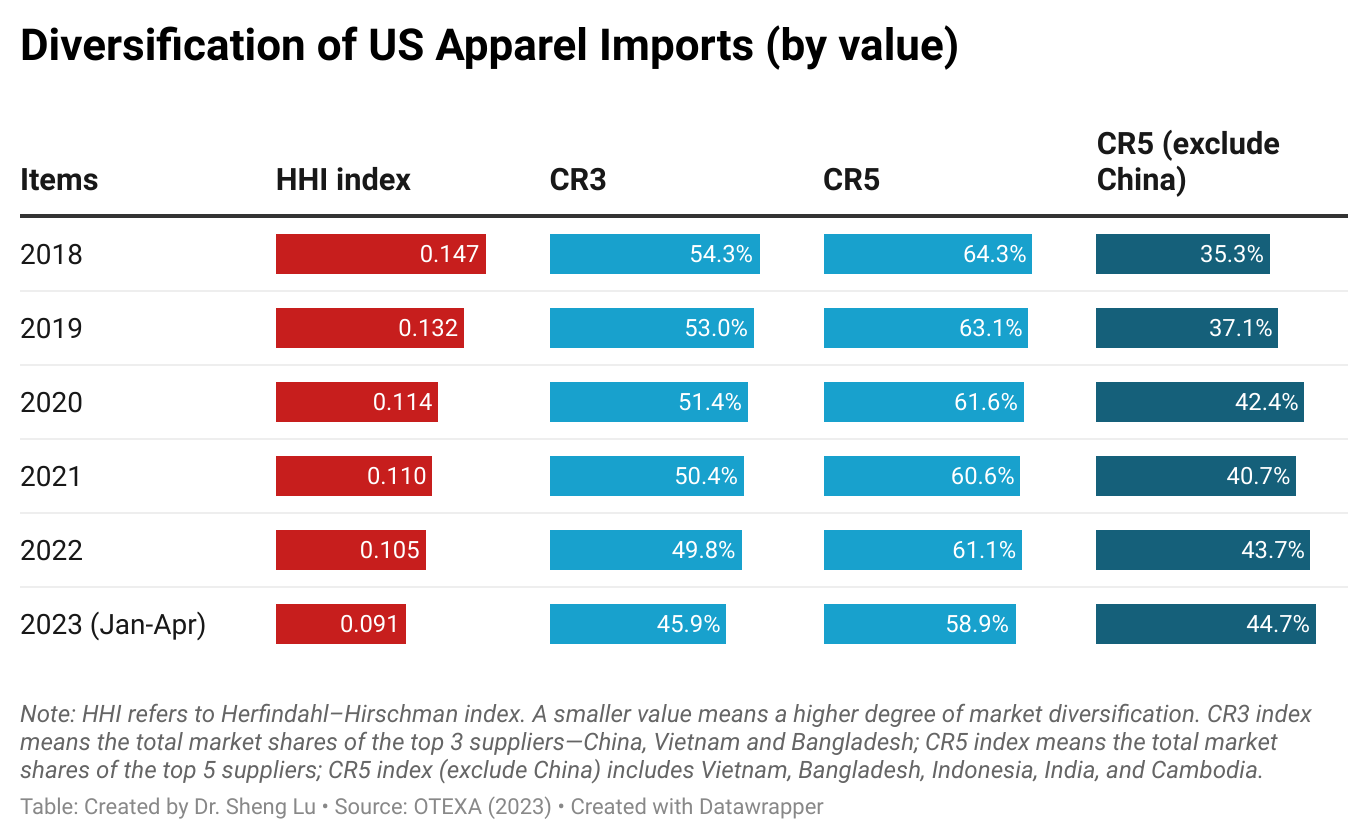
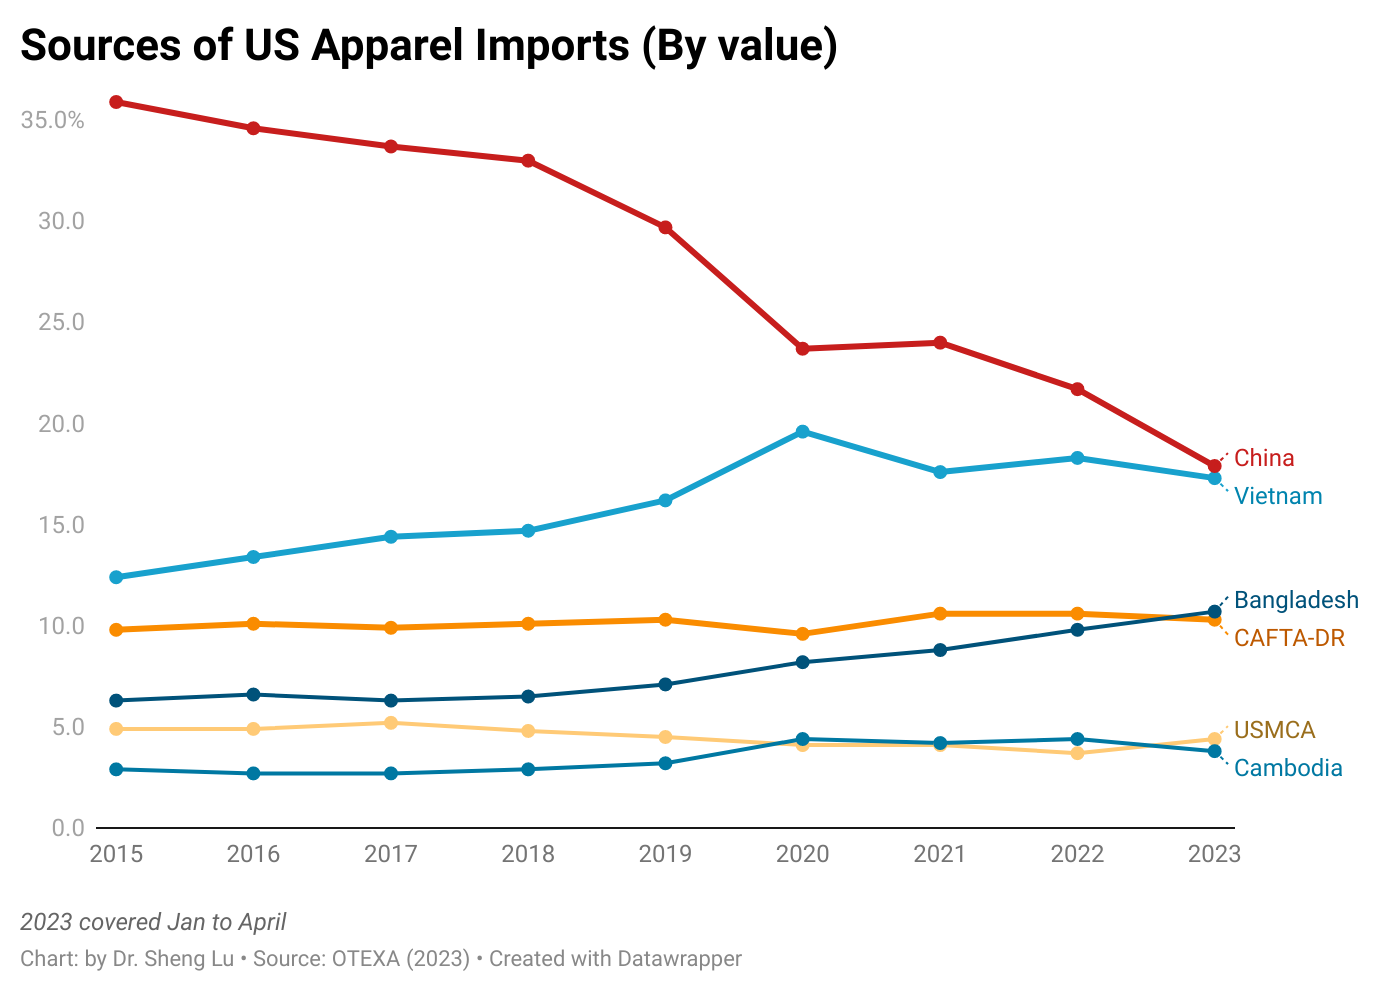
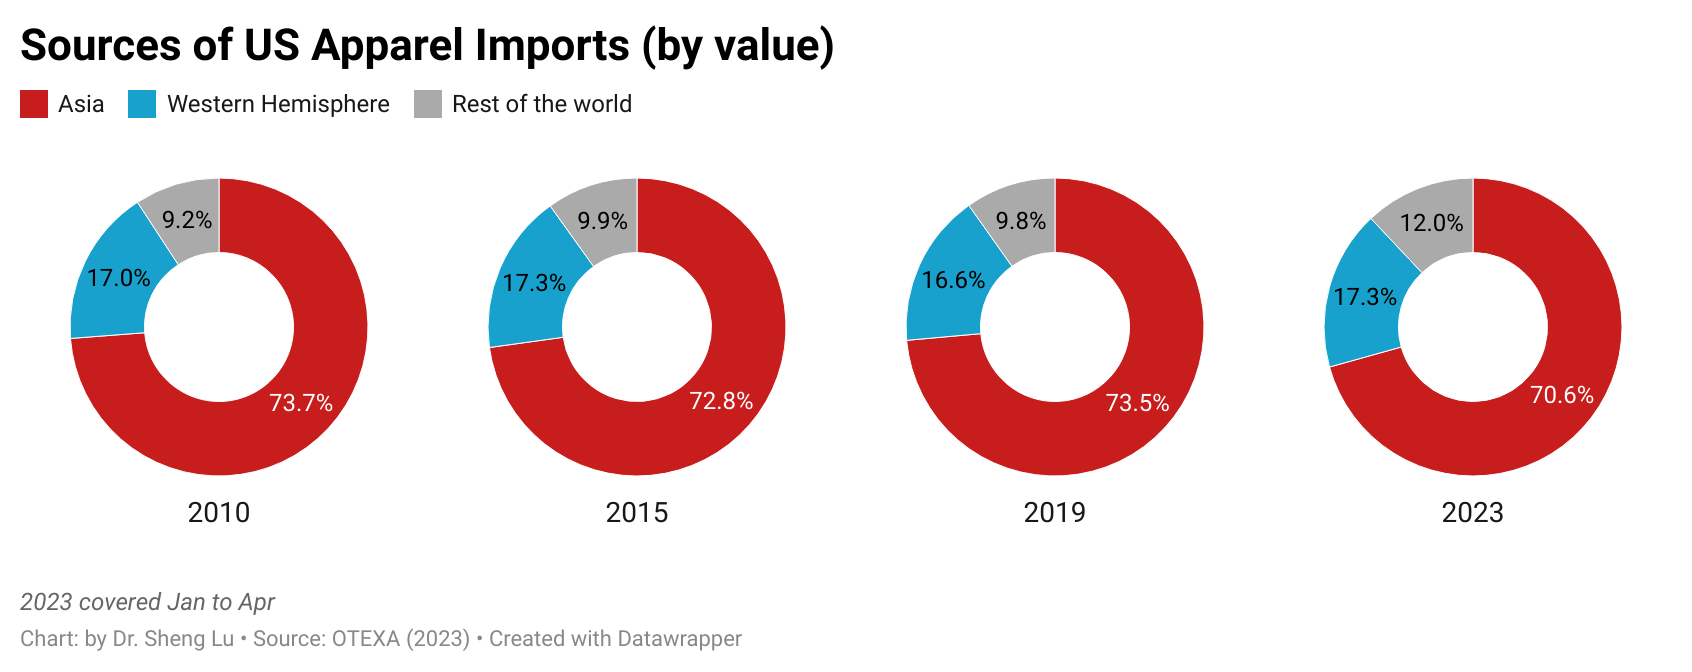
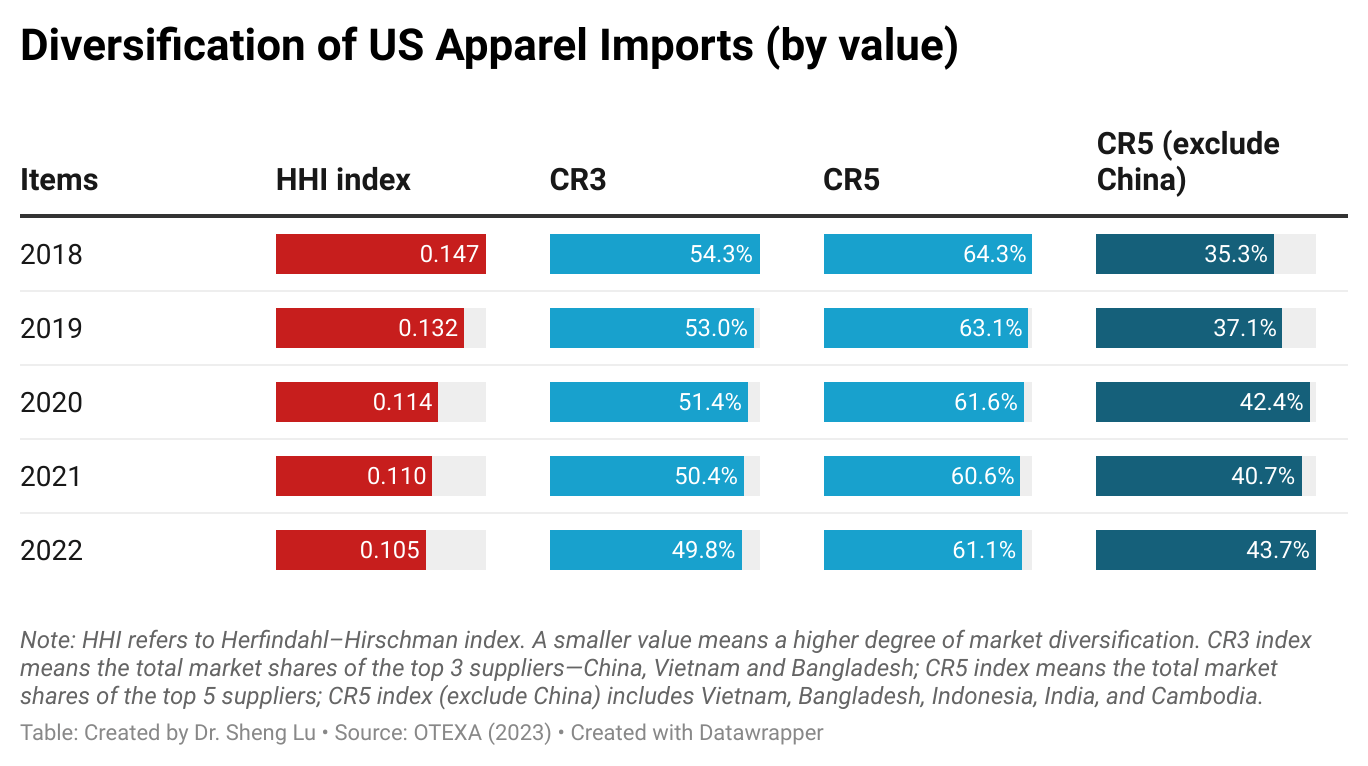
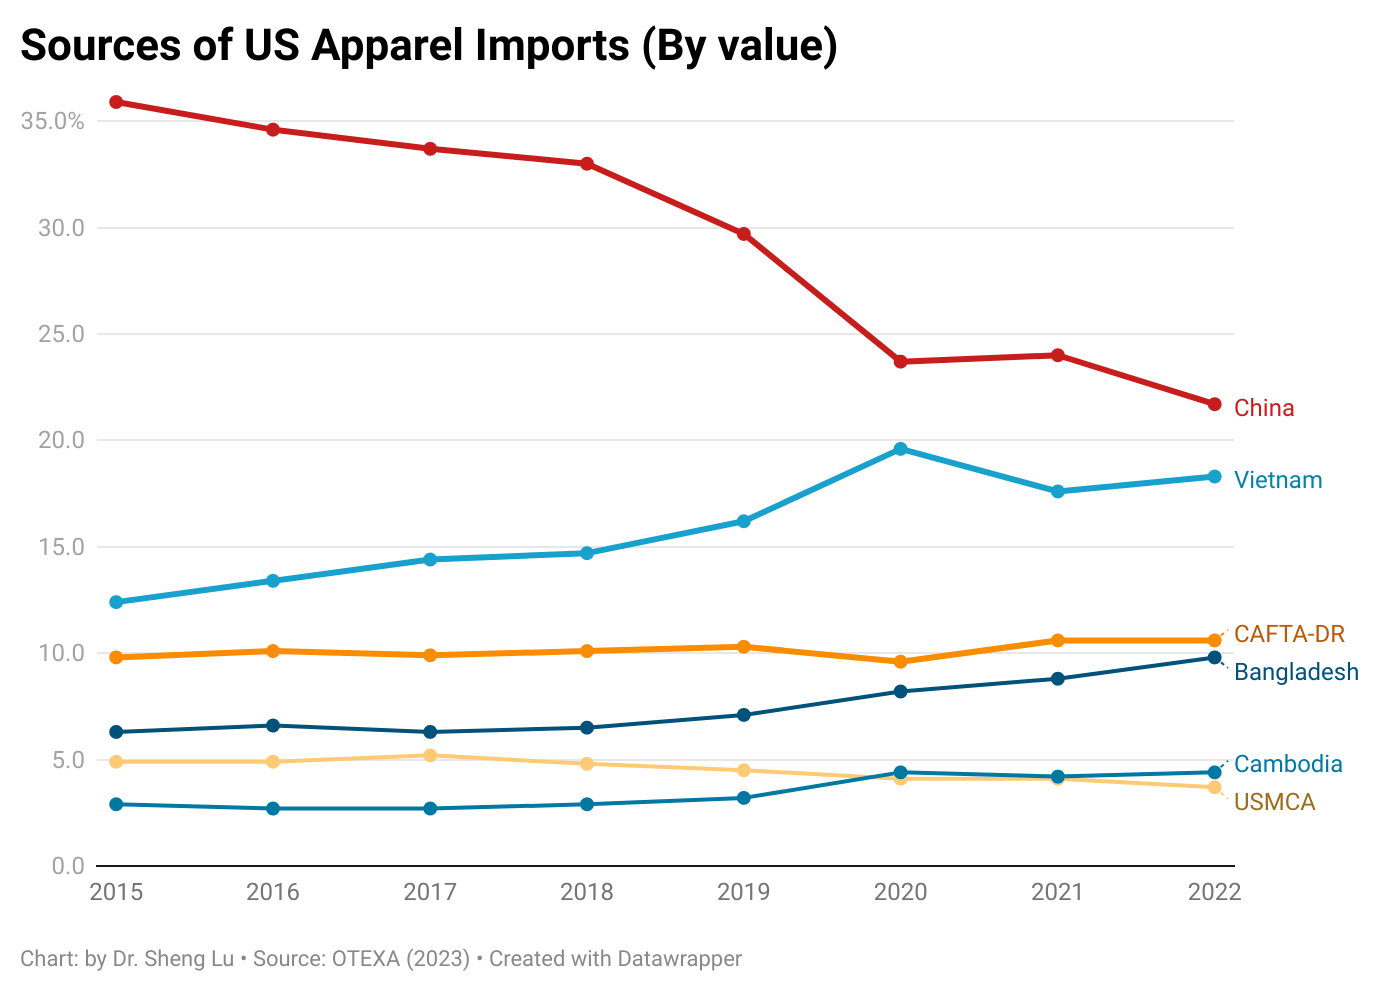
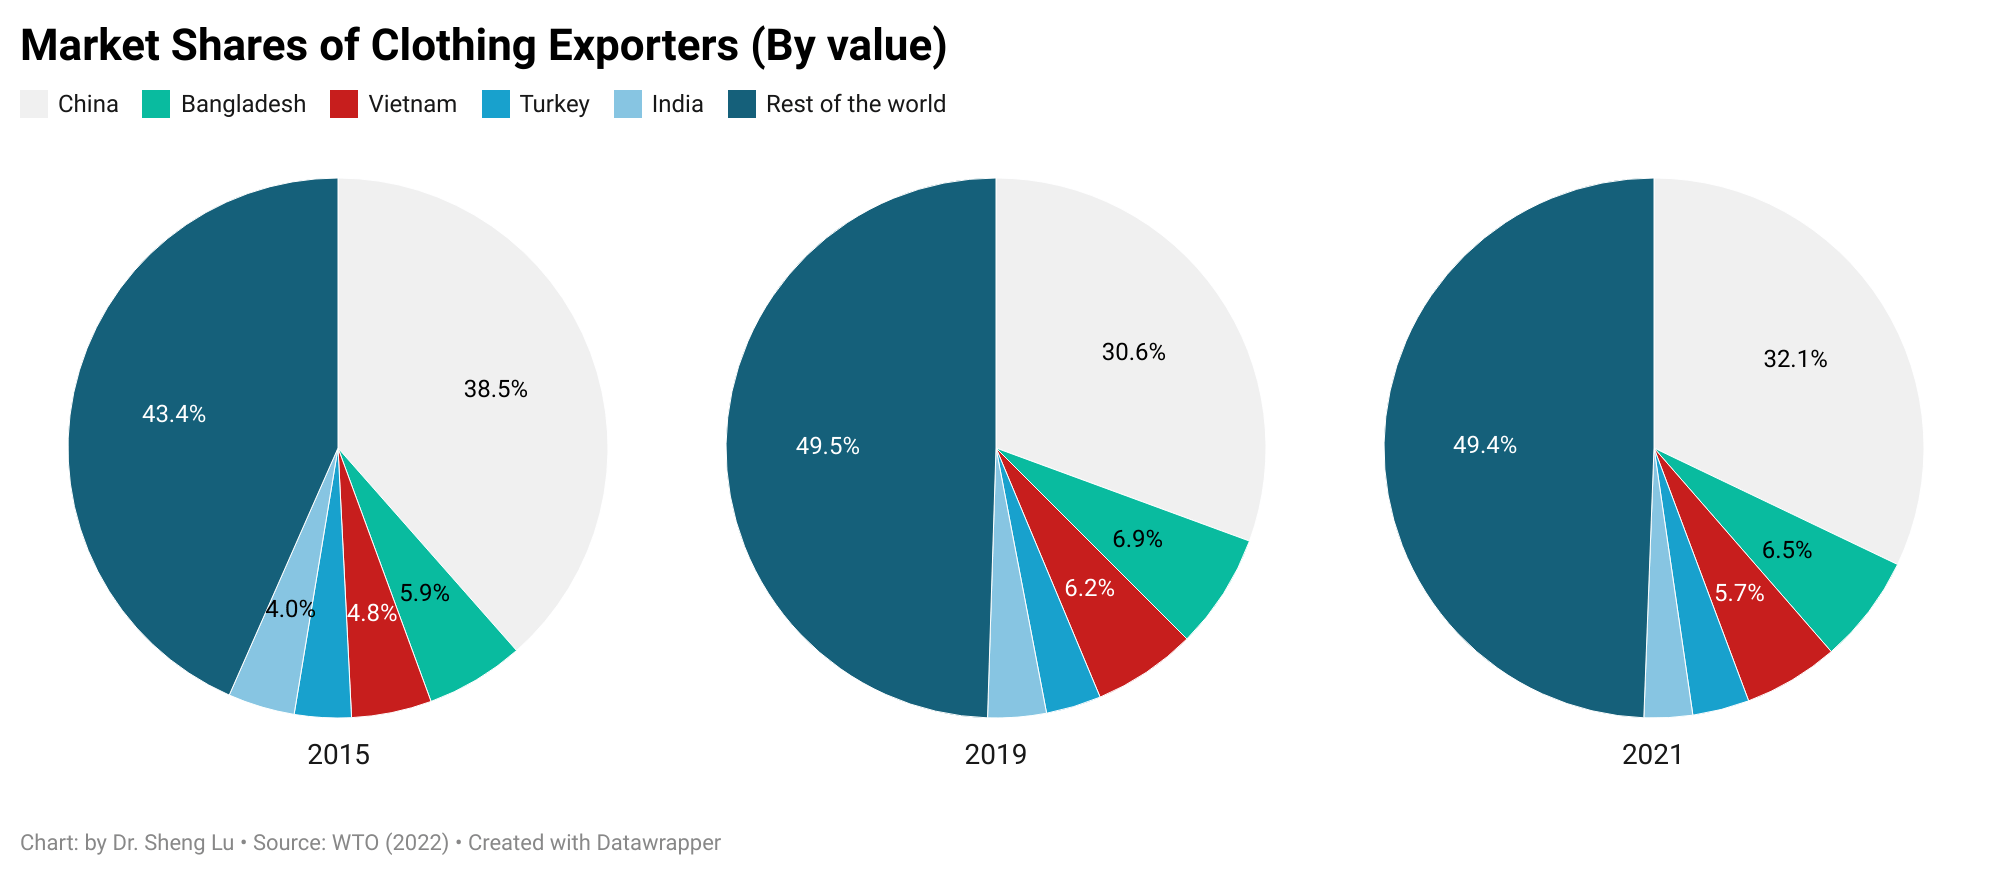
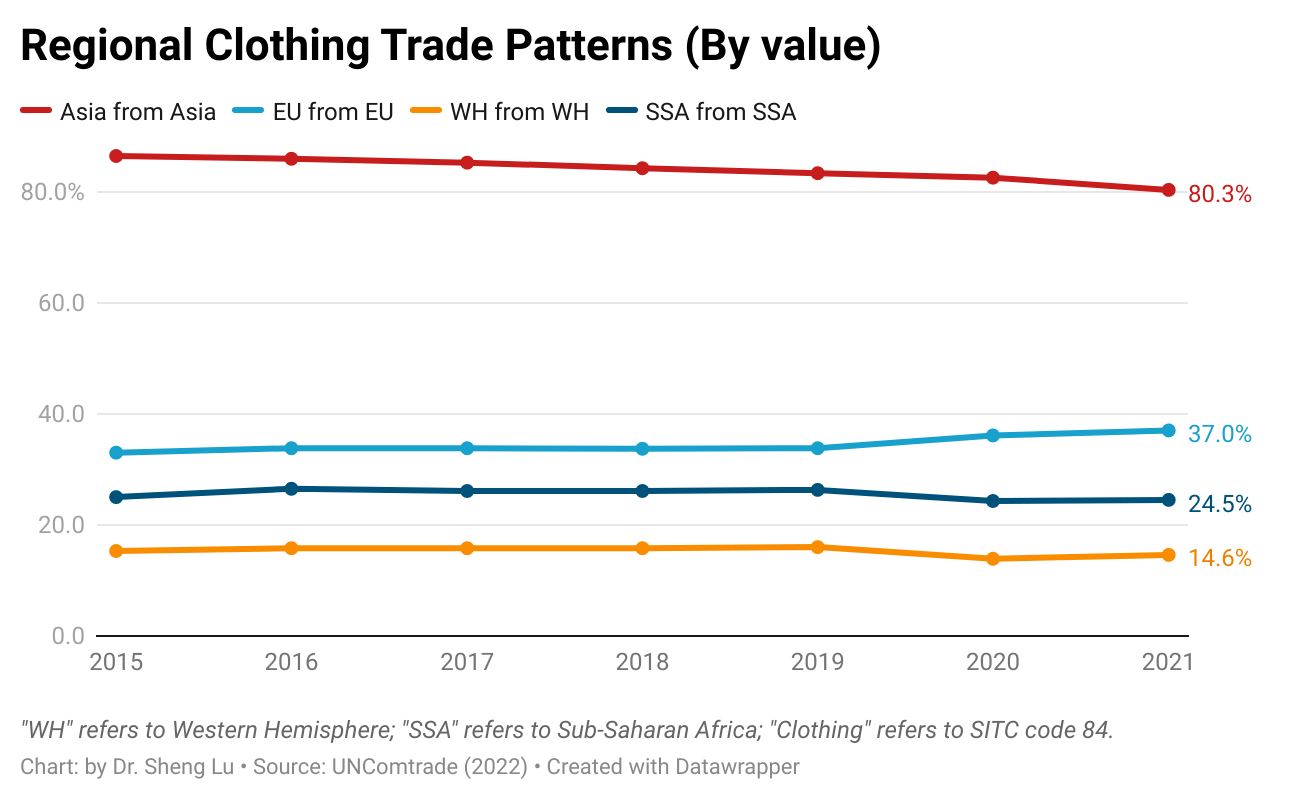
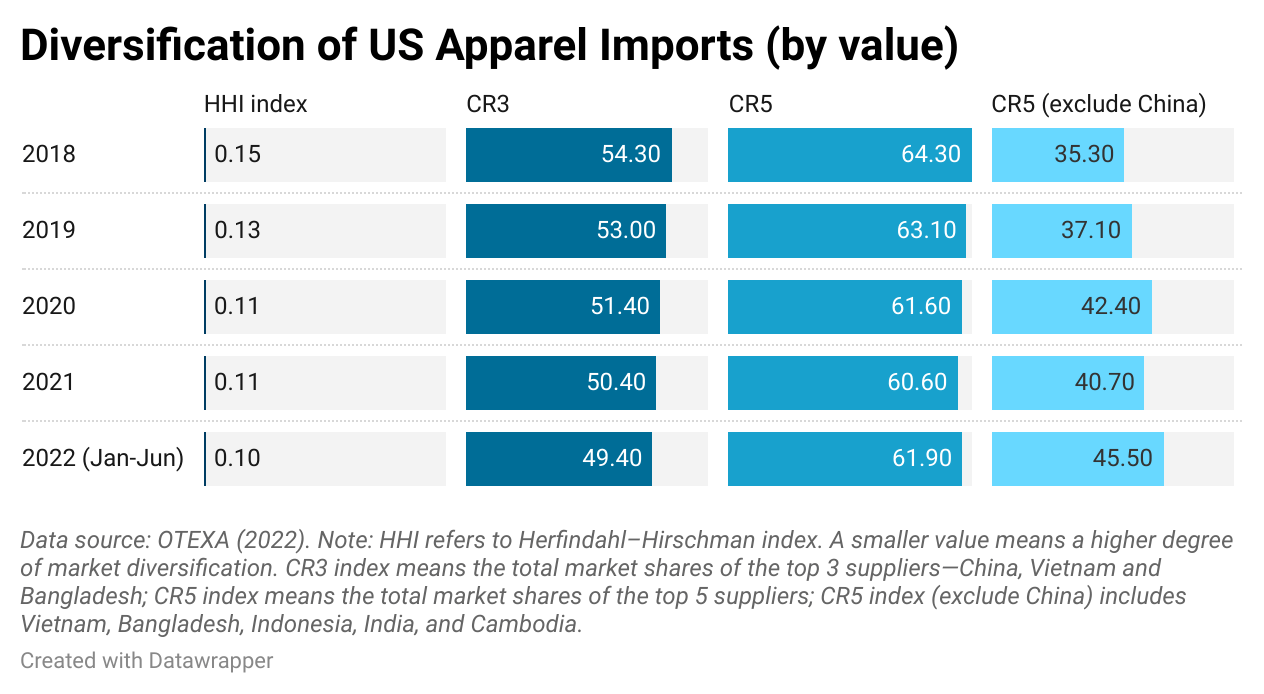
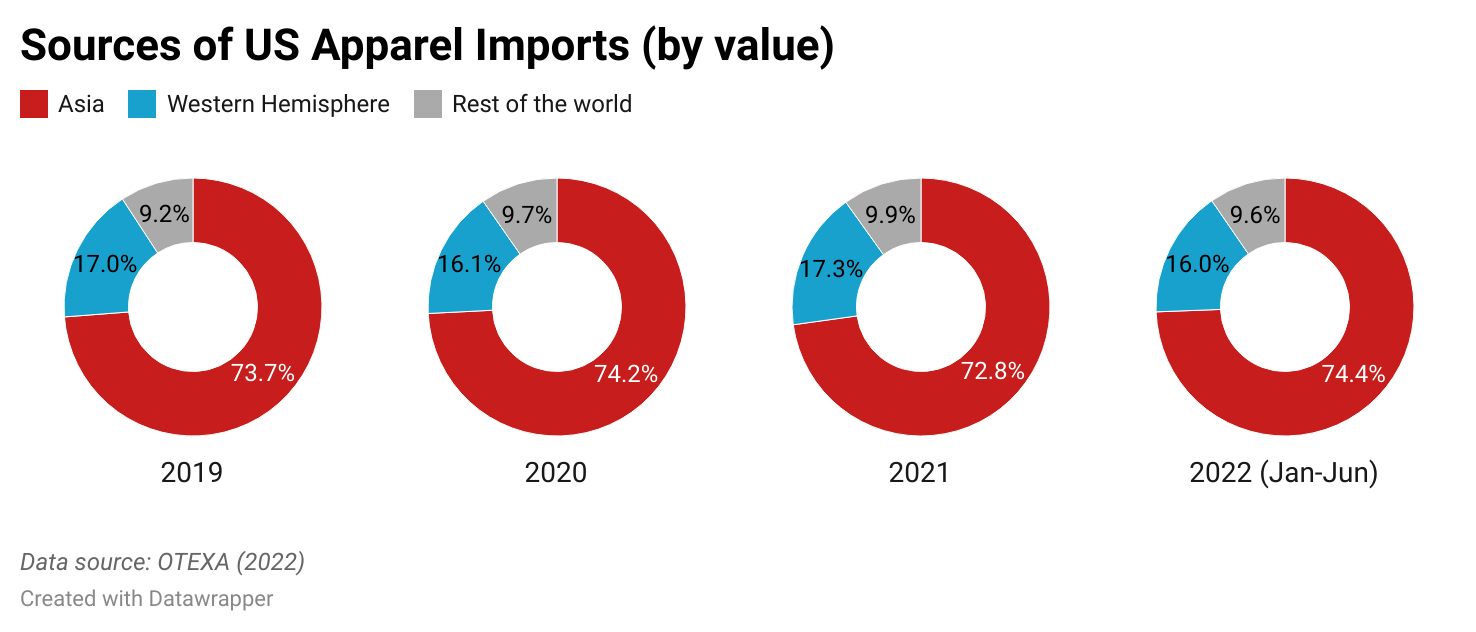
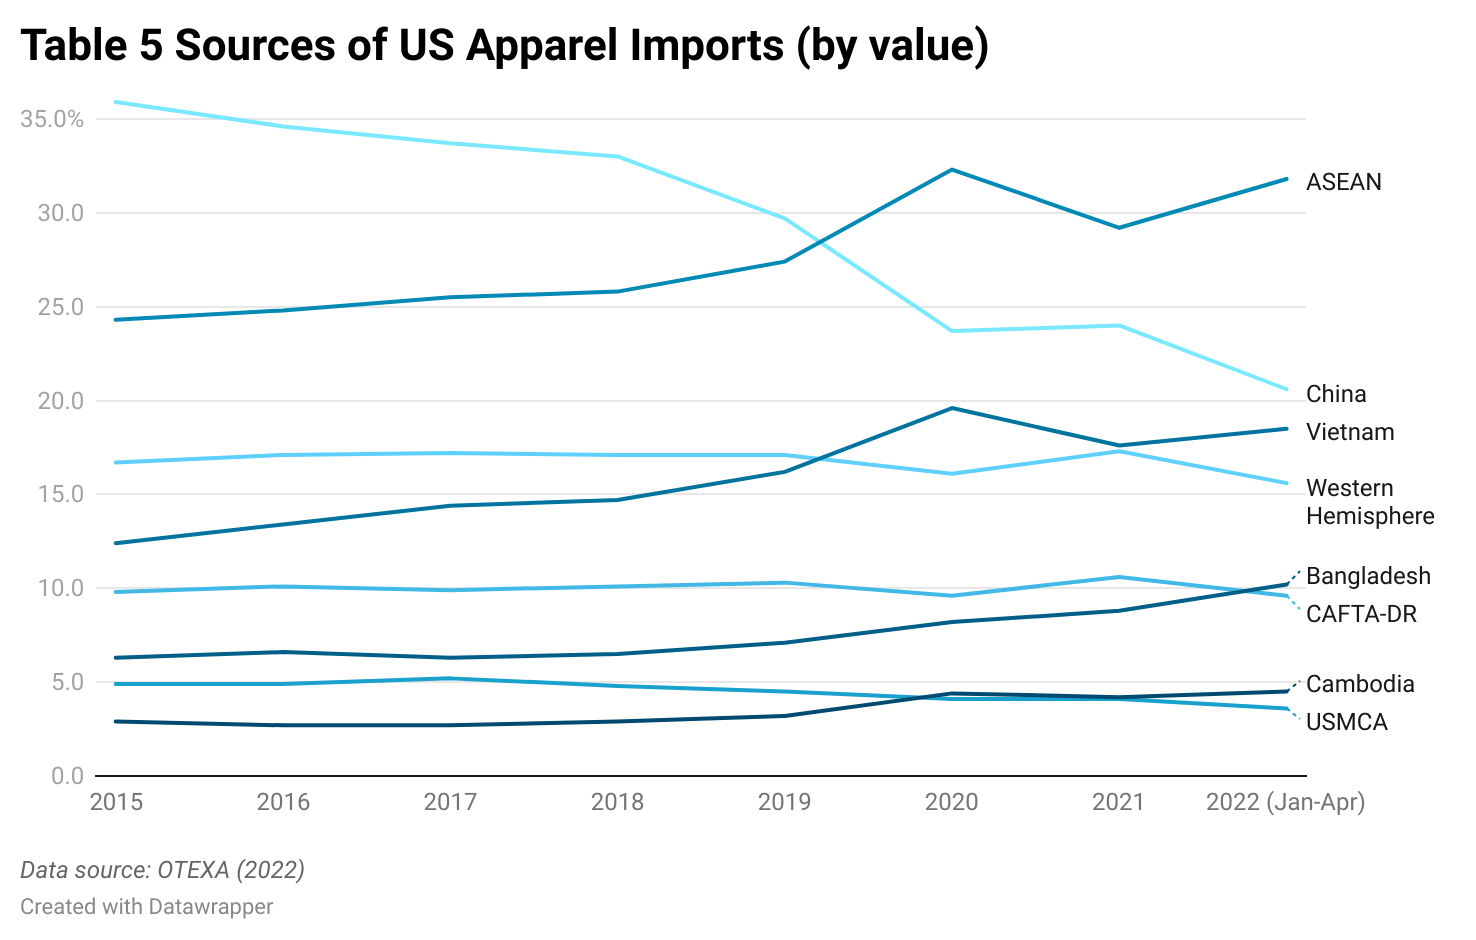
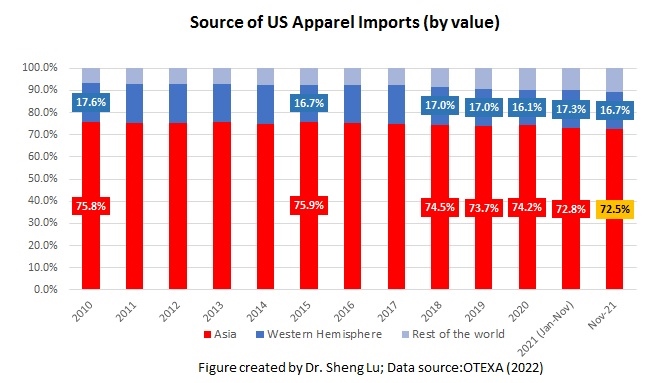
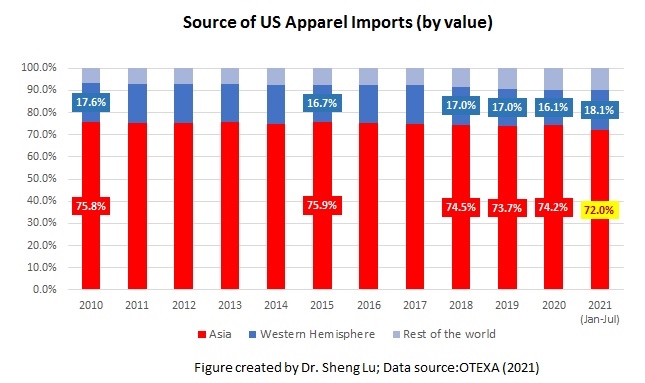
- Compared with 2025, sourcing diversification became more geographically balanced. Although Asia remained the dominant sourcing region, utilization rates for several leading Asian suppliers, including China, Vietnam, and Bangladesh, declined. Meanwhile, sourcing expanded from non-Asian destinations such as Guatemala, Egypt, and Jordan, and U.S. apparel imports from regions outside Asia reached their highest share in more than a decade.
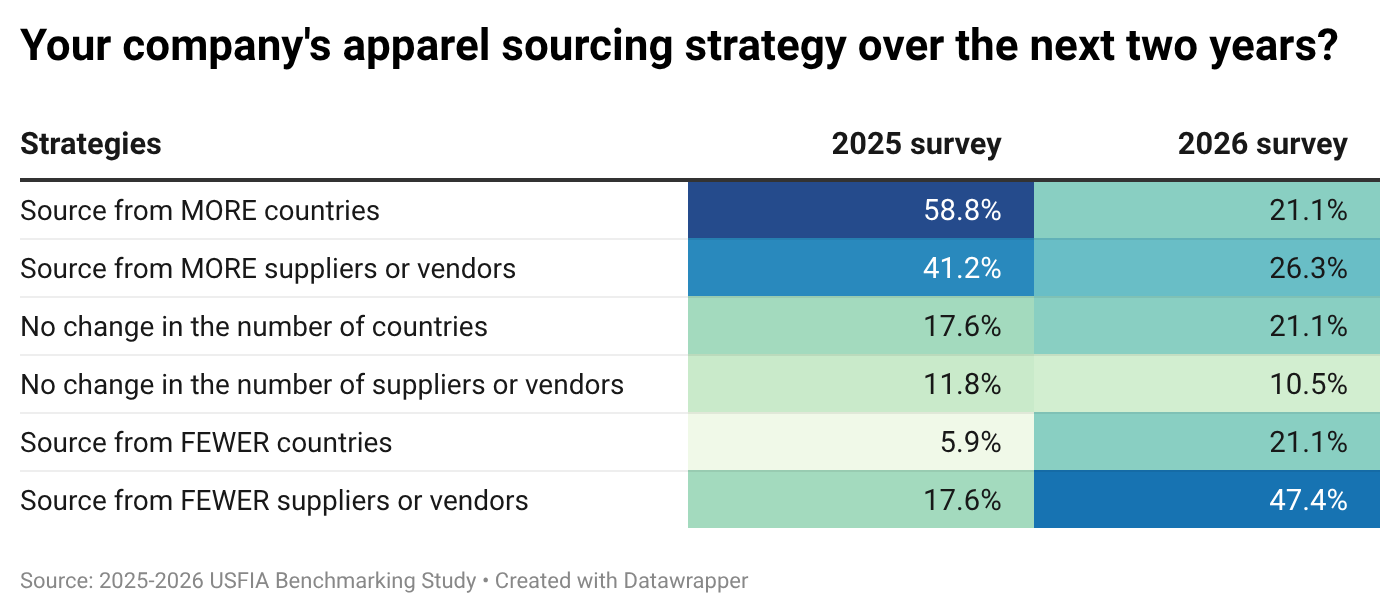
- Respondents appear to be shifting from rapid geographic expansion toward optimizing their existing supplier networks. Compared with 2025, substantially fewer companies plan to source from additional countries or add new vendors over the next two years. Instead, many respondents emphasized supplier consolidation, stronger strategic partnerships, improved traceability, and greater operational resilience.
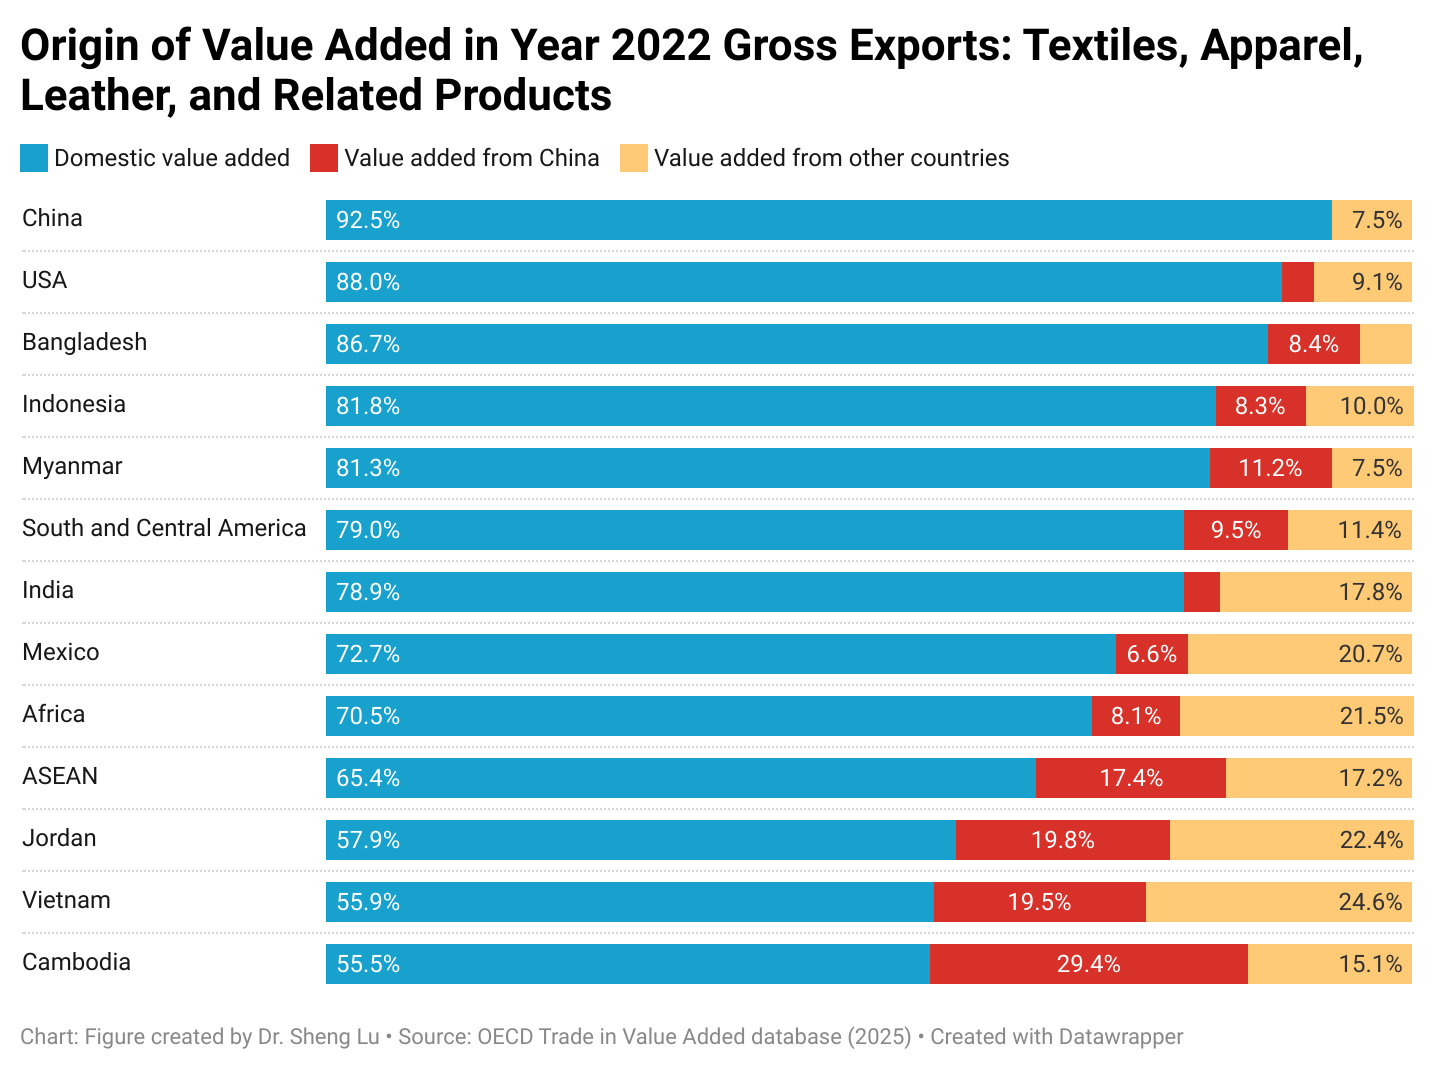
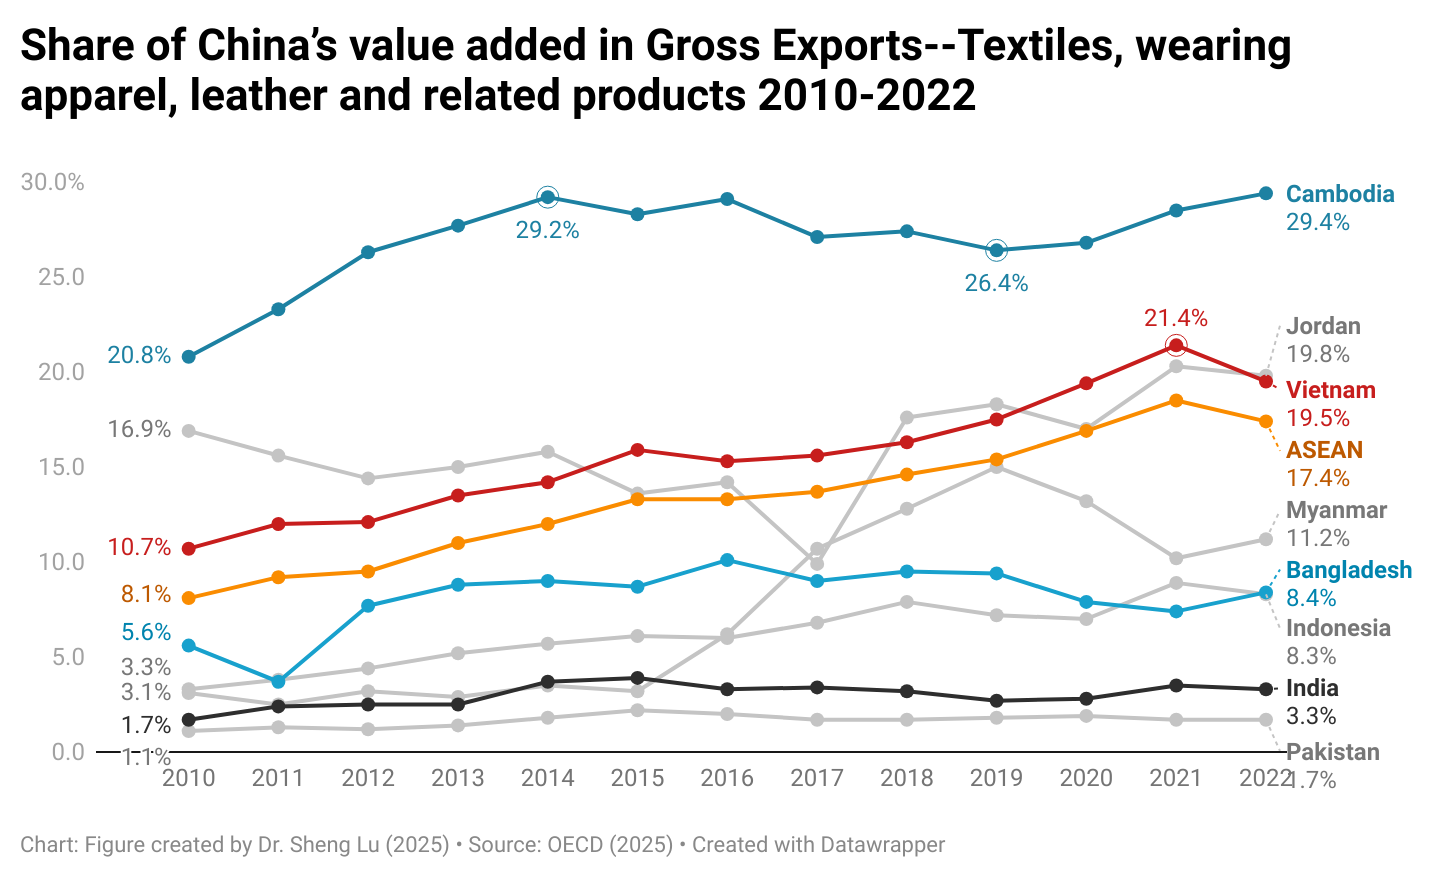
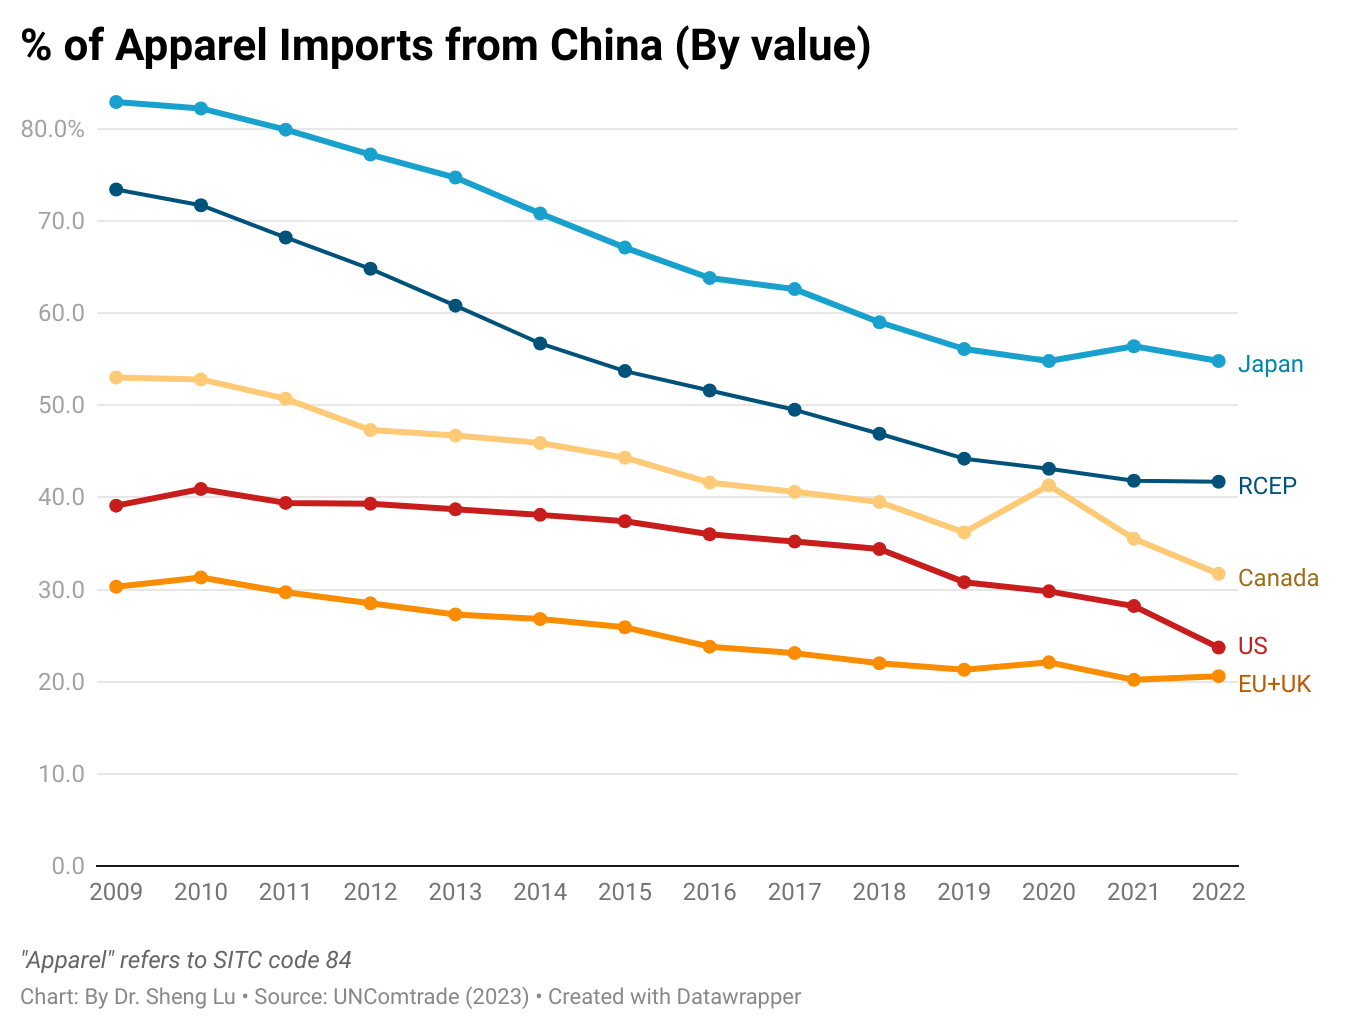
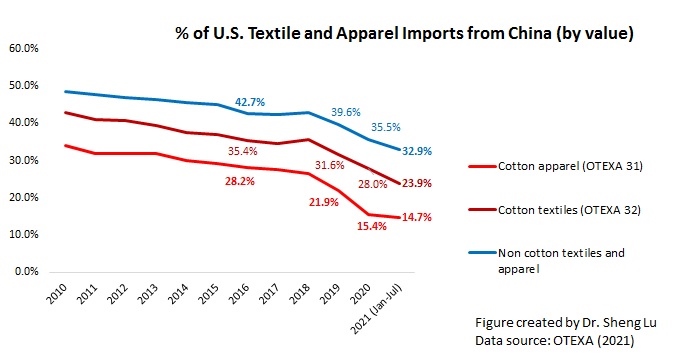
The survey results suggest that U.S. fashion companies remain committed to reducing sourcing risks associated with China, although the pace and nature of de-risking are evolving.
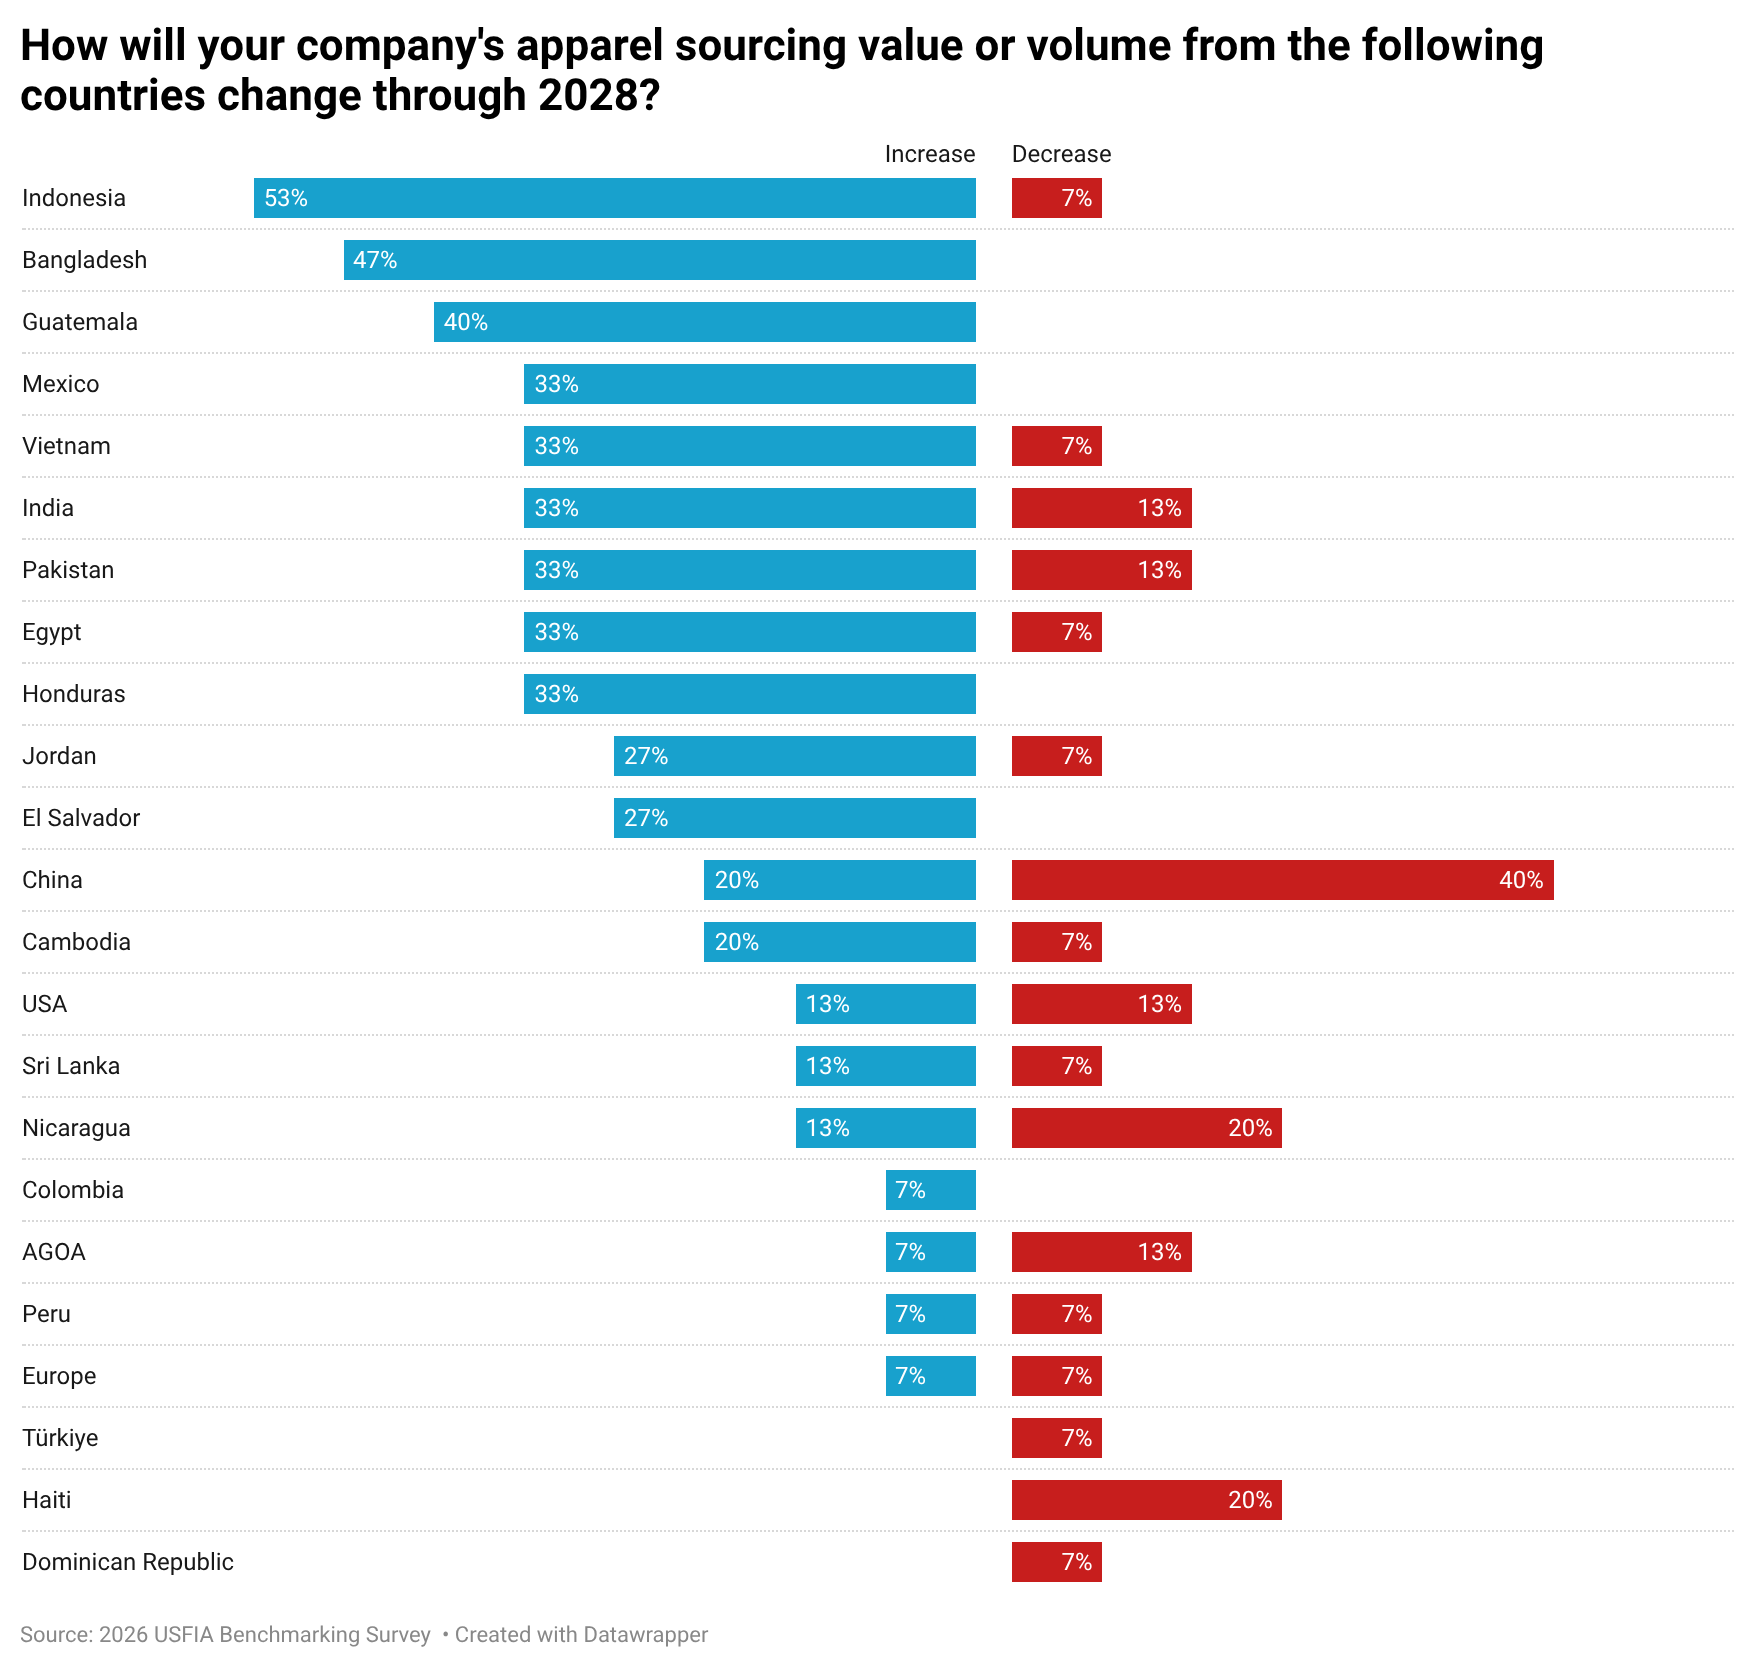
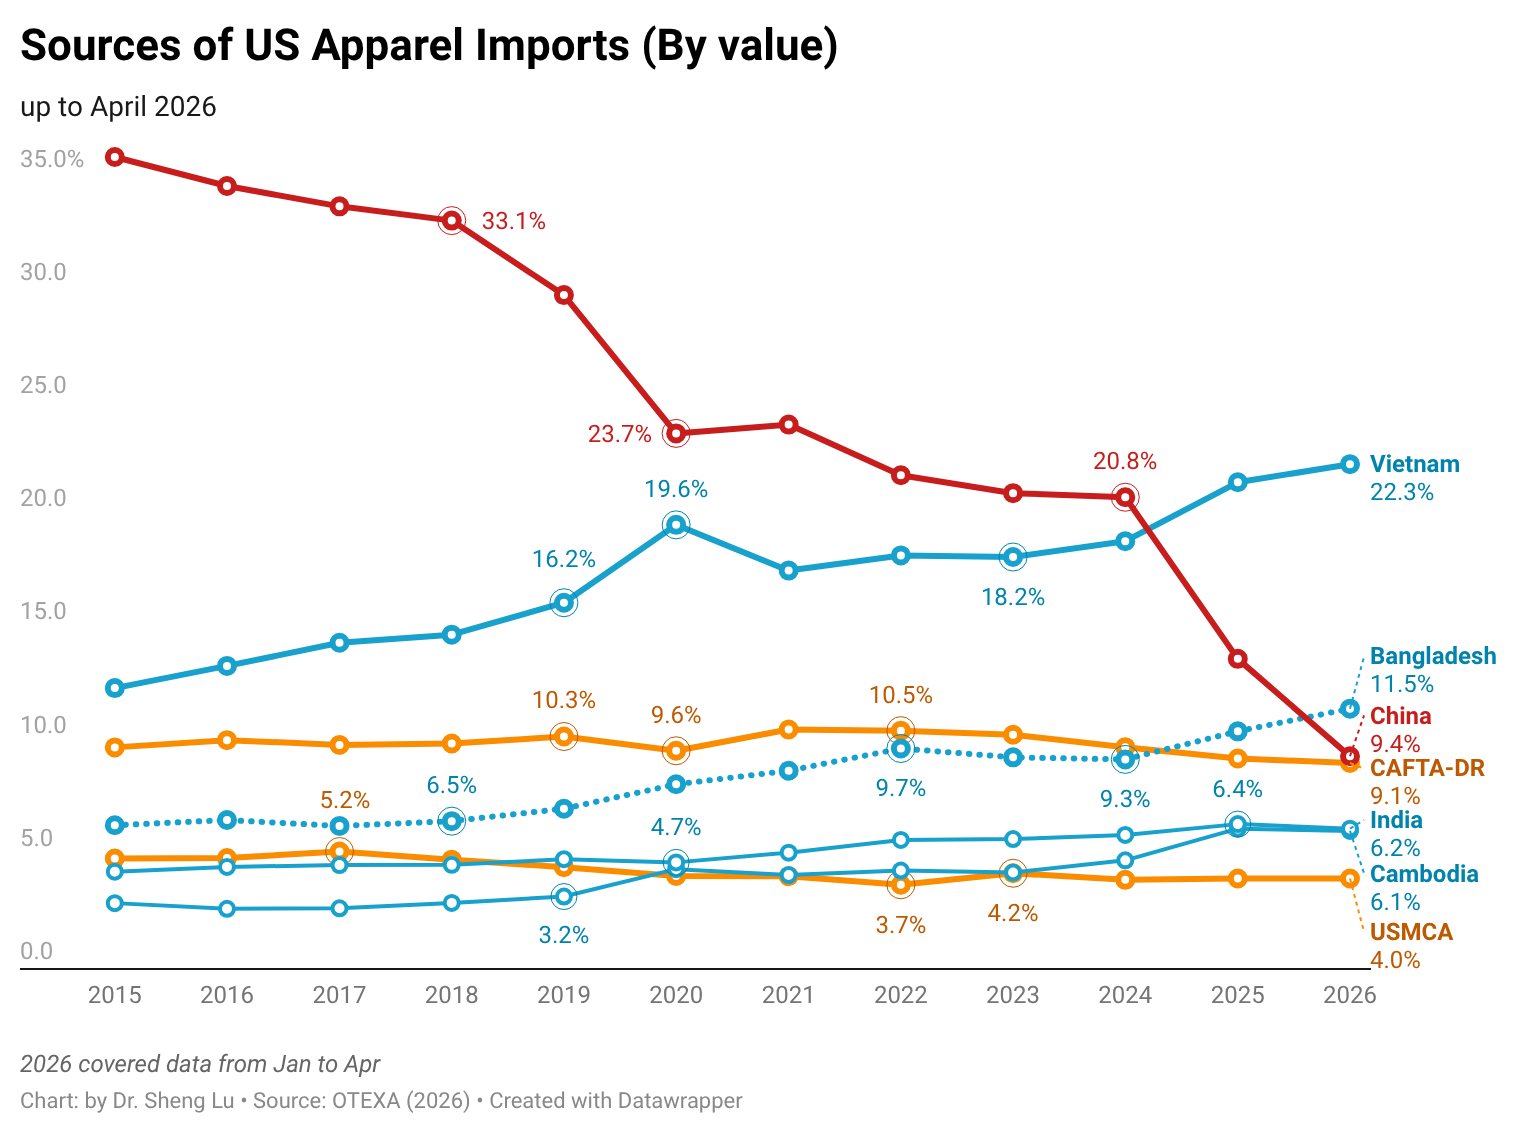
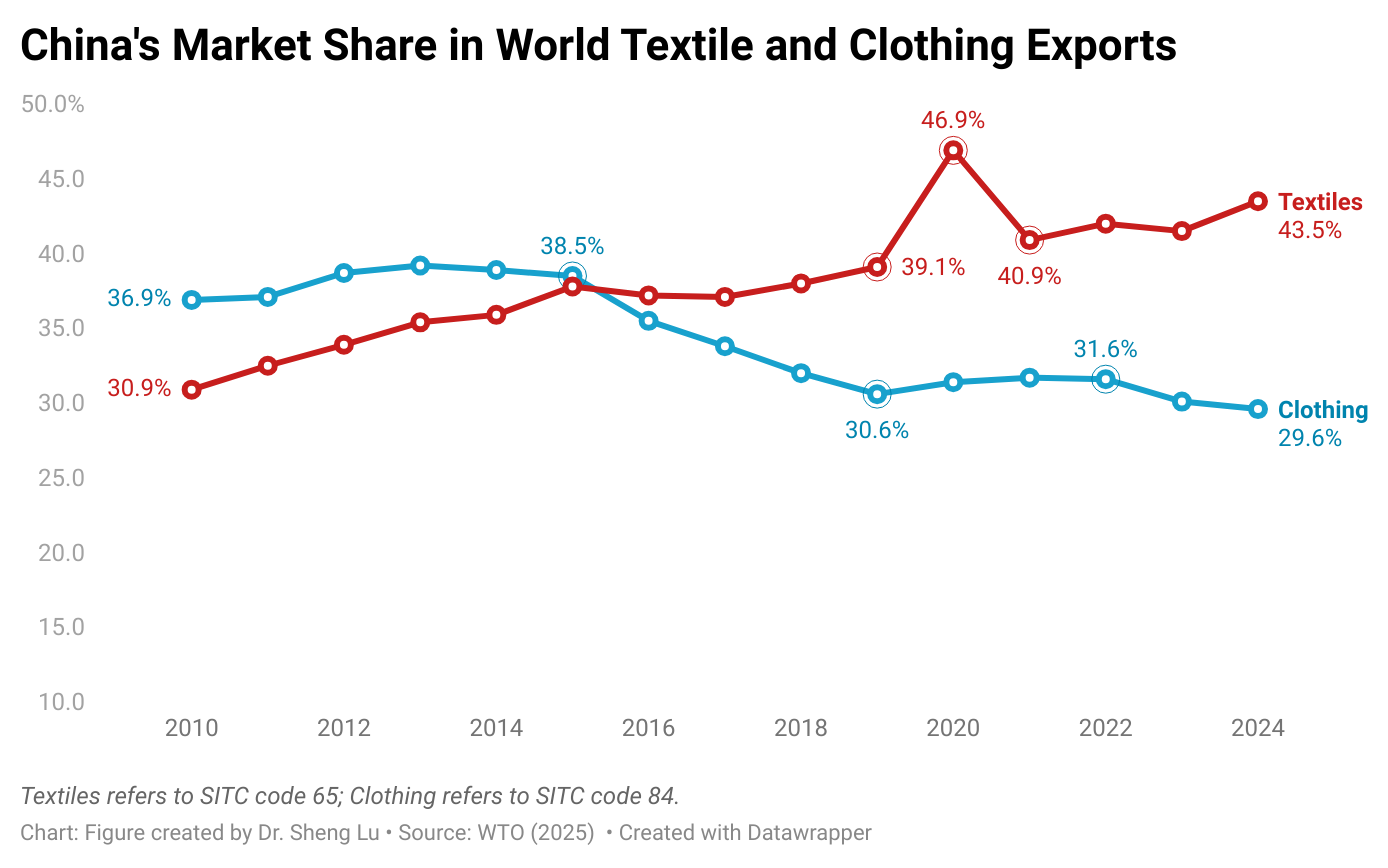
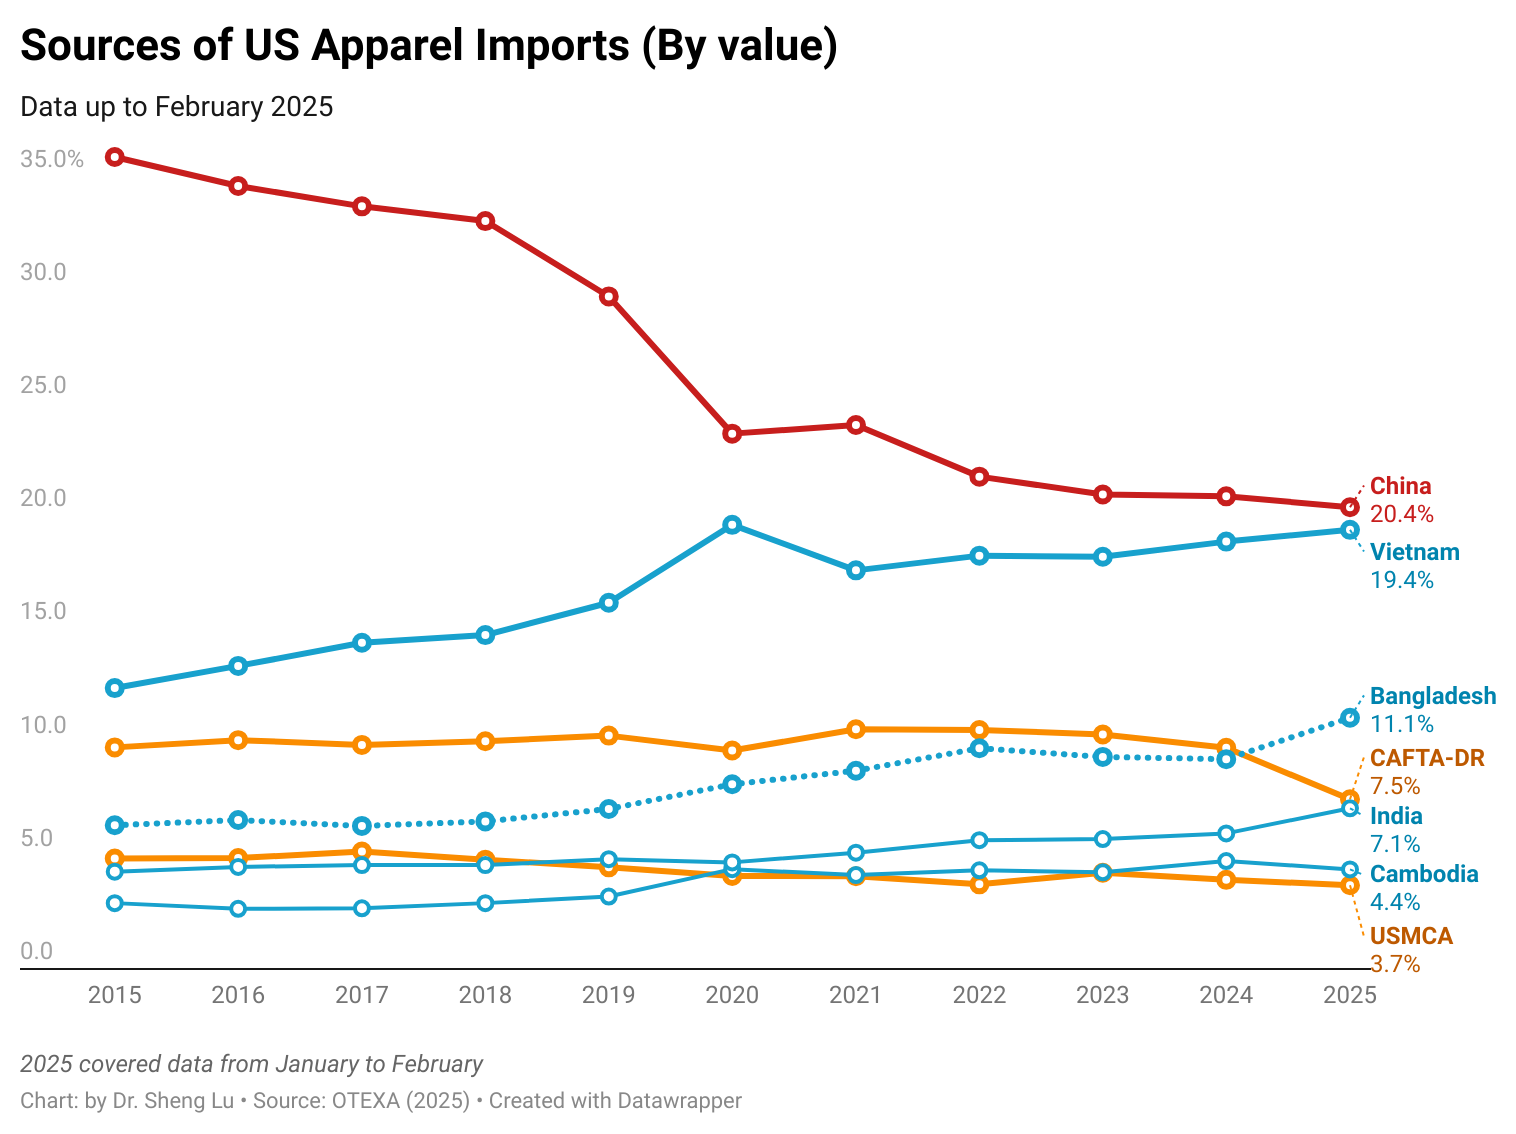
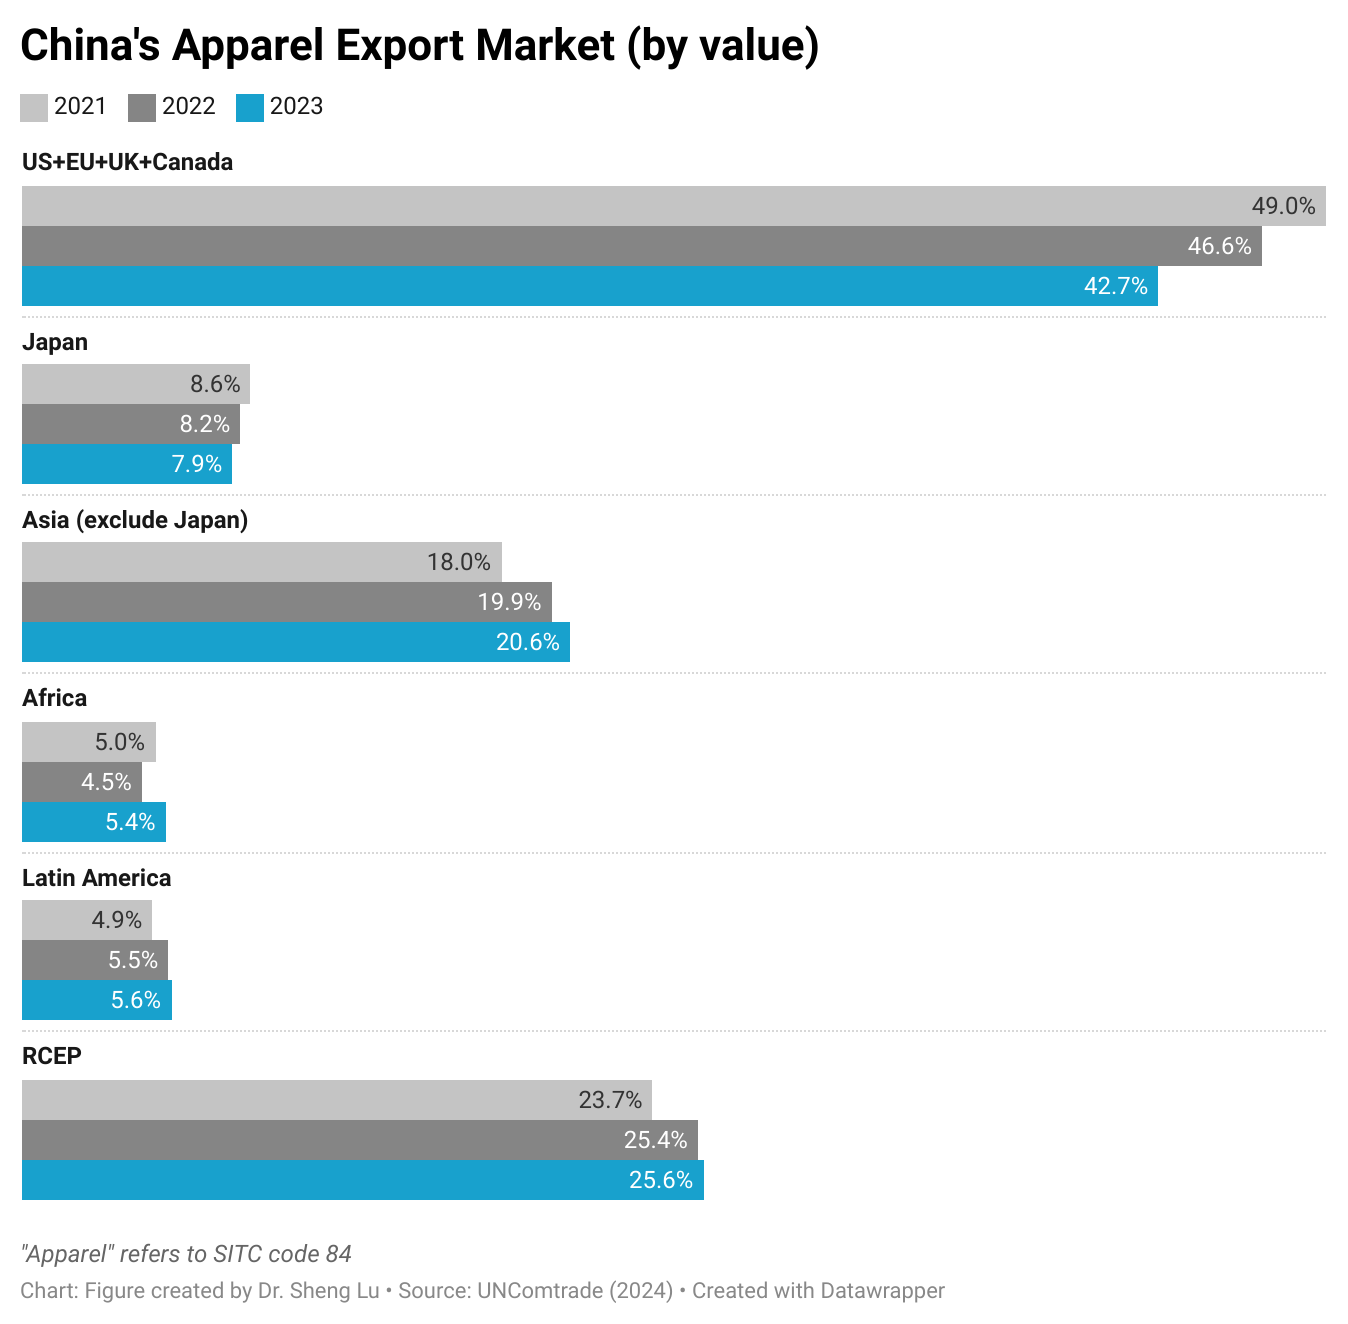
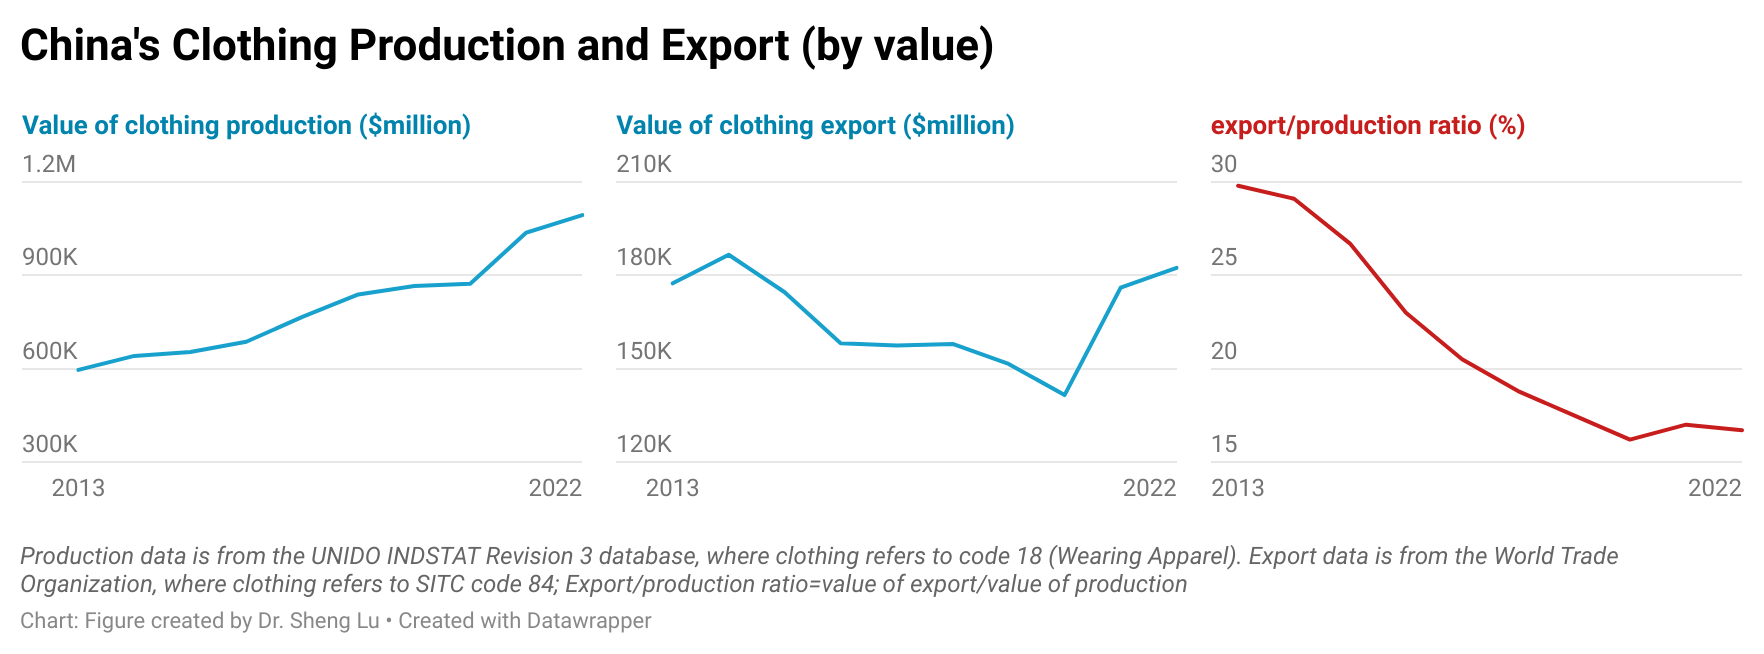
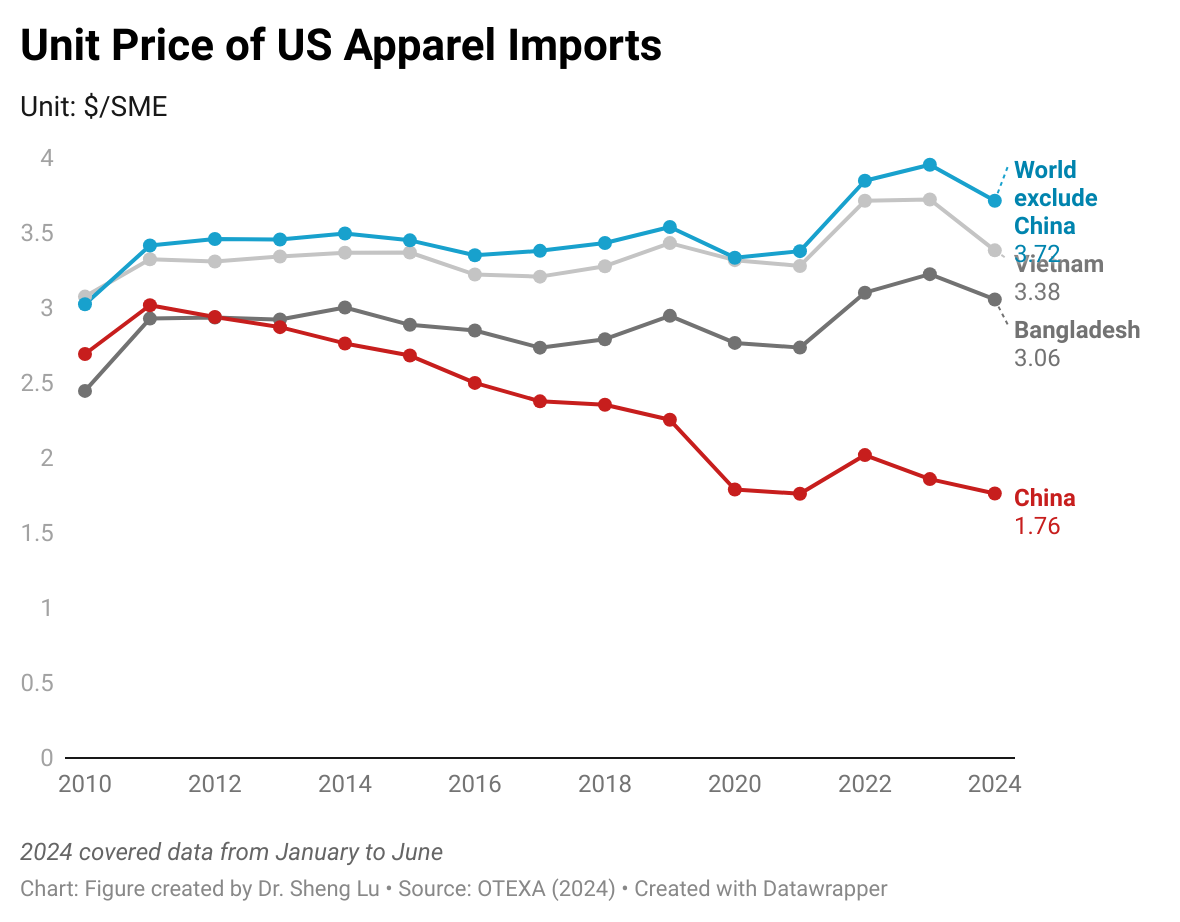
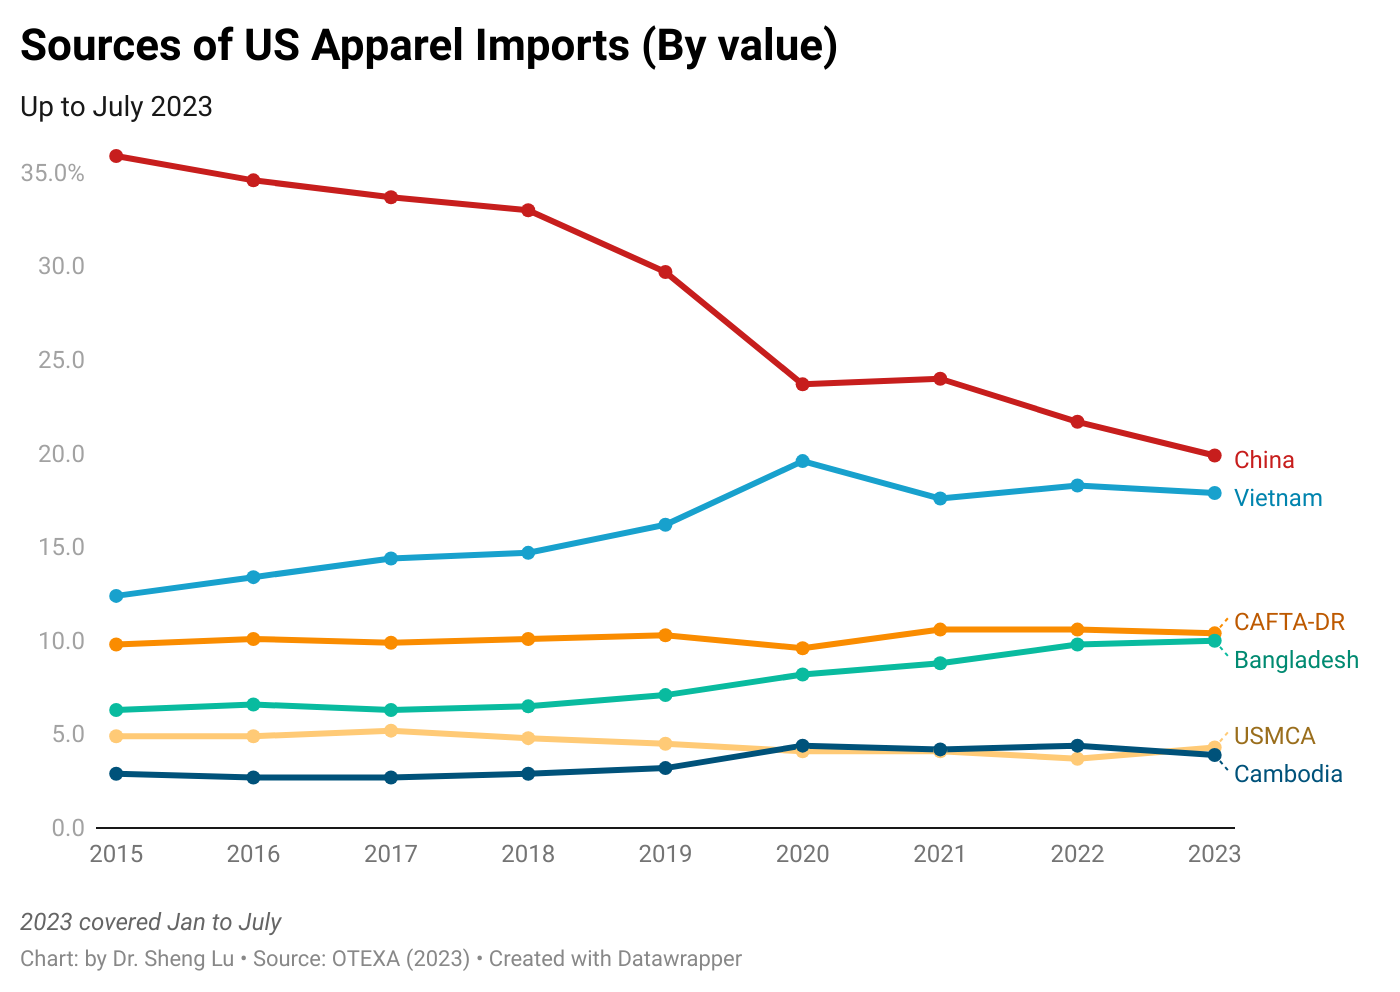
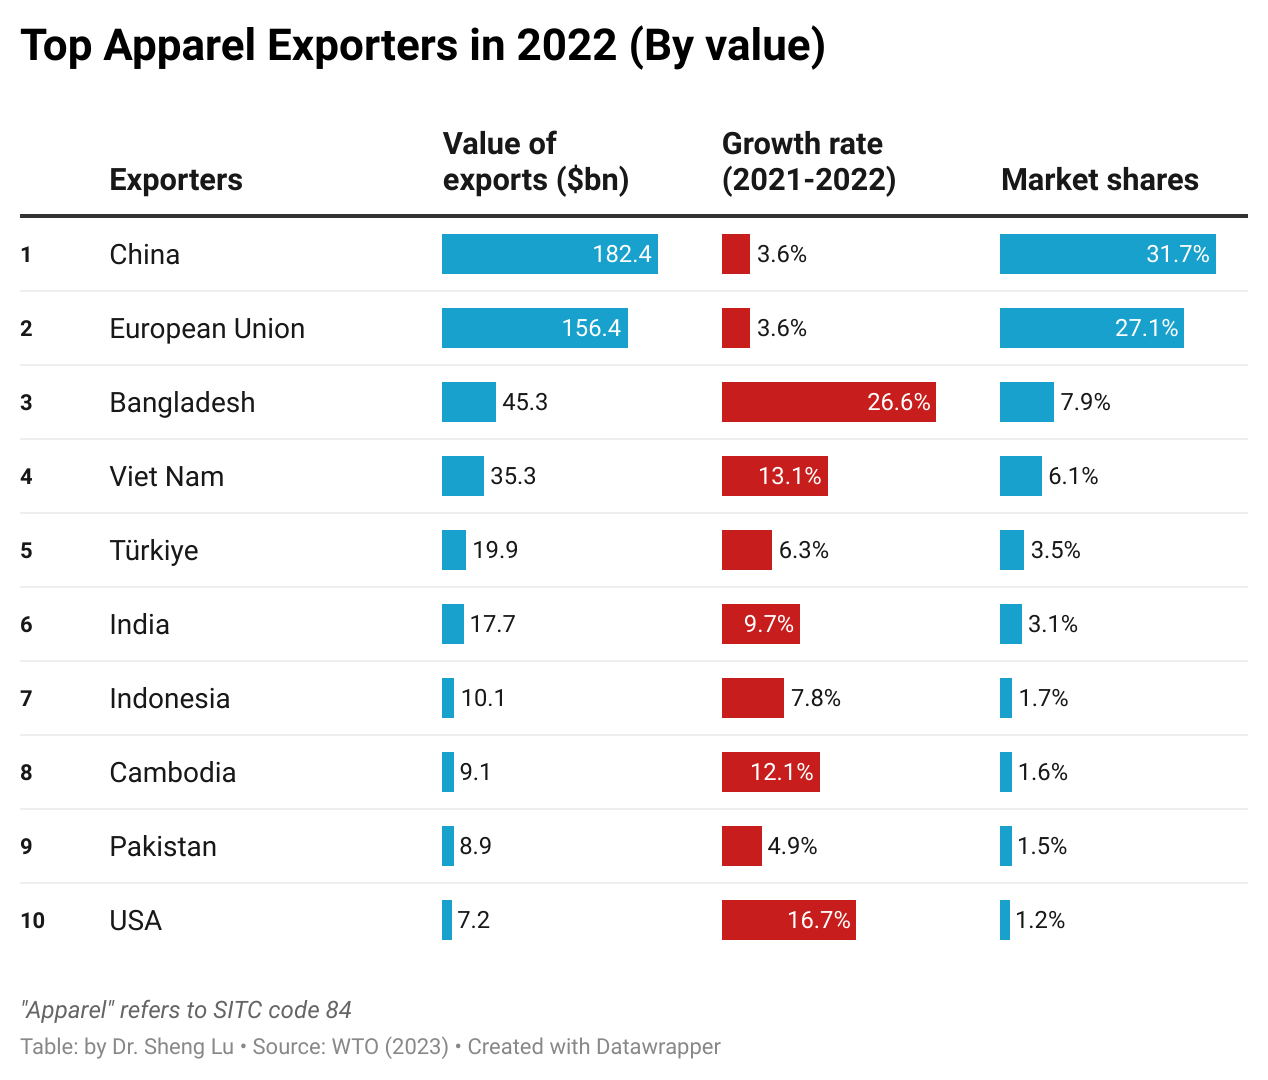
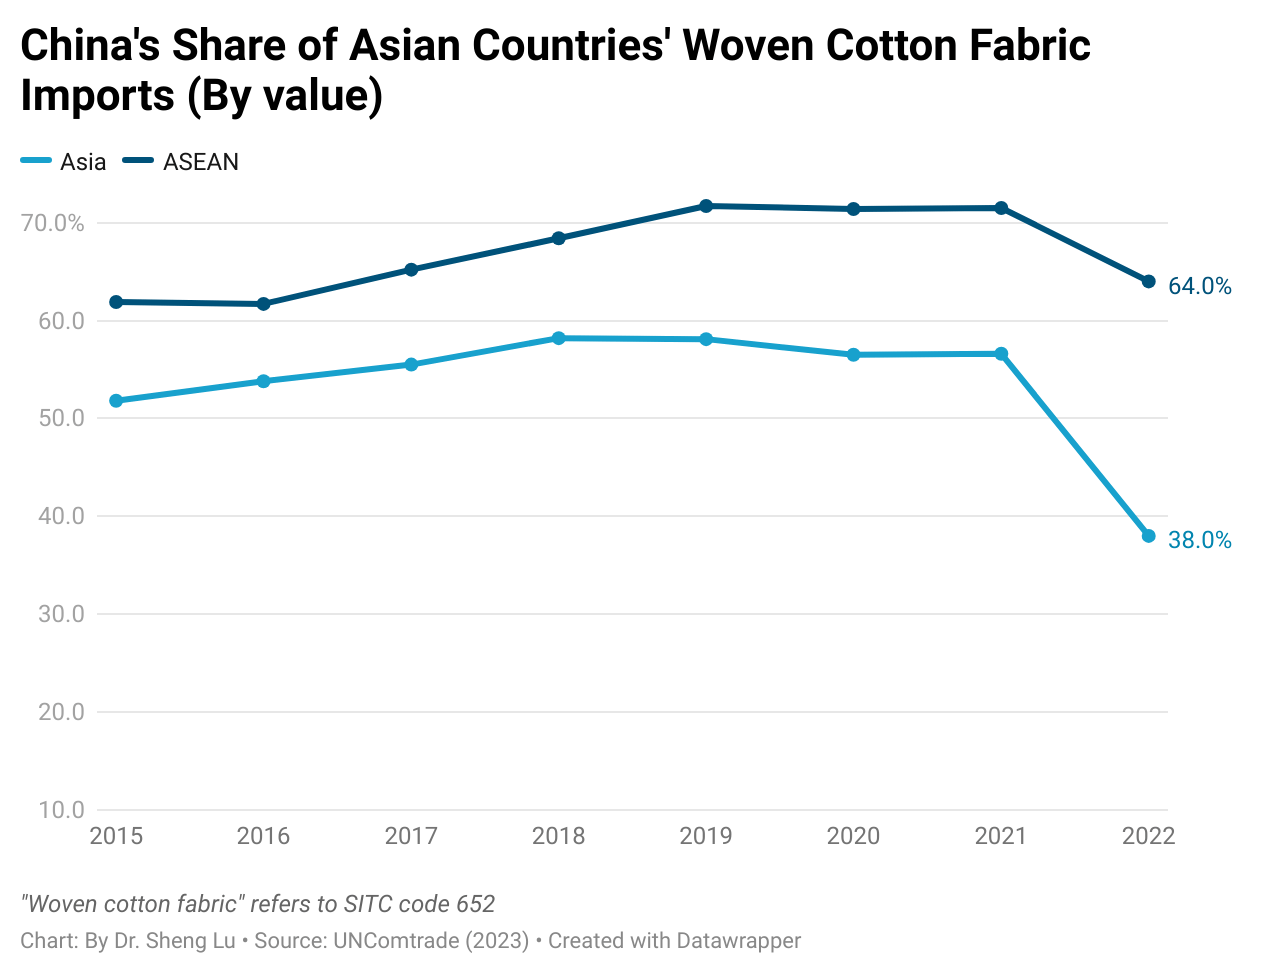
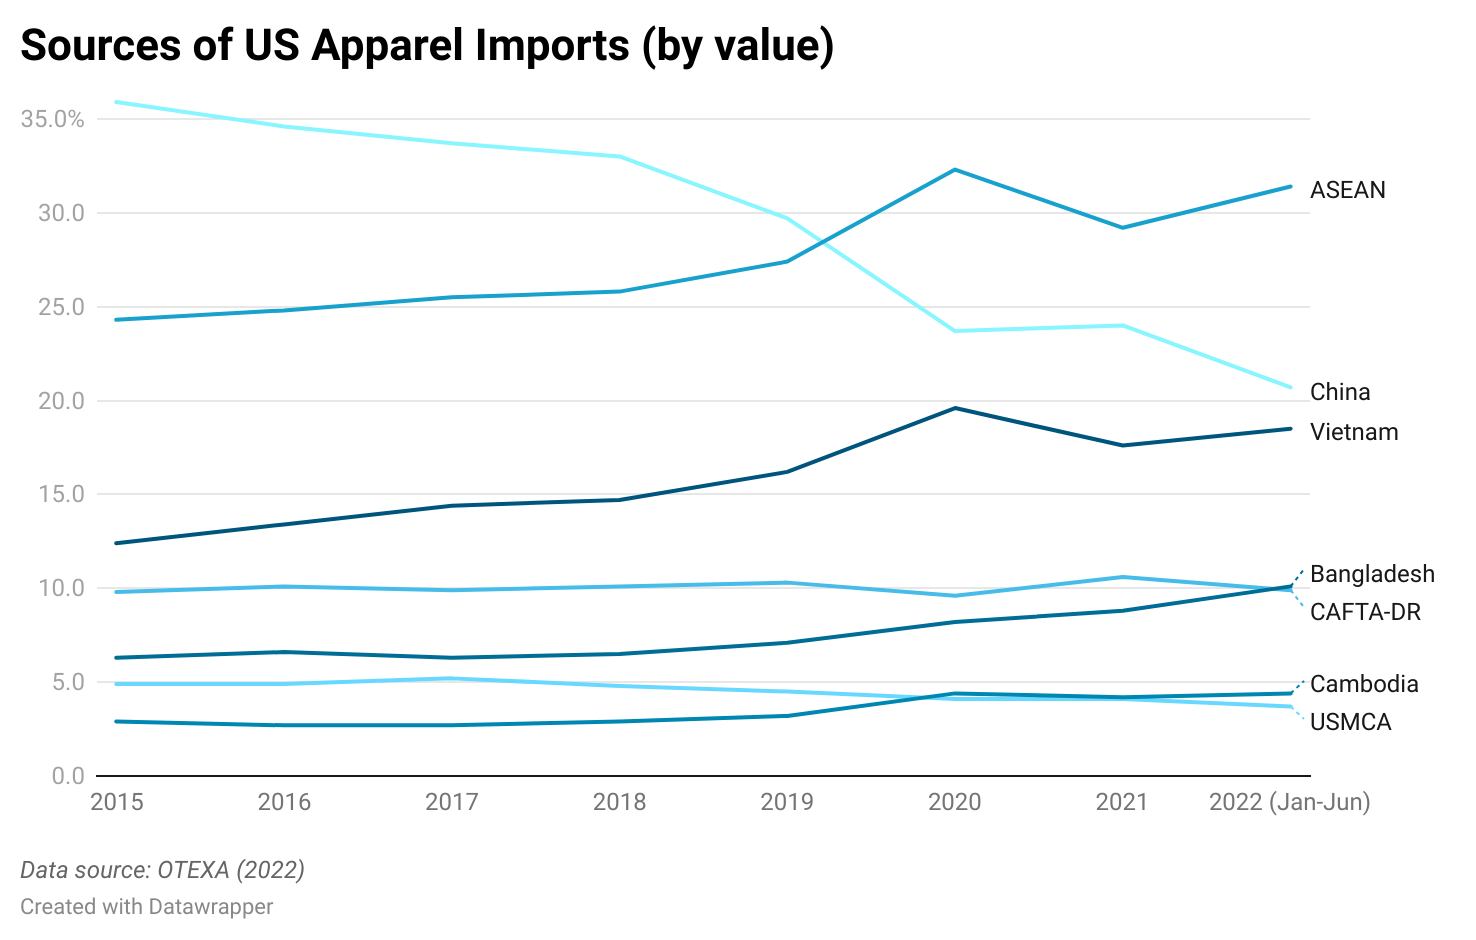
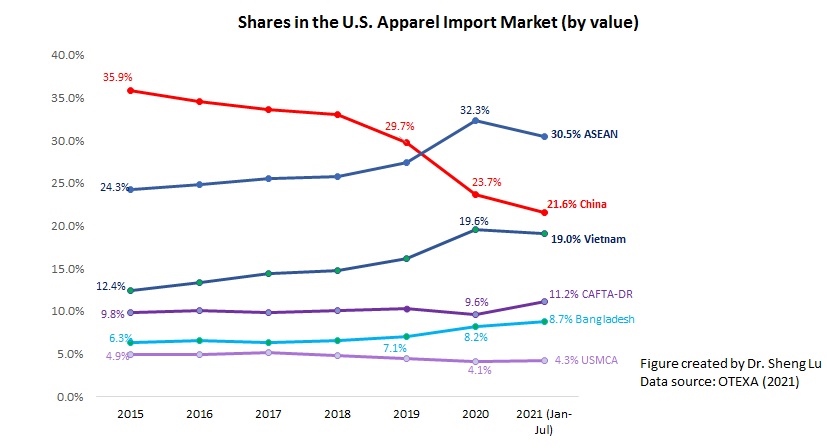
- China’s role in respondents’ sourcing portfolios continued to decline in 2026. Only 12 percent of respondents sourced more than 30 percent of their apparel products from China, while most companies sourced less than 10 percent from the country. Trade data similarly show that China’s share of U.S. apparel imports fell below both Vietnam and Bangladesh for the first time in decades. [Click here for the next 2-year data]
- At the same time, the survey suggests that sourcing from China may be becoming relatively more stable. Rather than accelerating efforts to exit China, many respondents appear to have already reached their target exposure levels and are increasingly focused on optimizing broader sourcing portfolios. Consistent with this finding, respondents continued to recognize China’s strong competitiveness in sourcing costs, flexibility, minimum order quantity requirements, and vertical manufacturing capability.
- The results further indicate that non-economic factors, including geopolitical tensions, concerns about future U.S. trade restrictions, and forced labor risks, remain the primary drivers of continued de-risking efforts rather than concerns about manufacturing capability or sourcing costs.
While there has been a slight increase in domestic sourcing and nearshoring as part of U.S. fashion companies’ sourcing diversification strategy, capacity building and a stable policy environment remain critical for continued sourcing expansion.
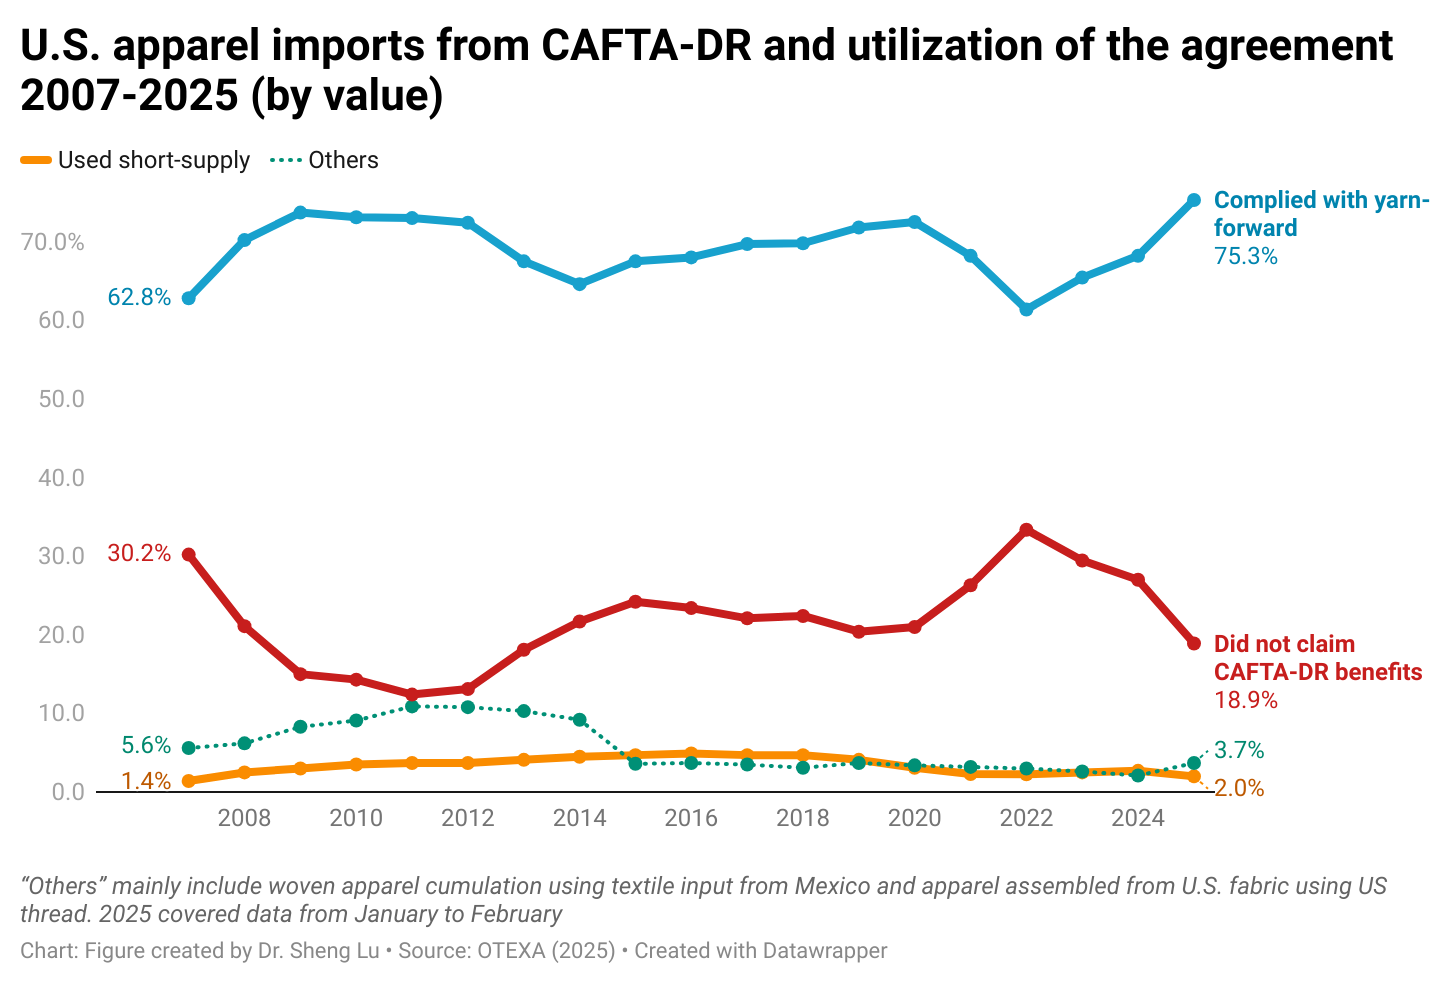
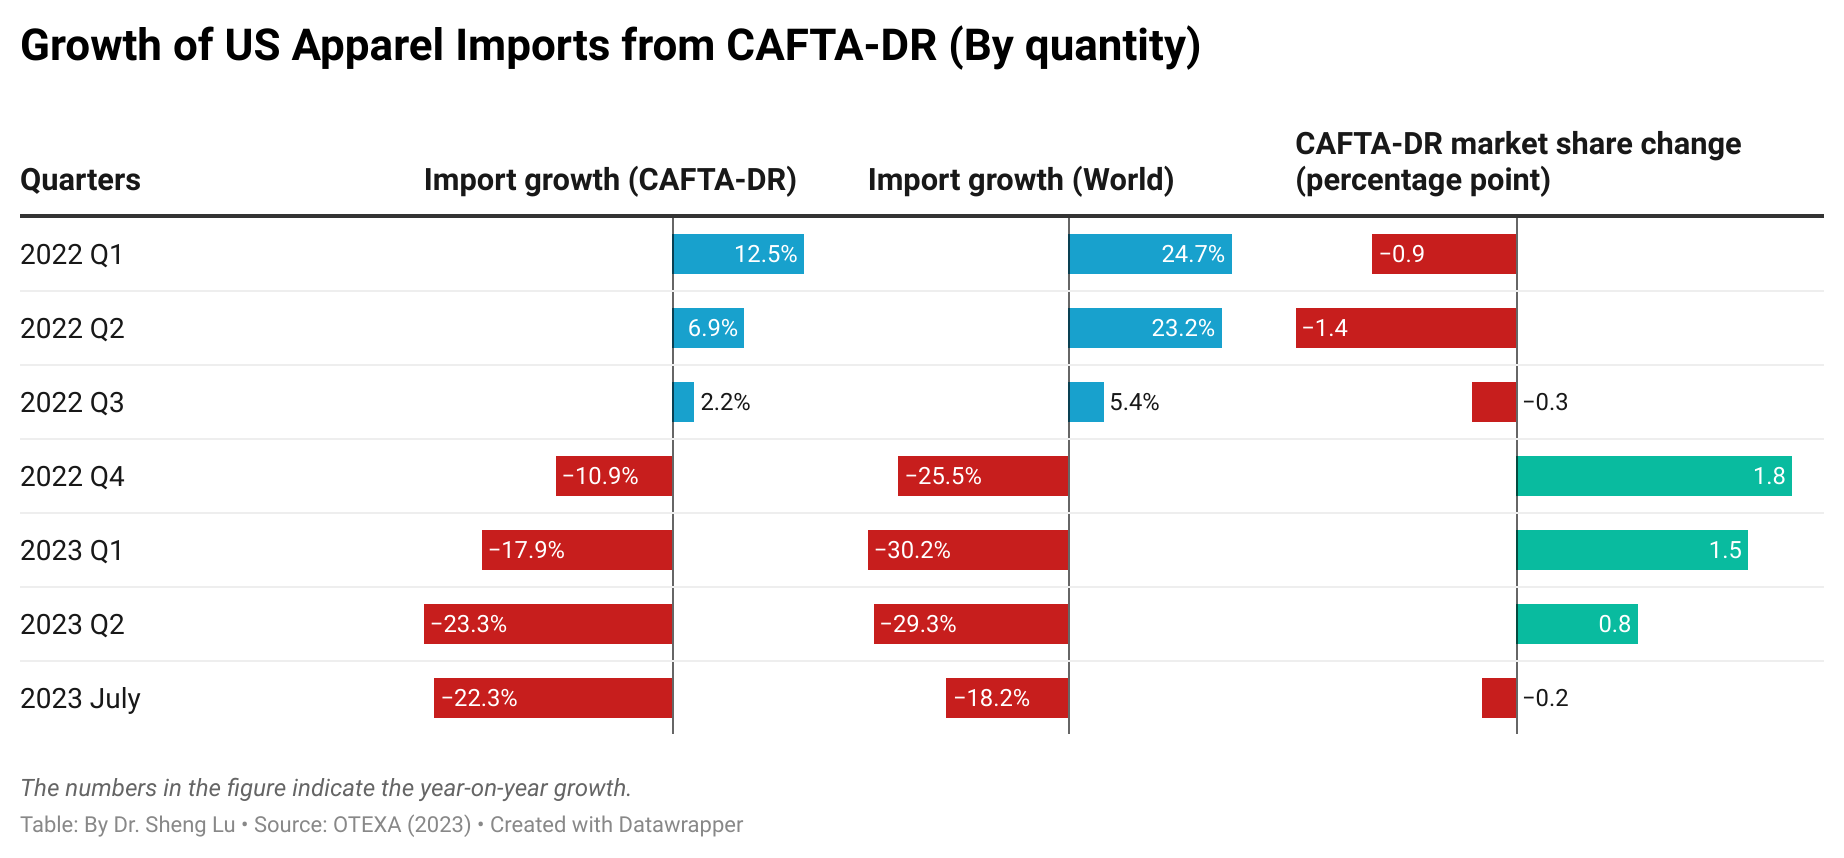
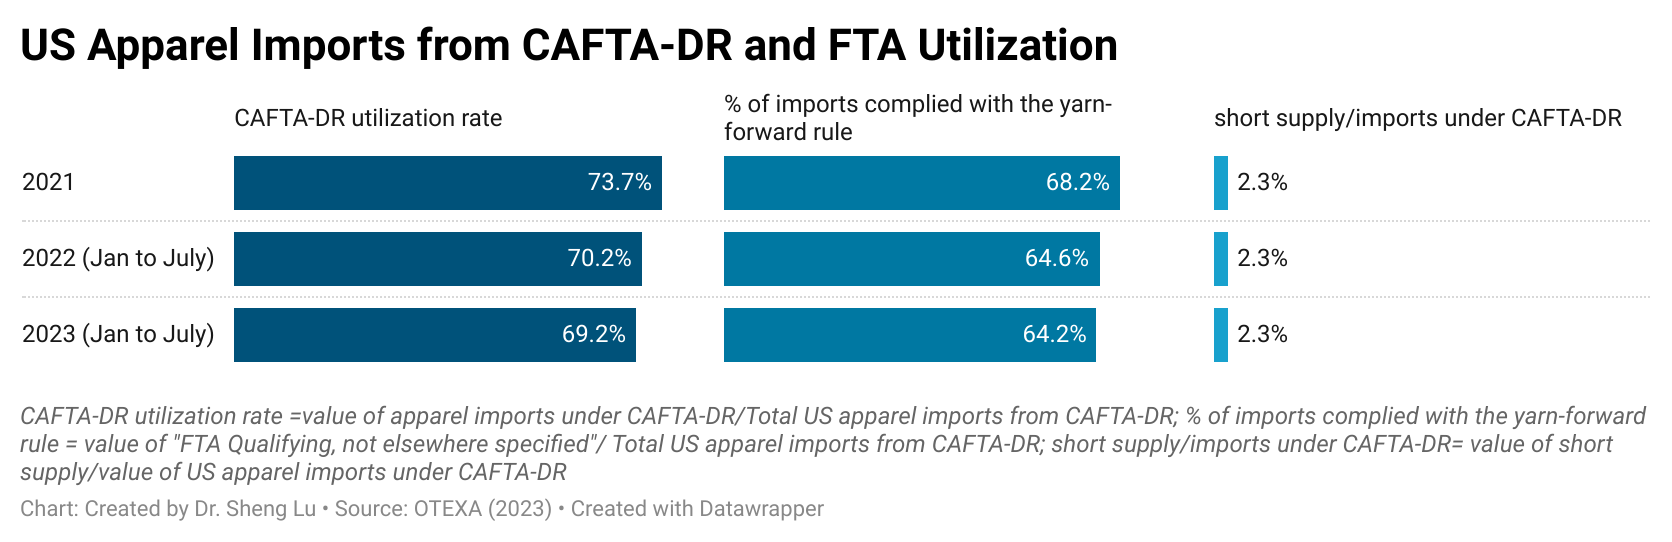
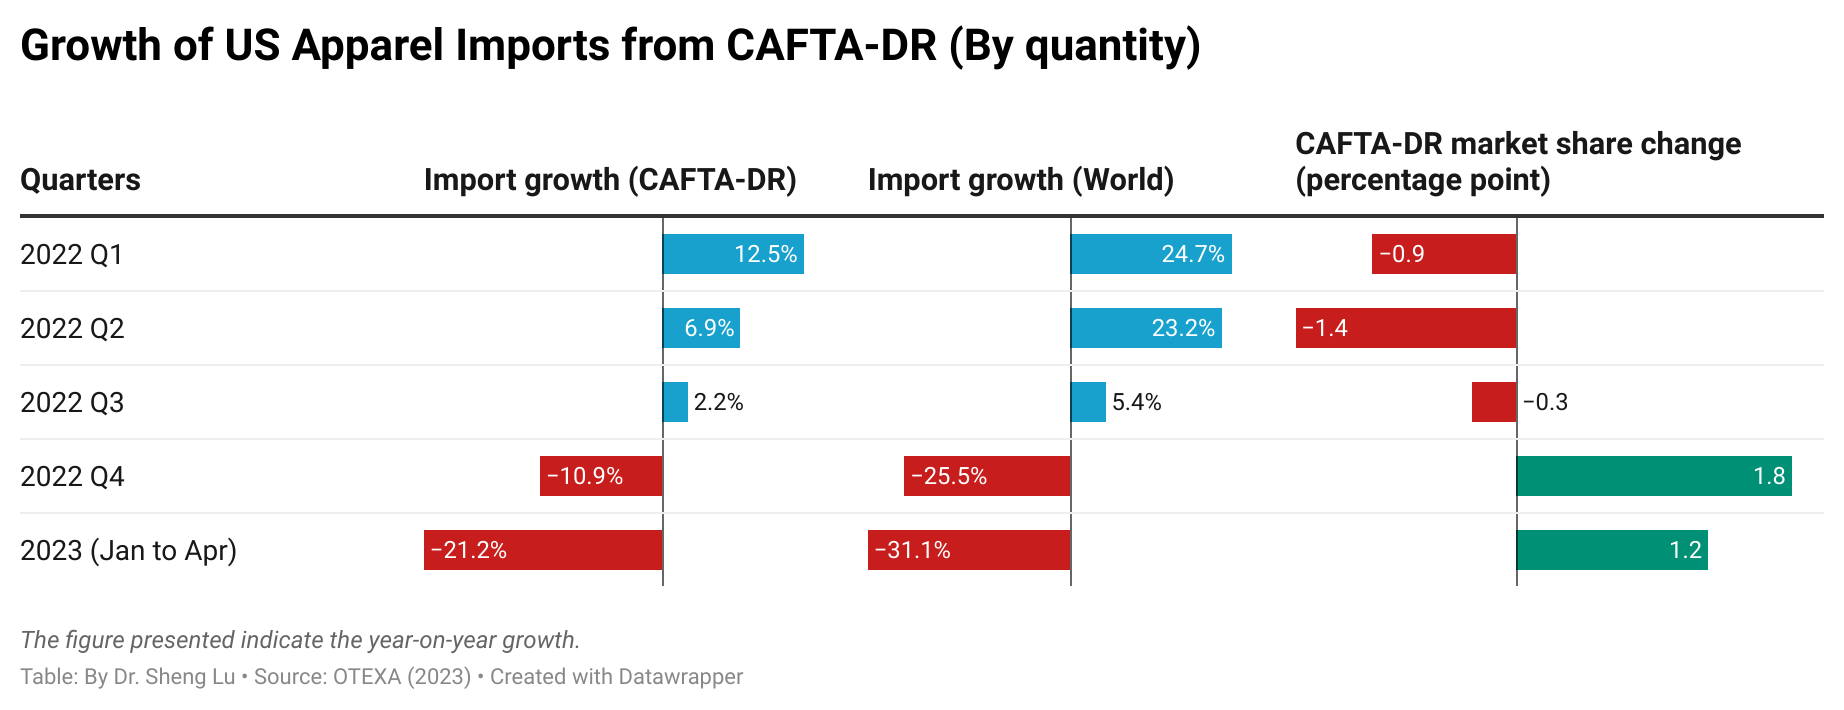
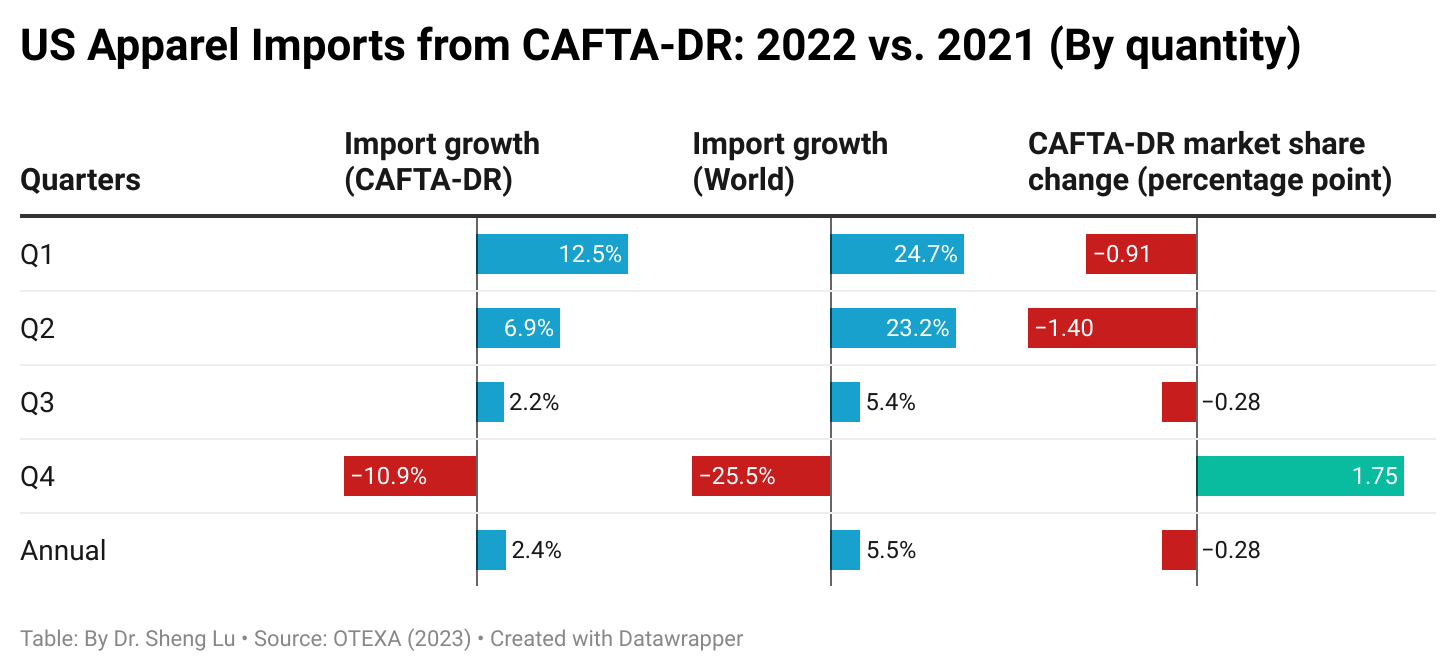
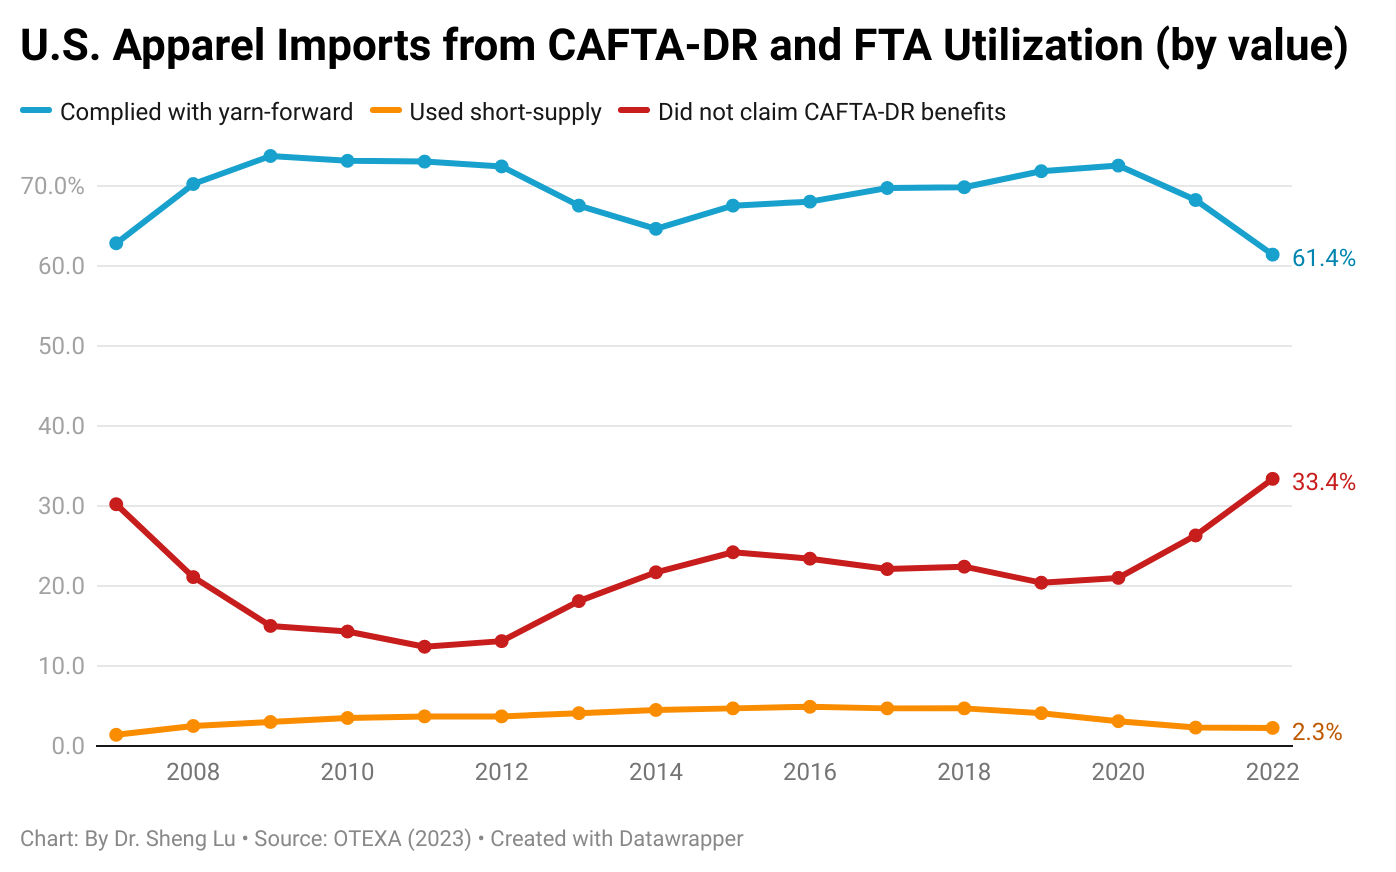
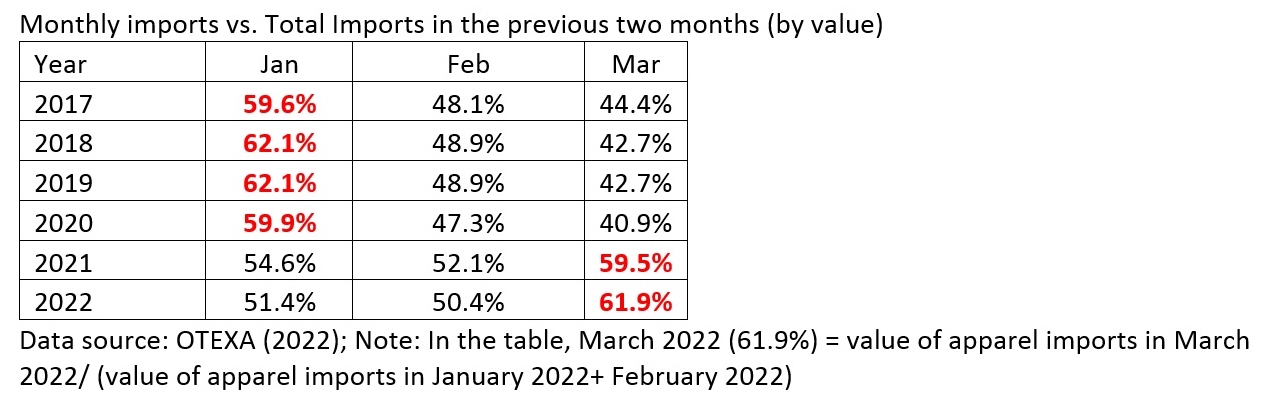
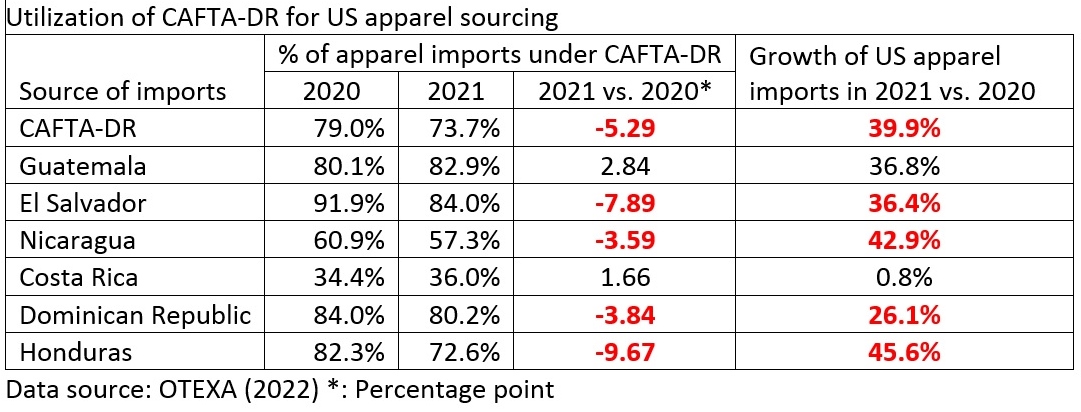
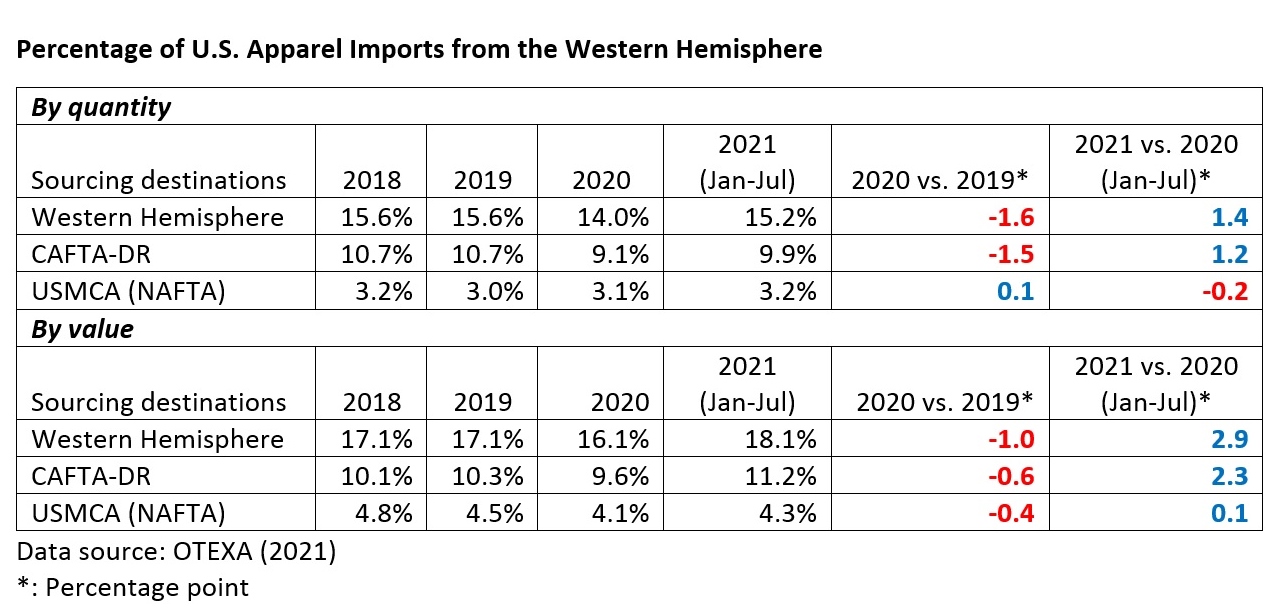
- 76 percent of respondents sourced apparel from members of the Dominican Republic-Central America Free Trade Agreement (CAFTA-DR) this year, up from 64 percent in 2025, and 24 percent sourced more than 10 percent of their apparel from the region, concentrated among large companies typically using 2–3 members such as Guatemala, El Salvador, and Honduras.
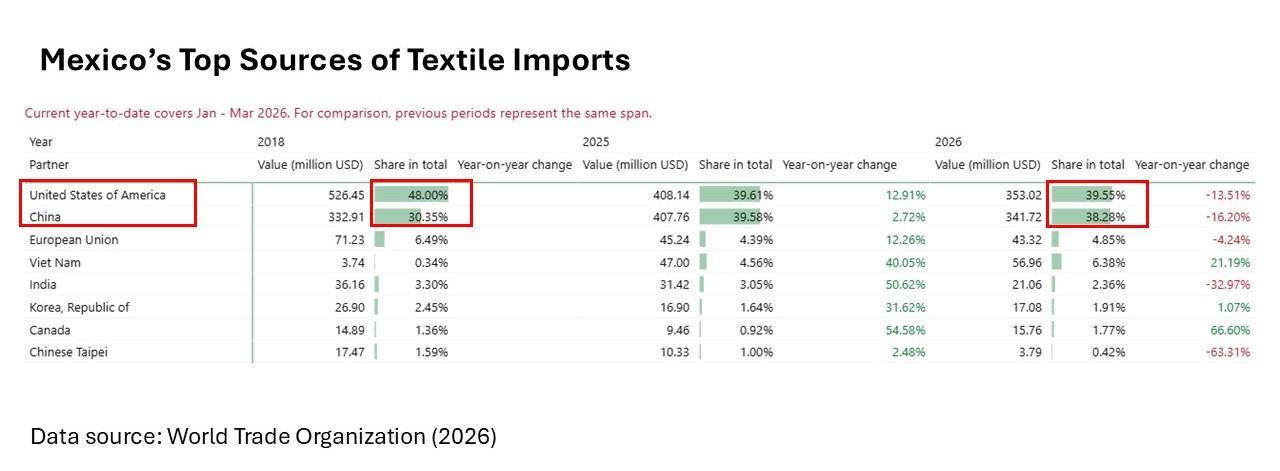
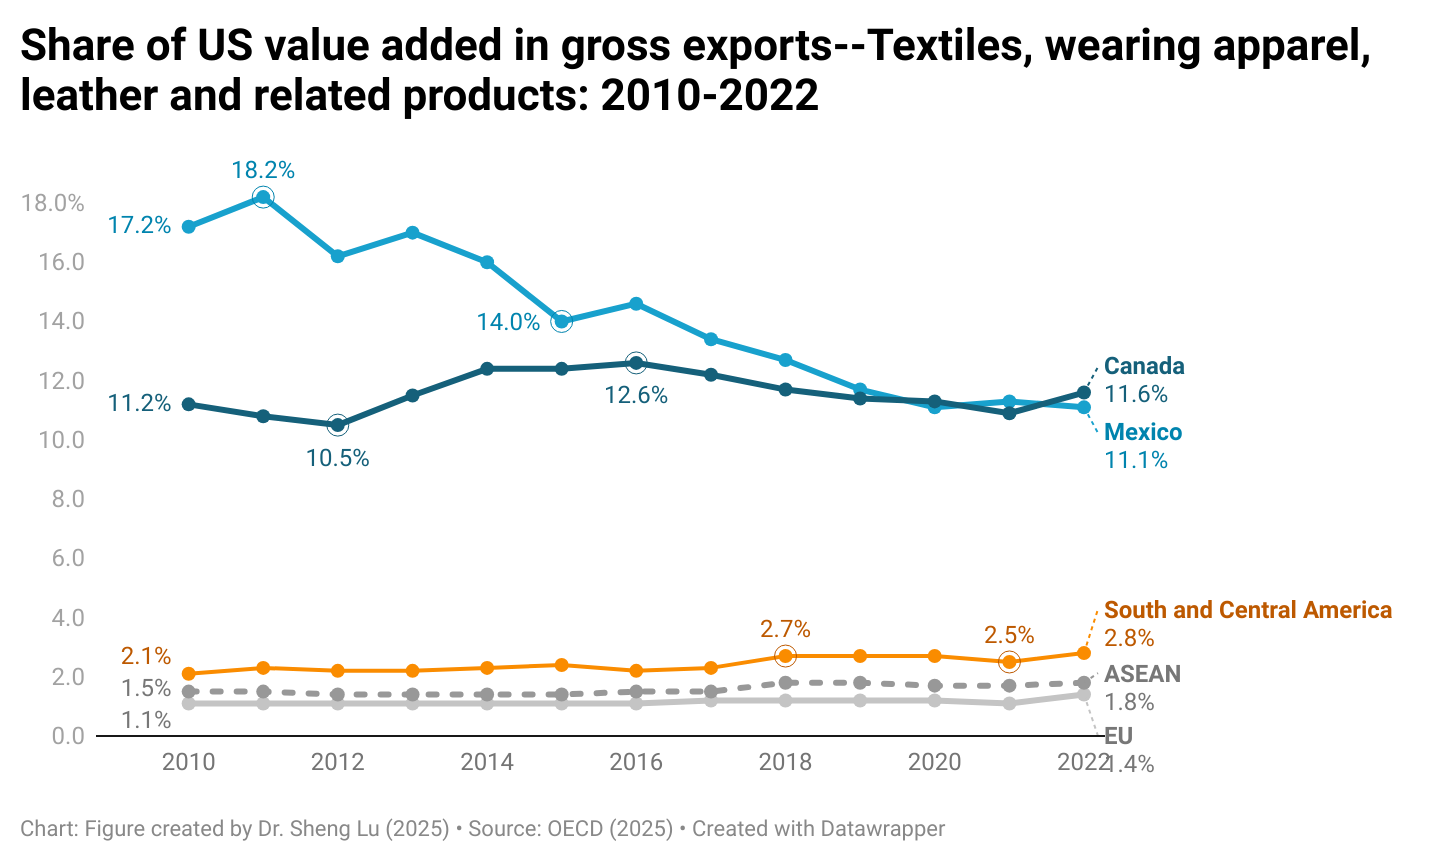
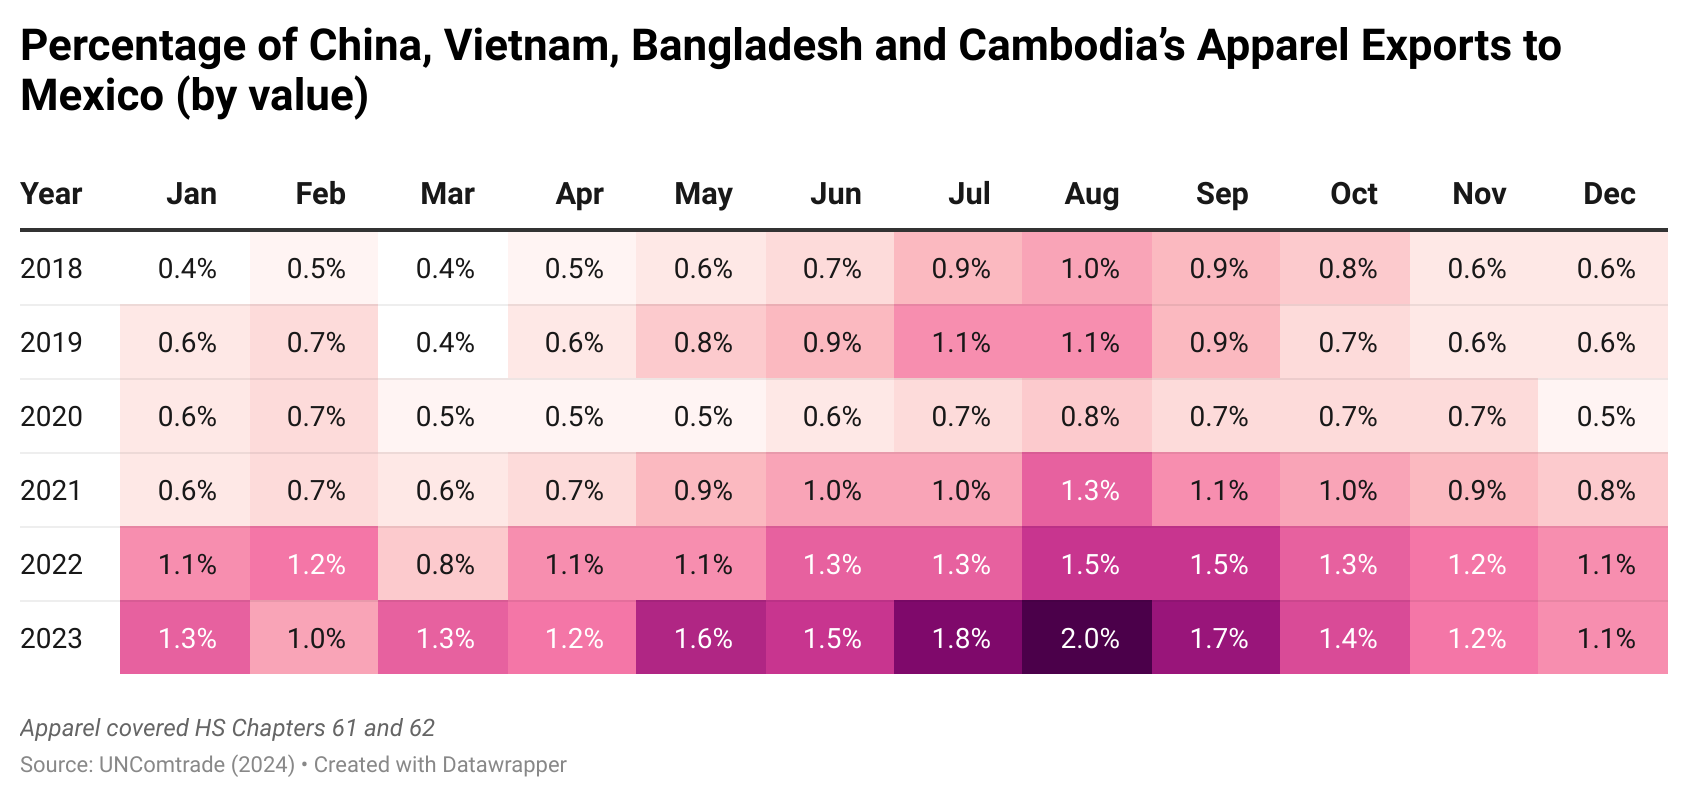
- Respondents’ sourcing from members of the U.S.-Mexico-Canada Trade Agreement (USMCA), mainly from Mexico, held steady in 2026. However, respondents were hesitant to increase sourcing from the region due to concerns about the agreement’s uncertain future.
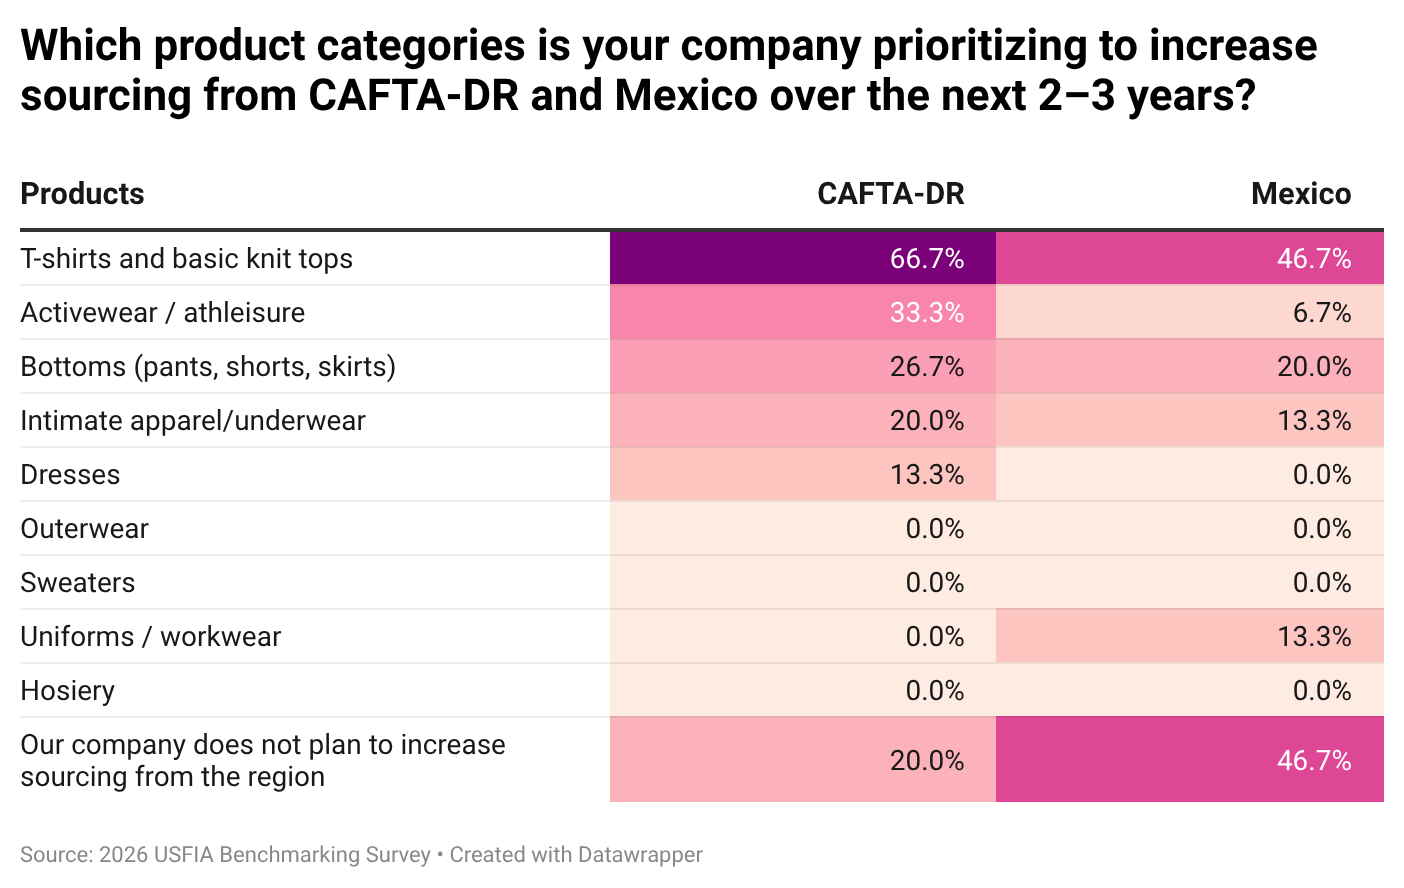
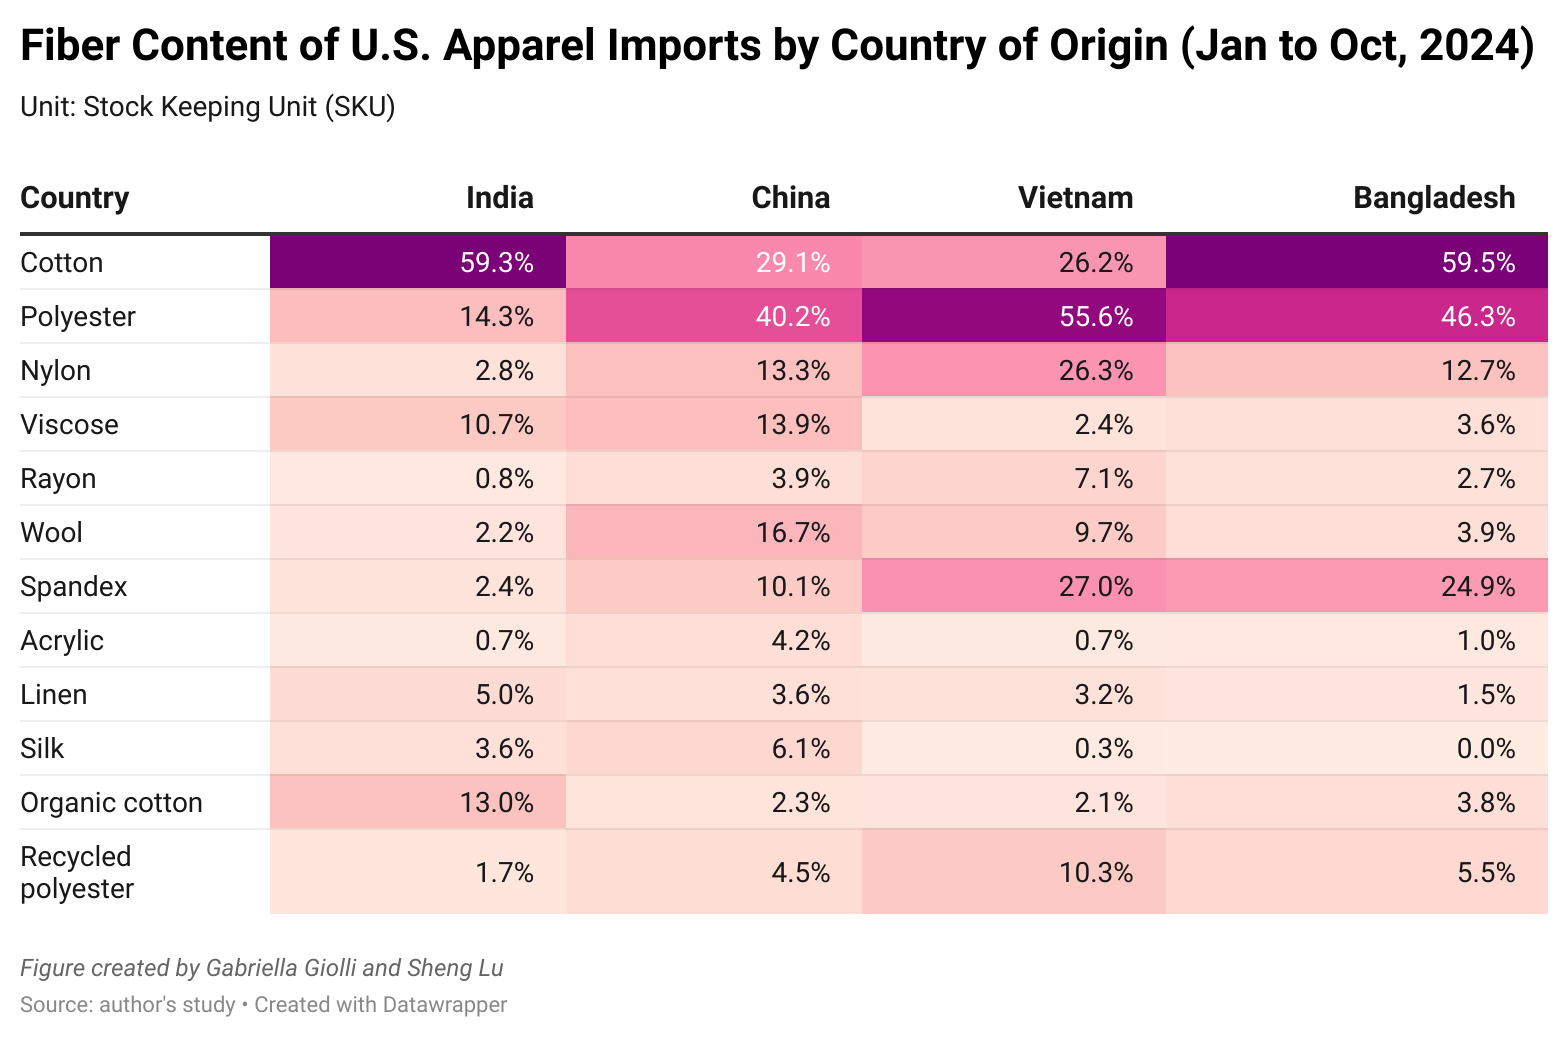
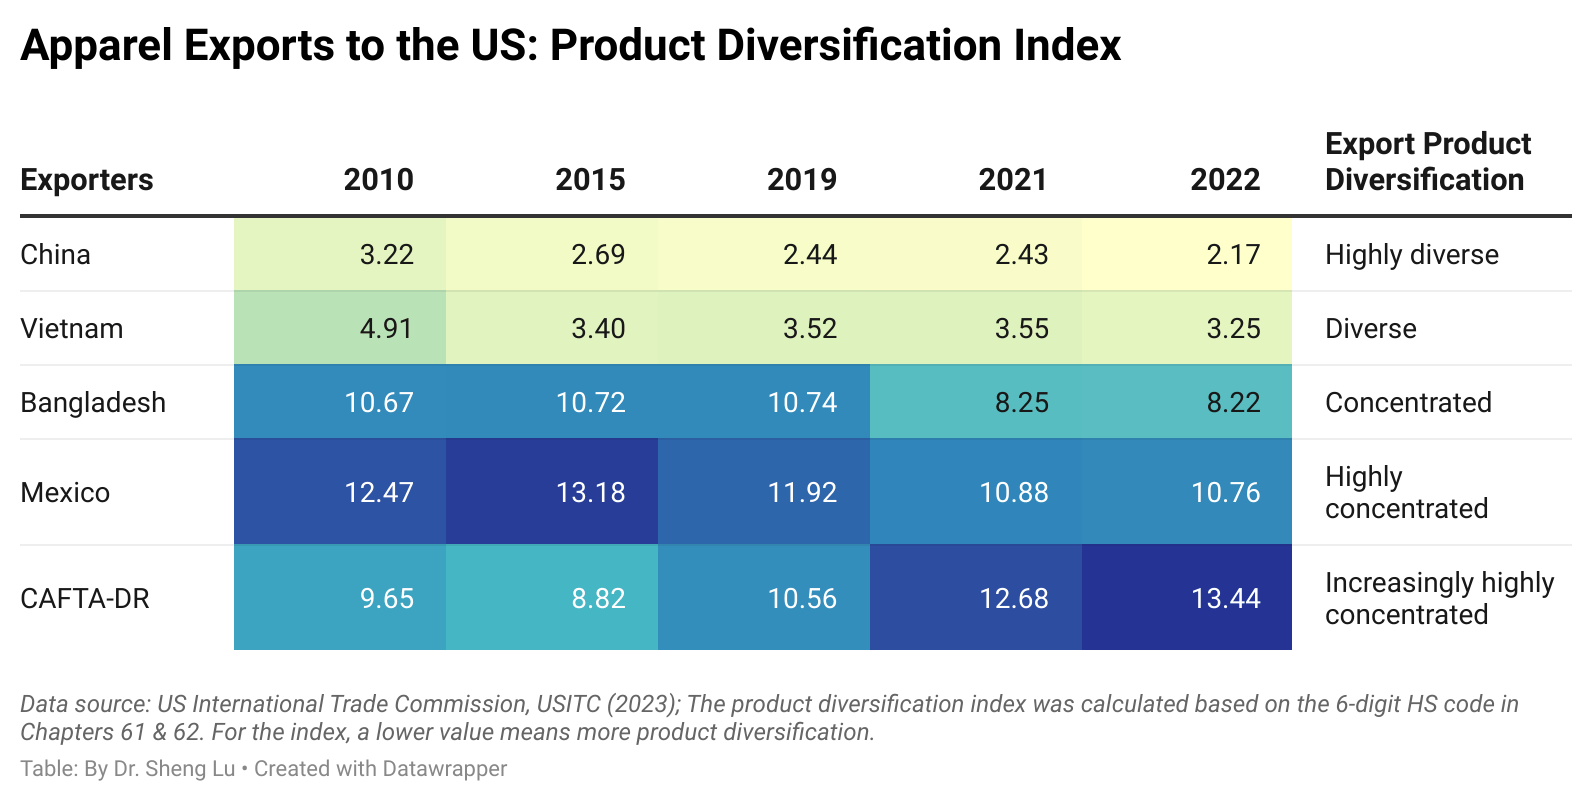
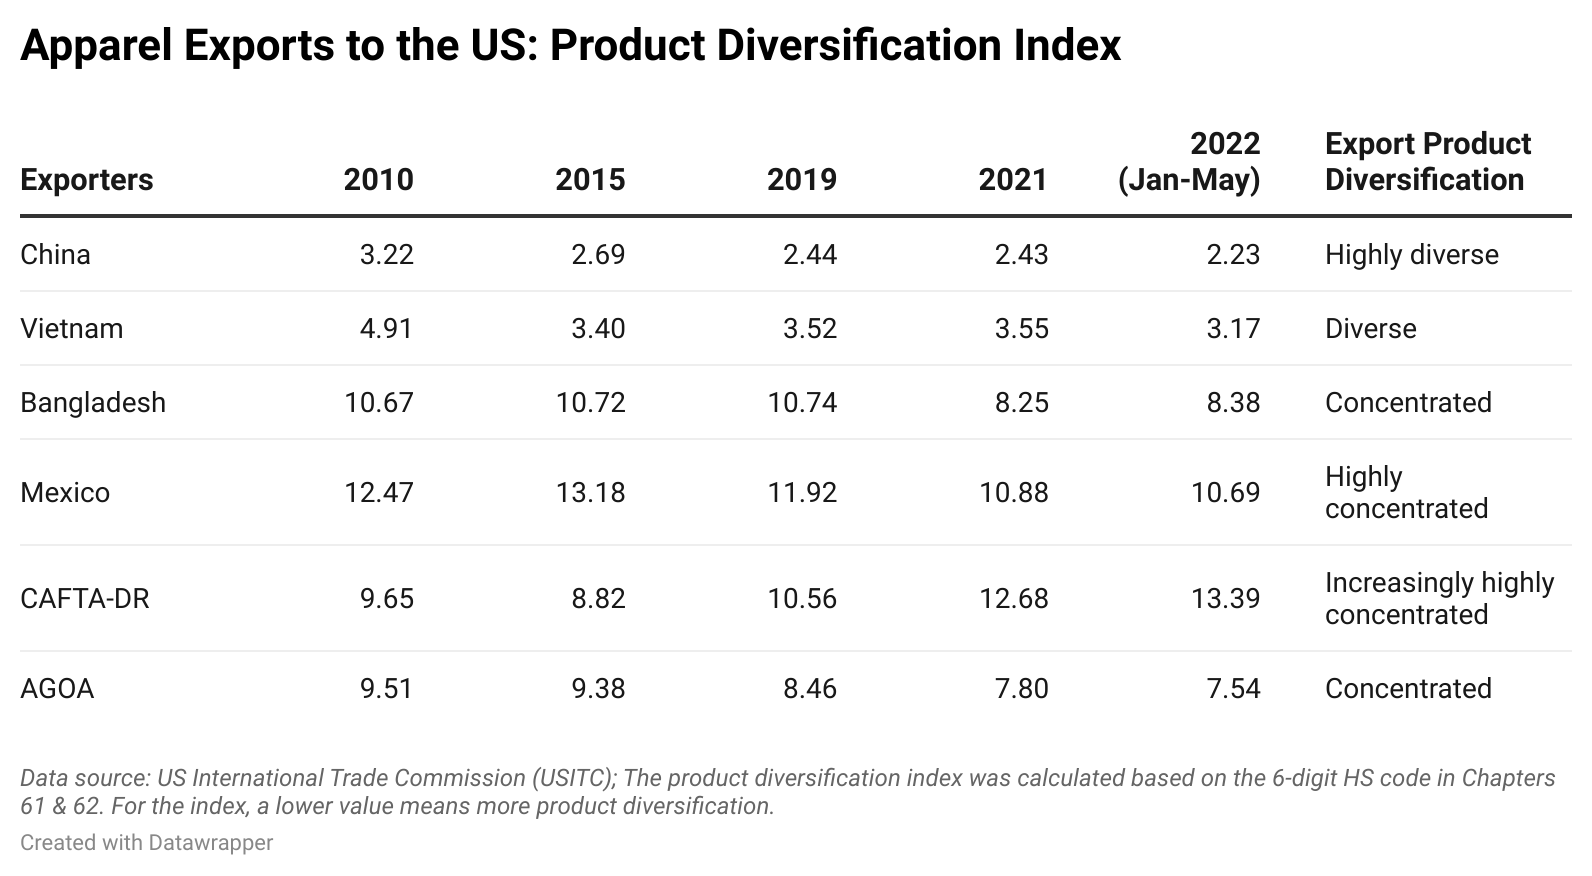
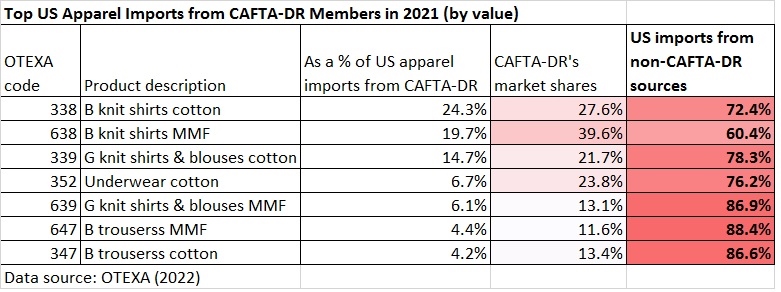
- Over the next 2–3 years, respondents plan to continue concentrating their apparel sourcing from the Western Hemisphere in a relatively narrow range of product categories, including T-shirts (67 percent), activewear and athleisure (33 percent), and bottoms (27 percent) from CAFTA-DR and T-shirts (47 percent) and bottoms (20 percent) from USMCA. This pattern was consistent with findings from previous surveys and suggested that limited product diversification remained a major constraint on the future growth of U.S. apparel sourcing from the Western Hemisphere.
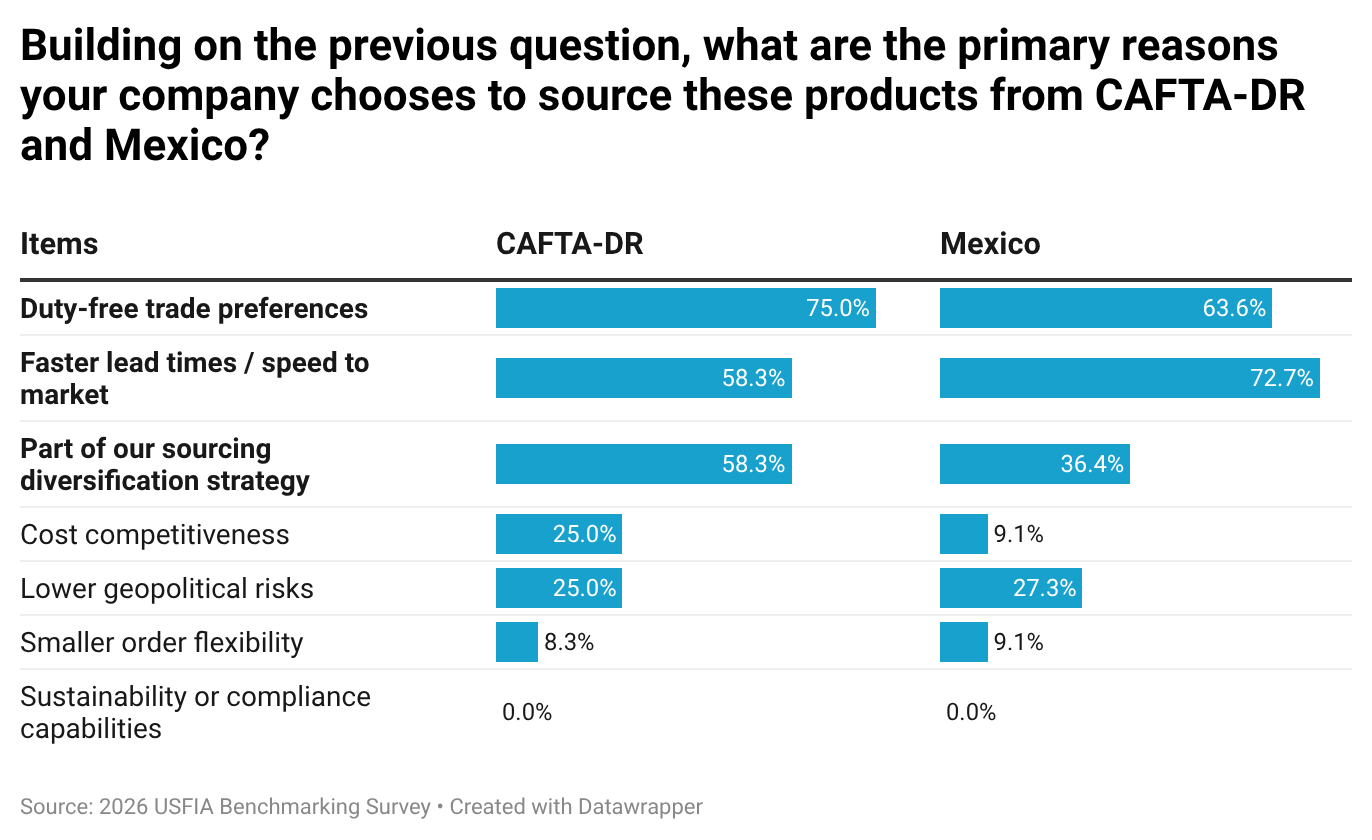
- Most respondents (over 65 percent) further indicated that access to duty-free benefits was among the most important incentives for sourcing apparel from CAFTA-DR members and Mexico. This finding underscores that exempting CAFTA-DR and USMCA-qualified apparel products from additional tariffs imposed by the Trump administration and avoiding policy uncertainty will be essential to supporting U.S. fashion companies’ nearshoring efforts under the current business environment. Additionally, 100 percent of respondents support maintaining the USMCA as a trilateral agreement.
The African Growth and Opportunity Act (AGOA) remains an important sourcing platform for U.S. fashion companies, but uncertainty about its future has contributed to more cautious sourcing decisions this year. While the program continues to support duty-free apparel exports from Sub-Saharan Africa, a short-term renewal will not be sufficient to encourage long-term investment and sourcing expansion in the region.
- U.S. apparel imports from AGOA members have become more volatile in 2026 amid uncertainty over the program’s future. This year, respondents sourced from only five SSA and AGOA members (i.e., Kenya, Ethiopia, Madagascar, Mauritius, and Togo), fewer than six countries in 2025 and seven in 2024. And none of these countries were used by more than 15 percent of respondents.
- Respondents continued to show strong support for AGOA and its long-term renewal. More than half indicated that a long-term renewal of at least ten years is essential for companies and supply chain partners to invest in capacity and expand sourcing from the region. Respondents also emphasized the importance of maintaining flexible rules of origin, including the “third-country fabric” provision, given the limited textile manufacturing capacity in many AGOA beneficiary countries.
Regulatory compliance, sustainability, circularity, and supply chain transparency have become increasingly important drivers of sourcing decisions in 2026.
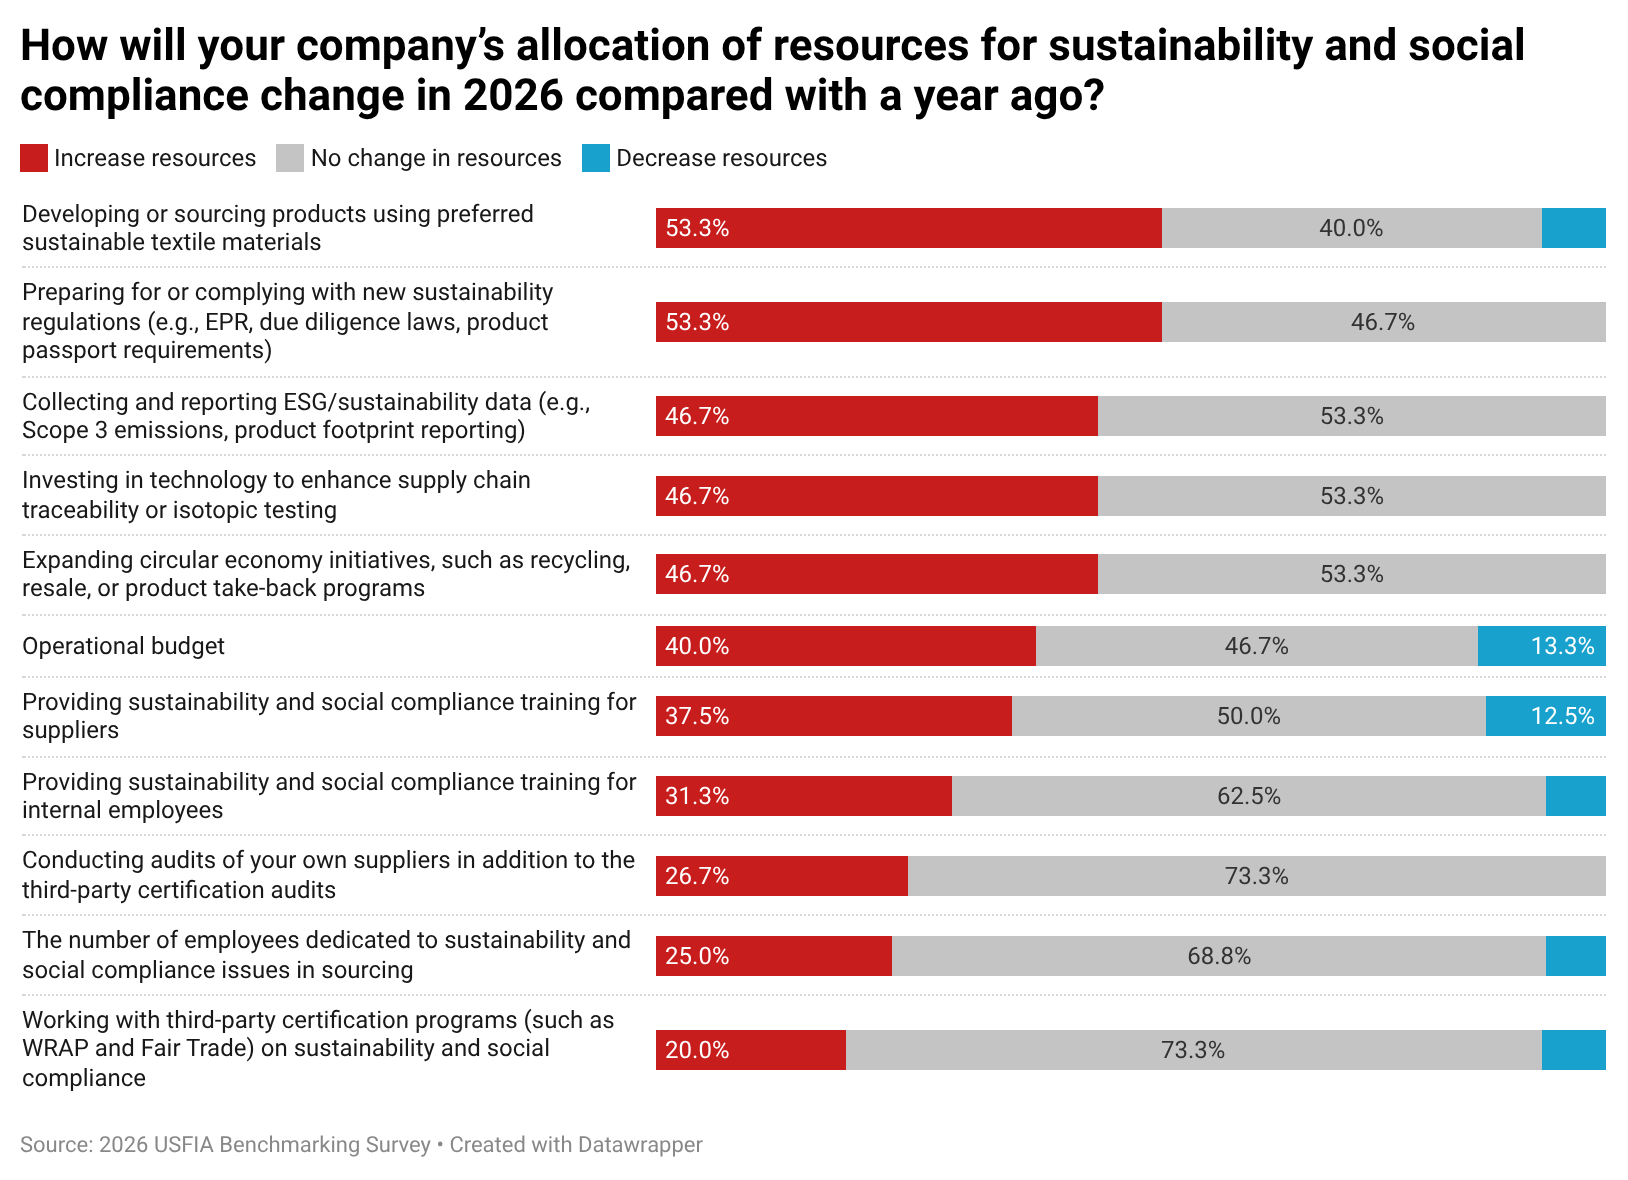
- Despite ongoing cost pressures, nearly three-quarters of respondents plan to allocate more resources to sustainability, social responsibility, and compliance initiatives. Compared with previous years, companies increasingly focus on preparing for new sustainability regulations, strengthening supply chain traceability, improving ESG data collection, and supporting circular business models. [Click for detailed data]
- Extended Producer Responsibility (EPR) and related circular economy regulations emerged as an important new influence on sourcing practices. Most respondents reported that EPR has increased traceability requirements, compliance costs, and supplier documentation expectations. The findings suggest that supplier capabilities in traceability, reporting, recyclability, and circularity are becoming increasingly important sourcing criteria alongside traditional factors such as cost and speed to market.
- Meanwhile, companies continue to strengthen supply chain visibility and due diligence efforts in response to the Uyghur Forced Labor Prevention Act (UFLPA). Compared with 2025, more respondents plan to adopt new technologies for supply chain mapping, collect additional supplier compliance data, and engage with industry associations to navigate evolving enforcement requirements.
AI use could become increasingly prevalent in apparel sourcing as companies seek new technologies to improve operational efficiency and navigate a more complex, uncertain sourcing environment.
- According to respondents, AI tools and their applications have already been integrated into U.S. fashion companies’ apparel sourcing and various business operations. On average, each surveyed company reported using AI for 3 different areas.
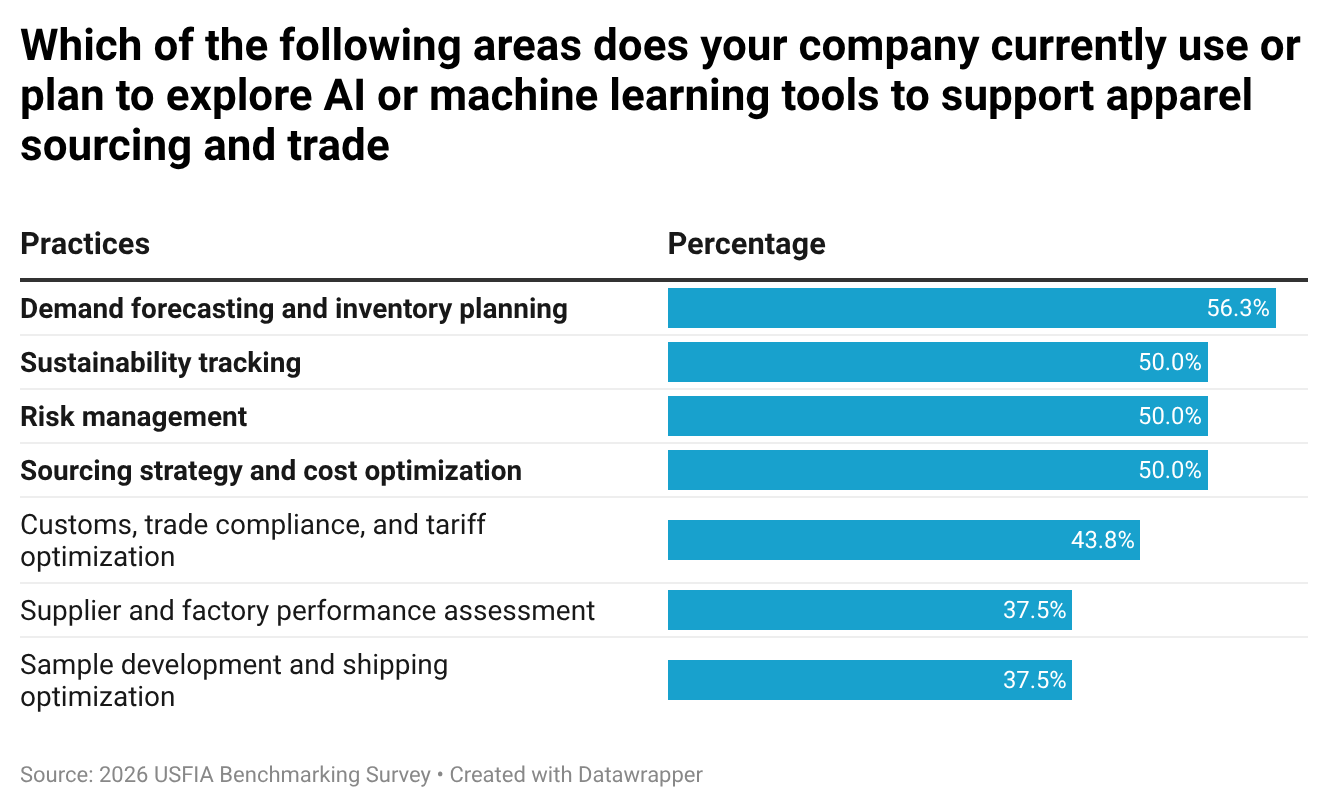
- The most frequently cited AI use was “demand forecasting and inventory planning” (56.3 percent), followed by “sustainability tracking, risk management,” “risk management” and “sourcing strategy and cost optimization” (50.0 percent each). Meanwhile, 43.8 percent of respondents reported using AI to support customs, trade compliance, and tariff optimization, reflecting the growing importance of managing an increasingly complex global trade environment.
About the study
Authored by Dr. Sheng Lu and Emilie Delaye in collaboration with the United States Fashion Industry Association (USFIA), this year’s benchmarking study was based on a survey of executives from 30 leading U.S. fashion companies from April to June 2026. Approximately 80 percent of respondents were self-identified retailers, 65 percent were self-identified brands, and about 55 percent were importers/wholesalers.
The survey respondents included large U.S. fashion corporations and medium-sized companies. About 80 percent of respondents reported having more than 1,000 employees.


