State of U.S. Textile and Apparel Manufacturing: Output, Employment, and Trade (Updated May 2022)

Textile and apparel manufacturing in the U.S. has significantly shrunk in size over the past decades due to multiple factors ranging from automation, import competition to the shifting U.S. comparative advantages for related products. However, U.S. textile manufacturing is gradually coming back. The output of U.S. textile manufacturing (measured by value added) totaled $16.59 billion in 2021, up 23.8% from 2009. In comparison, U.S. apparel manufacturing dropped to $9.5 billion in 2019, 4.4% lower than ten years ago (Bureau of Economic Analysis, 2021).

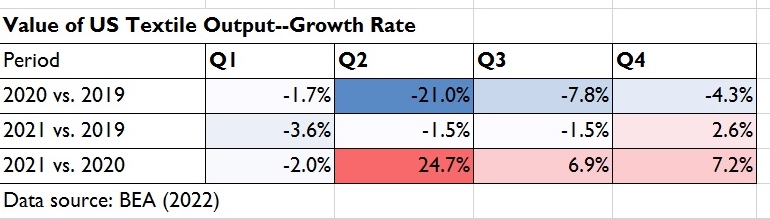
Meanwhile, like many other sectors, U.S. textile and apparel production was hit hard by COVID-19 in the first half of 2020 but started to recover in the 3rd quarter. Notably, as of December 2021, U.S. textile production had returned to its pre-COVID level.

On the other hand, as the U.S. economy is turning more mature and sophisticated, the share of U.S. textile and apparel manufacturing in the U.S. Gross Domestic Product (GDP) dropped to only 0.12% in 2020 from 0.57% in 1998 (Bureau of Economic Analysis, 2021).

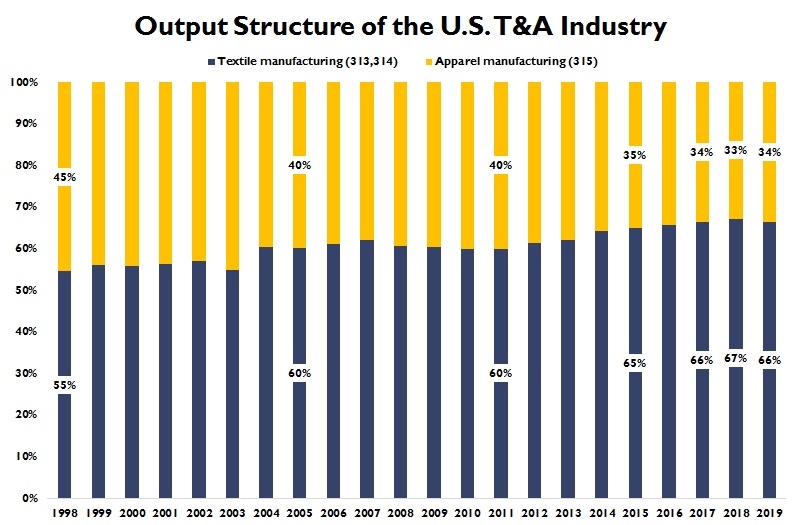
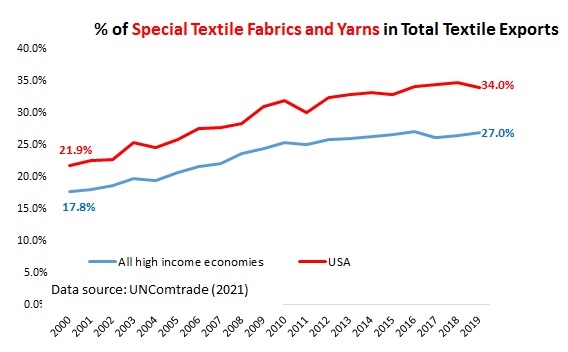
The U.S. textile and apparel manufacturing is changing in nature. For example, textile products had accounted for over 66% of the total output of the U.S. textile and apparel industry as of 2019, up from only 58% in 1998 (Bureau of Economic Analysis, 2020). Textiles and apparel “Made in the USA” are growing particularly fast in some product categories that are high-tech driven, such as medical textiles, protective clothing, specialty and industrial fabrics, and non-woven. These products are also becoming the new growth engine of U.S. textile exports. Notably, “special fabrics and yarns” had accounted for more than 34% of U.S. textile exports in 2019, up from only 20% in 2010 (Data source: UNComtrade, 2021).

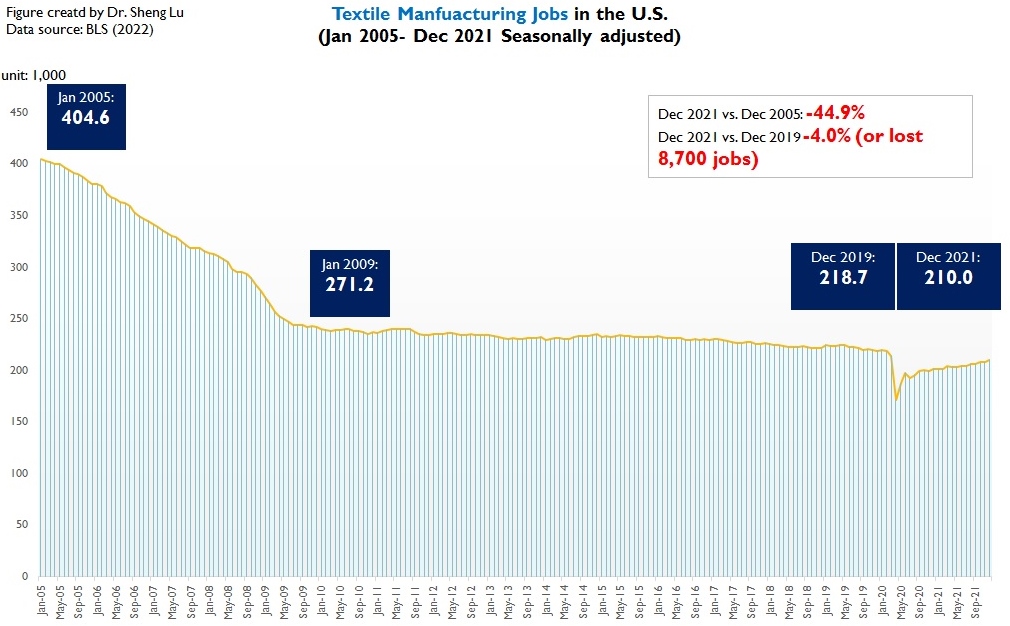
Compatible with the production patterns, employment in the U.S. textile industry (NAICS 313 and 314) and apparel industry (NAICS 315) fell to the bottom in April-May 2020 due to COVID-19 but started to recover steadily since June 2020. From January 2021 to December 2021, the total employment in the two sectors increased by 4.5% and 4.2%, respectively (Seasonally adjusted). However, the employment level remains much lower than the pre-COVID level (benchmark: December 2019).

To be noted, as production turns more automated and thanks to improved productivity (i.e., the value of output per worker), U.S. textile and apparel factories have been hiring fewer workers even before the pandemic. The downward trend in employment is not changing for the U.S. textile and apparel manufacturing sector.  Related, how to attract the new generation of workforce to the factory floor remains a crucial challenge facing the future of textile and apparel “Made in the USA.”

International trade supports textiles and apparel “Made in the USA.” Notably, nearly 42% of textiles “Made in the USA” (NAICS 313 and 314) were sold overseas in 2019, up from only 15% in 2000. A recent study further shows that product category and the size of the firm were both statistically significant factors that affected the U.S. textile and apparel manufacturer’s likelihood of engaged in exports.

from Nordstrom Rack

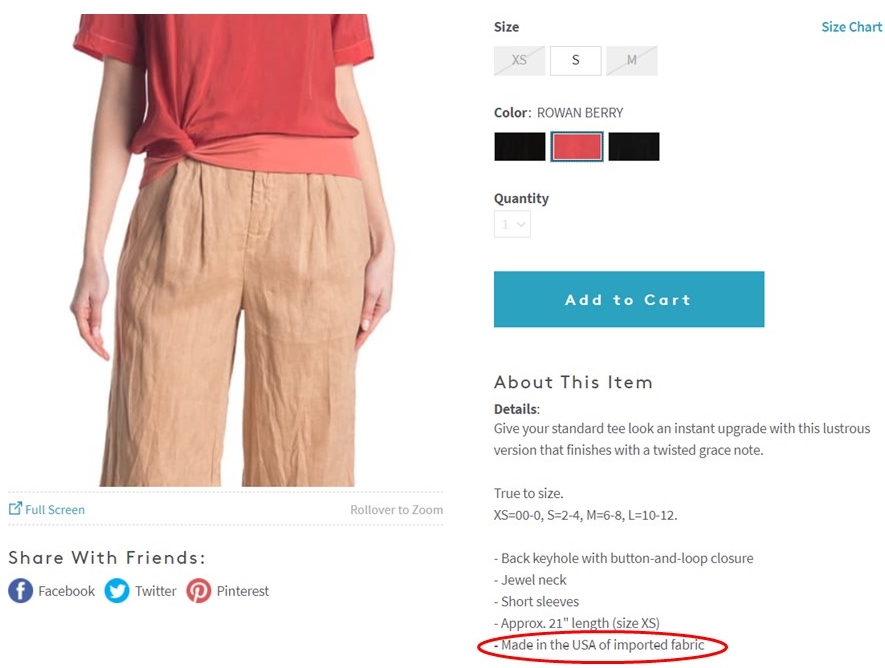
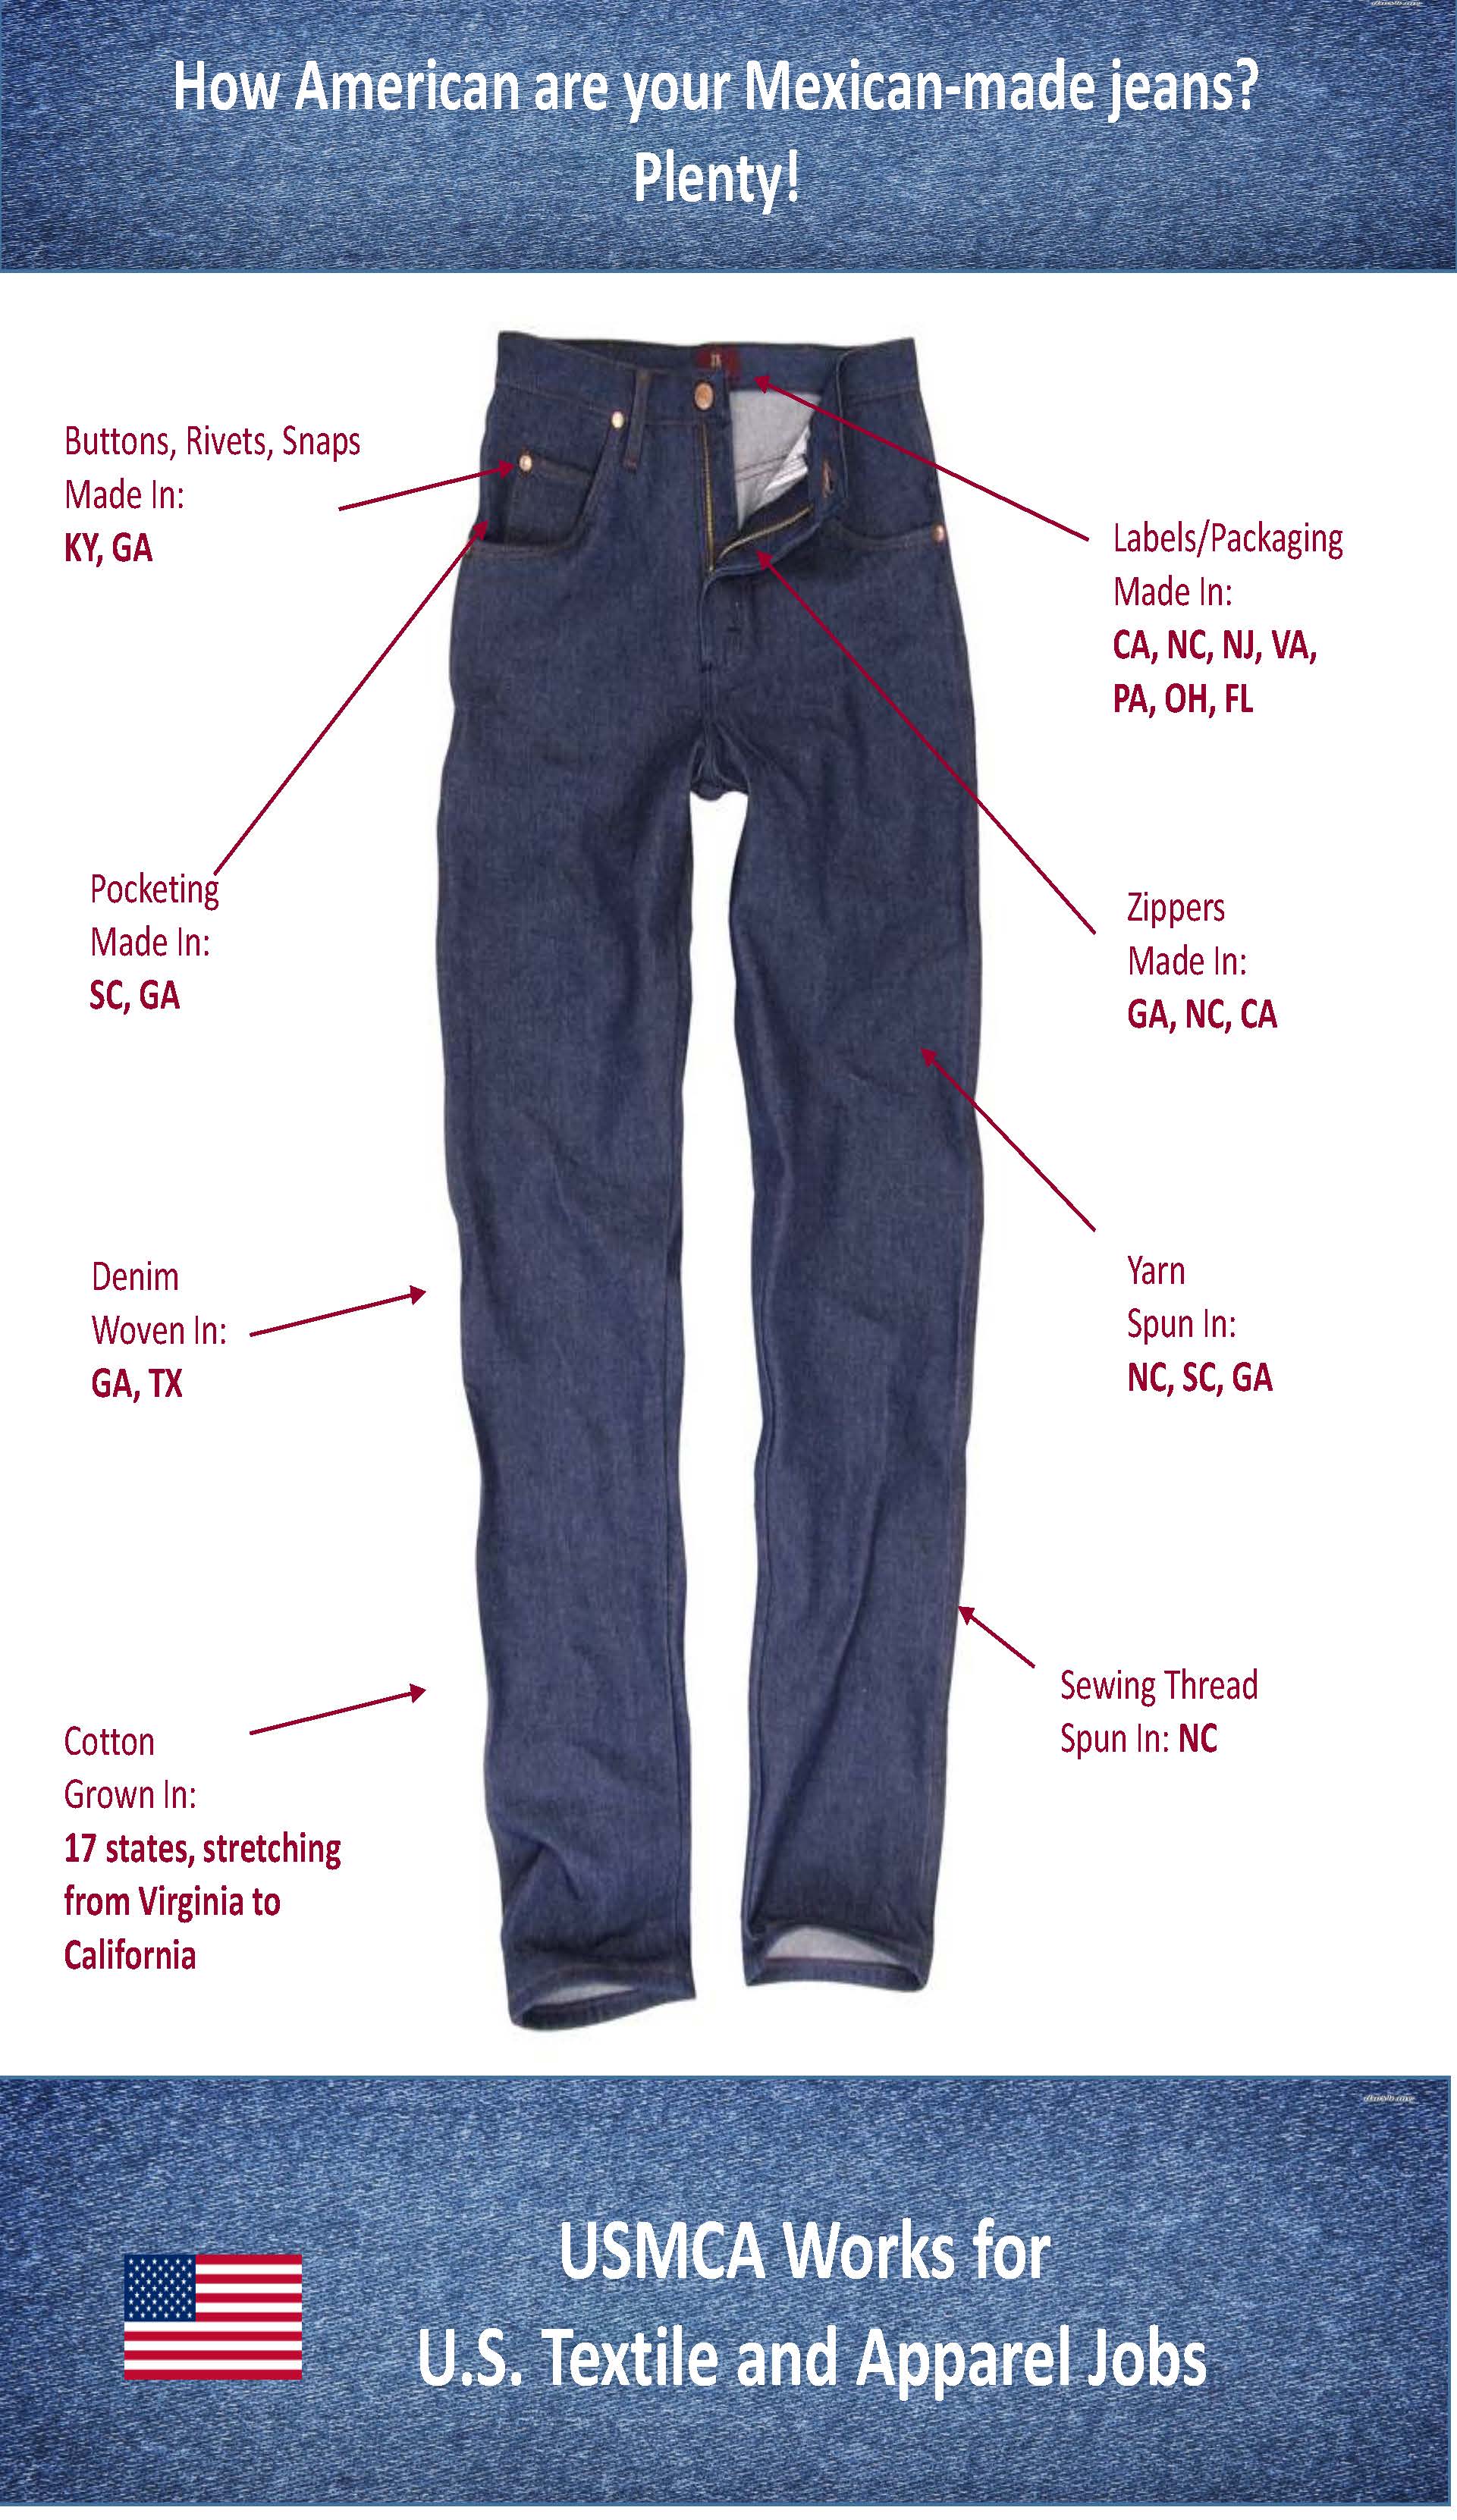
It is not rare to find clothing labeled “made in the USA with imported fabric” or “made in the USA with imported material” in the stores. Statistical analysis shows a strong correlation between the value of U.S. apparel output and U.S. yarn and fabric imports from 1998 to 2019.

Like many other developed economies whose textile and apparel industries had reached the stage of post-maturity, the United States today is a net textile exporter and net apparel importer. COVID-19 has affected U.S. textile and apparel trade in several ways:

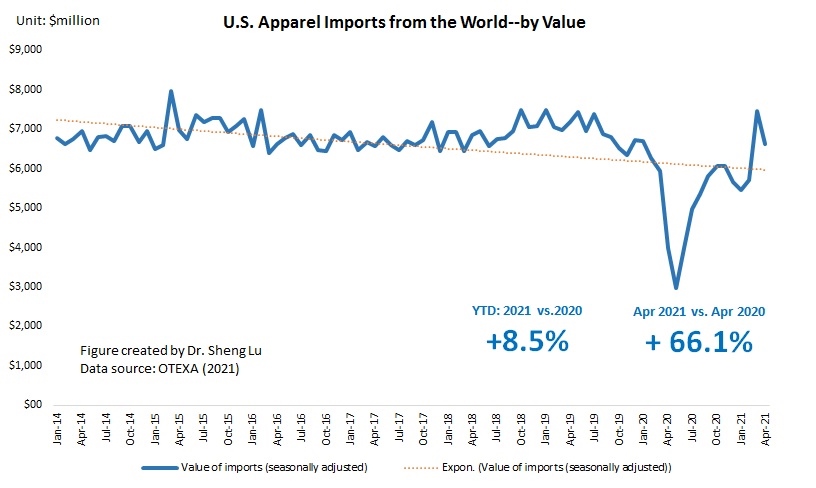
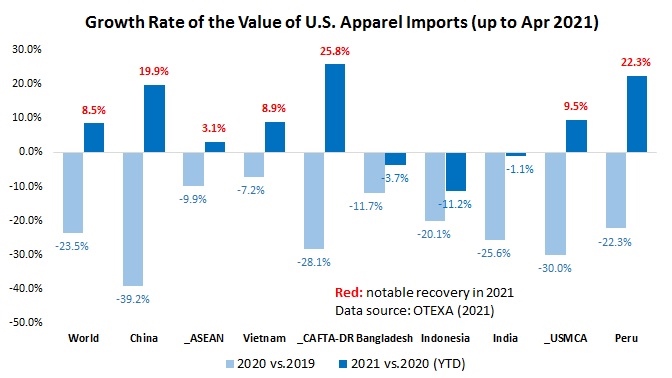
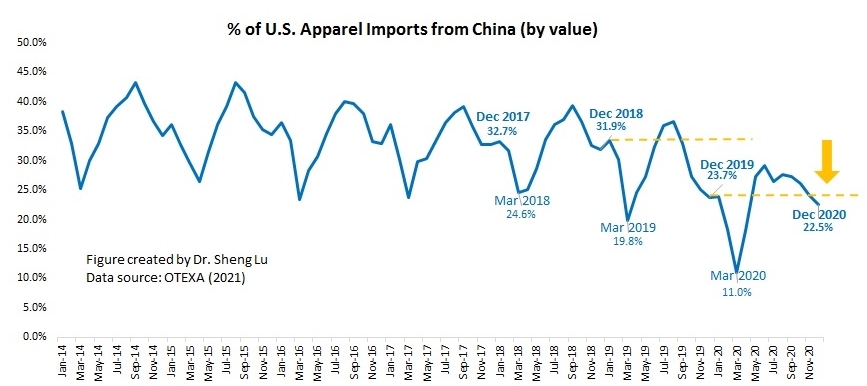
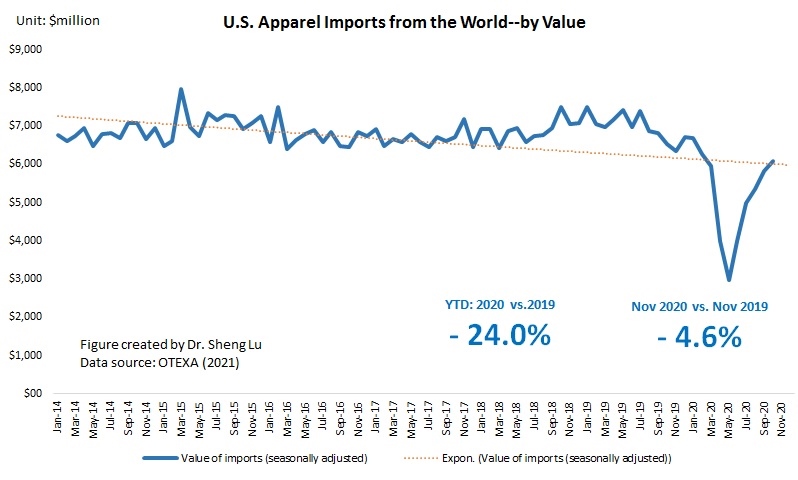
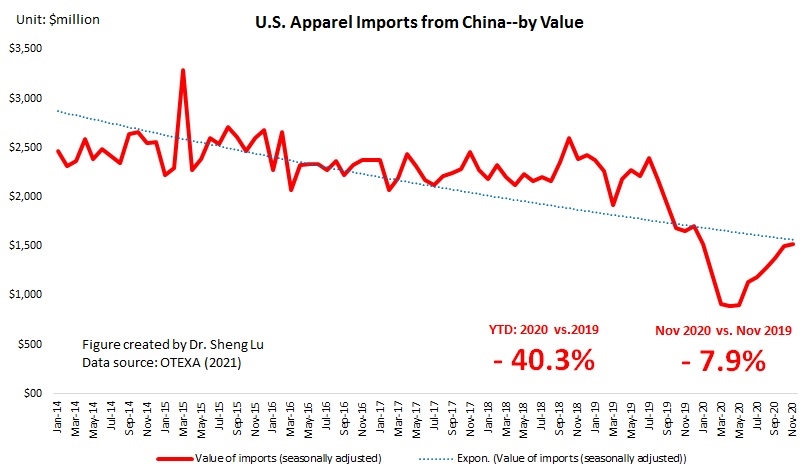
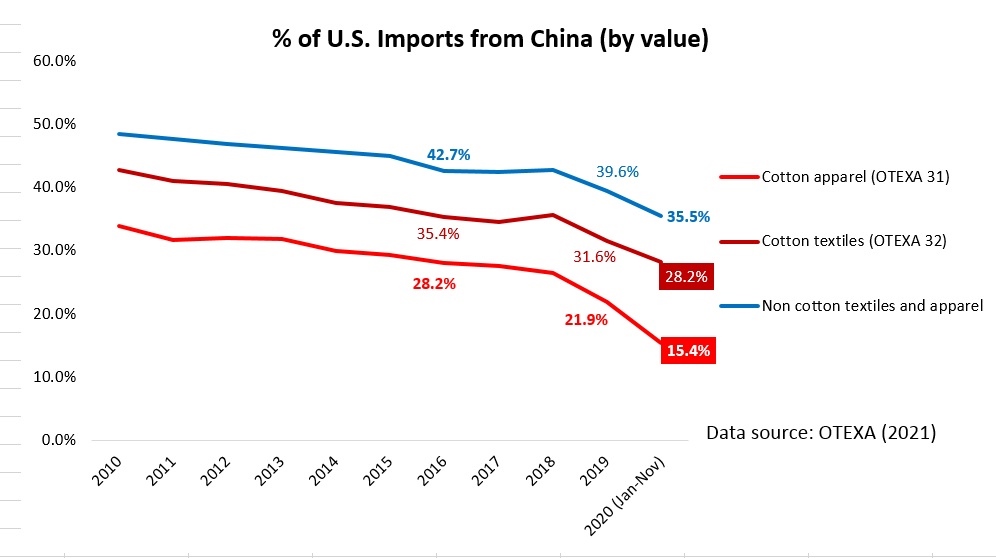
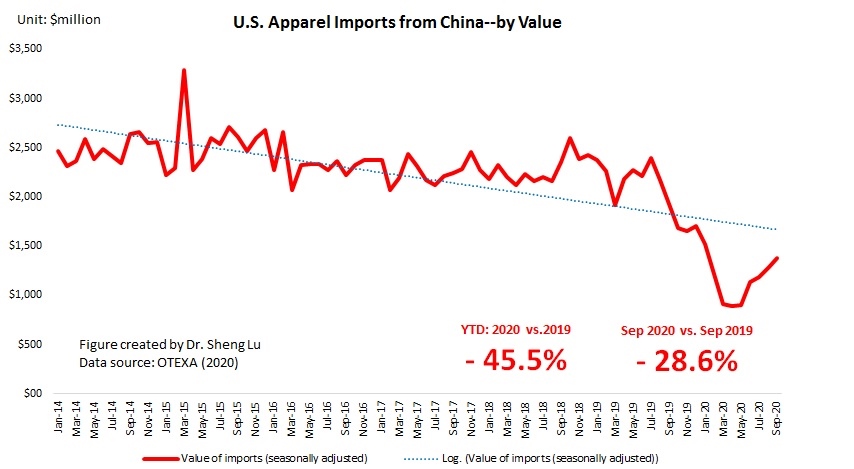
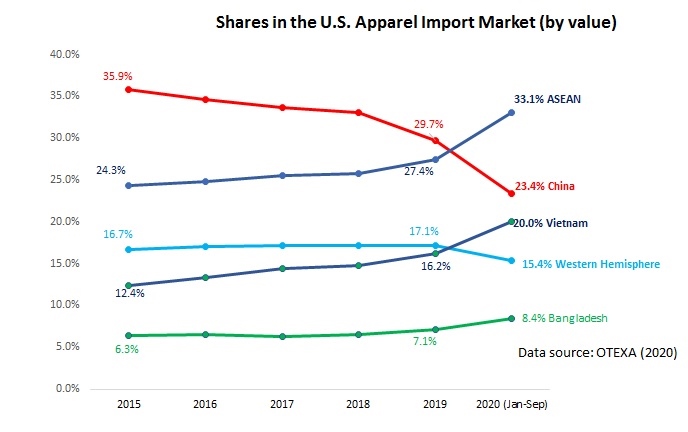
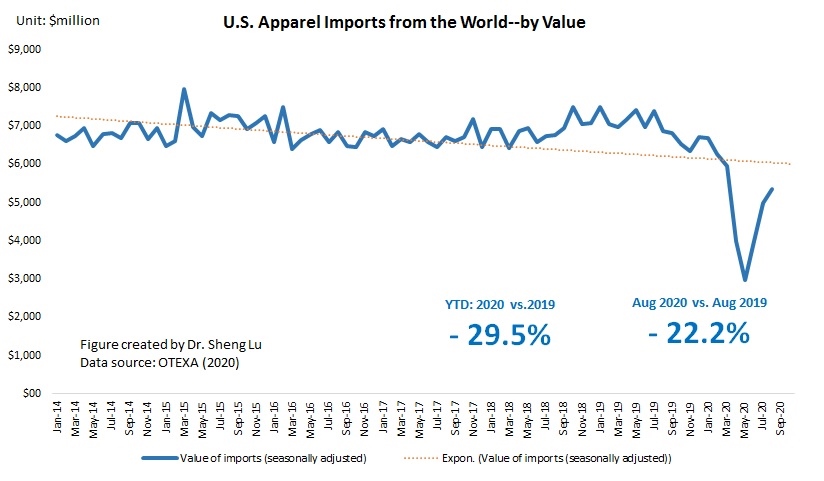
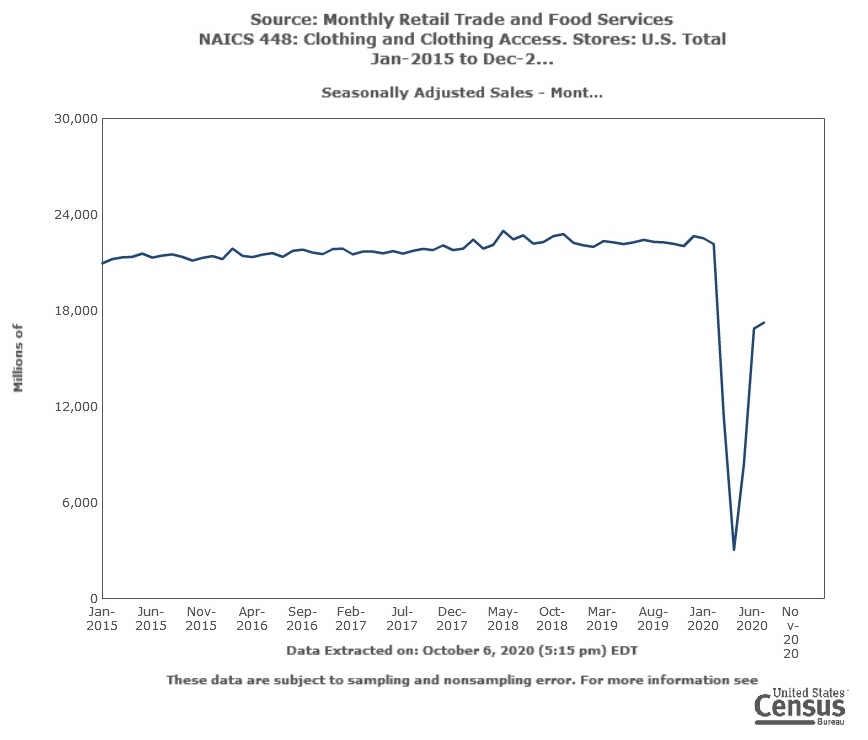
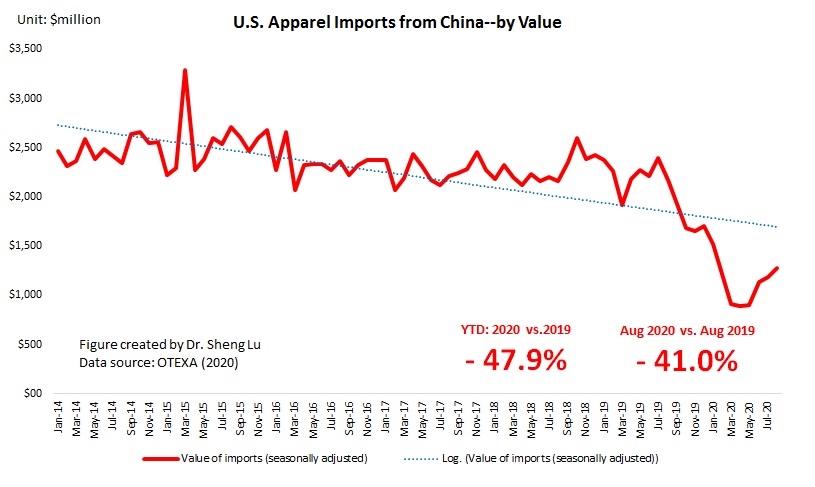
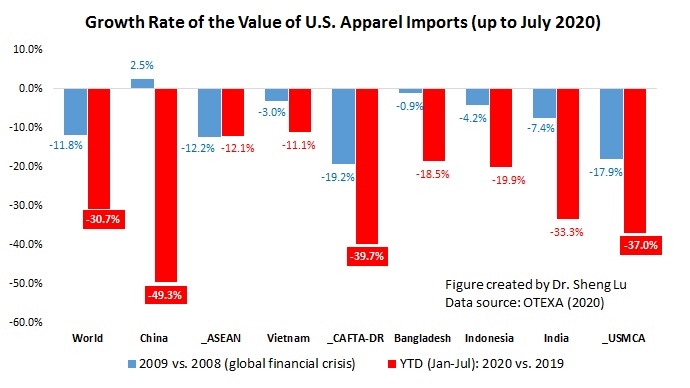
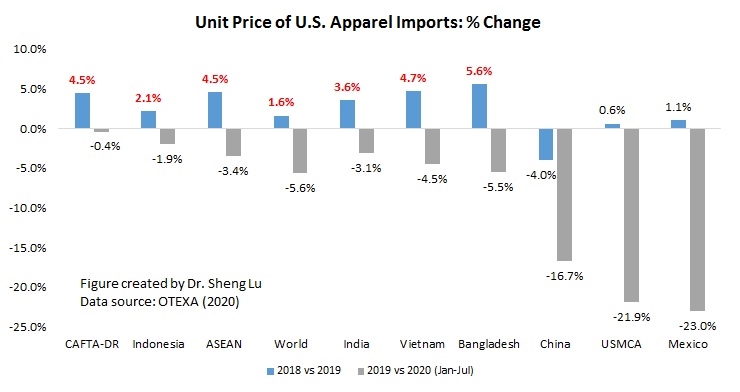
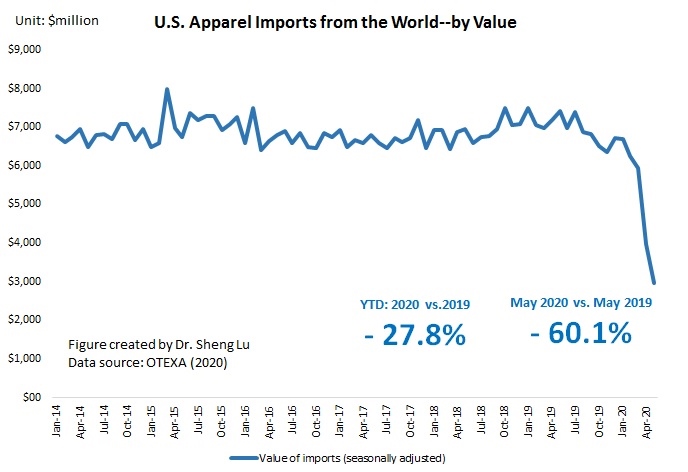
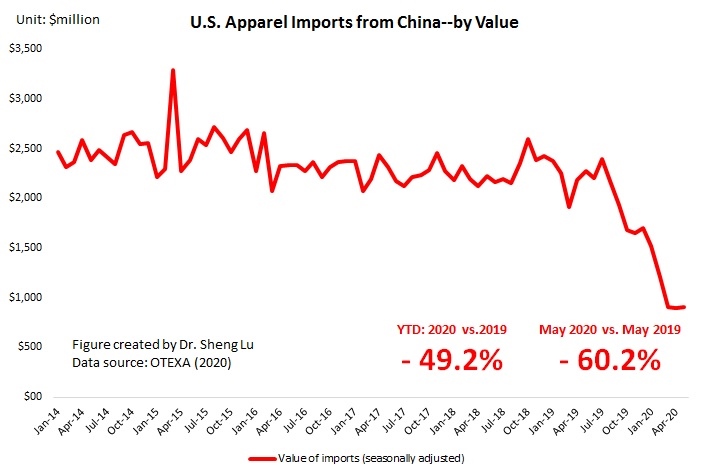
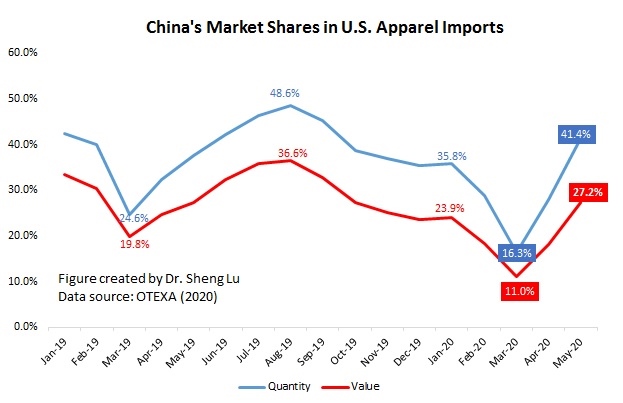
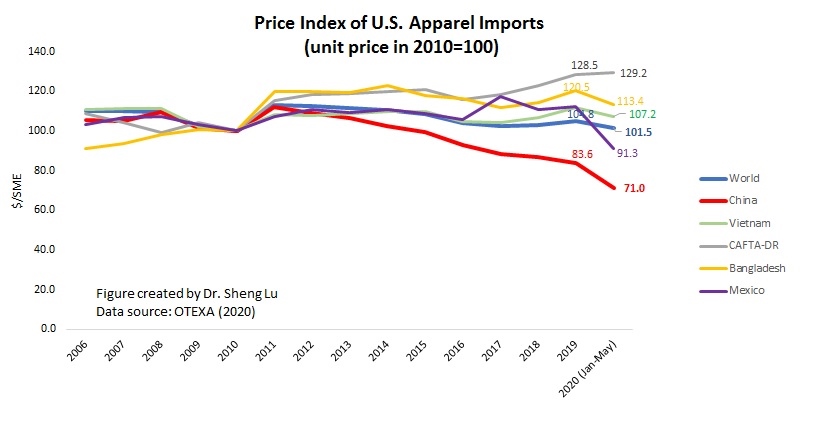
  • Trade volume fell and yet fully recovered: Both affected by the shrinkage of import demand and supply chain disruptions, the value of U.S. textile and apparel imports dropped by as much as 19.3% in 2020 from a year ago, particularly apparel items (down 23.5%). Likewise, the value of U.S. textile and apparel exports in 2020 decreased by 15.6%, including an unprecedented 26% decrease in yarn exports. Further, thanks to consumers’ robust demand, the value of US apparel imports enjoyed a remarkable 27.4% growth in 2021 from a year ago and but was still 2.5% short of the level in 2019.
  • Trade balance shifted: Before the pandemic, U.S. was a net exporter of fabrics. However, as the import demand for non-woven fabrics (for making PPE purposes) surged during the pandemic, U.S. ran a trade deficit of $502 million for fabrics in 2020; the trade deficit expanded to $975 million in 2021. Meanwhile, as retail sales slowed and imports dropped during the pandemic, the U.S. trade deficit in apparel shrank by 19% in 2020 compared with 2019. However, the shrinkage of the trade deficit did not necessarily boost clothing “Made in the USA” in 2020, reminding us that the trade balance often is not an adequate indicator to measure the economic impact of trade.
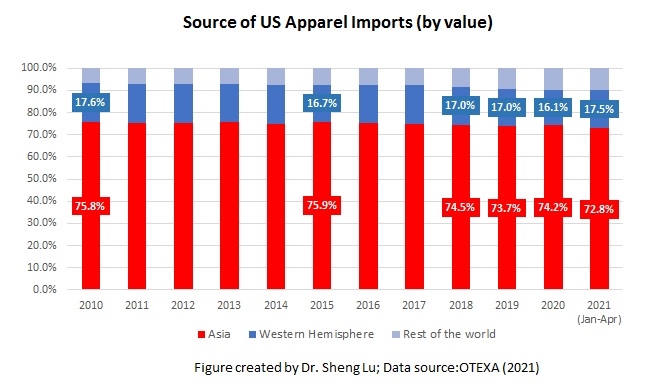
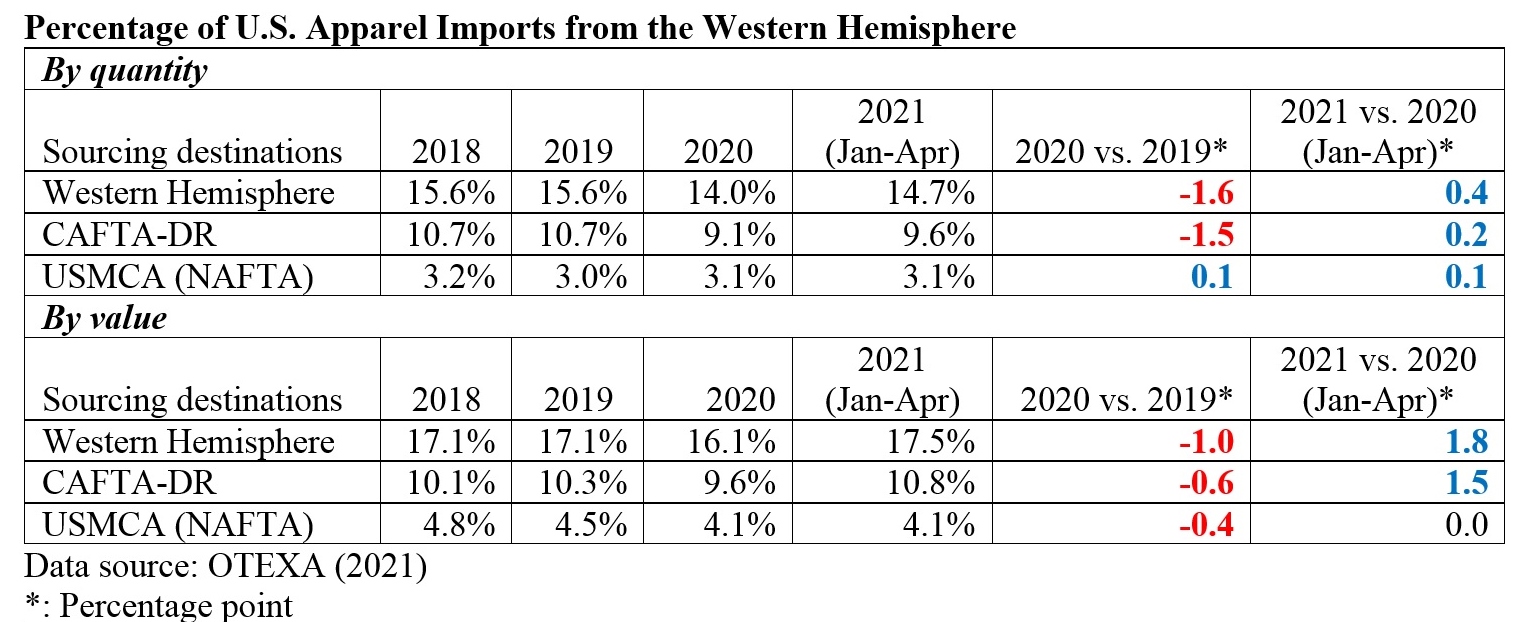
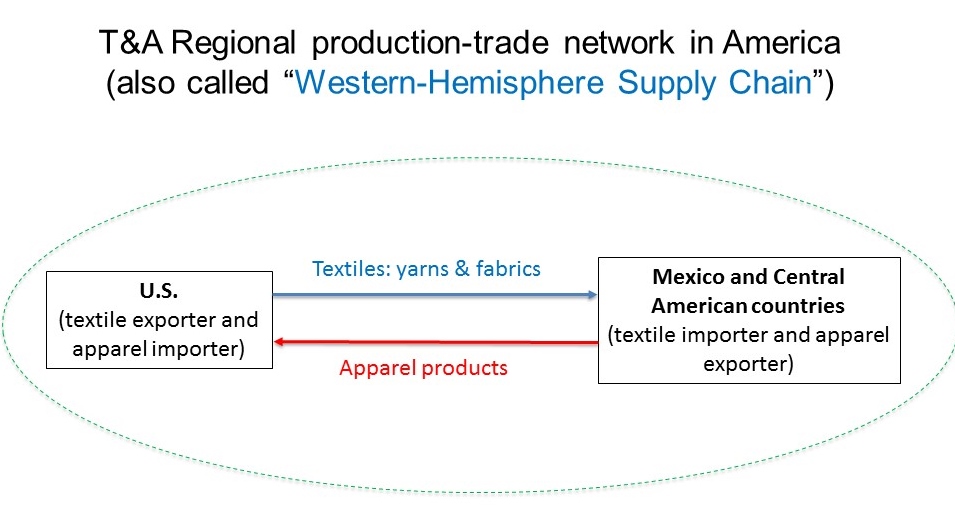
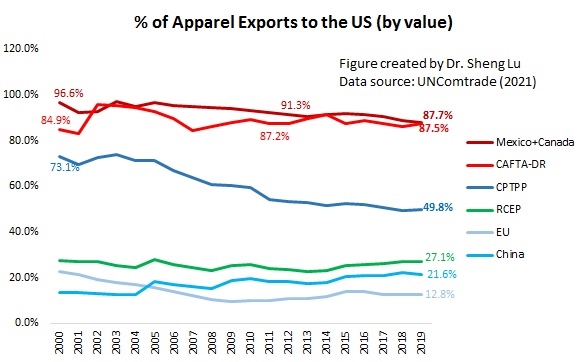
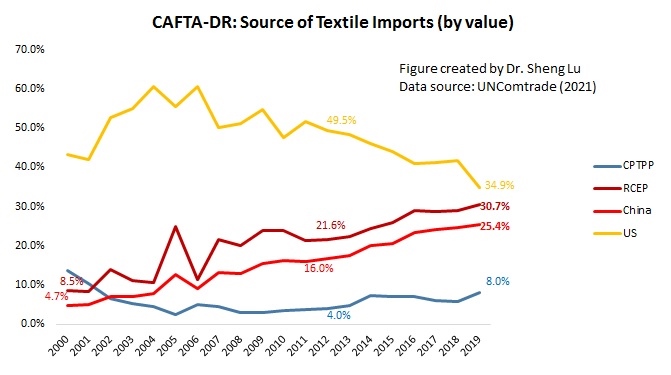
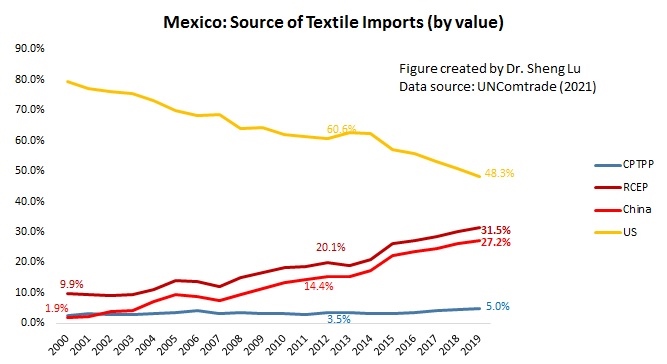
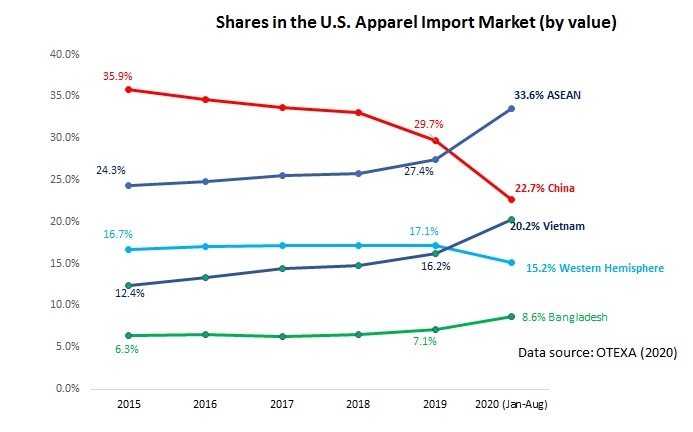
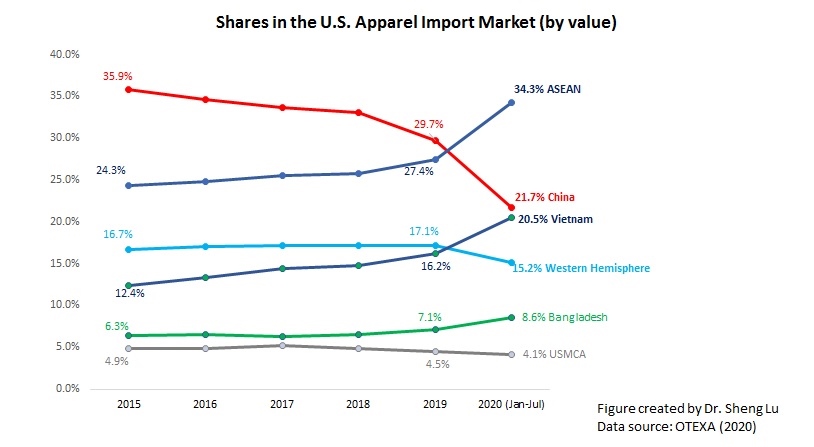
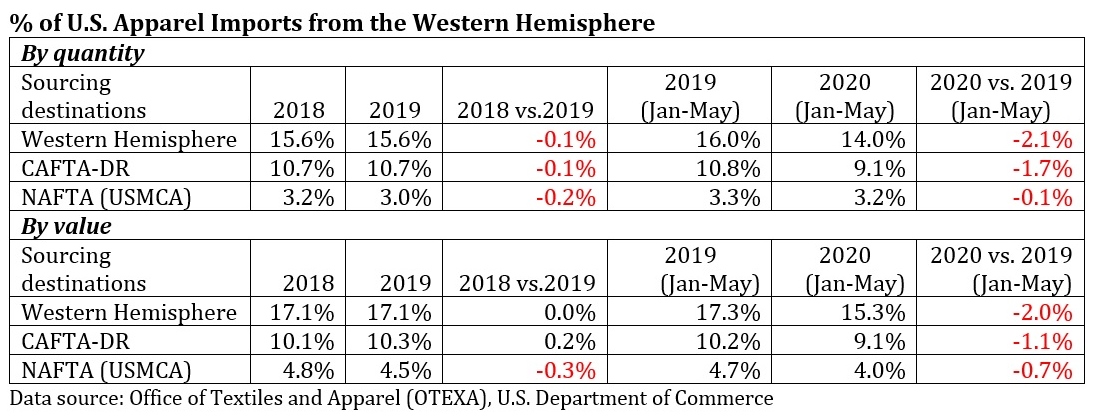
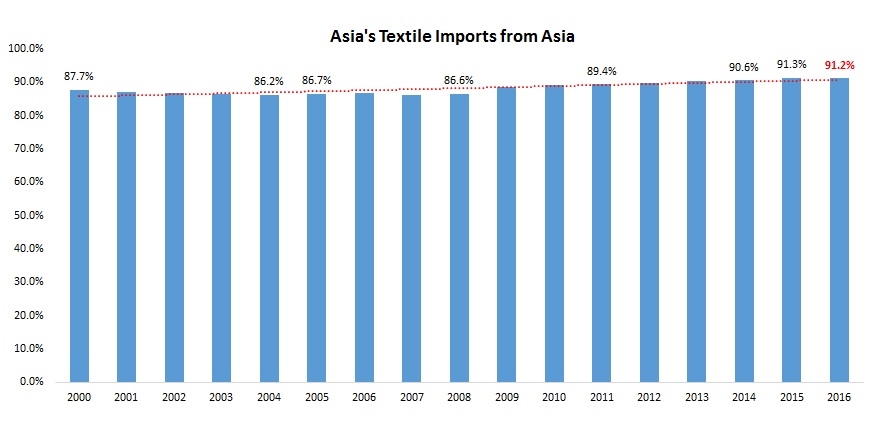
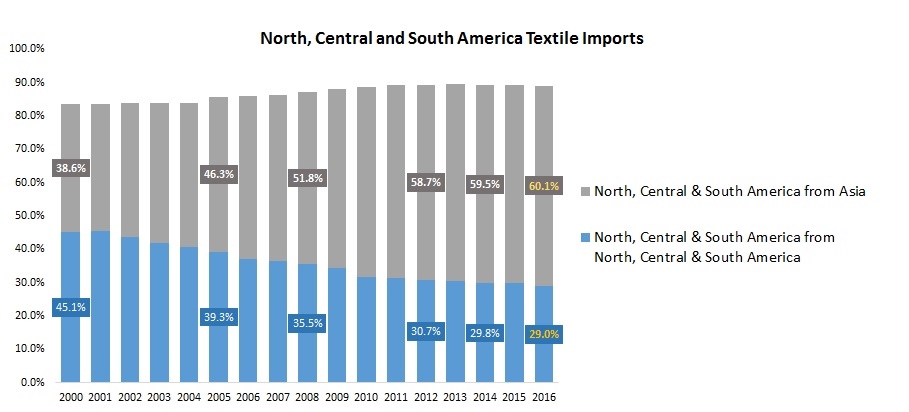
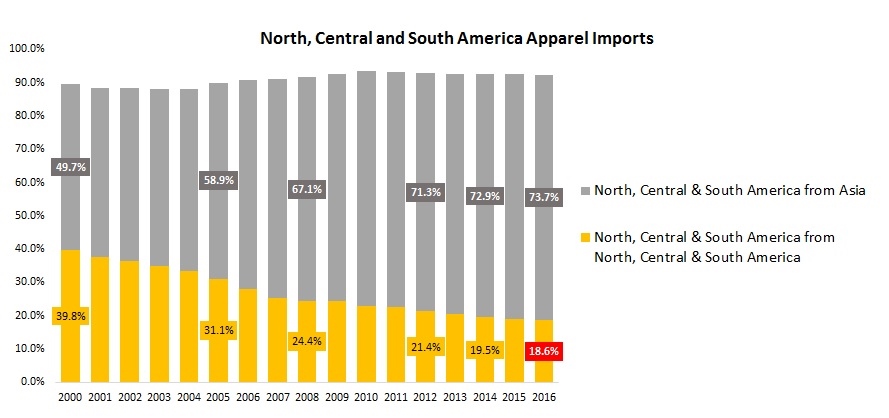
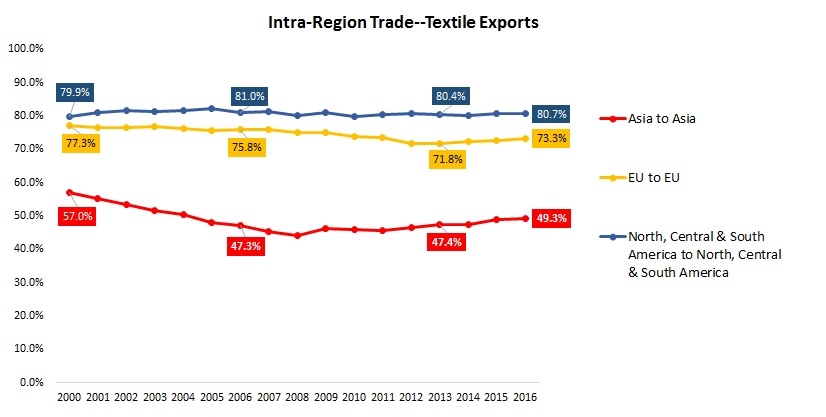
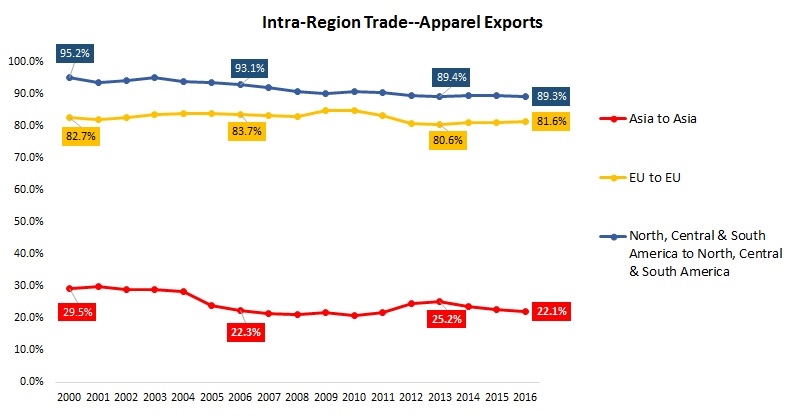
  • No change in export market: More than 70% of U.S. textile and apparel export went to the Western Hemisphere in 2021, a pattern that has stayed stable over the past decades (OTEXA, 2022). More can be done to strengthen the Western Hemisphere supply chain and textile and apparel production in the region by leveraging regional trade agreements like CAFTA-DR and USMCA.

By Sheng Lu

Further reading:

Outlook 2022– Key Issues to Shape Apparel Sourcing and Trade

In December 2021, Just-Style consulted a panel of industry leaders and scholars in its Outlook 2022–what’s next for apparel sourcing briefing. Below is my contribution to the report. All comments and suggestions are more than welcome!

What next for apparel sourcing?

As “COVID sets the agenda” and the trajectory of several critical market and non-market forces hard to predict (for example, global inflation, and geopolitics), fashion companies may still have to deal with a highly volatile and uncertain market environment in 2022. That being said, it is still hopeful that fashion companies’ toughest sourcing challenges in 2021 will start to gradually ease at some point in the new year, including the hiking shipping costs, COVID-related lockdowns, and supply chain disruptions.

In response to the “new normal,” fashion companies may find several sourcing strategies essential:

One is to maintain a relatively diverse apparel sourcing base. The latest trade data suggests that US, EU, and Japan-based fashion companies have been steadily sourcing from a more diverse group of countries since 2018, and such a trend continues during the pandemic. Echoing the pattern, in the latest annual benchmarking study I conducted in collaboration with the United States Fashion Industry Association (USFIA), we find that “China plus Vietnam plus many” remains the most popular sourcing model among respondents. This strategy means China and Vietnam combined now typically account for 20-40 percent of a fashion company’s total sourcing value or volume, a notable down from 40-60 percent in the past few years. Fashion companies diversify their sourcing away from “China plus Vietnam” to avoid placing “all eggs in one basket” and mitigate various sourcing risks. In addition, more than 85 percent of surveyed fashion companies say they will actively explore new sourcing opportunities through 2023, particularly those that could serve as alternatives to sourcing from China.

The second strategy is to strengthen the relationship with key vendors further. As apparel is a buyer-driven industry, fashion brands and retailers fully understand the importance of catering to consumers’ needs. However, the supply chain disruptions caused by COVID-19 remind fashion companies that building a close and partner-based relationship with capable suppliers also matters. For example, working with vendors that have a presence in multiple countries (or known as “super-vendors”) offers fashion companies a critical competitive edge to achieve more flexibility and agility in sourcing. Sourcing from vendors with a vertical manufacturing capability also allows fashion companies to be more resilient toward supply chain disruptions like the shortage of textile raw materials, a significant problem during the pandemic.

Further, we could see fashion companies pay even closer attention to textile raw material sourcing in the year ahead. On the one hand, given the growing concerns about various social and environmental compliance issues like forced labor, fashion brands and retailers are making more significant efforts to better understand their entire supply chain. For example, in addition to tracking who made the clothing or the fabrics (i.e., tier 1 & 2 suppliers), more companies have begun to release information about the sources of their fibers, yarns, threads, and trimmings (i.e., tier 3 & tier 4 suppliers). On the other hand, many fashion brands and retailers intend to diversify their textile material sourcing from Asia, particularly China, against the current business environment. Compared with cutting and sewing garments, much fewer countries can make textiles locally, and it takes time to build textile production capacity. Thus, fashion companies interested in taking more control of their textile raw material sourcing need to take concrete actions such as shifting their sourcing model and making long-term investments intentionally.

Apparel industry challenges and opportunities

One key issue we need to watch closely is the US-China relations. China currently remains the single largest source of apparel globally, with no near alternative. China also plays an increasingly significant role as a textile supplier for many leading apparel exporting countries in Asia. However, as the US-China relations become more concerning and confrontational, we could anticipate new trade restrictions targeting Chinese products and products from any sources that contain components made in China. Notably, with strong bipartisan support, President Biden signed into law the Uyghur Forced Labor Prevention Act on December 23, 2021. The new law is a game-changer! Depending on the detailed implementation guideline to be developed by the Customs and Border Protection (CBP), US fashion companies may find it not operationally viable to source many textiles and apparel products from China. In response, China may retaliate against well-known western fashion brands, disrupting their sales expansion in the growing Chinese consumer market. Further, as China faces many daunting domestic economic and political challenges, a legitimate question for fashion companies to think about is what an unstable China means for their sourcing from the Asia-Pacific region and what the contingency plan will be.

Another critical issue to watch is the regional textile and apparel supply chains and related free trade agreements. While apparel is a global sector, apparel trade remains largely regional-based, i.e., countries import and export products with partners in the same region. Data shows that from 2019 to 2020, around 80% of Asian countries’ textile and apparel imports came from within Asia and about 50% for EU countries. Over the same period, over 87% of Western Hemisphere (WH) countries’ textile and apparel exports went to other WH countries and about 75% for EU countries.

Notably, the reaching and implementation of new free trade agreements will continue to alter and shape new regional textile and apparel supply chains in 2022 and beyond. For example, the world’s largest free trade agreement, the Regional Comprehensive Economic Partnership (RCEP), officially entered into force on January 1, 2022. The tariff reduction and the very liberal rules of origin in the agreement could strengthen Japan, South Korea, and China as the primary textile suppliers for the Asia-based regional supply chain and enlarge the role of ASEAN as the leading apparel producer. RCEP could also accelerate other trade agreements in the Asia-Pacific region, such as the China-South Korea-Japan Free Trade Agreement currently under negotiation.

As one of RCEP’s ripple effects, we can highly anticipate the Biden administration to announce its new Indo-pacific economic framework soon to counterbalance China’s influences in the region. The Biden administration also intends to leverage trade programs such as the Dominican Republic-Central America Free Trade Agreement (CAFTA-DR) to boost textile and apparel production, trade, and investment in the Western Hemisphere and address the root causes of migration. These trade initiatives will be highly relevant to fashion companies that could use the opportunity to expand near sourcing, take advantage of import duty-saving benefits and explore new supply chains. 

Additionally, fashion companies need to be more vigilant toward political instability in their major sourcing destinations. We have already seen quite a turmoil recently, from Myanmar’s military coup, Ethiopia’s loss of the African Growth and Opportunity Act (AGOA) benefits, concerns about Haiti and Nicaragua’s human rights, and the alleged forced labor in China’s Xinjiang region. Whereas fashion brands and retailers have limited or no impact on changing a country’s broader human rights situation, the reputational risks could be very high. Having a dedicated trade compliance team monitoring the geopolitical situation routinely and ensuring full compliance with various government regulations will become mainstream among fashion companies.

And indeed, sustainability, due diligence, recycling, digitalization, and data analytics will remain buzzwords for the apparel industry in the year ahead.

by Sheng Lu

COVID-19 and U.S. Apparel Imports: Key Trends (Updated: June 2021)

First, thanks to consumers’ resumed demand and a more optimistic outlook for the U.S. economy, U.S. apparel imports continue to rebound. However, uncertainties remain. On the one hand, mirroring retail sales patterns, the value of U.S. apparel imports in April 2021 went up by 66% from a year ago, a new record high since the pandemic. The absolute value of U.S. apparel imports so far in 2021 (January –April) also recovered to around 88% of the pre-Covid level (i.e., January to April 2019). However, the value of U.S. apparel imports in April 2021 was 11.2% lower than in March 2021 (seasonally adjusted), suggesting that the market environment is far from stable yet as the COVID situation in the U.S. and other parts of the world continue to evolve.

Second, data indicates that Asia as a whole remains the single largest sourcing base for U.S. fashion companies, stably accounting for around 72-75% of the import value. Studies show that two factors, in particular, contribute to Asia’s competitiveness as a preferred apparel sourcing base—price and flexibility & agility.  Asia’s highly integrated regional supply chains and its vast production capacity shape its competitiveness in these two aspects.

However, the recent surge of COVID cases in India and its neighboring Southeast Asian countries has raised new worries about the potential sourcing risks and supply chain disruptions for U.S. fashion companies currently sourcing from there.  

Third, as the direction of the US-China relations becomes ever more concerning, U.S. fashion companies seem to accelerate diversifying sourcing from China. Even China remains the top apparel supplier for the U.S. market, from January to April 2021, China’s market shares fell to 32.1% in quantity (was 36.6% in 2020) and 20.2% in value (was 23.7% in 2020).  Also, the HHI index and market concentration ratios (CR3 and CR5) suggest that US fashion companies are increasingly moving their apparel sourcing orders from China to other Asian countries. For example, according to a leading U.S. fashion corporation in its latest annual report, “in response to the recent tariffs imposed by the current US administration, the Company has reduced the amount of goods being produced in China.”

Further, the latest data suggests that the concerns about the alleged forced labor in Xinjiang hurt China’s prospect as an apparel sourcing destination, BOTH for cotton and non-cotton items. Measured by value, only 11.9% of U.S. cotton apparel came from China in April 2021, a new record low since implementing the CBP WROs, which impose a regional ban on any cotton and cotton apparel made in the Xinjiang region. The latest data also suggests that China is quickly losing market shares for non-cotton textile and apparel items.

Fourth, U.S. apparel sourcing from CAFTA-DR members gains new momentum, reflecting the strong interest in sourcing more from the region from the business community and policymakers. For example, 17.5% of U.S. apparel imports came from the Western Hemisphere in 2021 (Jan-Apr), higher than 16.1% in 2020 and 17.1% before the pandemic. Notably, CAFTA-DR members’ market shares increased to 10.8% in 2021 (Jan-Apr) from 9.6% in 2020. The value of U.S. apparel imports from CAFTA-DR also enjoyed a 25.8% growth in 2021 (Jan-Apr) from a year ago, one of the highest among all sourcing destinations. The imports from El Salvador (up 29.2%), Honduras (up 28.0%), and Guatemala (27.0%) had grown particularly fast in 2021.

Meanwhile, U.S. apparel imports from USMCA members stayed stable overall. CAFTA-DR and USMCA members currently account for around 60% and 25% of U.S. apparel imports from the Western Hemisphere. They are also the single largest export market for U.S. textile products (around 70%). The Biden administration has signaled its strong interest in strengthening the western hemisphere textile and apparel supply chain by leveraging CAFTA-DR along with other trade policy tools.

by Sheng Lu

Is the Western Hemisphere Textile and Apparel Supply Chain in Trouble?

Within the Western-Hemisphere (WH) textile and apparel supply chain, the United States serves as the leading textile supplier, whereas developing countries in North, Central, and South America (such as Mexico and countries in the Caribbean region) assemble imported textiles from the United States or elsewhere into apparel. The majority of clothing produced in the area is eventually exported to the United States or Canada.

WH countries still form a close supply chain partnership in textile and apparel production. For example, close to 70% of US textile exports went to WH members in 2020, a pattern that has stayed stable over the past decades (OTEXA, 2021). Meanwhile, the United States serves as the single largest export market for most apparel exporting countries in the WH For example, in 2019, close to 89% of apparel exports from CAFTA-DR and USMCA (NAFTA) members went to the US.

However, the WH textile and apparel supply chain is not without significant challenges. For example, CAFTA-DR and Mexico are increasingly using textiles inputs from outside the WH region, which weakens the US role as a dominant textile supplier. Notably, most of the market shares lost by US textile suppliers are fulfilled by Asian countries, including China and other members of the RCEP (Regional Comprehensive Economic Partnership). Theoretically, using cheaper textile inputs from Asia may help apparel producing countries in the WH improve the price competitiveness of their finished garments and diversify their export markets beyond the US.

Meanwhile, despite the apparent popularity of “near-sourcing”, no evidence suggests that US fashion brands and retailers are sourcing more from WH countries, including CAFTA-DR and USMCA (NAFTA) members. Neither the US-China trade war nor COVID-19 seems to have shifted the trends. Instead, close to 75%-80% of US apparel imports still come from Asian countries (OTEXA, 2021). Studies further show that a vast majority of US apparel imports from WH concentrate on a limited category of products, such as tops and bottoms, which is far from sufficient to meet retailers’ sourcing needs.

On the other hand, technical textiles and industrial textiles account for a growing share in the total US textile exports, and Asia is a particularly fast-growing market. However, there is few US free trade agreement with Asian countries, making it a disadvantage to promote “Made in the USA” products in these markets. It is debatable what should be the priority for the US textile and apparel trade policy: to continue to protect the exports of yarn and fabrics to the WH or open new export markets for technical and industrial textiles outside the WH region?

by Sheng Lu

Relate readings:

Apparel Manufacturing: An Examination of the Pandemic Impact on Northern Triangle, Hispaniola, and Mexico (Webinar)

Inter-American Development Bank, 26 March 2021

Speaker: Nicole Bivens Collinson, President, International Trade and Government Relations for Sandler, Travis and Rosenberg

Regional Supply Chain Remains a Key Feature of World Textile and Apparel Trade

While textile and apparel is well-known as a global sector, the latest statistics show that world textile and apparel trade patterns remain largely regional-based. Three particular regional textile and apparel trade flows are critical to watch:

First, Asian countries are increasingly sourcing textile raw material from within the region. As much as 85% of Asian countries’ textile imports came from other Asian countries in 2019, a substantial increase from only 70% in the 2000s. This result reflects the formation of an ever more integrated regional textile and apparel supply chain in Asia. However, as Asian countries become more economically integrated, textile and apparel producers in other parts of the world could find it more challenging to get involved in the region. With the recent reaching of several mega free trade agreements among countries in the Asia-Pacific region, such as the Regional Comprehensive Economic Partnership (RCEP), the pattern of “Made in Asia for Asia” is likely to strengthen further.

Second, the EU intra-region trade pattern for textile and apparel stays relatively strong and stable. Intra-region trade refers to trade flows between EU members. Statistics show that 54.6% of EU(27) members’ textile imports and 37.4% of their apparel imports came from within the EU(27) region in 2019. This pattern only slightly changed over the past decade. In other words, despite the reported increasing competition from Asian suppliers, many of which even enjoy duty-free market access to the EU market (such as through the EU Everything But Arms program), a substantial share of apparel sold in the EU markets are still locally made.

EU consumers’ preferences for “slow fashion” (i.e., purchasing less but for more durable products with higher quality) may contribute to the stable EU intra-region trade pattern. Many EU consumers also see textile and apparel as cultural products and do NOT shop simply for the price. This explains why Western EU countries such as Italy, Germany, and France rank the top apparel producers and exporters in the EU region despite their high wage and production costs.

Third, the Western Hemisphere (WH) supply chain faces significant challenges despite the seemingly growing popularity of “near-sourcing.” On the one hand, textile and apparel exporters in the Western-Hemisphere still rely heavily on the regional market. In 2019, respectively, as much as 79% of textiles and 86% of apparel exports from countries in the Western Hemisphere went to the same region. 

However, on the other hand, the Western-Hemisphere supply chain is facing increasing competition from Asian suppliers. For example, in 2019, only 22% of North, South, and Central American countries’ textile imports and 15% of their apparel imports came from within the Western Hemisphere, a new record low in ten years. Similarly, in the first eleven months of 2020, only 15.7% of US apparel imports came from the Western Hemisphere, down from 17.1% in 2019 before the pandemic. The limited local textile production capacity and the high production cost are the two notable factors that discourage US fashion brands and retailers from committing to more “near-sourcing” from the Western Hemisphere.

In comparison, Asian countries supplied a new record high of 62.2% of textiles and 75% apparel to countries in the Western Hemisphere in 2019, up from 49.1% and 71.1% ten years ago. This trend suggests that as the competitiveness of “Factory Asia” continues to improve, even regional trade agreements (such as USMCA and CAFTA-DR) and their restrictive “yarn-forward” rules of origin have limits to protect the Western Hemisphere supply chain.

In comparison, Asian countries supplied a new record high of 62.2% of textiles and 75% apparel to countries in the Western Hemisphere in 2019, up from 49.1% and 71.1% ten years ago. This trend suggests that as the competitiveness of “Factory Asia” continues to improve, even regional trade agreements (such as USMCA and CAFTA-DR) and their restrictive “yarn-forward” rules of origin have limits to protect the Western Hemisphere supply chain.

Additionally, many say that the reaching of RCEP creates new pressure for the new Biden administration to consider joining the CPTPP and strengthening economic ties with countries in the Asia-Pacific region. Notably, several USMCA and CAFTA-DR members, such as Mexico, also have RCEP or CPTPP membership. Apparel producers in these Western Hemisphere countries may find it more rewarding to access the cheaper textile raw material from Asia through CPTPP or RCEP rather than claiming the duty-saving benefits for finished garments under USMCA or CAFTA-DR. Like it or not, the Biden administration’s inaction will also have consequences. 

by Sheng Lu

Further reading: Lu, Sheng. (2021). Regional supply chains still shape textile and apparel trade. Just-Style

US Apparel Sourcing Trends to Watch in 2021

Key points:

  • Key themes in 2021: COVID-19+ trade policy
  • U.S. apparel imports continue to rebound, but uncertainty remains
  • Asia will remain the dominant apparel sourcing base
  • U.S. fashion companies are NOT giving up China as one of their essential apparel-sourcing bases, although companies continue to reduce their “China exposure” overall. Meanwhile, do NOT underestimate the impact of non-economic factors on sourcing.
  • No clear evidence suggests near sourcing from the Western Hemisphere is happening in a large scale
  • Watch Regional Comprehensive Economic Partnership (RCEP) and Comprehensive and Progressive Agreement for Trans-Pacific Partnership (CPTPP). These two mega-free trade agreements could shape new textile and apparel supply chains in the Asia-Pacific region.

COVID-19 and U.S. Apparel Imports: Key Trends (Updated: February 2021)

First, affected by the surge of COVID cases and consumers’ slowed spending, the value of U.S. apparel imports decreased by 15.7% in December 2020, the worst performance since September 2020. Specifically, the value of U.S. apparel imports in December 2020 shrank by 6.4% from November 2020 (seasonally adjusted), compared with an 8.8% growth from Aug to September, a 4.6% growth from September to October (seasonally adjusted), and a slight 0.3% decline from October to November (seasonally adjusted).

The substantial drop of U.S. apparel imports in December 2020 also altered the recovery trajectory. Overall, the outlook of US apparel imports in 2021 is hopeful but remains far from uncertain.

Second, supporting the findings of some recent studies, data suggests that U.S. fashion brands and retailers continue to reduce their “China exposure” in 2020. For example, both the HHI index and market concentration ratios (CR3 and CR5) suggest that apparel sourcing orders are gradually moving from China to other Asian countries. Measured by value, only 23.7% of U.S. apparel imports came from China in 2020, a new record low in the past ten years (was 29.7% in 2019 and 33% in 2018).

However, China’s apparel exports to the US lost more market shares from 2018-2019 than 2019-2020–it seems the impact of the trade war is more significant than the COVID.

The latest data confirms the concerns that some non-economic factors negatively affect China’s prospect as an apparel sourcing destination. For example, the reported forced labor issue related to Xinjiang, China, and a series of actions taken by the U.S. government (such as the CBP withhold release orders) have significantly affected U.S. cotton apparel imports from China. Measured by value, only 15.4% of U.S. cotton apparel came from China in 2020, compared with 22.2% in 2019 and 28% back in 2017. While China’s total textile and apparel exports to the US dropped by 30.7% in 2020, China’s cotton textiles and cotton apparel exports to the US went down more sharply by nearly 40%.

Third, despite Covid-19, Asia as a whole remains the single largest source of apparel for the U.S. market. Other than China, Vietnam (19.6% in 2020 vs. 16.2% in 2019), ASEAN (32.3% in 2020 and vs. 27.4% in 2019), Bangladesh (8.2% in 2020 vs.7.1% in 2019), and Cambodia (4.4% in 2020 vs. 3.2% in 2019) all gain additional market shares in 2020 from a year ago.

Fourth, due to seasonal factors, around 21% of U.S. apparel imports came from the Western Hemisphere in December 2020. Notably, to fulfill consumers’ last-minute holiday orders, which require faster speed to market, U.S. fashion companies typically do relatively more near-sourcing from September to December. In comparison, U.S. fashion companies place more sourcing orders with Asian suppliers from June to late September/early October.

However, no clear evidence suggests that U.S. fashion brands and retailers have been giving more apparel sourcing orders to suppliers from the Western Hemisphere because of COVID-19 and the U.S.-China tariff war. In 2020, 9.6% of U.S. apparel imports came from CAFTA-DR members (down from 10.3% in 2019) and 4.1% from USMCA members (down from 4.5% in 2019).

by Sheng Lu

COVID-19 and U.S. Apparel Imports: Key Trends (Updated: January 2021)

First, U.S. apparel imports continue to rebound thanks to consumers’ robust demand. However, the speed of recovery slowed. Specifically, The value of U.S. apparel imports in November 2020 marginally went down by 0.3% from October 2020 (seasonally adjusted), compared with an 8.8% growth from Aug to September and a 4.6% growth from September to October (seasonally adjusted).

As of November 2020, the volume of U.S. apparel imports has recovered to around 85-90% of the pre-coronavirus level.  This result echoes the trend of U.S. apparel retail sales (NAICS 4481), which also indicates a “V-shape” rebound since May 2020.

Data further shows that compared with the 2008 world financial crisis, Covid-19 has caused a more significant drop in the value of U.S. apparel imports. However, it seems the post-Covid recovery process has been more robust than the 2009 financial crisis. The Auto Regressive Integrated Moving Average (ARIMA) model forecasts that at the current speed of recovery, the value of U.S. apparel imports (seasonally adjusted) could start to enjoy a positive year over year (YoY) growth by February 2021 (or around 11 months after the outbreak of Covid-19 in March 2020). In comparison, when recovering from the 2008 world financial crisis, it took almost 15 months to turn the YoY growth rate from negative to positive).

With the new lockdown measures taken in response to the resurgence of the Covid cases, the outlook of US apparel imports remains uncertain. It should also be noted that the period from December to April usually is the light season for apparel imports.

Second, supporting the findings of some recent studies, data suggests that U.S. fashion brands and retailers continue to reduce their “China exposure” in 2020. For example, both the HHI index and market concentration ratios (CR3 and CR5) suggest that apparel sourcing orders are gradually moving from China to other Asian countries.  Related, since August 2020, China’s market shares in total U.S. apparel imports have been sliding both in quantity and in value.

We should NOT ignore the impact of non-economic factors on China’s prospect as an apparel sourcing destination. For example, the reported forced labor issue related to Xinjiang, China, and a series of actions taken by the U.S. government (such as the CBP withhold release orders) have significantly affected U.S. cotton apparel imports from China. Measured by value, from January to November 2020, only 15.4% of U.S. cotton apparel came from China, compared with 22.2% in 2019 and 28% back in 2017. While China’s total textile and apparel exports to the US dropped by 32% in 2020 (Jan to Nov), China’s cotton textiles and cotton apparel exports to the US went down more sharply by 41.1% and 47.2%, respectively.

Third, despite Covid-19, Asia as a whole remains the single largest source of apparel for the U.S. market. Other than China, Vietnam (19.8% YTD in 2020 vs. 16.2% in 2019), ASEAN (32.6% YTD in 2020 and vs. 27.4% in 2019), Bangladesh (8.2% YTD in 2020 vs.7.1% in 2019), and Cambodia (4.4% YTD in 2020 vs. 3.2% in 2019) all gain additional market shares in 2020 (Jan to Nov) from a year ago.

Fourth, still, no clear evidence suggests that U.S. fashion brands and retailers have been giving more apparel sourcing orders to suppliers from the Western Hemisphere because of COVID-19 and the U.S.-China tariff war. In the first eleven months of 2020, 9.4% of U.S. apparel imports came from CAFTA-DR members (down from 10.3% in 2019) and 4.4% from USMCA members (down from 4.5% in 2019). The limited local textile production capacity and the high production cost are the two notable disadvantages of sourcing from the region.

by Sheng Lu

The Impact and Insights of Trade – the 2020 Shakeup & the 2021 Outlook for the Fashion Industry

The panel discussion is part of the 2020 Virtual Apparel and Textile Sourcing Show. Topics covered by the session include:

  • Impact of COVID-19 on US fashion companies’ businesses and sourcing strategies
  • Impact of the 2020 US presidential election on the fashion industry
  • Key US trade policy issues related to the fashion industry 2020-2021
  • Patterns of US apparel sourcing and trade 2020-2021
  • Sourcing from Asia vs. near sourcing from the Western Hemisphere

COVID-19 and U.S. Apparel Imports: Key Trends (Updated: November 2020)

First, U.S. apparel imports continue to rebound thanks to consumers’ robust demand. The value of U.S. apparel imports in September 2020 went up by 8.8% from August 2020 (seasonally adjusted), a new record high since March 2020 when COVID-19 broke out in the States. As of September 2020, the volume of U.S. apparel imports has recovered to around 84-85% of the pre-coronavirus level.  This result echoes the trend of U.S. apparel retail sales (NAICS 4481), which also indicates a “V-shape” rebound since May 2020. As fashion brands and retailers typically build their inventory for holiday sales (such as back to school, Thanksgiving, and Christmas) from July to October, the upward trend of U.S. apparel imports hopefully will last for another 1-2 months.

Data also shows that compared with the 2008 world financial crisis, Covid-19 has caused a more significant drop in the value of U.S. apparel imports. However, it seems the post-Covid recovery process has been more robust than the 2008 financial crisis. Notably, the Auto Regressive Integrated Moving Average (ARIMA) model forecasts that at the current speed of recovery, the value of U.S. apparel imports (seasonally adjusted) could start to enjoy a positive year over year (YoY) growth by February 2021 (or around 11 months after the outbreak of Covid-19 in March 2020). In comparison, when recovering from the 2008 world financial crisis, it took almost 15 months to turn the YoY growth rate from negative to positive.

Second, still, no evidence suggests that U.S. fashion companies are giving up China as one of their essential apparel-sourcing bases. Notably, since May 2020, China had quickly regained its position as the top apparel supplier to the U.S. market. From June to September 2020, China’s market shares have stably stayed at around 27-28% in value and 40-42% in quantity.

According to the media, some sourcing orders are returning to China as China’s competitors in Asia are struggling with more limited production capacity, shortage of raw material and supply chain disruption caused by Covid-19.

CR5 (exclude China) includes Vietnam, Bangladesh, Indonesia, India and Cambodia

That being said, trade data suggests that U.S. fashion companies continue to reduce their “China exposure” overall. For example, both the HHI index and the market concentration ratios (CR3–total market shares of top 3 suppliers and CR5–total market shares of top 5 suppliers) indicate that apparel sourcing orders are gradually moving from China to other Asian countries–it is interesting to see HHI, CR3 and CR5 all suggest a more diversified apparel sourcing base in 2020 (Jan-Sep) than in 2018 and 2019; however, the value of CR5 (exclude China) reached a new record high in 2020 (Jan-Sep).

Third, related to the point above, despite Covid-19, Asia as a whole remains the single largest source of apparel for the U.S. market. Other than China, Vietnam (20.0% YTD in 2020 vs. 16.2% in 2019), ASEAN (33.1% YTD in 2020 and vs. 27.4% in 2019), Bangladesh (8.4% YTD in 2020 vs.7.1% in 2019), and Cambodia (4.4% YTD in 2020 vs. 3.2% in 2019) all gain additional market shares in 2020 from a year ago.

Fourth, still, no clear evidence suggests that U.S. fashion brands and retailers have been giving more apparel sourcing orders to suppliers from the Western Hemisphere because of COVID-19 and the trade war. In the first nine months of 2020, only 9.1% of U.S. apparel imports came from CAFTA-DR members (down from 10.3% in 2019) and 4.4% from USMCA members (down from 4.5% in 2019). Confirming the trend, in the first nine months of 2020, the value of U.S. yarns and fabrics exports to USMCA and CAFTA-DR members also suffered a 26% decline from a year ago. The heavy reliance on textile supply from the U.S. (implying more vulnerability to the Covid-19 supply chain disruptions) and the price disadvantage could be among the major contributing factors.

Just an anecdote–according to some industry insiders, the booming of E-commerce during the pandemic may also possibly explain why “near sourcing” is not reflected in trade data despite its reported growing popularity. Specifically, US fashion retailers would:1) import products from Asia and stock them in the bonded warehouses in Mexico (note: bonded warehouse means dutiable goods may be stored, manipulated, or undergo manufacturing operations without payment of duty). 2) When US consumers place orders, the retailer will ship products directly from these bonded warehouses in Mexico to the final destination. Most importantly, retailers could take advantage of the US de minimis rule (i.e., goods valued at $800 or less could enter the U.S. duty-free one person one day) and avoid paying tariffs– even though these products are counted as imports from Asian countries that do not have a free trade agreement with the United States. In other words, these products are not officially treated as imports from Mexico even though they are shipped from bonded warehouse in Mexico.

by Sheng Lu

USMCA: Changes for the Textile and Wearing Apparel Industries

From findings of the 2020 USFIA Fashion Industry Benchmarking Study :

The surveyed U.S. fashion companies demonstrate more readiness and interest in using the US-Mexico-Canada Trade Agreement (USMCA) for apparel sourcing purposes in 2020 than a year ago:

For companies that were already using NAFTA for sourcing, the vast majority (77.8 percent) say they are “ready to achieve any USMCA benefits immediately,” up more than 31 percent from 2019.

Even for respondents who were not using NAFTA or sourcing from the region, about half of them this year say they may “consider North American sourcing in the future” and explore the USMCA benefits.

Nevertheless, when asked about the potential impact of USMCA on companies’ apparel sourcing practices, some respondents expressed concerns about the rules of origin changes. These worries seem to concentrate on denim products in particular. For example, one respondent says, “USMCA changes negatively affects our denim jeans sourcing particularly with the new pocketing rules of origin.” Another adds, “Denim pocketing ROO change is a concern but manageable.” 

It also remains to be seen whether USMCA will boost “Made in the USA” fibers, yarns, and fabrics by limiting the use of non-USMCA textile inputs. For example, while the new agreement expands the Tariff Preference Level (TPL) for U.S. cotton/man-made fiber apparel exports to Canada (typically with a 100 percent utilization rate), these apparel products are NOT required to use U.S.-made yarns and fabrics.

Related readings:

COVID-19 and U.S. Apparel Imports: Key Trends (Updated: October 2020)

First, U.S. apparel imports continue to rebound thanks to consumers’ robust demand. The value of U.S. apparel imports in August 2020 went up by 7.6% from July 2020 (seasonally adjusted), a new record high since March 2020 when COVID-19 broke out in the States. As of August 2020, the volume of U.S. apparel imports has recovered to around 80% of the pre-coronavirus level.  This result echoes the trend of U.S. apparel retail sales (NAICS 448), which also indicates a “V-shape” rebound since May 2020. As fashion brands and retailers typically build their inventory for holiday sales (such as back to school, Thanksgiving, and Christmas) from July to October, the upward trend of U.S. apparel imports hopefully will last for another 1-2 months.

Nevertheless, between January and August 2020, the value of U.S. apparel imports decreased by almost 30% year over year, which has been MUCH worse than the performance during the 2008-2009 global financial crisis (down 11.8%).

Second, no evidence suggests that U.S. fashion companies are giving up China as one of their essential apparel-sourcing bases. Notably, since May 2020, China had quickly regained its position as the top apparel supplier to the U.S. market. From June to August 2020, China’s market shares have stably stayed at around 27-28% in value and 40-42% in quantity.

Some industry sources show that “Made in China” enjoys two notable advantages that other apparel supplying countries cannot catch up in the short term. 1) unparalleled production capacity, meaning importers can source almost all products in any quantity from China vs. more limited production capacity (both in terms of variety and volume) in other alternative sourcing destinations. 2) China can mostly produce textile raw material locally vs. many apparel exporting countries still rely heavily on imported yarns and fabrics (supplied by China).

However, non-economic factors, particularly the reported Xinjiang forced labor issue, are complicating fashion companies’ sourcing decisions. Notably, US cotton apparel imports from China year-to-date (YTD) in 2020 (Jan to August) significantly decreased by 54% from a year ago, much higher than the 22% drop in US imports from the rest of the world.  As a result, China’s market share in the US cotton apparel import market sharply declined from 22% in 2019 to only 15.1% in 2020 (Jan-Aug), a record low in the past ten years. This unusual trade pattern suggests that the concerns about social compliance risk are holding US fashion companies back from sourcing cotton apparel products from China. As the forced labor issue continues to evolve and become ever more sensitive and high profile, it is not unlikely that US fashion companies may substantially cut their China sourcing further, even if it is not a preferred choice economically.

Third, despite Covid-19, Asia as a whole remains the single largest source of apparel for the U.S. market. Other than China, Vietnam (20.2% YTD in 2020 vs. 16.2% in 2019), ASEAN (33.6% YTD in 2020 and vs. 27.4% in 2019), Bangladesh (8.6% YTD in 2020 vs.7.1% in 2019), and Cambodia (4.5% YTD in 2020 vs. 3.2% in 2019) all gain additional market shares in 2020 from a year ago.

Likewise, thanks to a highly integrated regional textile and apparel supply chain, Asian countries all together were able to maintain fairly stable market shares on the world stage over the past decade despite all market disruptions, from the financial crisis, trade war to the wage increase.

Fourth, still, no clear evidence suggests that U.S. fashion brands and retailers have been giving more apparel sourcing orders to suppliers from the Western Hemisphere because of COVID-19 and the trade war. In the first seven months of 2020, only 8.9% of U.S. apparel imports came from CAFTA-DR members (down from 10.3% in 2019) and 4.1% from USMCA members (down from 4.5% in 2019). Confirming the trend, in the first eight months of 2020, the value of U.S. yarns and fabrics exports to USMCA and CAFTA-DR members also suffered a 28.0% decline from a year ago. The heavy reliance on textile supply from the U.S. (implying more vulnerability to the Covid-19 supply chain disruptions) and the price disadvantage could be among the contributing factors.

Further, industry sources show that the apparel products U.S. fashion companies import from members of USMCA and CAFTA-DR predominantly are tops and bottoms. The lack of production capacity for other product categories significantly limits the growth potential of these countries playing the role as a leading sourcing base.

by Sheng Lu

COVID-19 and U.S. Apparel Imports (Updated: September 2020)

The latest statistics from the Office of Textiles and Apparel (OTEXA) show that the patterns of U.S. apparel imports continue to involve because of COVID-19 and the escalating US-China tensions. Meanwhile, there appeared to be more potent signs of gradual economic recovery in the U.S. driven by consumers’ robust demand. Specifically:

While the value of U.S. apparel imports decreased by 32.0% in July 2020 from a year ago, the speed of the decline has significantly slowed (was down 60% and 42.8% year over year in May and June 2020, respectively). This result echoes the trend of U.S. apparel retail sales (NAICS 448), which indicates a “V-shape” rebound since May 2020. As fashion brands and retailers typically build their inventory for holiday sales (such as back to school, Thanksgiving, and Christmas) from July to October, the upward trend of U.S. apparel imports could continue in the next two to three months.

Nevertheless, between January and July 2020, the value of U.S. apparel imports decreased by 30.7% year over year, which has been much worse than the performance during the 2008-2009 global financial crisis (down 11.8%).

The latest trade statistics suggest that based on economic factors, U.S. fashion companies would like to continue to treat China as an essential apparel-sourcing base. As the first country hit by COVID-19, China’s apparel exports to the U.S. dropped by as much as 49.3% from January to July 2020 year over year. In February 2020, China’s market shares slipped to only 11%, and both in March and April 2020, U.S. fashion companies imported more apparel from Vietnam than from China. However, China had quickly regained its position as the top apparel supplier to the U.S., with a 26.3% market share in value and a 38.8% share in quantity in July 2020.

Different from the impact of the trade war, COVID-19 could benefit China as an apparel sourcing base as fashion companies have to “do more with fewer resources.” In general, China still enjoyed two notable advantages that other apparel supplying countries are unable to catch up in the short term. 1) unparalleled production capacity, meaning importers can source almost all products in any quantity from China vs. more limited production capacity (both in terms of variety and volume) in other alternative sourcing destinations. 2) China can mostly produce textile raw material locally vs. many apparel exporting countries still rely heavily on imported yarns and fabrics (supplied by China).

Contrary to common perceptions, apparel “Made in China” apparently are also becoming more price-competitive–the unit price slipped from $2.25/Square meters equivalent (SME) in 2019 to $1.88/SME in 2020 (January to July), or down more than 16.7% (compared with a 5.6% price drop of the world average). As of July 2020, the unit price of U.S. apparel import from China was only 65.7% of the world average, and around 25—35 percent lower than those imported from other Asian countries.

That being said, non-economic factors, from the deteriorating US-China relations to the reported Xinjiang forced labor issue, are increasingly complicating fashion companies’ sourcing decisions. Somehow as a warning sign, China’s market shares in the U.S. apparel import market slipped in both quantity and value terms in July 2020 compared with a month ago.

Despite Covid-19, Asia as a whole remains the single largest source of apparel for the U.S. market. Other than China, Vietnam (20.5% YTD in 2020 vs. 16.2% in 2019), ASEAN (34.3% YTD in 2020 and vs. 27.4% in 2019), Bangladesh (8.6% YTD in 2020 vs.7.1% in 2019), and Cambodia (4.5% YTD in 2020 vs. 3.2% in 2019) all gain additional market shares in 2020 from a year ago.

However, still, no clear evidence suggests that U.S. fashion brands and retailers have been giving more apparel sourcing orders to suppliers from the Western Hemisphere because of COVID-19 and the trade war. In the first seven months of 2020, only 8.8% of U.S. apparel imports came from CAFTA-DR members (down from 10.3% in 2019) and 4.1% from USMCA members (down from 4.5% in 2019). Confirming the trend, in the first seven months of 2020, the value of U.S. yarns and fabrics exports to USMCA and CAFTA-DR members also suffered a 28.9% decline from a year ago. The heavy reliance on textile supply from the U.S. (implying more vulnerability to the Covid-19 supply chain disruptions) and the price disadvantage could be among the contributing factors why near sourcing has been stagnant.

As a reflection of weak demand, the unit price of U.S. apparel imports was lower in the first six months of 2020. The price index declined from 104.7 in 2019 to 99.0 YTD (Jan to Jul) in 2020 (Year 2010 =100). The imports from Mexico (price index =86.4 YTD in 2020 vs. 112.1 in 2019) and China (price index = 69.7 YTD in 2020 vs. 83.5 in 2019) have seen the most notable price decrease so far.

by Sheng Lu

2020 USFIA Fashion Industry Benchmarking Study Released

The 2021 USFIA Fashion Industry Benchmarking Study is Released

The full report is available HERE

Key findings of this year’s report:

Impact of COVID19 on Fashion Companies’ Businesses

The overwhelming majority of respondents report “economic and business impacts of the coronavirus (COVID-19)” as their top business challenge in 2020. The business difficulties caused by COVID-19 will not go away anytime soon, and U.S. fashion companies have to prepare for a medium to the long-term impact of the pandemic.

COVID-19 has caused severe supply chain disruptions to U.S. fashion companies. The disruptions come from multiple aspects, ranging from a labor shortage, shortages of textile raw materials, and a substantial cost increase in shipping and logistics.

COVID-19 has resulted in a widespread sales decline and order cancellation among U.S. fashion companies. Almost all respondents (96 percent) expect their companies’ sales revenue to decrease in 2020.

As sales drop and business operations are significantly disrupted, not surprisingly, all respondents (100 percent) say they more or less have postponed or canceled sourcing orders. Nearly half of self-identified retailers say the sourcing orders they canceled or postponed go beyond the 2nd quarter of 2020. Another 40 percent expect order cancellation and postponement could extend further to the fourth quarter of 2020 or even beyond. The order cancellation or postponement has affected vendors in China, Bangladesh, and India the most.

Impact of COVID-19 and US-China Trade War on Fashion Companies’ Sourcing

As high as 90 percent of respondents explicitly say, the U.S. Section 301 action against China has increased their company’s sourcing cost in 2020, up from 63 percent last year.

COVID-19 and the trade war are pushing U.S. fashion companies to reduce their “China exposure” further. While “China plus Vietnam plus Many” remains the most popular sourcing model among respondents, around 29 percent of respondents indicate that they source MORE from Vietnam than from China in 2020, up further from 25 percent in 2019.

As U.S. fashion companies are sourcing relatively less from China, they are moving orders mostly to China’s competitors in Asia. All respondents (100 percent) say they have “moved some sourcing orders from China to other Asian suppliers” this year, up from 77 percent in 2019.

However, no clear evidence suggests that U.S. fashion companies are sourcing more from the Western Hemisphere because of COVID-19 and the U.S.-China trade war.

Emerging Sourcing Trends

Sourcing diversification is slowing down, and more U.S. fashion companies are switching to consolidate their existing sourcing base. Close to half of the respondents say they plan to “source from the same number of countries, but work with fewer vendors,” up from 40 percent in last year’s survey.

China most likely will remain a critical sourcing base for U.S. fashion companies. However, non-economic factors could complicate companies’ sourcing decisions. Benefiting from U.S. fashion companies’ reduced sourcing from China, Vietnam and Bangladesh are expected to play a more significant role as primary apparel suppliers for the U.S. market.

Given the supply chain disruptions experienced during the pandemic, U.S. fashion companies are more actively exploring “Made in the USA” sourcing opportunities to improve agility and flexibility and reduce sourcing risks. Around 25 percent of respondents expect to somewhat increase sourcing locally from the U.S. in the next two years, which is the highest level since 2016.

US-Mexico-Canada Trade Agreement (USMCA)

For companies that were already using NAFTA for sourcing, the vast majority (77.8 percent) say they are “ready to achieve any USMCA benefits immediately,” up more than 31 percent from 2019. Even for respondents who were not using NAFTA or sourcing from the region, about half of them this year say they may “consider North American sourcing in the future” and explore the USMCA benefits. Some respondents expressed concerns about the rules of origin changes. These worries seem to concentrate on denim products in particular.

African Growth and Opportunity Act (AGOA)

Close to 37 percent of respondents say they have been sourcing MORE textile and apparel from sub-Saharan Africa (SSA) since the latest AGOA renewal in 2015, a substantial increase from 27 percent in the 2019 survey. More than 40 percent of respondents say AGOA and its “third-country fabric provision” are critical for their sourcing from the SSA region. More than 40 percent of respondents say AGOA and its “third-country fabric provision” are critical for their sourcing from the SSA region.

However, respondents still demonstrate a low level of interest in investing in the SSA region directly. Around 27 percent of respondents say the temporary nature of AGOA and the uncertainty associated with the future of the agreement have discouraged them.

With AGOA’s expiration date quickly approaching, the discussions on the future of the agreement and the prospect of sourcing from SSA begin to intensify. Among the various policy options to consider, “Renew AGOA for another ten years with no major change of its current provisions” and “Replace AGOA with a permanent free trade agreement that requires reciprocal tariff cut and continues to allow the third-country fabric provision” are the most preferred by respondents.

COVID-19 and U.S. Apparel Imports (Updated: July 2020)

The latest statistics from the Office of Textiles and Apparel (OTEXA) show that COVID-19 continued to enlarge its negative impact on U.S. apparel imports in May 2020, and the path to recovery will NOT be straightforward and quick. Specifically:

The value of U.S. apparel imports decreased by more than 60% in May 2020 from a year ago, setting a new record of single-month loss in trade volumes. Between January and May 2020, the value of U.S. apparel imports decreased by 27.8% year over year, which has been much worse than the performance during the 2008-2009 global financial crisis (down 11.8%).

As the first country hit by Covid-19, China’s apparel exports to the U.S. dropped by 60.2% in May 2020 from a year ago, close to its performance in April 2020 (down 59% YoY). While the figure itself is far from exciting, it suggests the sinking of China’s apparel exports could have hit bottom. As an important sign, China regained its position as the largest apparel supplier to the U.S. in May 2020, with 27.2% market shares in value and 41.4% market shares in quantity. Notably, this is a significant rebound from only 11% market shares back in February 2020. Overall, it seems U.S. fashion brands and retailers continue to treat China as an essential and probably indispensable apparel sourcing base, despite a new low of U.S.-China relations and companies’ sourcing diversification strategy. Meanwhile, the official Chinese statistics report a 20.3% drop in China’s apparel exports in the first five months of 2020.

Despite Covid-19, Asia as a whole remains the single largest source of apparel for the U.S. market. Other than China, Vietnam (20.1% YTD in 2020 vs. 16.2% in 2019), ASEAN (34.6% YTD in 2020 and vs. 27.4% in 2019) and Bangladesh (9.4% YTD in 2020 vs.7.1% in 2019) all gain additional market shares in 2020 from a year ago.

However, no clear evidence has suggested that U.S. fashion brands and retailers are giving more apparel sourcing orders to suppliers from the Western Hemisphere. In the first five months of 2020, still, only 9.1% of U.S. apparel imports came from CAFTA-DR members (down from 10.3% in 2019) and 4.0% from NAFTA members (down from 4.5% in 2019). Two factors might explain the pattern: 1) Due to factory lock-down, the production capacity in the Western Hemisphere is affected negatively; 2) With an unrepresented high level of unemployment, U.S. consumers are becoming ever more price sensitive.  However, apparel produced in the Western Hemisphere, in general, are less price competitive than those made in Asia.

As a reflection of weak demand, the unit price of U.S. apparel imports was lower in the first five months of 2020 (price index =101.5) compared with 2019 (price index =104.7).  Imports from China have seen the most notable price decrease so far (price index =71.0 YTD in 2020 vs. 83.5 in 2019).

by Sheng Lu

USTR Factsheet: Textiles and Apparel and the US-Mexico-Canada Free Trade Agreement (USMCA)

USMCA-Textiles.jpg

The factsheet is available in PDF

Background

On December 10, 2019, the United States, Mexico and Canada reached an updated U.S.-Mexico-Canada Free Trade Agreement (USMCA). USMCA officially enters into force on 1 July 2020. Compared with the version signed in September 2018, the new USMCA includes even higher labor and environmental standards and stronger enforcement mechanisms for these rules. According to the released protocol of amendment, no change has been made to the Textiles Chapter, however.

EMBHEbLWsAAZWJ2.jpg

Textiles and Apparel and USMCA

First, in general, USMCA still adopts the so-called “yarn-forward” rules of origin. This means that fibers may be produced anywhere, but each component starting with the yarn used to make the garments must be formed within the free trade area – that is, by USMCA members.

Second, other than the source of yarns and fabrics, USMCA now requires that some specific parts of an apparel item (such as pocket bag fabric) need to use inputs made in the USMCA region so that the finished apparel item can qualify for the import duty-free treatment.

Third, USMCA allows a relatively more generous De minimis than NAFTA 1.0.

Fourth, USMCA seems to be a “balanced deal” that has accommodated the arguments from all sides regarding the tariff preference level (TPL) mechanism:

  • Compared with NAFTA, USMCA will cut the TPL level, but only to those product categories with a low TPL utilization rate;
  • Compared with NAFTA, USMCA will expand the TPL level for a few product categories with a high TPL utilization rate.

Fifth, USMCA will make no change to the Commercial availability/short supply list mechanism in NAFTA 1.0.

Sixth, it remains to be seen whether USMCA will boost “Made in the USA” fibers, yarns and fabrics by limiting the use of non-USMCA textile inputs. For example, while the new agreement expands the TPL level for U.S. cotton/man-made fiber apparel exports to Canada (currently with a 100 percent utilization rate), these apparel products are NOT required to use U.S.-made yarns and fabrics. The utilization rate of USMCA will also be important to watch in the future.

(Additional reading: Apparel-specific rules of origin in USMCA)

Economic Impacts of USMCA on the Textile and Apparel Sector

According to an independent assessment by the U.S. International Trade Commission (USITC) released on April 19, 2019:

First, USMCA overall is a balanced deal for the textile and apparel sector, particularly regarding the rules of origin (RoO) debate. As USITC noted, USMCA eases the requirements for duty-free treatment for certain textile and apparel products, but tighten the requirements for other products.

Second, the USMCA changes to the Tariff Preference Level (TPLs) would not have much effect on related trade flows. As USITC noted in its report, where USMCA would cut the TPL level on particular U.S. imports from Canada or Mexico, the quantitative limit for these product categories was not fully utilized in the past.  Meanwhile, the TPL level for product categories typically fully used would remain unchanged under USMCA. The only trade flow that might enjoy a notable increase is the U.S. cotton and man-made fiber (MMF) apparel exports to Canada—the TPL is increased to 20million SME annually under USMCA from 9 million under NAFTA.

Third, USITC suggested that in aggregate, the changes under USMCA for the textile and apparel sector will more or less balance each other out and USMCA would NOT affect the overall utilization of USMCA’s duty-free provisions significantly. Notably, the under-utilization of free trade agreements (FTAs) by U.S. companies in apparel sourcing has been a long-time issue. Data from the Office of Textiles and Apparel (OTEXA) shows that of the total $4,163 million U.S. apparel imports from the NAFTA region in 2019, around $3,742 million (or 89.9%) claimed the preferential duty benefits under the agreement. As noted in the U.S. Fashion Industry Benchmarking Study, some U.S. fashion companies do not claim the duty savings largely because of the restrictive RoO and the onerous documentation requirements.

North American Apparel Market Leaders Talk

Panelists:

  • Julia Hughes, President, United States Fashion Industry Association (USFIA)
  • Bob Kirke, Executive Director, Canadian Apparel Federation (CAF)

Topics covered:

  • Textile and apparel trade policy updates
  • Impact of COVID-19 on the apparel sector and fashion companies’ responses
  • U.S.-Mexico-Canada  Trade Agreement (USMCA)
  • Forced labor and related compliance issues

Production and Export Strategies of U.S. Textile and Apparel Manufacturers

Presenter: Kendall Keough (MS 2020, Fashion and Apparel Studies)

Textiles and apparel “Made in the USA” are gaining growing attention in recent years amid the escalating U.S.-China trade war, the rising cost of imports, and consumers’ increasing demand for “speed to market.” Statistics show that the value of U.S. textile and apparel (T&A) production totaled $US28.1bn in 2018, which was a record high since 2010. Meanwhile, different from the old days, more and more T&A “Made in the USA” are sold overseas today. According to the Office of Textiles and Apparel (OTEXA) under the U.S. Department of Commerce, the value of U.S. T&A exports reached US$22.9bn in 2019, up nearly 20% from ten years ago.

Despite the strong performance in production and export, however, U.S. T&A manufacturers do not seem to be “visible” enough. Given the information gap, we recently analyzed the 122 U.S. T&A manufacturers included in the OTEXA “Made in the USA” database. Information in the database is self-reported by companies and then verified by OTEXA. Our analysis intends to gain more insights into the state of U.S. T&A mills, including their demographics, production and supply chain strategies, as well as their export behaviors.

Key findings:

First, U.S. T&A manufacturers display a relatively high concentration of geographic locations. Notably, as much as 61% of self-reported yarn manufacturers are from North Carolina (NC), followed by South Carolina (SC), which accounts for another 11%. The concentration of yarn manufacturing in the south, in particular, can be attributed to the abundant cotton supply in that region. Meanwhile, California (CA) has one of the most complete T&A supply chains in the country, with the presence of manufacturers across all T&A sub-sectors.

Second, large-size textile mills are gradually emerging in the United States, whereas U.S. apparel manufacturers are predominantly small and medium-sized. U.S. textile mills, in general, have a high concentration of factories with over 100 employees, particularly those engaged in producing yarns (53%), fabrics (37%), and technical textiles (38%). In the past decade, many relatively small-sized U.S. textile mills had merged into larger ones to take advantage of the economies of scale and reduce production cost. In comparison, over half of the apparel mills in the OTEXA database reported having less than 50 employees. Notably, because of the significant disadvantage in labor cost, U.S. apparel mills are not trying to replace imports, but instead focusing on their “niche market.” For example, designer-based micro-factories are popular these days in U.S. fashion centers such as New York City and California. These factories typically provide customized services, ranging from proto-typing to sample production.

Third, “fabric + apparel” and “fabric + technical textiles” are the two most popular types of vertical integration among U.S. T&A mills. A relatively small proportion of T&A mills included in the OTEXA database had adopted the vertical integration business strategy. Notably, fabric mills seem to be most actively engaged in the vertical integration strategy–around one-third of them reported also making apparel, technical textiles, or home textiles. Additionally, 20% of technical textile manufacturers in the OTEXA database have incorporated an apparel component to their product portfolio. This is a significant trend to watch as more and more sportswear brands are developing technology-driven functional apparel. However, we find few U.S. T&A mills have created a vertical integration model that covers three or more different nature of products.

Fourth, U.S. T&A mills have shifted from only making products to also offering various value-added services. Notably, the majority of companies included in the OTEXA “Made in the USA” database reported having the in-house design capability, including apparel mills (86%), fabric mills (80%), yarn manufacturers (61%), home textiles manufacturers (71%) as well as those making technical textiles (91%). U.S. T&A mills also commonly describe themselves as “innovators” and “solutions providers” on their websites to highlight that the nature of their core business is to serve customers’ needs rather than just “making” physical products.

Fifth, exporting has become an important economic activity of U.S. T&A manufacturers today. Notably, of all the 122 U.S. T&A manufacturers in the OTEXA “Made in the USA” database, as many as 70.5% reported engaged in export, a trend which echoes the rising value of U.S. textile and apparel exports in recent years. Regarding the particular export behaviors of U.S. T&A mills, several patterns are interesting to note:

  • U.S. textile mills (76%) are more actively engaged in export than those that make apparel products only (37%).
  • Larger U.S. T&A mills overall had a higher percentage engaged in export than those manufacturers smaller in size.
  • The Western Hemisphere is the dominant export market for U.S. yarn, fabric, and home textile mills, whereas the export markets for U.S. apparel mills and technical textile producers are relatively more diverse.
  • Except for apparel producers, the export diversification strategy is commonly adopted by U.S. T&A mills. As many as 77% of yarn manufacturers included in the OTEXA database reported exporting to three or more different markets in the world. Likewise, around 40% of the fabric, home textiles, and technical textiles mills did the same.
  • Free trade agreements support U.S. T&A exports. A high percentage of U.S. T&A mills that reported exporting to the Western Hemisphere said they took advantage of NAFTA and CAFTA-DR, two primary U.S. free trade agreements with the region. The utilization of NAFTA and CAFTA-DR is particularly high among U.S. yarn producers (83.3%).

Sixth, imports support textile and apparel “Made in the USA”.  Using imported inputs such as cut parts, fabrics, accessories and trims is a very common practice among U.S. textile and apparel manufacturers. Notably, more than 76% of companies which make apparel in the United States say they use imported inputs, followed by companies which make technical textiles (52%) and fabrics (46%). Moreover, the lack of sufficient supply of locally made fabrics is the top reason why U.S. textile and apparel companies use imports as alternatives. 

Additional reading: Kendall Keough and Sheng Lu. (2020). ‘Made in the USA’ textiles and apparel – Key production and export trends. Just-Style.

Explore Canada’s Apparel Sourcing Patterns

Presenter: Mikayla Dubreuil  (MS 2020, Fashion and Apparel Studies)

Canada is one of the world’s top ten largest apparel consumption markets, with retail sales totaling USD$28.04bn in 2019 (Euromonitor, 2020). Similar to other developed nations, clothing sold in Canada is predominately imported, making Canada a significant market access opportunity for clothing manufacturers, wholesalers, fashion brands, and retailers around the world. Based on the latest market and trade data, this study intends to provide an in-depth analysis of the Canadian apparel sourcing patterns.

Key findings:

Presentation1

First, the volume of Canada’s apparel imports mirrors its economic growth. As the apparel business is buyer-driven, the performance of Canada’s national economy has a huge impact on its apparel imports. Canada’s GDP growth is an important predictor for its growth in apparel imports.  When Canada’s national economy boomed, its apparel imports also enjoyed a proportional expansion thanks to consumers’ higher income and purchasing power. Such a strong correlation, however, also suggests a likely sharp decline in Canada’s apparel imports in 2020 due to its national economy took a hard hit by the Covid-19 pandemic. [Note: with a 6.2% drop in GDP growth as forecasted by IMF, Canada’s apparel imports in 2020 could decrease by 16.4% from 2019. At the 95% confidence level, the worst case in 2020 will be a 29% decline of apparel imports from a year earlier and the most optimistic case will be a 4% decline.]

Untitled

Second, although China remains the top apparel supplier for Canada, Canadian fashion companies are increasingly sourcing from South Asia. Three trends to note: 1) China’s market share in Canada has been declining steadily from its peak in the 2010s. 2) Meanwhile. Canada is moving more sourcing orders to other Asian countries, particularly Vietnam and Bangladesh. 3) Additionally, thanks to the EU-Canada Free Trade Agreement (CETA), which provisionally entered into force in 2017, Canada’s apparel imports from the European Union (EU) has been rising steadily. In 2019, EU members altogether accounted for 6% of Canada’s apparel imports, an increase from 4% in 2010. Around half of Canada’s apparel imports from the EU are made in Italy, whose high-end luxury apparel exports could be among the biggest beneficiaries of the duty-saving opportunities provided by CETA.

Third, near sourcing from the Americas remains an essential component of Canadian fashion companies’ sourcing portfolio; However, sourcing from the NAFTA regions is in decline.  Approximately 9% of Canada’s apparel imports come from North, Central, and South Americas altogether, a pattern that has stayed relatively stable since 2010. As consumers in Canada are seeking “faster fashion”, Canadian fashion companies are attaching even greater importance to leveraging near sourcing from the Americas and improving their speed to market. For example, Lululemon placed around 8% of its sourcing orders with factories in the Americas in 2018, higher than 3%-5% five years ago.

4

Canada’s apparel imports from members of the North American Free Trade Agreement (NAFTA), however, has suffered a notable drop from 12.3% back in 2005 to the record low of 5.4% in 2019. As President Trump repeatedly threatened to withdraw the United States from NAFTA since he took office in 2017, the mounting uncertainty had caused Canadian fashion companies to cut sourcing from the region. For years, many Canadian fashion companies have been actively using the tariff preference level (TPL) mechanism to import apparel from the NAFTA region, although only a limited amount of TPL quota is allowed each year. While the TPL utilization rate for Canada’s cotton and man-made fiber apparel imports from the United States always reached 100%, the utilization rate slipped to a record low of 84% in 2019.

The upcoming implementation of the U.S.-Mexico-Canada Free Trade Agreement (USMCA or NAFTA2.0) on July 1, 2020 could help create a more stable environment for Canadian fashion companies interested in sourcing from the United States and Mexico. However, as USMCA fails to add any significant flexibility to the NAFTA apparel-specific rules of origin, whether the new agreement will improve the attractiveness of sourcing from North America for Canadian fashion companies remains to be seen.

by Mikayla DuBreuil and Sheng Lu

Additional Reading: Mikayla DuBreuil and Sheng Lu (2020). Canada’s clothing market – Top selling and sourcing trendsJust-Style.

2018 U.S. Fashion Industry Benchmarking Study Released

The 2019 U.S. Fashion Industry Benchmarking Study is now availablecover

The report can be downloaded from HERE

Key findings of this year’s study:

Business challenges facing U.S. fashion companies: Protectionism is the top challenge for the U.S. fashion industry in 2018. More companies worry about increases in production or sourcing cost, too. For the second year in a row, “protectionist trade policy agenda in the United States” ranks the top challenge for U.S. fashion companies in 2018.

Industry outlook: Despite concerns about trade policy and cost, executives are more confident about the five-year outlook for the U.S. fashion industry in 2018 than they were a year ago, although confidence has not fully recovered to the level seen in 2015 and 2016. In addition, 100 percent of respondents say they plan to hire more employees in the next five years, compared with 80-85 percent in previous studies; market analysts, data scientists, sustainability/compliance related specialists or managers, and supply chain specialists are expected to be the most in-demand.

U.S. fashion companies’ sourcing strategy: When it comes to sourcing, diversification is key for many companies.

  • Most respondents continue to maintain a diverse sourcing base, with 60.7 percent currently sourcing from 10+ different countries or regions, up from 57.6 percent in 2017.
  • Larger companies, in general, continue to be more diversified than smaller companies.
  • Reflecting the U.S. fashion industry’s growing global reach, respondents report sourcing from as many as 51 countries or regions in 2018, the same as in 2017. Asia as a whole continues to take the lead as the dominant sourcing region. Meanwhile, with the growing importance of speed-to-market and flexibility, the Western Hemisphere is becoming an indispensable sourcing base.
  • Keeping a relatively diverse sourcing base will remain a key element of U.S. fashion companies’ sourcing strategy. Nearly 80 percent of respondents plan to source from the same number of countries, or more countries, in the next two years. However, respondents are equally divided on whether to increase or decrease the number of suppliers they will work with.
  • China plus Vietnam plus Many” has become an ever more popular sourcing model among respondents. And this model is evolving as companies further diversify their China production. In particular, China now typically accounts for only 11-30 percent of companies’ total sourcing value or volume, compared with 30-50 percent in the past.
  • Although China’s position as the top sourcing destination is unshakable, companies are actively seeking alternatives to “Made in China.” This does not seem to be due to concerns about cost, but rather the worries about the escalating U.S.-China trade tensions.
  • Benefiting from the diversification away from China, Vietnam and Bangladesh are expected to play a bigger role as apparel suppliers for the U.S. market in the near future.

Rules of origin and the utilization of trade agreements for sourcing: Rules of origin, and exceptions to the rules of origin, significantly impact whether companies use free trade agreements (FTAs) and trade preference programs for sourcing.

  • While FTAs and trade preference programs remain largely underutilized by U.S. fashion companies, more companies are using NAFTA (65 percent), CAFTA-DR (58 percent) and AGOA (50 percent) than in the past two years.
  • Still, it’s concerning that companies often do not claim the duty-free benefits when sourcing from countries with FTAs or preference programs. Companies say this is primarily due to the strict rules of origin.
  • Exceptions to the “yarn-forward” rules of origin, including tariff preference levels (TPLs), commercial availability/short supply lists, and cumulation, are priorities for respondents; 48 percent say they currently use these mechanisms for sourcing. These exceptions provide critical flexibilities that make companies more likely to use FTAs and source from FTA regions.

NAFTA: U.S. fashion companies call for a further reduction of trade barriers and urge trade negotiators to “do no harm” to NAFTA, the most-utilized free trade agreement by respondents.

  • Respondents predominantly support initiatives to eliminate trade barriers of all kinds, from high tariffs to overcomplicated documentation requirements, to restrictive rules of origin in NAFTA and future free trade agreements.
  • More than half of respondents explicitly say NAFTA is important to their business—and they have grave concerns about the uncertain future of the agreement.

Sourcing in sustainable and socially compliant ways: Overall, U.S. fashion companies are making more commitments to sustainability and social responsibility.

  • 85 percent of respondents plan to allocate more resources for sustainability and social compliance in the next two years, in areas including providing training to suppliers and internal employees, adding more employees, and working more closely with third-party certification programs on sustainability and social compliance. However, the availability of operational budget remains the primary hurdle for companies that want to do more.
  • 100 percent of respondents map their supply chains (i.e., keep records of name, location, and function of suppliers), up from 90 percent in 2017. Over 80 percent of respondents track not only Tier 1 suppliers (i.e., factory where the final product is assembled), but also Tier 2 suppliers (i.e., subcontractors or major component suppliers, such as fabrics). However, it’s less common for companies to map Tier 3 (i.e., yarn spinners, finding and trimming suppliers) and Tier 4 suppliers (i.e., raw materials suppliers, such as cattle/pig hides, rubber, cotton, wool, goose down, minerals/metals and chemicals).
  • 100 percent of respondents audit their suppliers for issues including building safety, fire safety, and treatment of workers. The vast majority of respondents (96 percent) currently use third-party certification programs to audit, with both announced and unannounced audits.

The US Fashion Industry Benchmarking Study from 2014 to 2017 can be downloaded from HERE

Regional Supply Chain Remains an Important Feature of Global Textile and Apparel Trade (Updated: November 2017)

Regional supply chain (or production-trade network, RPTN) or refers to a vertical industry collaboration system between countries that are geographically close to each other. Within a regional supply chain, each country specialized in certain portions of production or value-added activities based on their respective comparative advantages to maximize the efficiency of the whole supply chain.

There are three primary textile and apparel (T&A) regional supply chains in the world today:1

4

Asia: within this regional T&A supply chain, more economically advanced Asian countries (such as Japan, South Korea, and China) supply textile raw material to the less economically developed countries in the region (such as Myanmar, Cambodia, and Vietnam). Based on relatively lower wages, the less developed countries typically undertake the most labor-intensive processes of apparel manufacturing and then export finished apparel to major consumption markets around the world.

2

5

Europe: within this regional T&A supply chain, developed countries in Southern and Western Europe such as Italy and Germany serve as the primary textile suppliers. Regarding apparel manufacturing in the European Union,  products for the mass markets are typically produced by developing countries in Southern and Eastern Europe such as Poland and Romania, whereas high-end luxury products are mostly produced by Southern and Western European countries such as Italy and France. Furthermore, a high portion of finished apparel is shipped to developed EU members such as UK, Germany, France, and Italy for consumption.

3

6

America: within the region, the United States serves as the leading textile supplier, whereas developing countries in North, Central and South America (such as Mexico and countries in the Caribbean region) assemble imported textiles from the United States or elsewhere into apparel. The majority of clothing produced in the area is eventually exported to the United States for consumption.

Data from the World Trade Organization (WTO) shows that regional supply chain remains an essential feature of today’s global textile and apparel trade.  Notably, three trade flows are worth watching:

First, Asian countries are increasingly importing more textiles from within the region. In 2016, around 91.2% of Asian countries’ textile imports came from other Asian countries, up from 86.8% in 2006. This change reflects the formation of a more integrated T&A supply-chain in Asia. The more efficient regional supply chain also helps improve the price competitiveness of apparel made by “factory Asia” in the world marketplace. Particularly in the past few years, T&A exports from Asia is posting substantial pressures on the operation of the T&A regional supply chains in the Western Hemisphere.

Second, the intra-region T&A trade in EU remains stable. In 2016, 64.1% of EU countries’ textile imports and 55.6% of EU countries’ apparel imports came from within the EU region. Over the same period, 73.3% of EU countries’ textile exports and 81.6 % of their apparel exports also went to other EU countries.

Third, the Western-Hemisphere T&A supply chain, which involves countries in North, South and Central America, is facing substantial challenges from the increasing competition from Asian T&A exporters. In 2016, only 29.0% of North, South and Central American countries’ textile imports and 18.6% of their apparel imports came from within the region, a record low in the past ten years. Meanwhile, in 2016 Asian countries supplied 60.1% of textiles and 73.7% of clothing imported by countries in the Western Hemisphere, a record high in history. Understandably, if regional free trade agreements, such as NAFTA and CAFTA-DR, no longer exist, it would be even more difficult for the Western-Hemisphere T&A supply chain to survive. The potential losers of the collapse of the Western-Hemisphere T&A supply chain will include not only US textile exporters but also apparel exporters in North, South and Central America. Notably, in 2016, 89.3% of apparel exported by countries in the Western Hemisphere were destined for the region.  

78

Data Source: World Trade Organization (2017)

by Sheng Lu

“Made in America”: A New Reality?

Panelists

  • Pete Bauman, Senior VP, Burlington Worldwide / ITG
  • Joann Kim, Director, Johnny’s Fashion Studio
  • Tricia Carey, Business Development Manager, Lenzing USA
  • Michael Penner, CEO, Peds Legwear
  • Moderator: Arthur Friedman, Senior Editor, Textiles and Trade, WWD 

Video Discussion Questions 

  • How does “Made in the USA” fit into US textile and apparel companies’ overall business strategy today?
  • What measures have been taken by US textile and apparel companies to bring more production back to the US? Can any measures be linked to the restructuring strategies we discussed in the class?
  • What are the significant obstacles to bringing textile and apparel manufacturing back to the US?
  • Any other exciting points/buzzwords did you learn from the panel discussion?

NAFTA Renegotiating Objectives Related to the Textile and Apparel Industry

Untitled

On Tuesday (July 17, 2017), the Office of the U.S. Trade Representative (USTR) released its detailed and comprehensive summary of the renegotiating objectives of the North American Free Trade Agreement (NAFTA). In the statement, USTR says that “through the renegotiation of NAFTA, the Trump Administration will seek a much better agreement that reduces the U.S. trade deficit and is fair for all Americans by improving market access in Canada and Mexico for U.S. manufacturing, agriculture, and services.”

Several released negotiating objectives address textile and apparel (T&A) directly or are highly relevant to the sector:

Trade in Goods

  • Improve the U.S. trade balance and reduce the trade deficit with the NAFTA countries.
  • Maintain existing duty-free access to NAFTA country markets for U.S. textile and apparel products and seek to improve competitive opportunities for exports of U.S. textile and apparel products while taking into account U.S. import sensitivities.

Rules of Origin

  • Update and strengthen the rules of origin, as necessary, to ensure that the benefits of NAFTA go to products genuinely made in the United States and North America.
  • Ensure the rules of origin incentivize the sourcing of goods and materials from the United States and North America.
  • Establish origin procedures that streamline the certification and verification of rules of origin and that promote strong enforcement, including with respect to textiles.
  • -Establish origin procedures that streamline the certification and verification of rules of origin and that promote strong enforcement, including with respect to textiles.

Customs and Trade Facilitation

  • Provide for automation of import, export, and transit processes, including through supply chain integration; reduced import, export, and transit forms, documents, and formalities; enhanced harmonization of customs data requirements; and advance rulings regarding the treatment that will be provided to a good at the time of importation.

Comments:

  1. Notably, reducing the trade deficit and bringing more manufacturing jobs back to the United States are at the core of the NAFTA’s renegotiating objectives. These two goals are also highly consistent with Trump’s rhetoric on his trade policy.
  2. A dilemma facing the T&A sectoral negotiation is that the United States currently runs a robust trade surplus with Canada and Mexico for textiles: in 2016, the value of U.S. trade surplus (i.e. the value of exports minus the value of imports) totaled $680 million for yarns (up 56.7% from 1994), $4,342 million for fabrics (up 202.9% from 1994) and $1,461 million for made-up textiles (up 223.5% from 1994). Meanwhile, although the United States is in a trade deficit with NAFTA partners for apparel ($1,130 million in 2016), U.S. apparel imports from Canada and Mexico often contain textile inputs “Made in the USA” through the Western-Hemisphere supply chain. Blindly cutting the trade deficit on apparel ironically could affect the U.S. textile exports to the NAFTA region negatively.
  3. Based on the released objectives, it seems unlikely that the NAFTA renegotiation will liberalize the yarn-forward rules of origin for textile and apparel. On the contrary, USTR could review the current exceptions to the yarn-forward rules, including the tariff preference levels (TPL) and some special regimes such as the 9802 program related to fabric sourcing to strengthen the manufacturing base and create MANUFACTURING jobs in the United States. Recognizing the competing arguments between the U.S. textile industry and the apparel industry (fashion brands and retailers) regarding the necessity and impact of these exceptions, USTR also needs more inputs of how companies use exceptions like the TPL in sourcing and why they use them.
  4. Other than the rules of origin, trade facilitation and customs enforcement will be another major agenda related to the T&A sector in the NAFTA renegotiation. Elements from the newly enforced Trade Facilitation and Trade Enforcement Act of 2015 could be added to the updated NAFTA.
  5. A positive aspect of the NAFTA T&A sectoral negotiation is that all parties alongside the supply chain, from U.S. cotton growers, textile mills to apparel retailers and brands recognize the value of NAFTA and no one calls for pulling out of the agreement. It is also a consensus view of the U.S. T&A industry that NAFTA renegotiation should “do no harm”, i.e. strengthening rather than weakening the current supply-chain partnership between NAFTA members. Additionally, stakeholders in the U.S. T&A industry unanimously support keeping the renegotiation trilateral, but agree to use bilateral provisions to address some particular concerns.
  6. The NAFTA renegotiation may officially start on August 17 or 18, 2017. However, Time is the enemy of the NAFTA renegotiation. While there is a strong incentive for all parties to finish the negotiation by the end of 2017 given the upcoming U.S. mid-term election and the Mexican presidential election in 2018, the ambitious renegotiation agenda makes it extremely challenging to meet that goal. Risks are still there that Trump may pull the United States out of NAFTA should he lose patience for the renegotiation. Notably, Trump’s dislike of NAFTA is real.

Sheng Lu

Related: US Textile and Apparel Industry and NAFTA: Key Statistics (updated July 2017)

USTR Hearing on the Renegotiation of NAFTA: Textile and Apparel Industry

US Textile and Apparel Associations Comment on NAFTA Renegotiation