This study aims to examine U.S. fashion companies’ evolving apparel sourcing and business practices in response to a shifting business environment, including ongoing hiking tariffs and geopolitical tensions. Based on data availability, transcripts of the latest earnings calls from about 30 leading publicly traded U.S. fashion companies were collected. These earnings calls were held between February and April 2026, reflecting company performance in the last quarter of 2025 or later. A thematic analysis of the transcripts was conducted using MAXQDA.
Key findings:
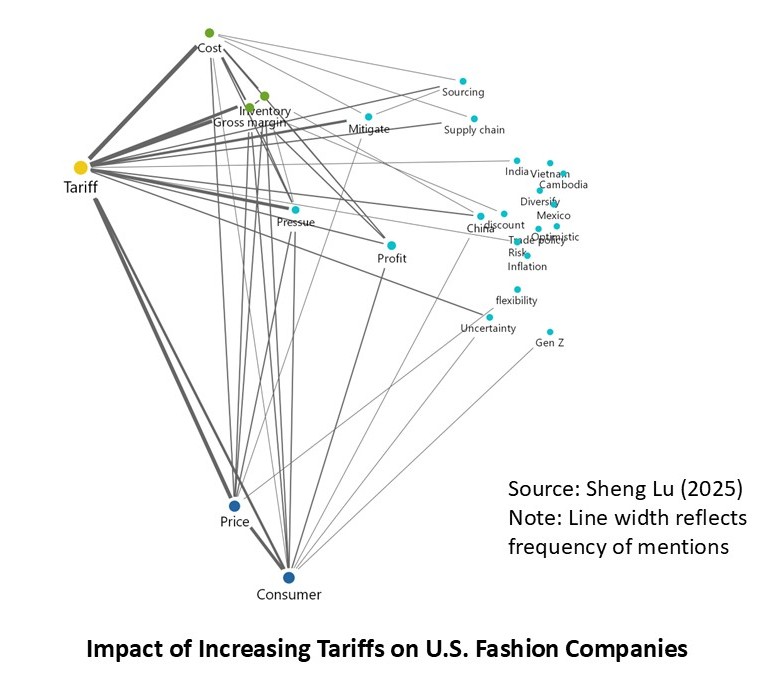
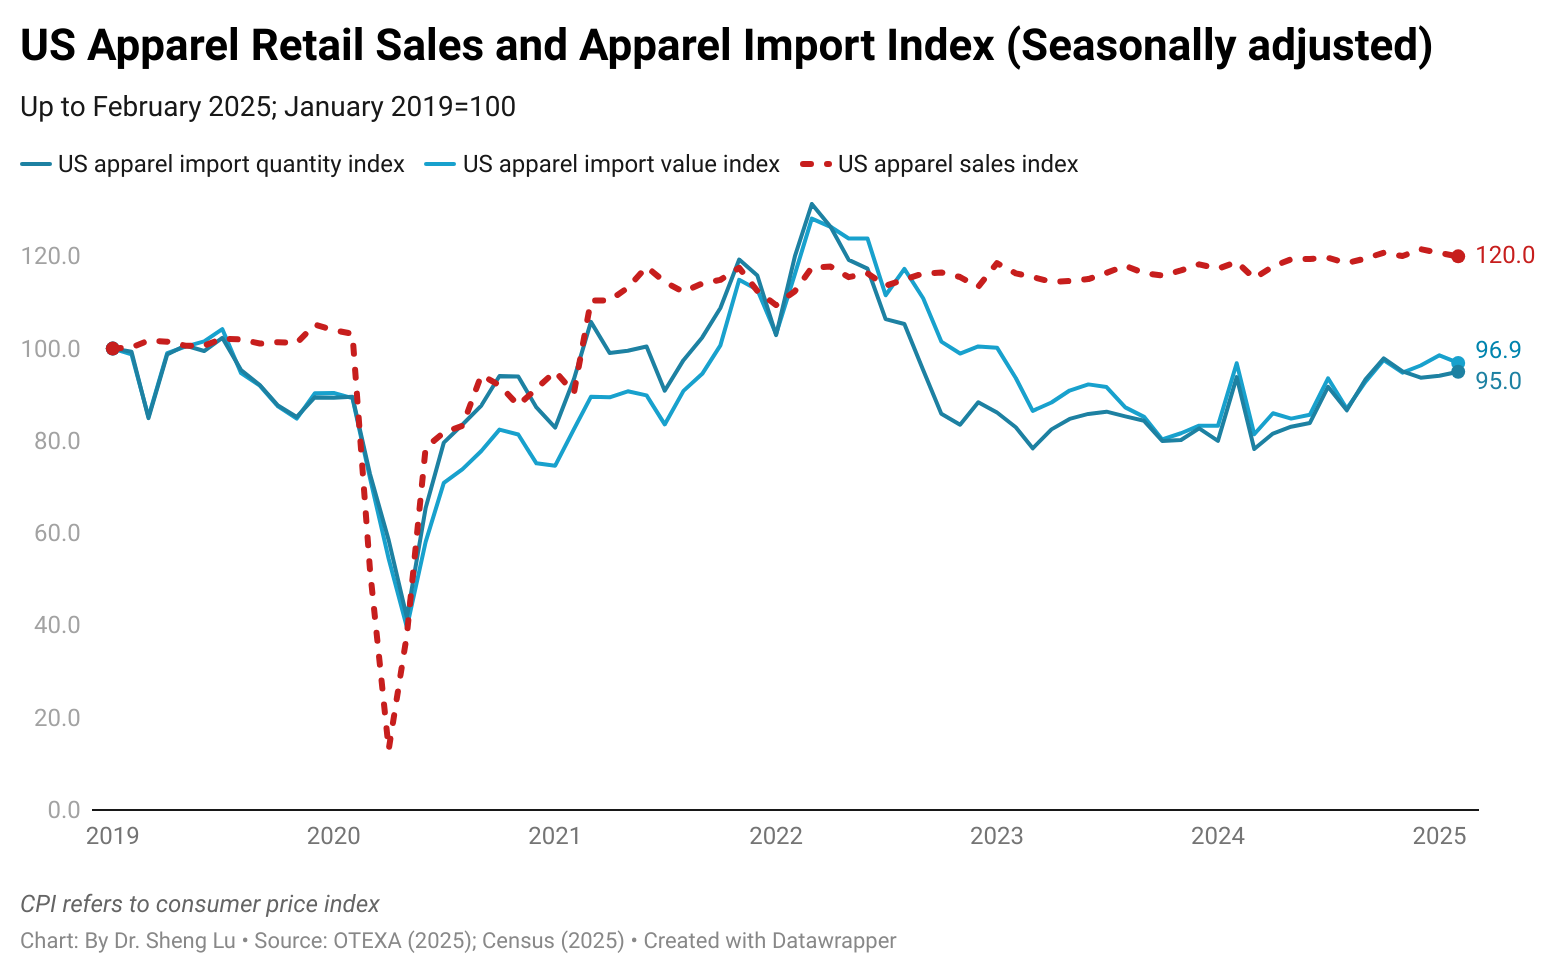
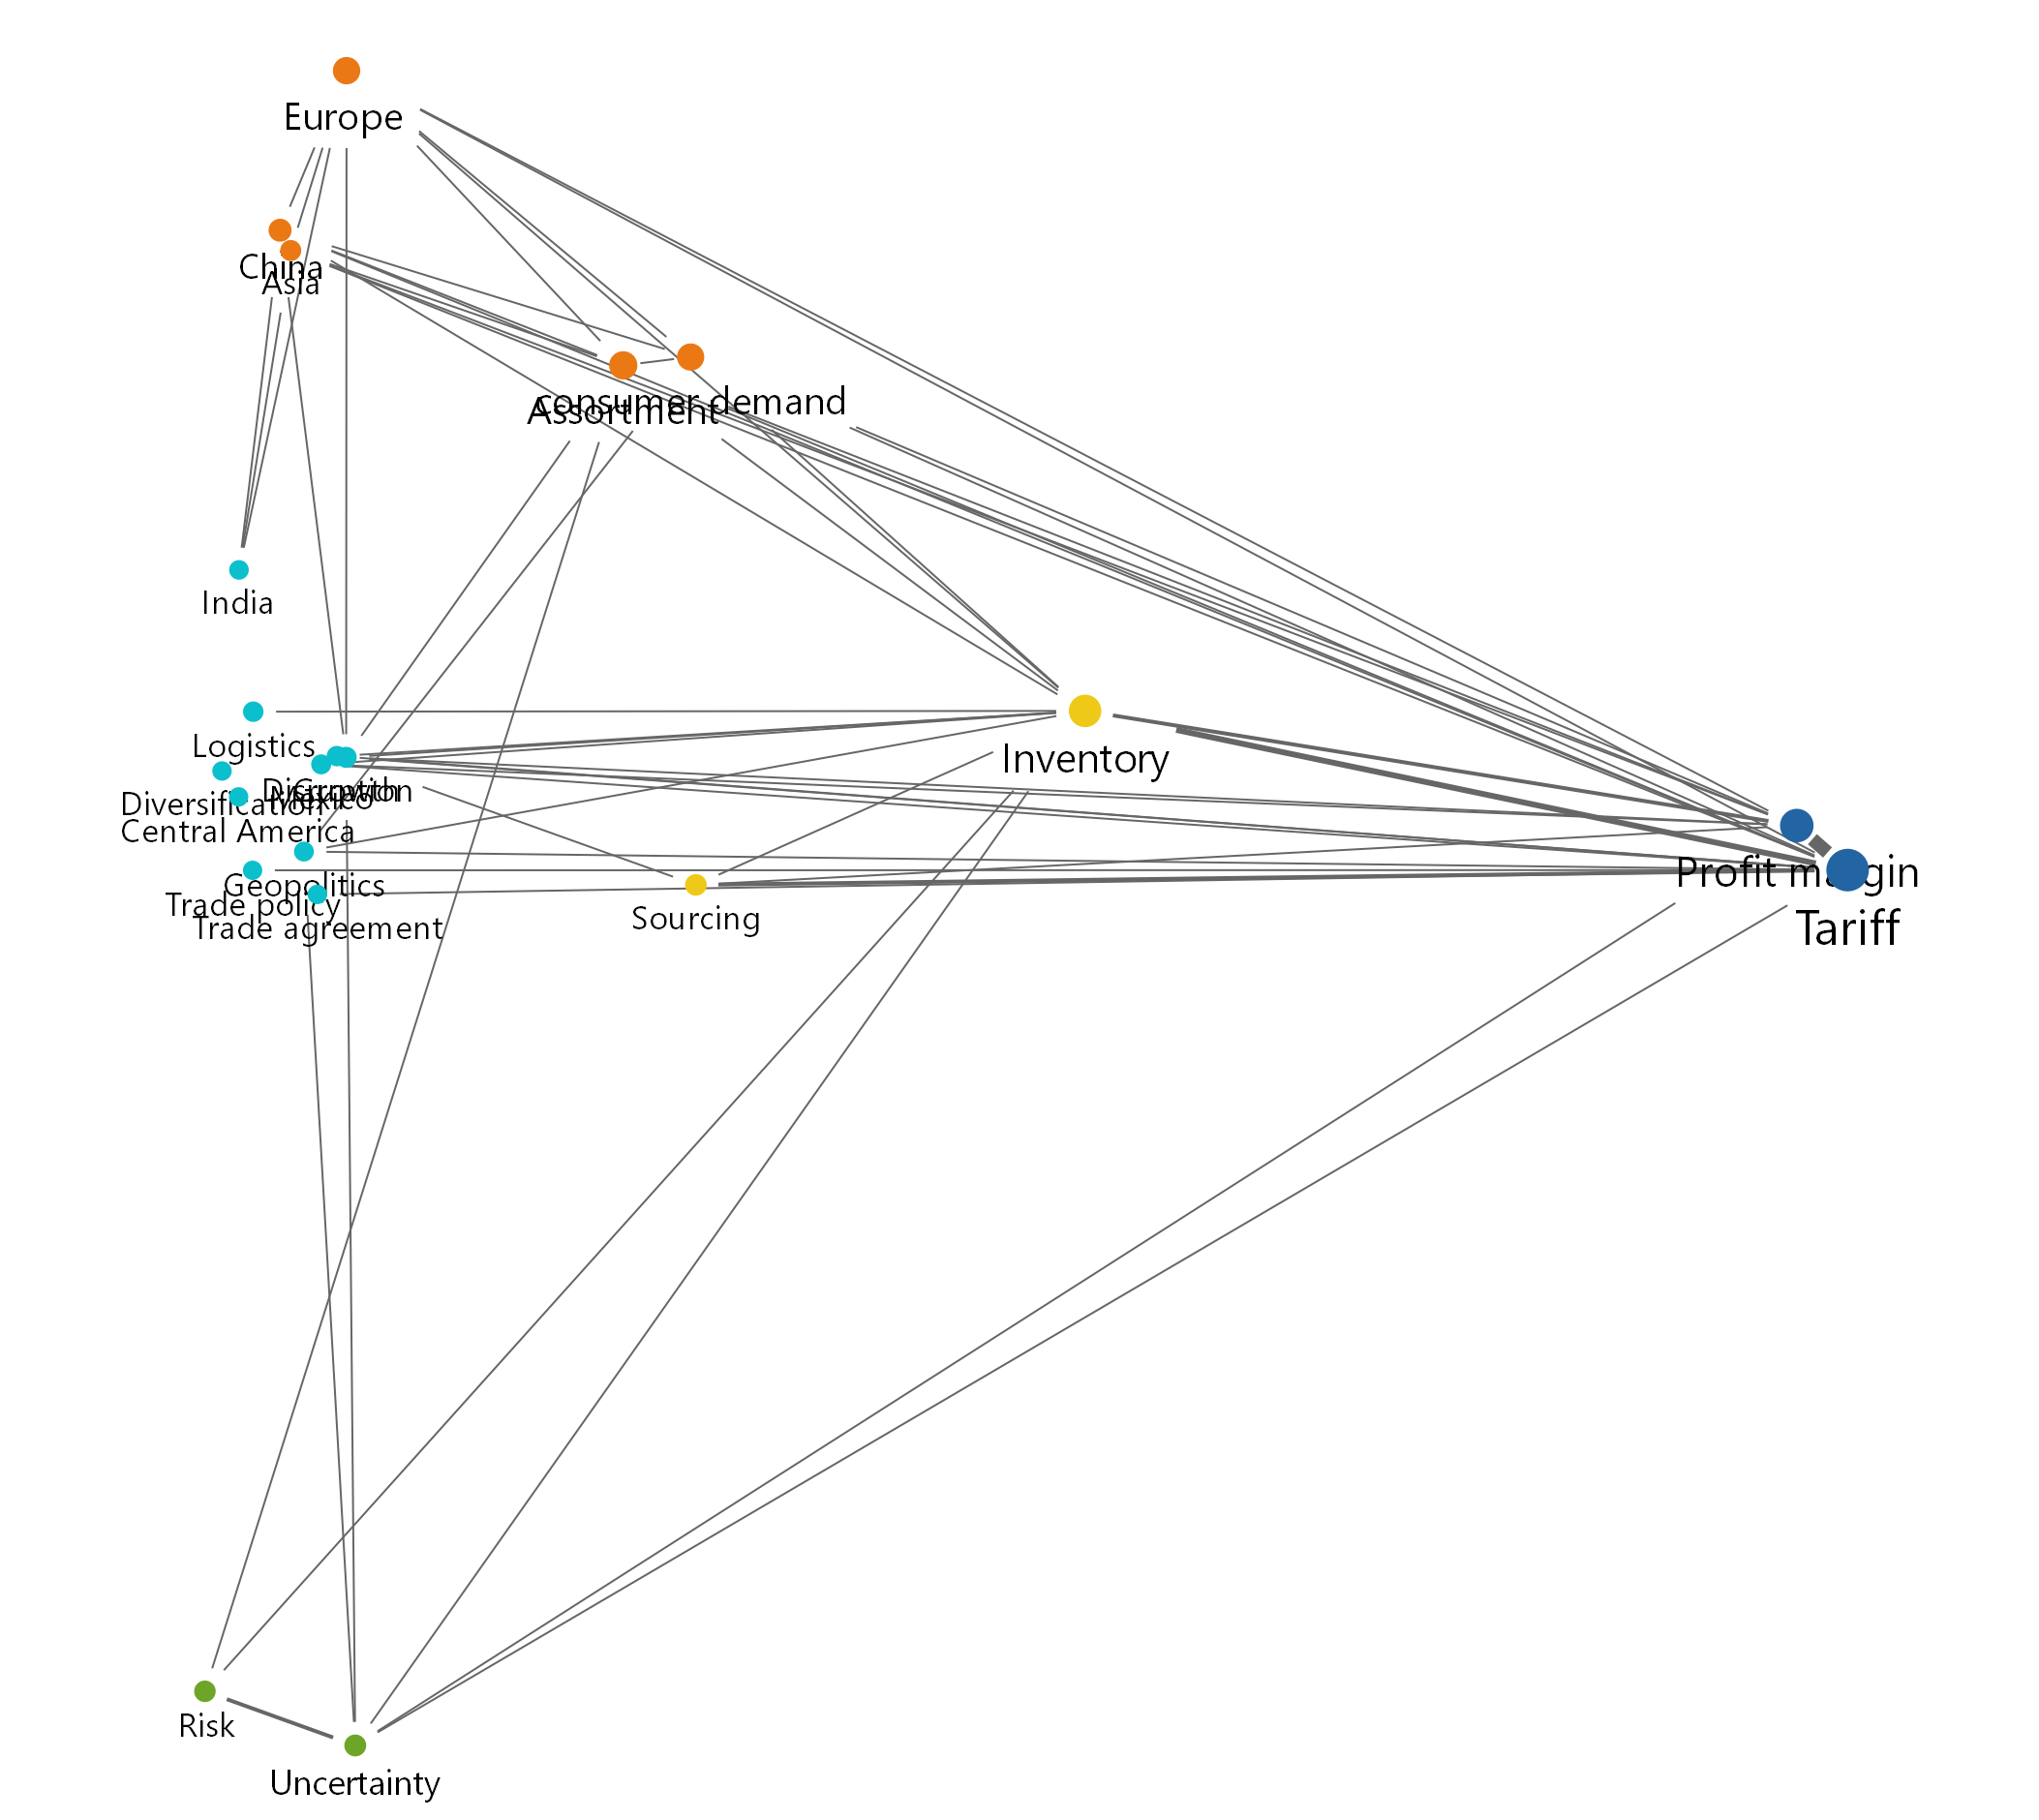
First, U.S. fashion companies identified shifting consumer demand, macroeconomic volatility, tariff hikes, and ongoing policy uncertainty as their main business concerns. The pressure on middle- to low-income consumers’ discretionary spending was emphasized as a structural issue that could persist in 2026. For example:
- Kohls: “consumer is behaving differently in this challenging macroeconomic environment. We know our core low to middle-income customers continue to face financial pressure, and they are seeking value…”
- Macy’s : “Our customers across nameplates skew more towards the middle and upper-income tiers. Performance remains stronger in these cohorts, while the lower tiers remain more choiceful. As we look ahead, there are many macroeconomic and geopolitical factors that could influence discretionary spend…”
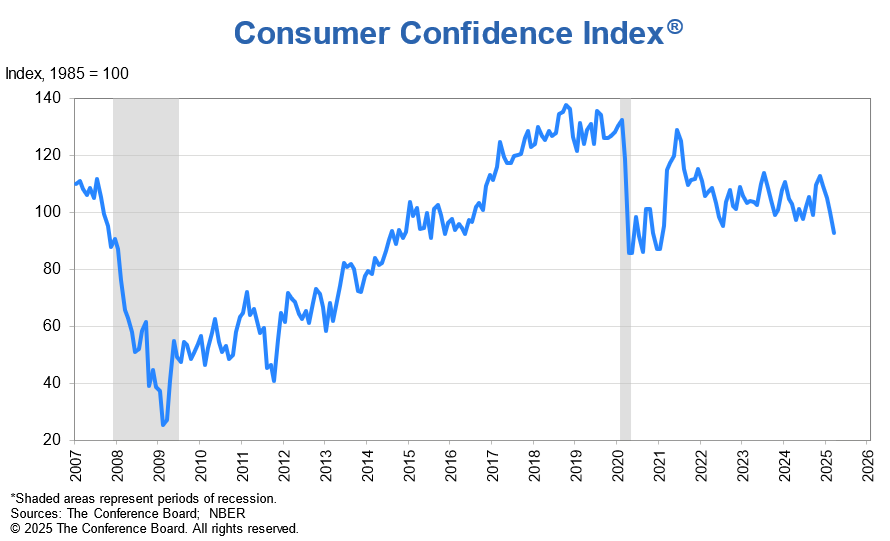
- Carter’s: “It continues to be a challenging time to forecast the business. Consumer spending appears to have held up well, while other macro indicators, such as consumer confidence and overall inflation, are less positive. Tariffs continue to dominate the headlines… there continues to be a great deal of uncertainty about where all this will settle…”
- Oxford industries: “In an uncertain consumer environment, success comes from controlling what we can control and staying focused on execution…(we) have increased our flexibility and better positioned us to navigate continued uncertainty in the marketplace…”
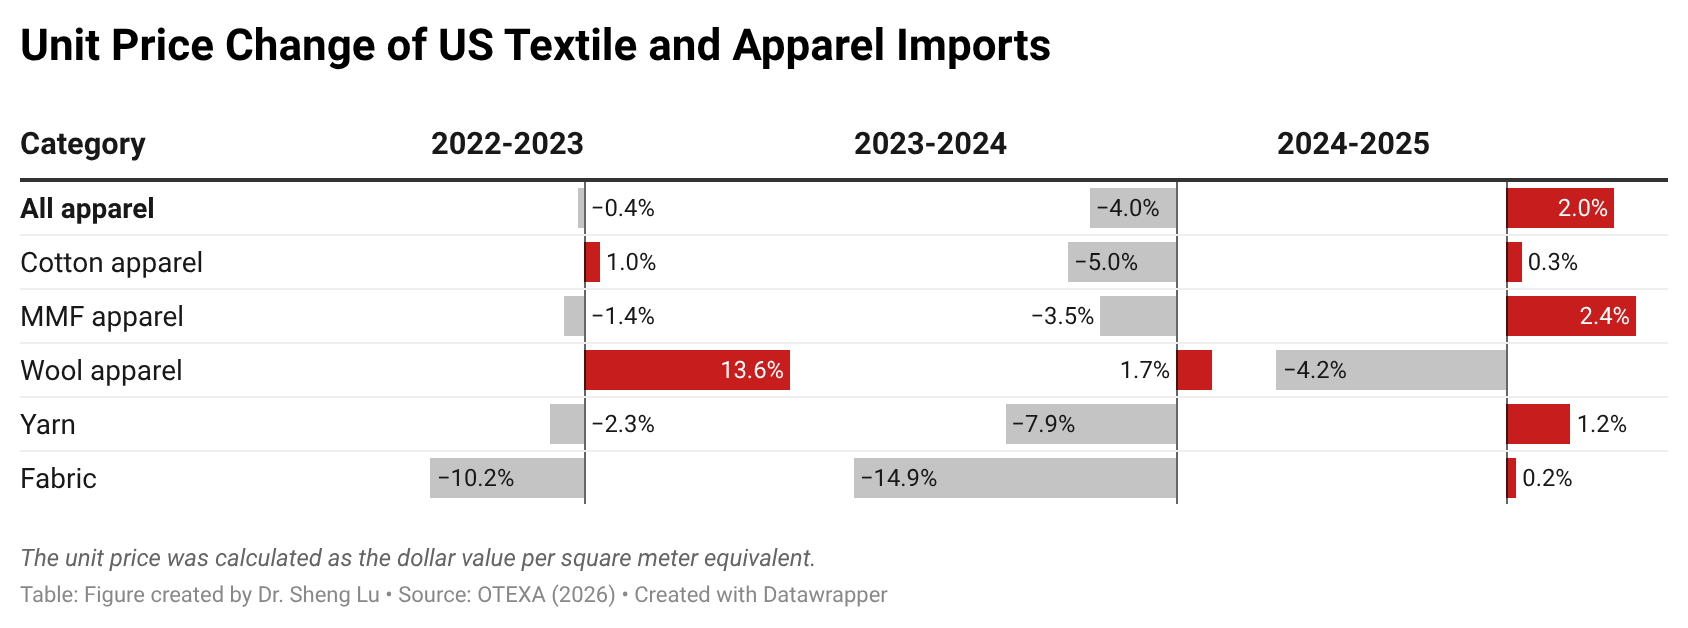
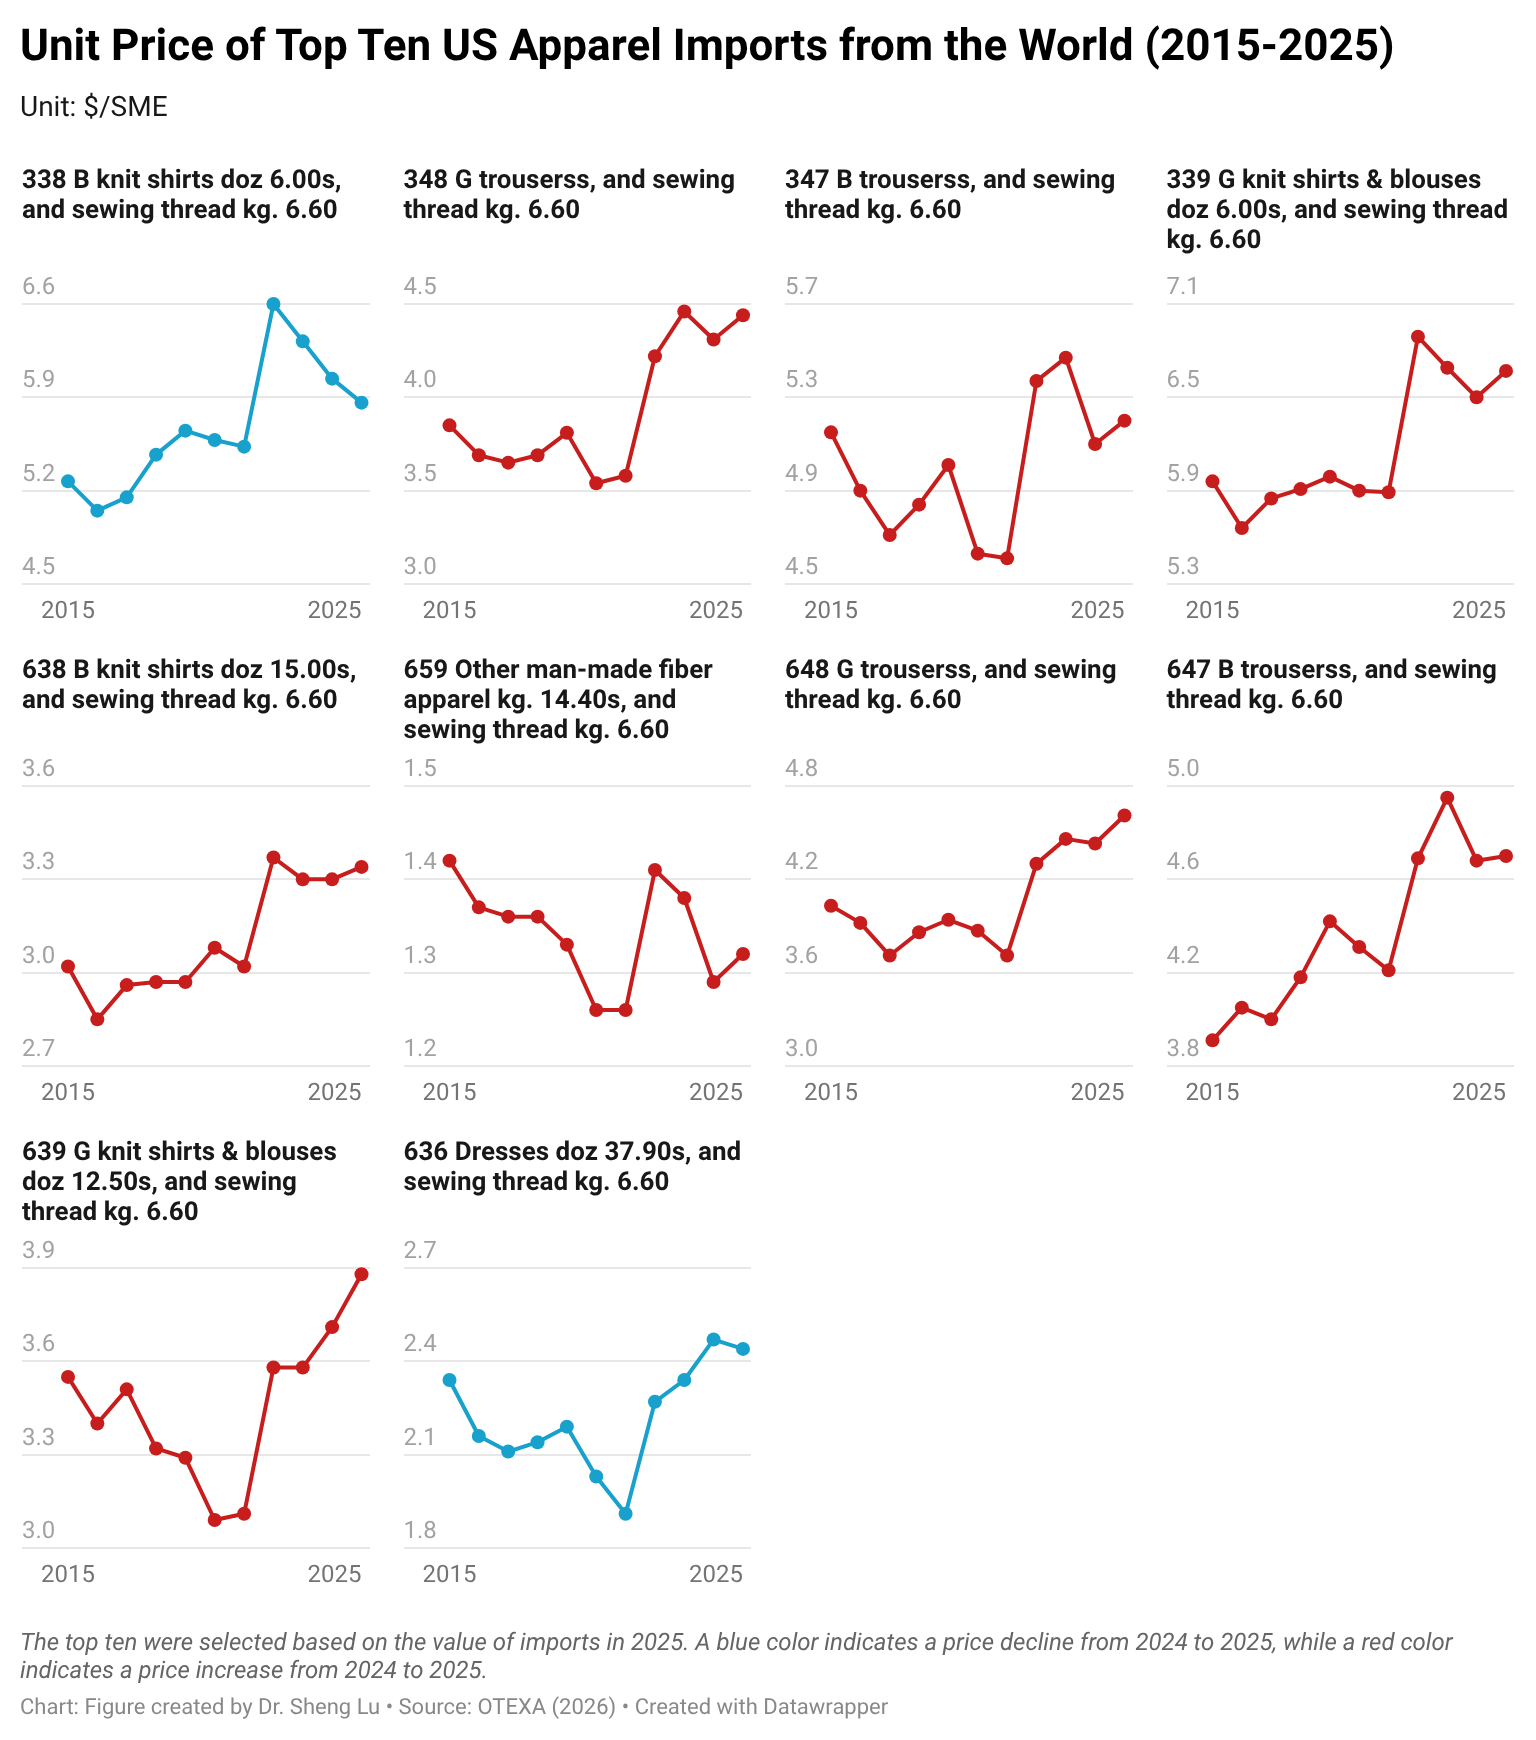
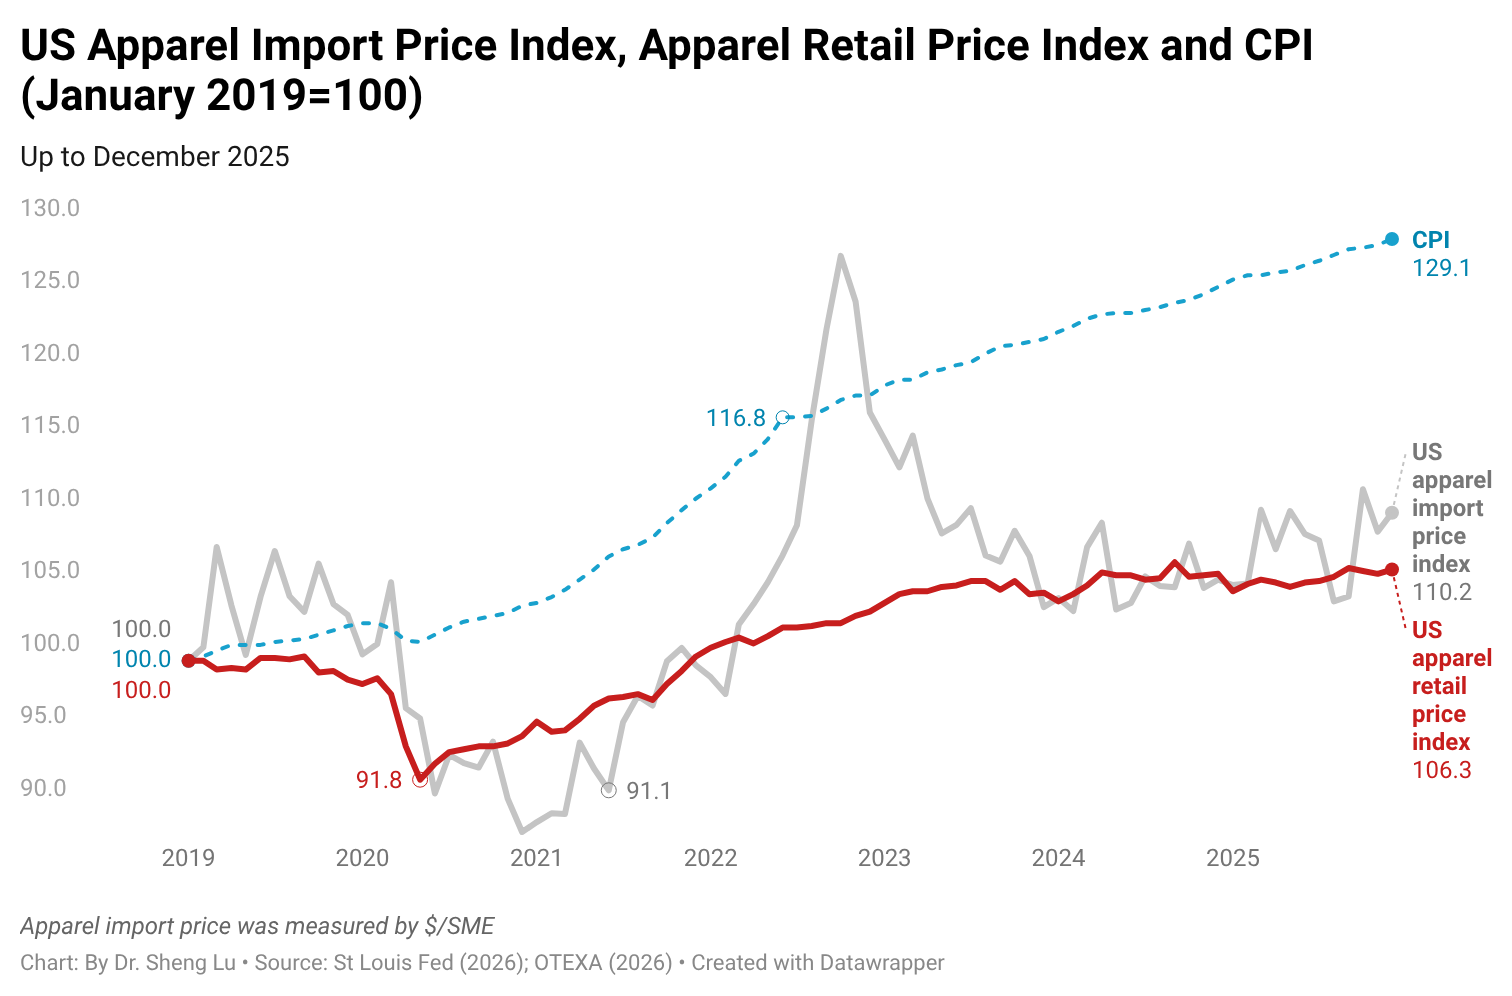
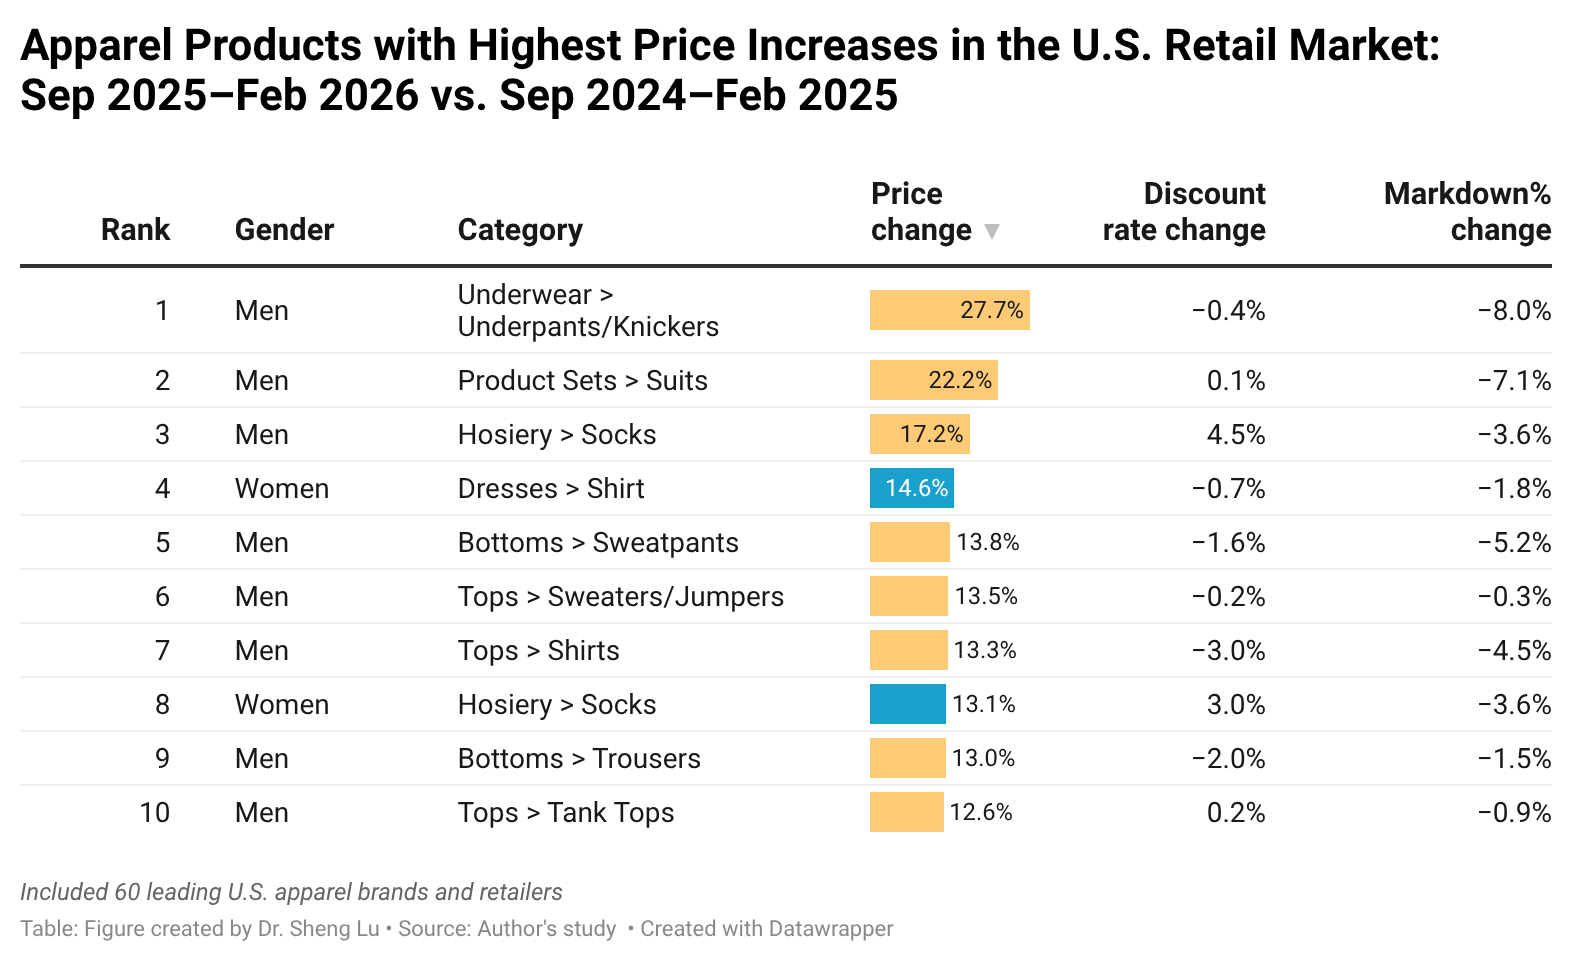
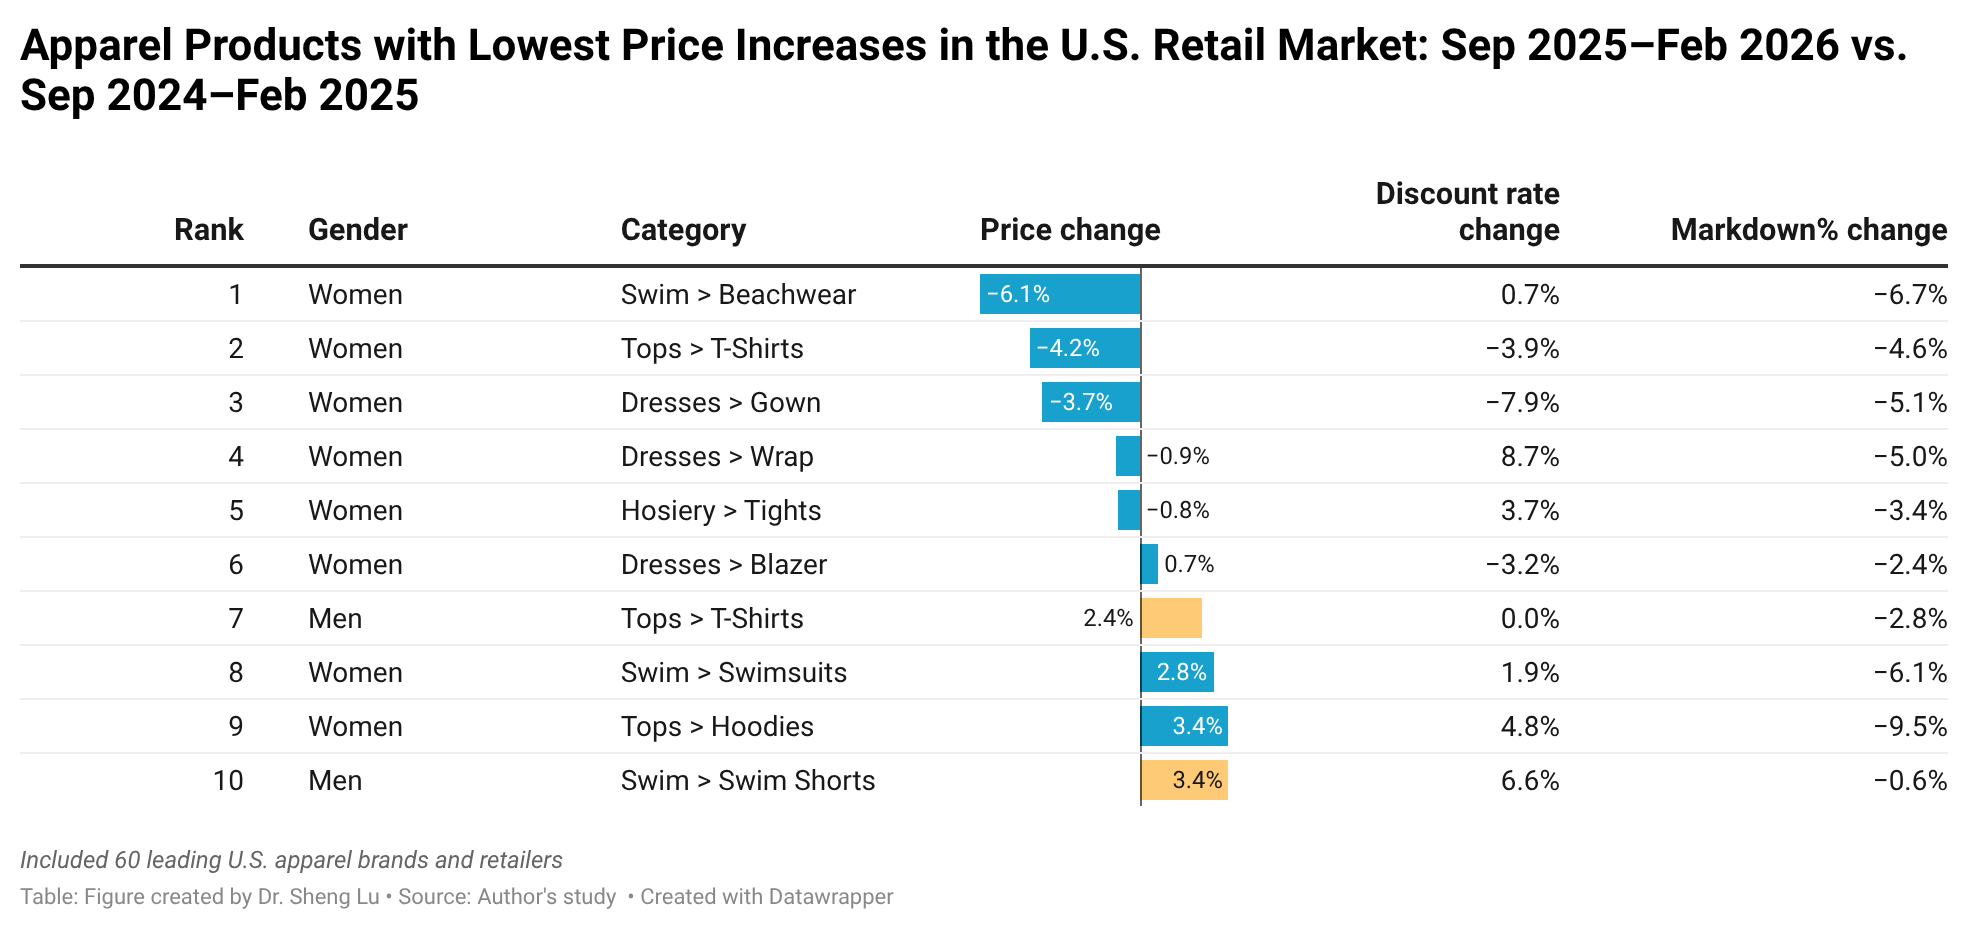
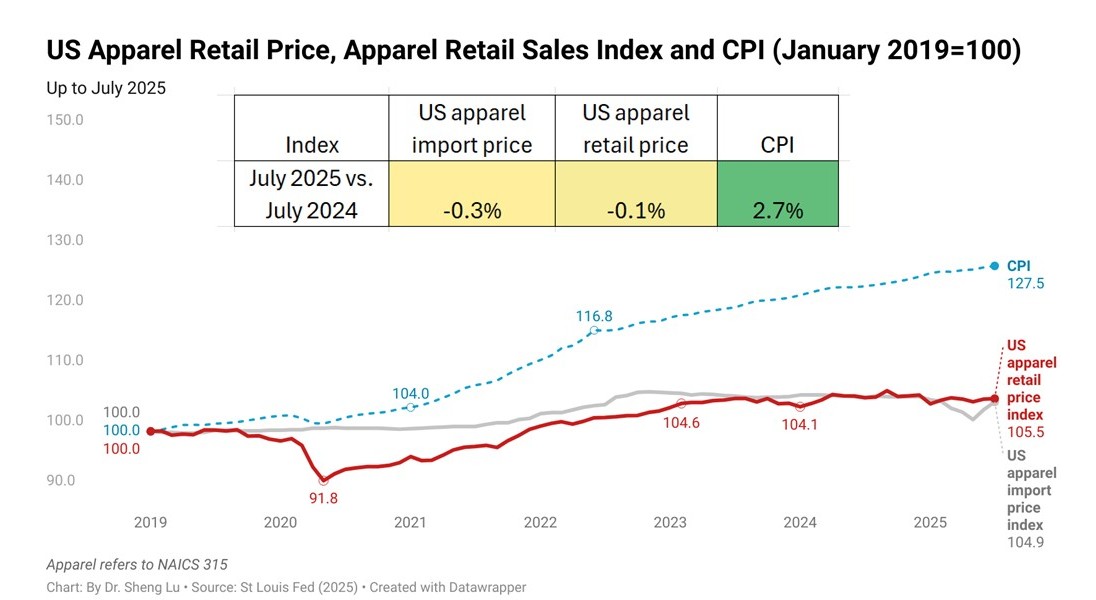
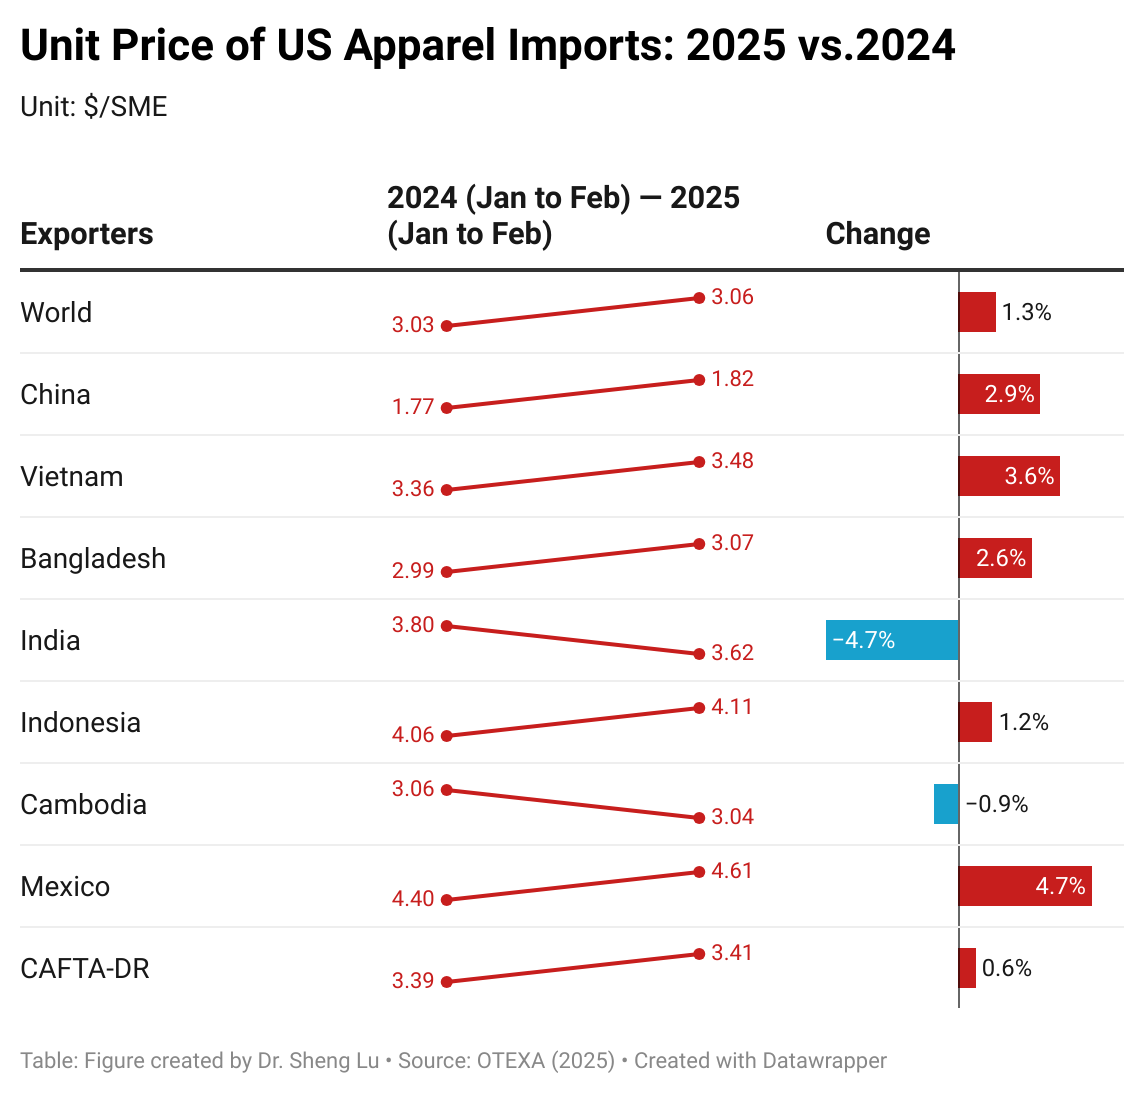
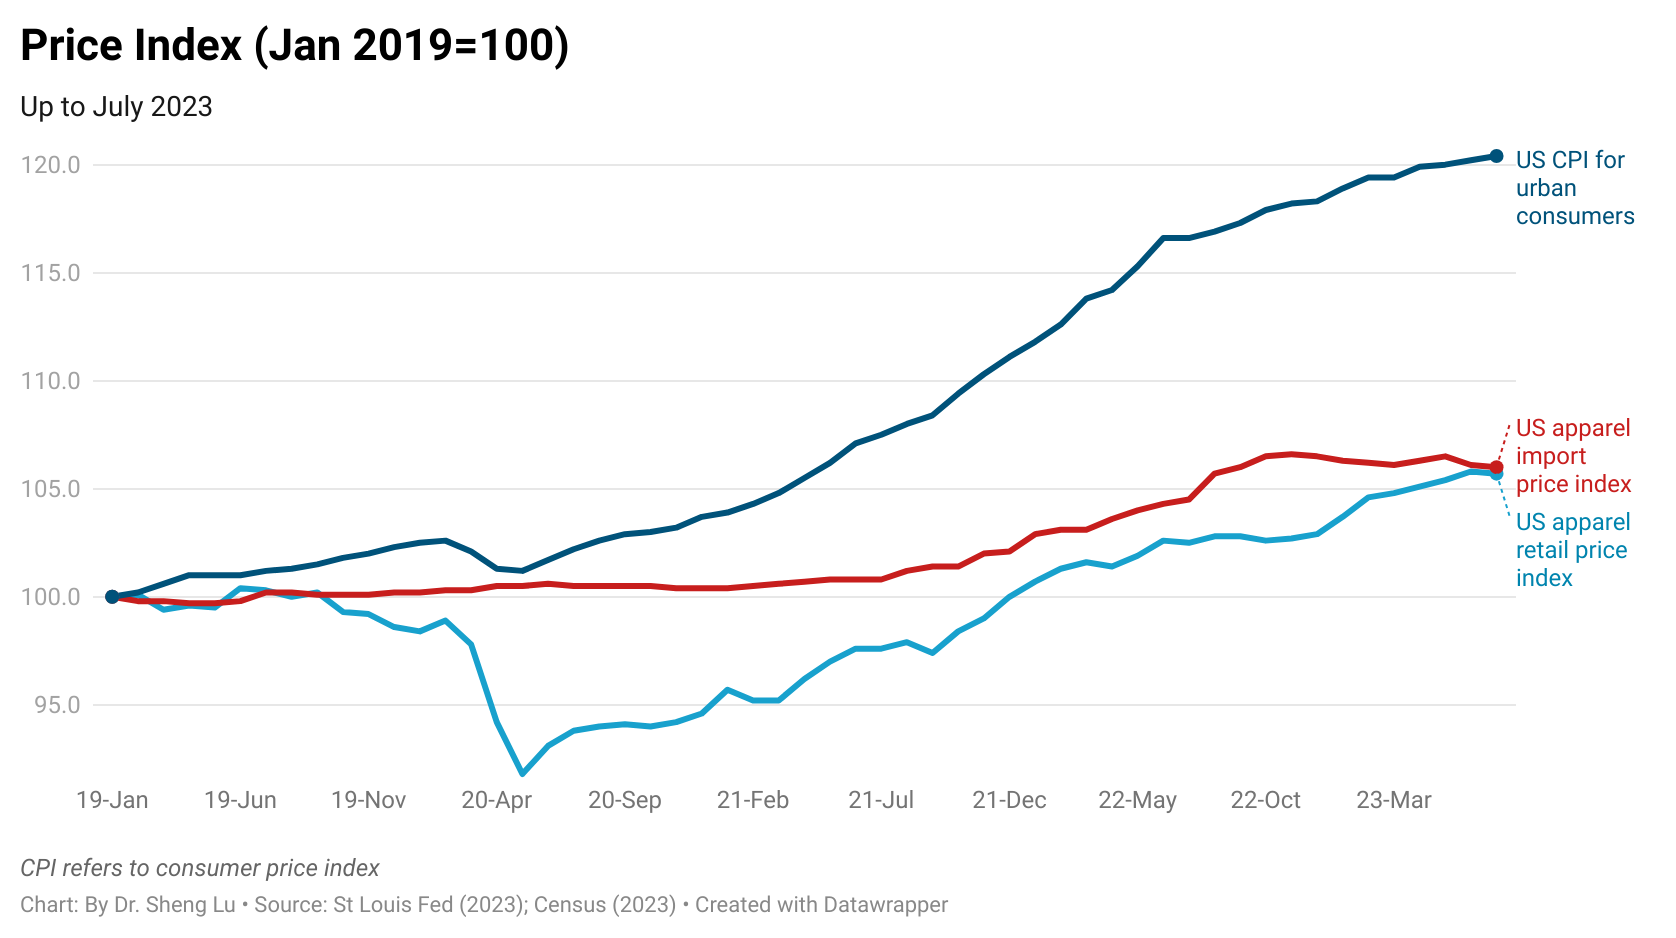
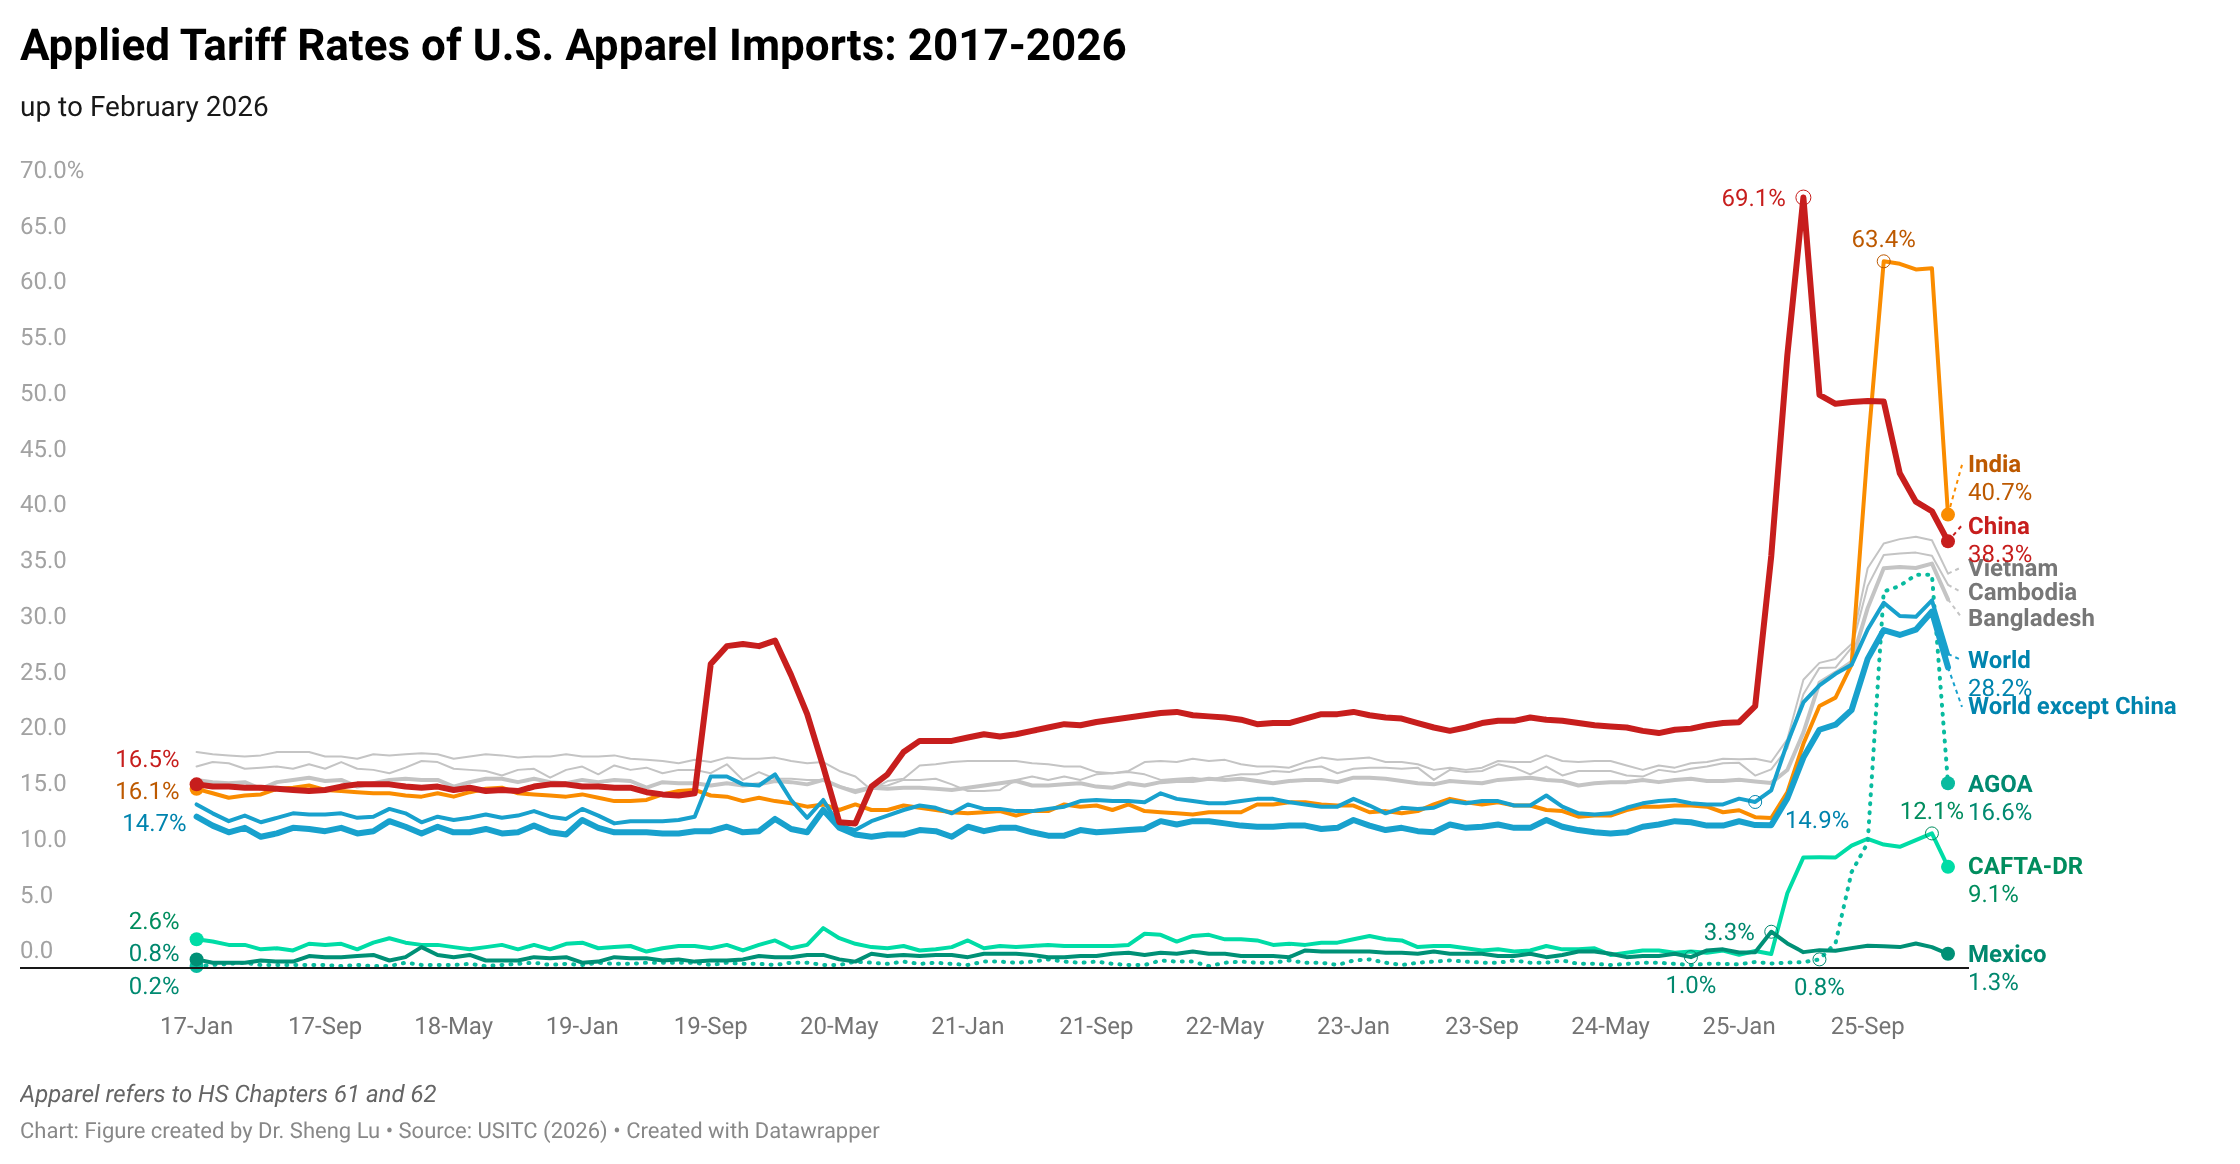
Second, raising retail prices and focusing on full-price selling have become more common and systematic approaches among U.S. fashion companies to mitigate the impact of tariffs. Nonetheless, fashion companies remain selective–price increases have mostly occurred on fashion-forward, trend-driven, and premium items, while avoiding significant price increases for basic and core categories to shield most price-sensitive consumers. Companies also try to leverage new products and product innovation to justify the price increase. Additionally, many companies have reported that consumers have shown “no resistance” to price increases so far. For example:
- Columbia Sportswear: “For both Spring 2026 and Fall 2026, we increased U.S. pricing by a high-single digit percent. When combined with our other mitigation tactics, our goal in 2026 is to offset the dollar impact of higher tariffs…Retailers remain cautious as tariff-induced price increases are just now beginning to hit the marketplace.”
- Levi’s: “So tariffs, as I mentioned in my prepared remarks, impacts gross margins adversely by about 150 basis points, and we have an FX headwind of about 20. We’re fully offsetting this with higher pricing…We’re not seeing any initial demand reaction to it, so the elasticity is pretty good. More full price selling, which is, something that we’ve been focusing now for about 12-18 months, especially as a product, you know, and newness is resonating well with the consumer. And then lower product costs, which are a combination of lower, you know, better, and lower quarter, as well as the negotiation with the vendors as we rationalize SKUs…reduce unproductive…assortment…”
- Kontoor Brands: “Tariffs net of pricing represent a headwind to our gross margin rate in 2026. We’ve implemented price increases for Wrangler, Lee, and Helly Hansen as part of a holistic plan to mitigate the impact of the increases in tariffs. Our pricing strategies were thoughtful and developed in consideration of the fluid macro environment, the strength of our brands, our elasticity expectations in certain categories and channels, and the retail environment around the globe.”
- Oxford industries: “The price increases implied in our guidance range from 4%-8% and vary by brand. These increases reflect a more elevated assortment as well as higher pricing on new product with relatively limited like-for-like increases on existing product.”
- Victoria’s Secret: “Importantly, we pulled back on promotions, driving more regular price selling and double-digit AUR (average unit retail) expansion, which benefited margins across PINK’s portfolio, showing that the brand is regaining pricing power.”
- URBN: “We’re being highly strategic and thoughtful about taking price, these are definitely not across-the-board price increases. We’ve taken small price increases where we felt the price-value equation was appropriate, have seen really little to no price resistance where we did so. We also want to stress that we remain committed to maintaining our opening price points and our pricing architecture and protecting those items that our customers count on to have great price value. Next, we’re really planning very little incremental price increases over and above what we’ve already implemented this fall and holiday. We really don’t anticipate price resistance. Our focus remains on protecting the integrity and the value of our product while we manage our cost structure appropriately…”
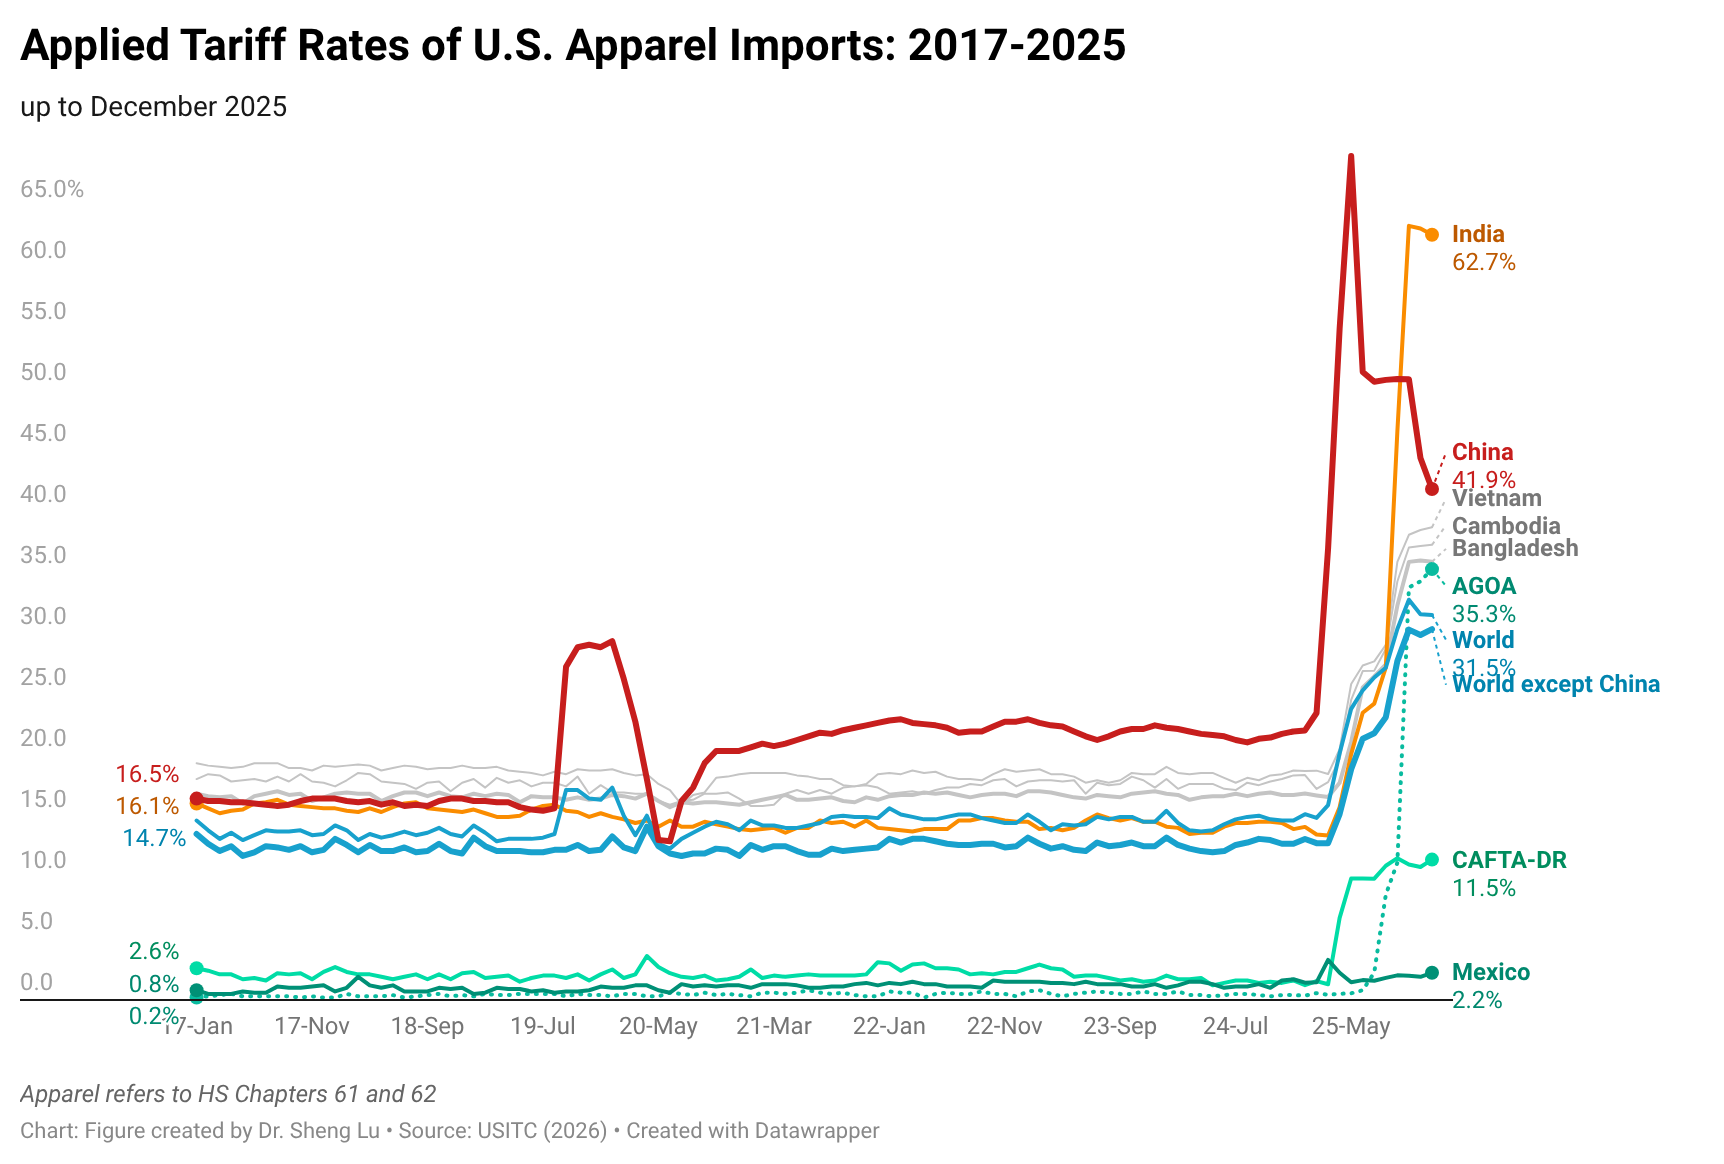
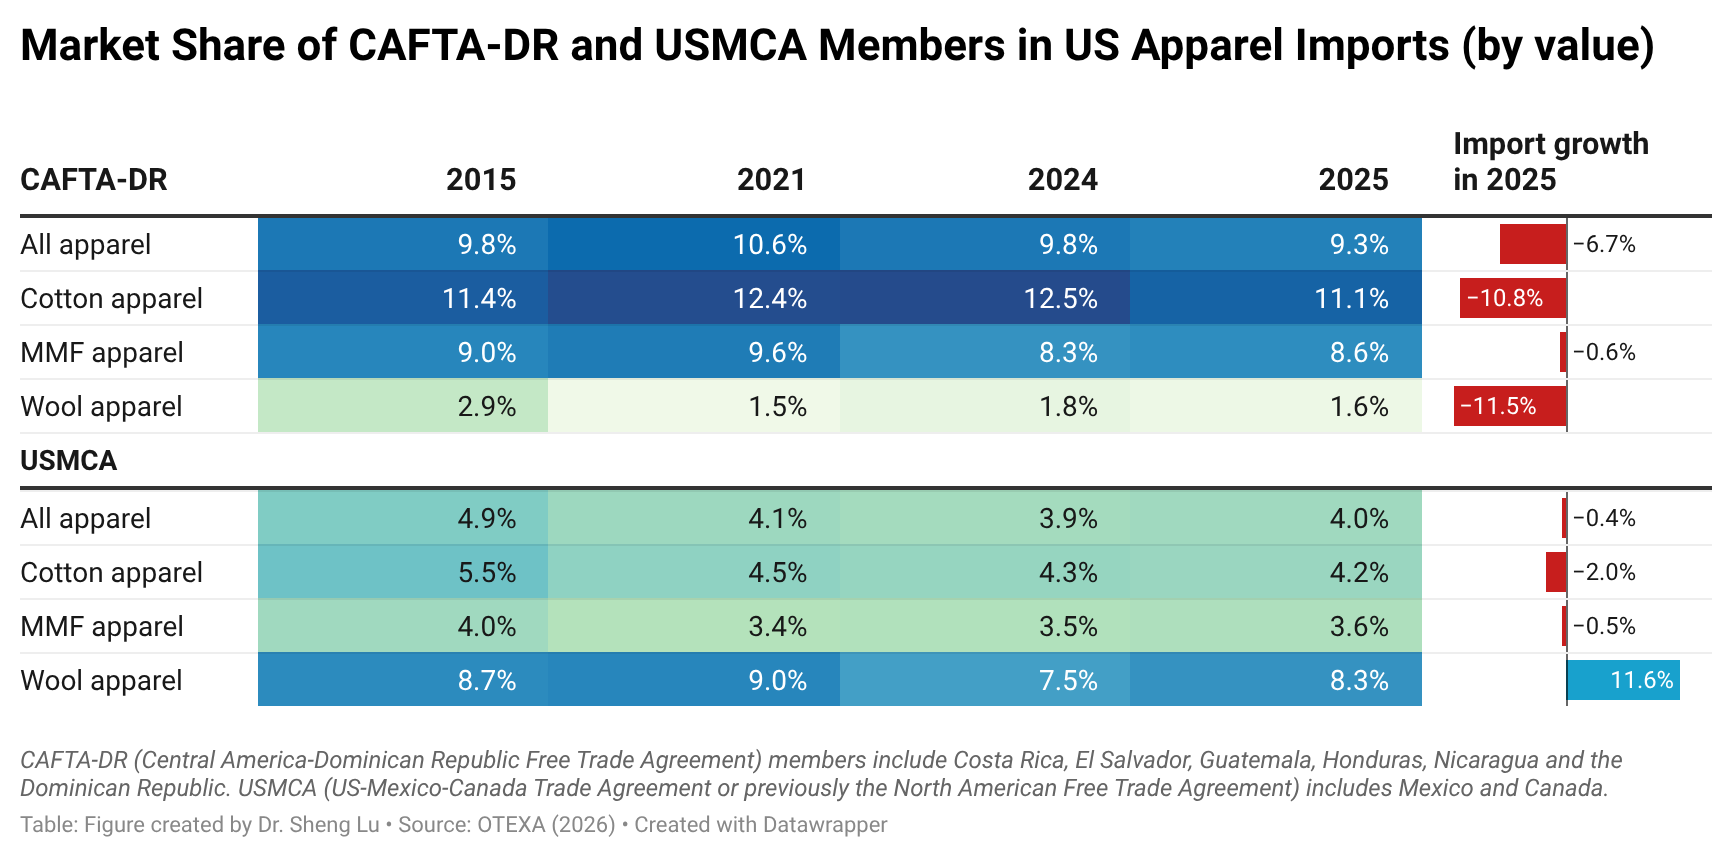
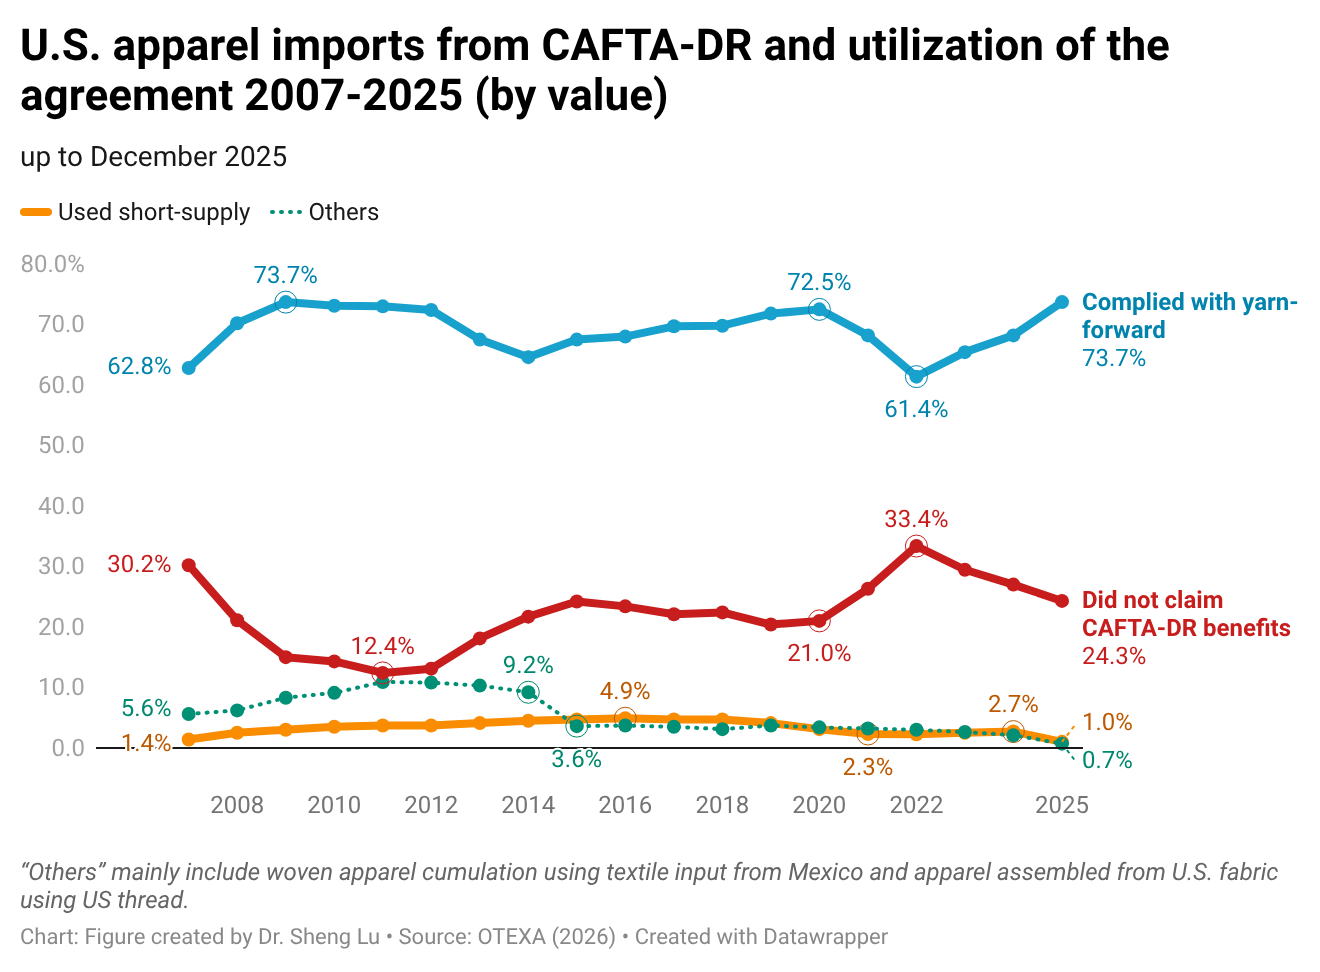
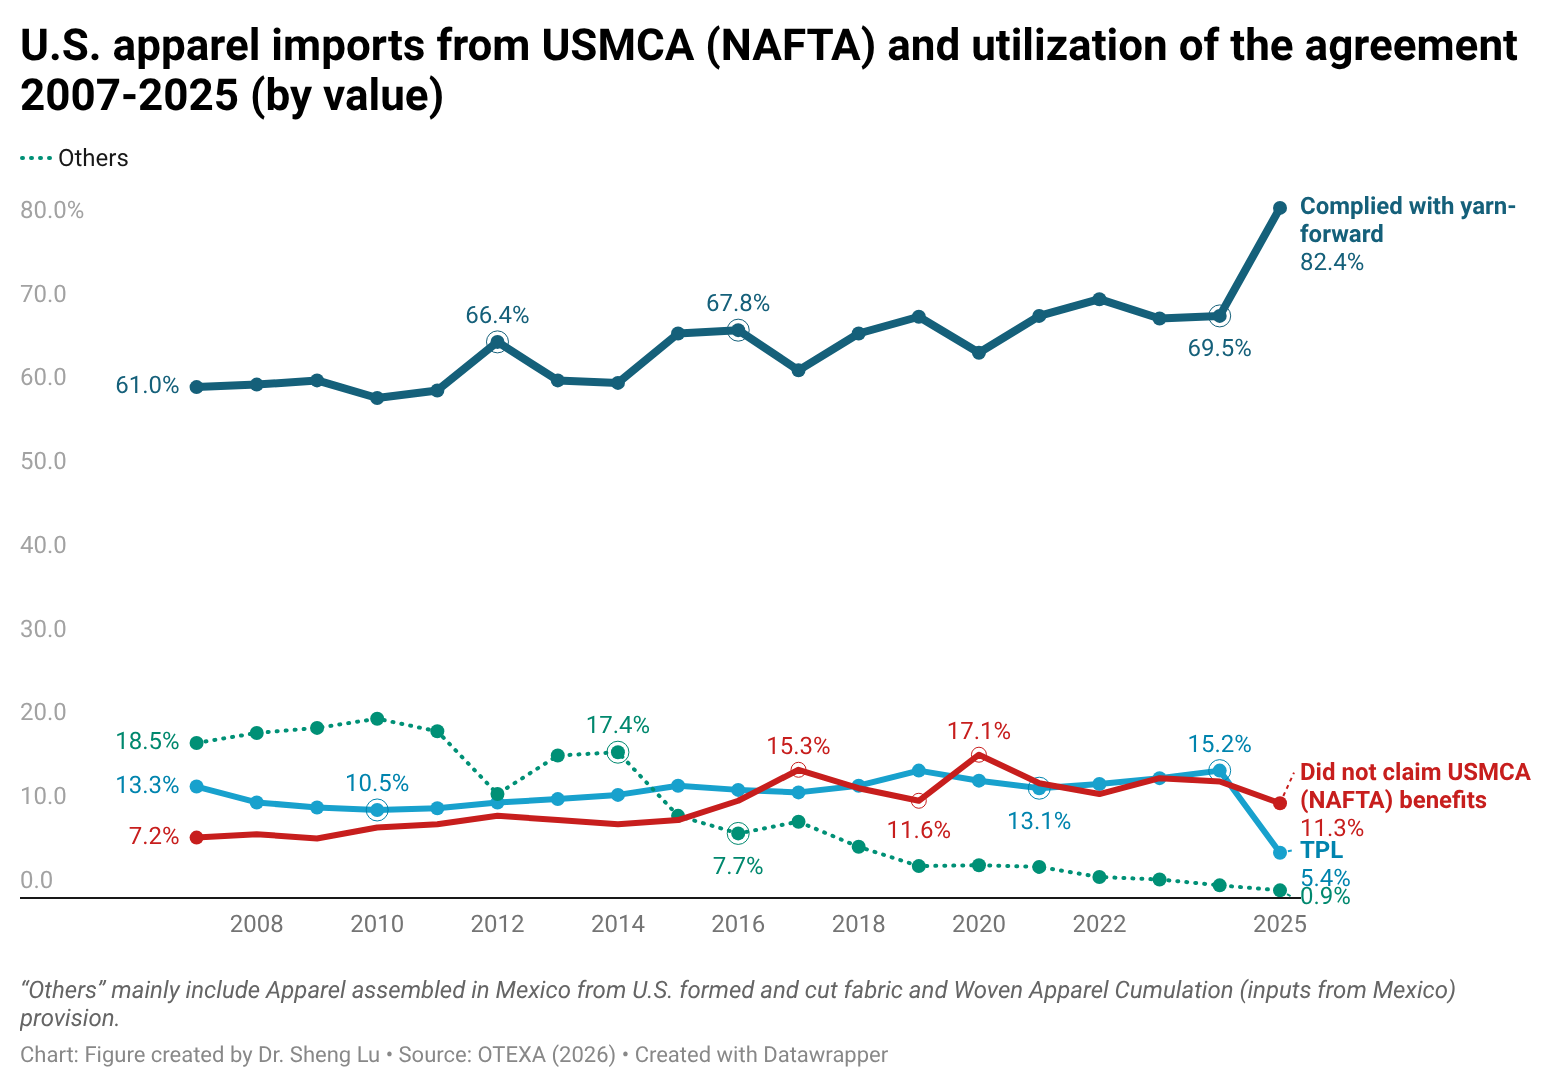
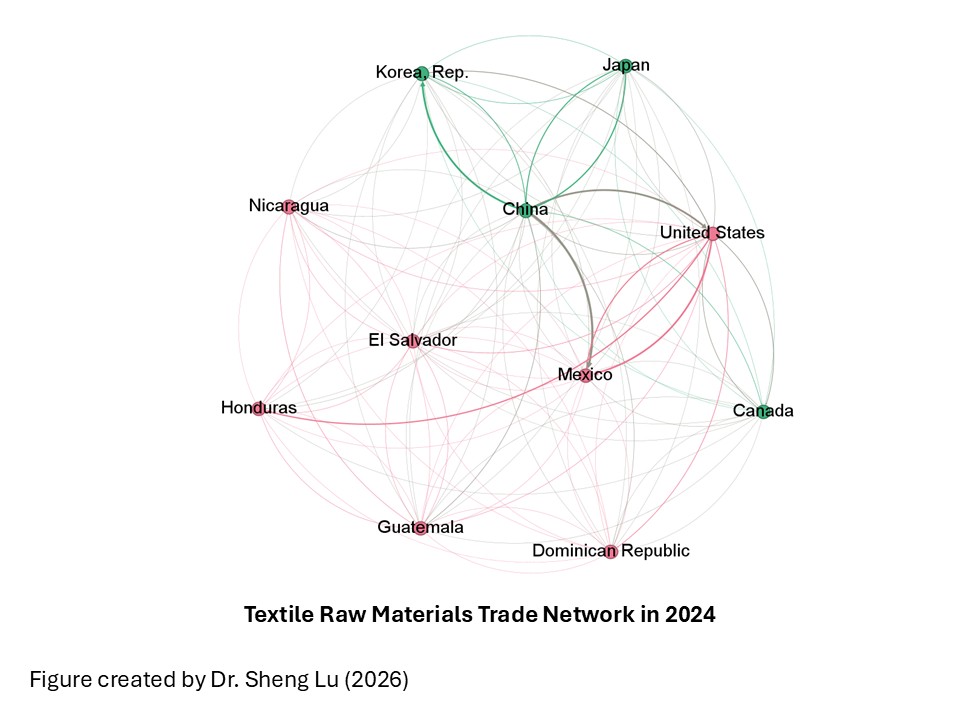
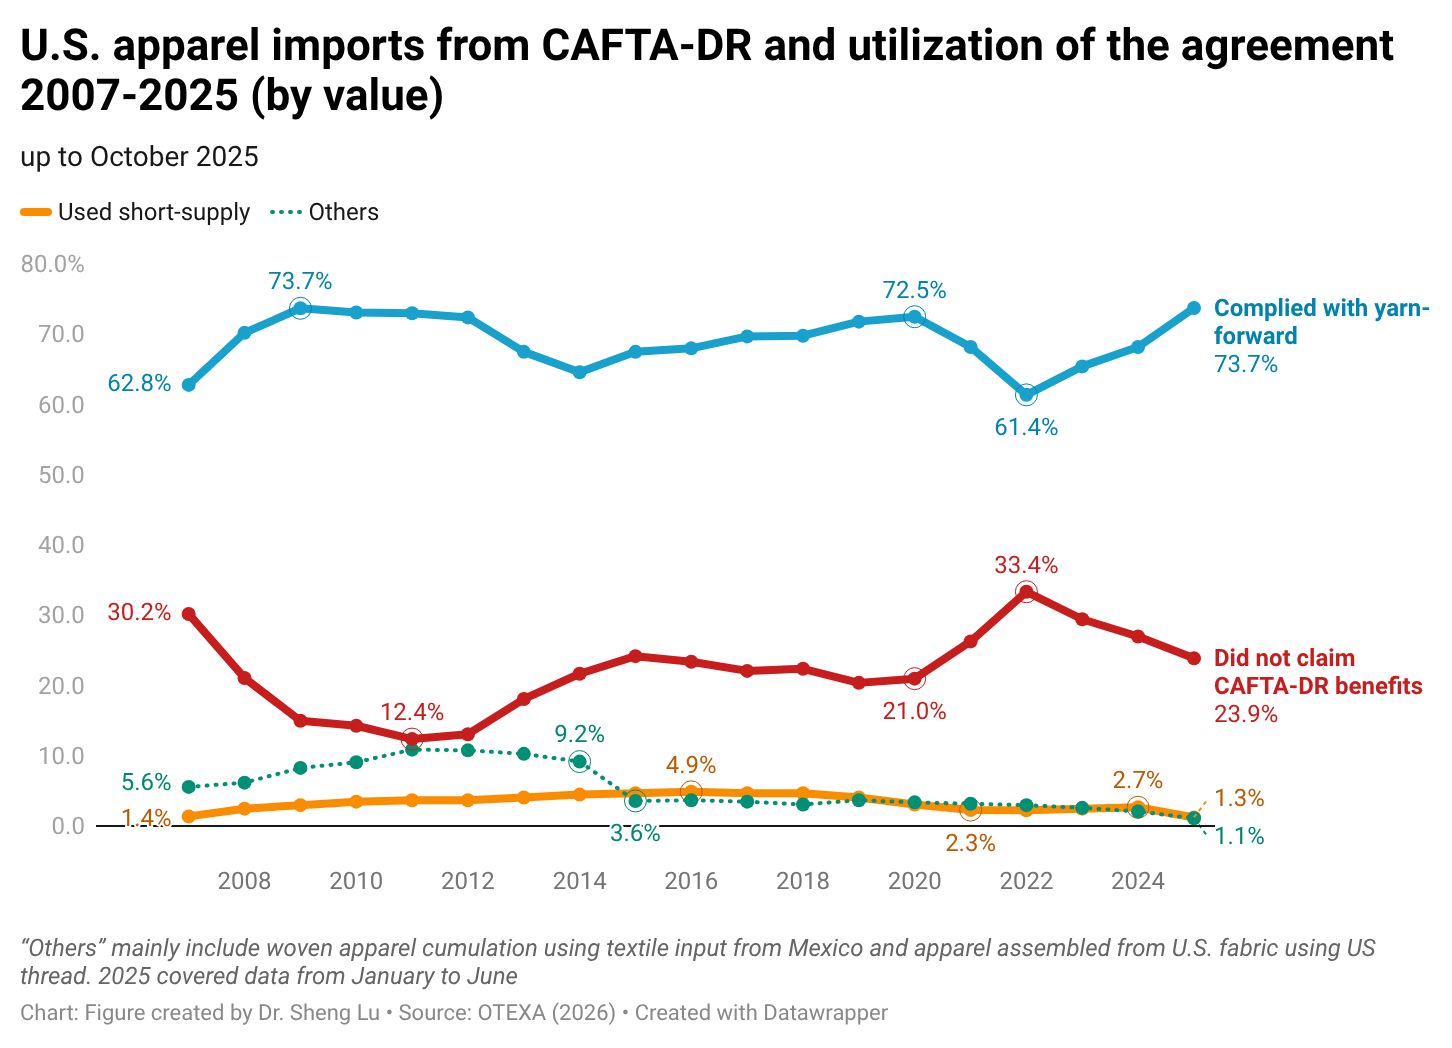
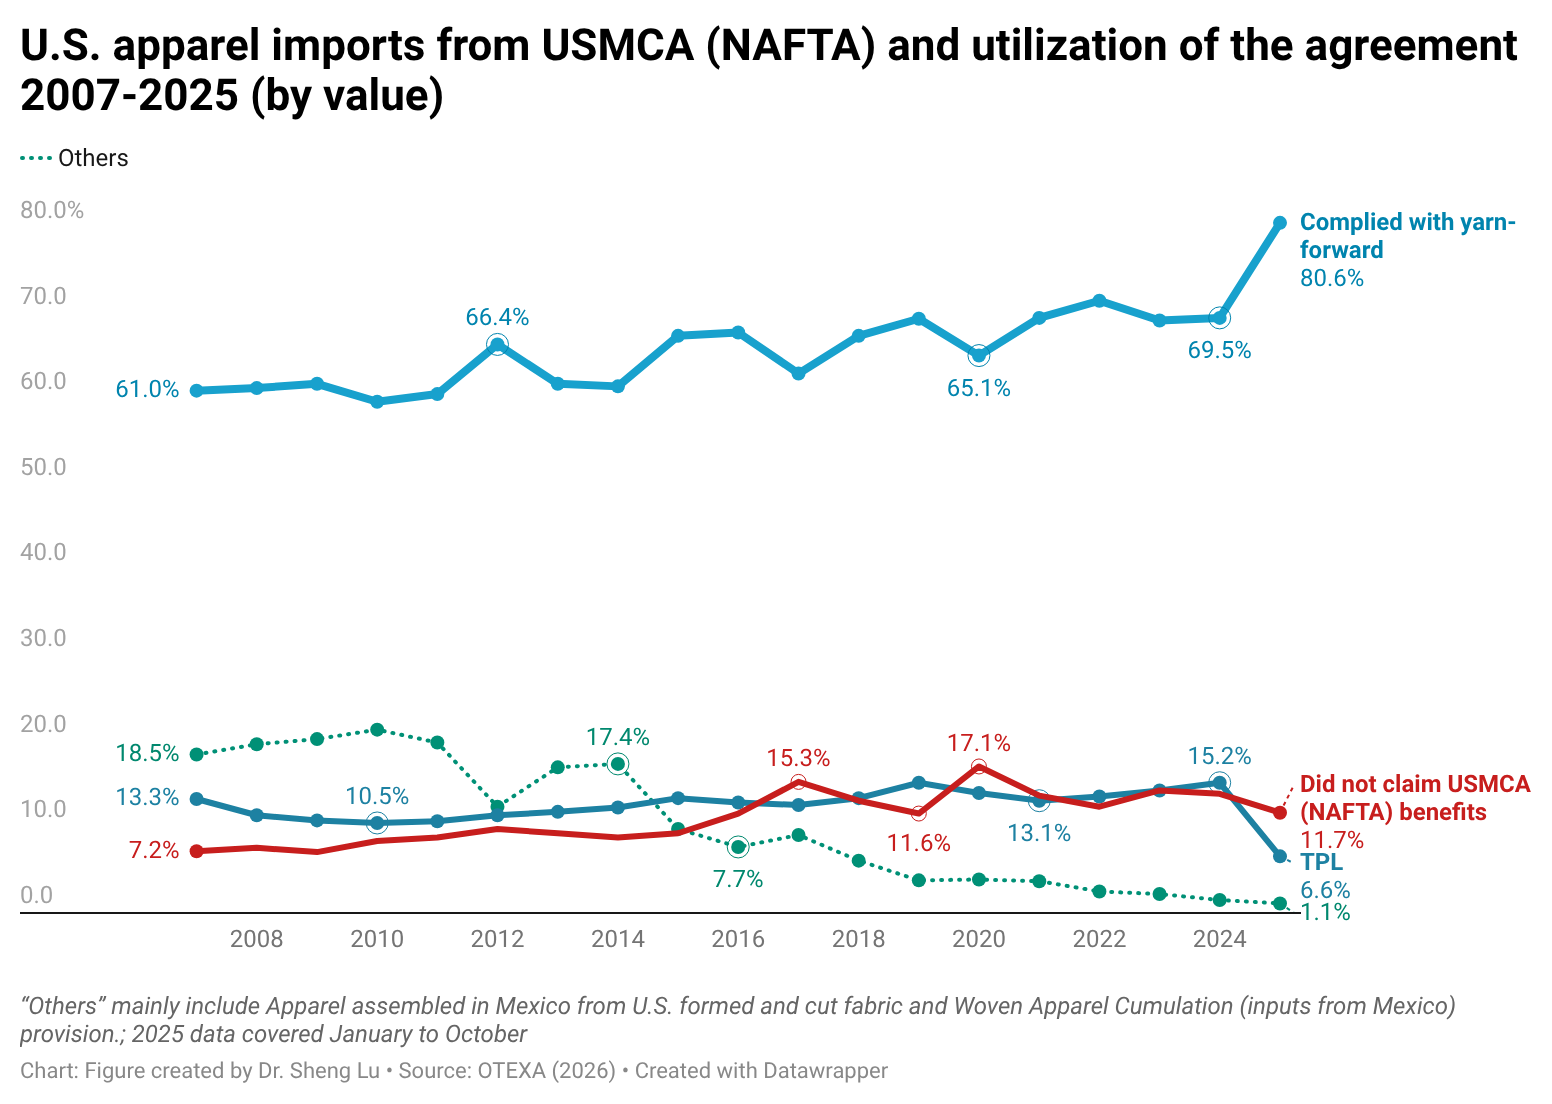
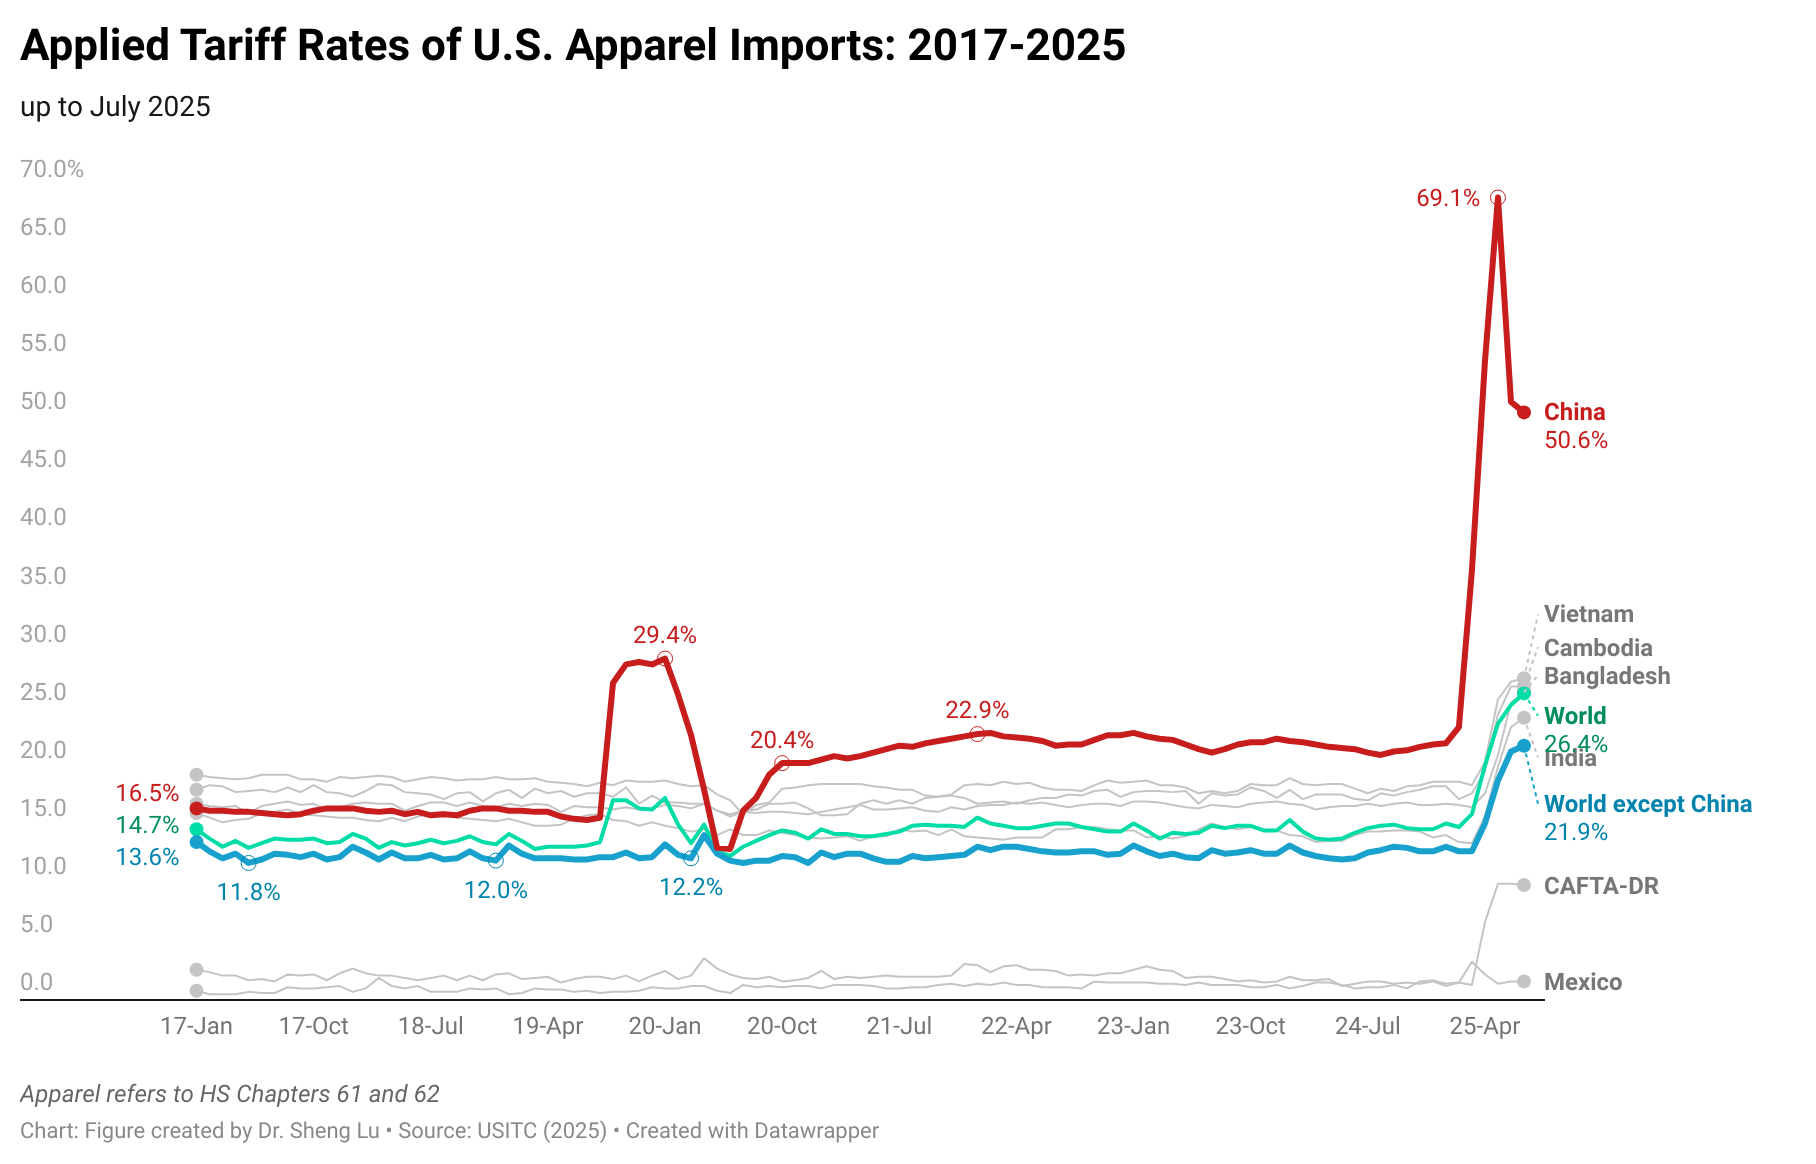
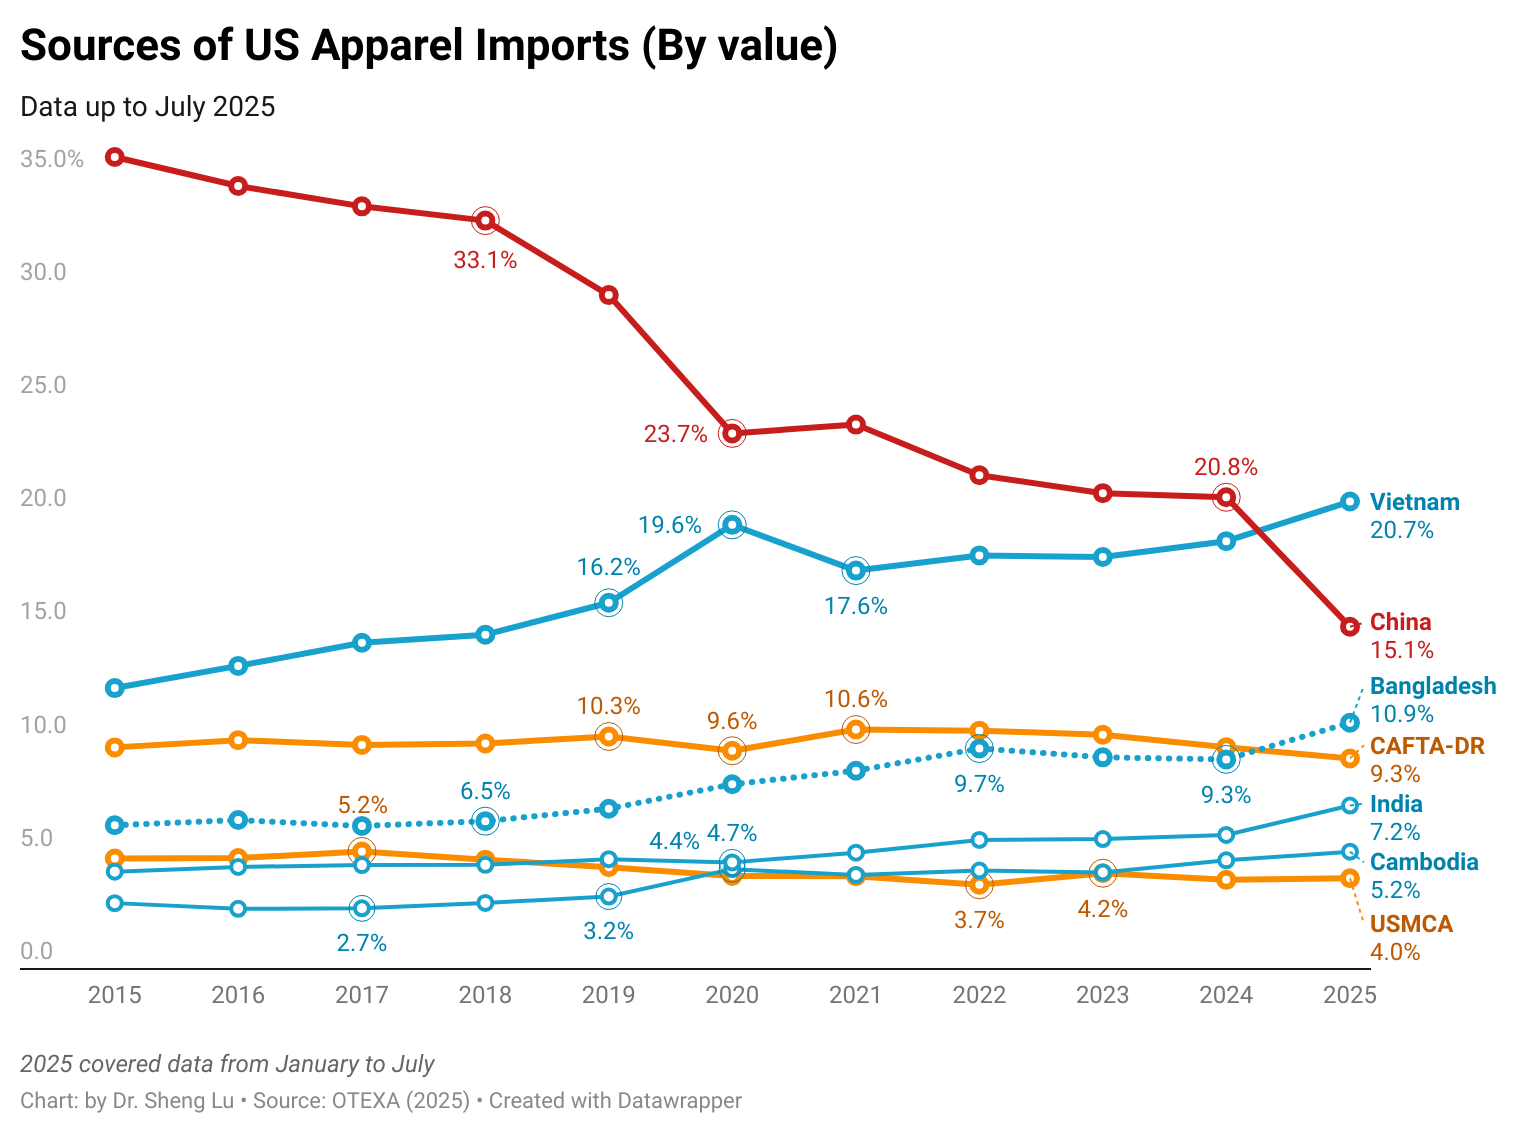
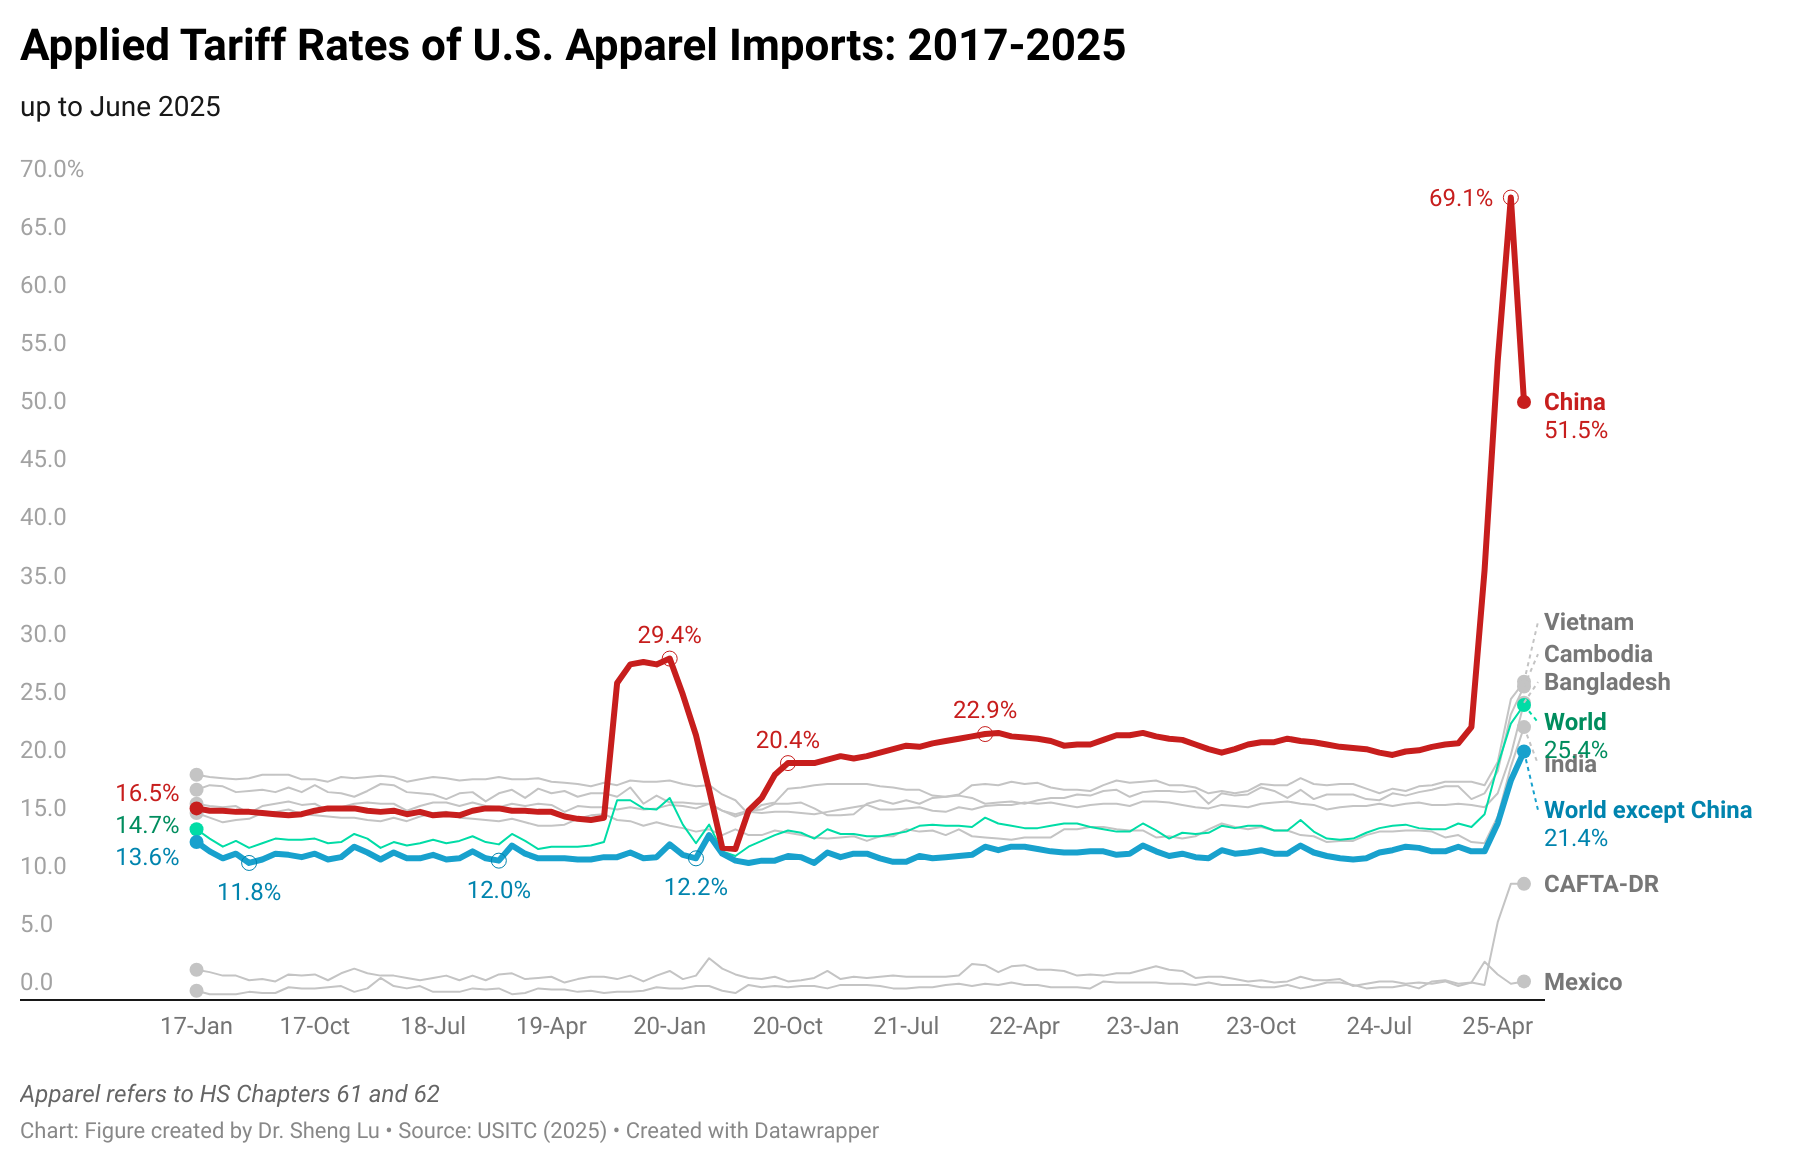
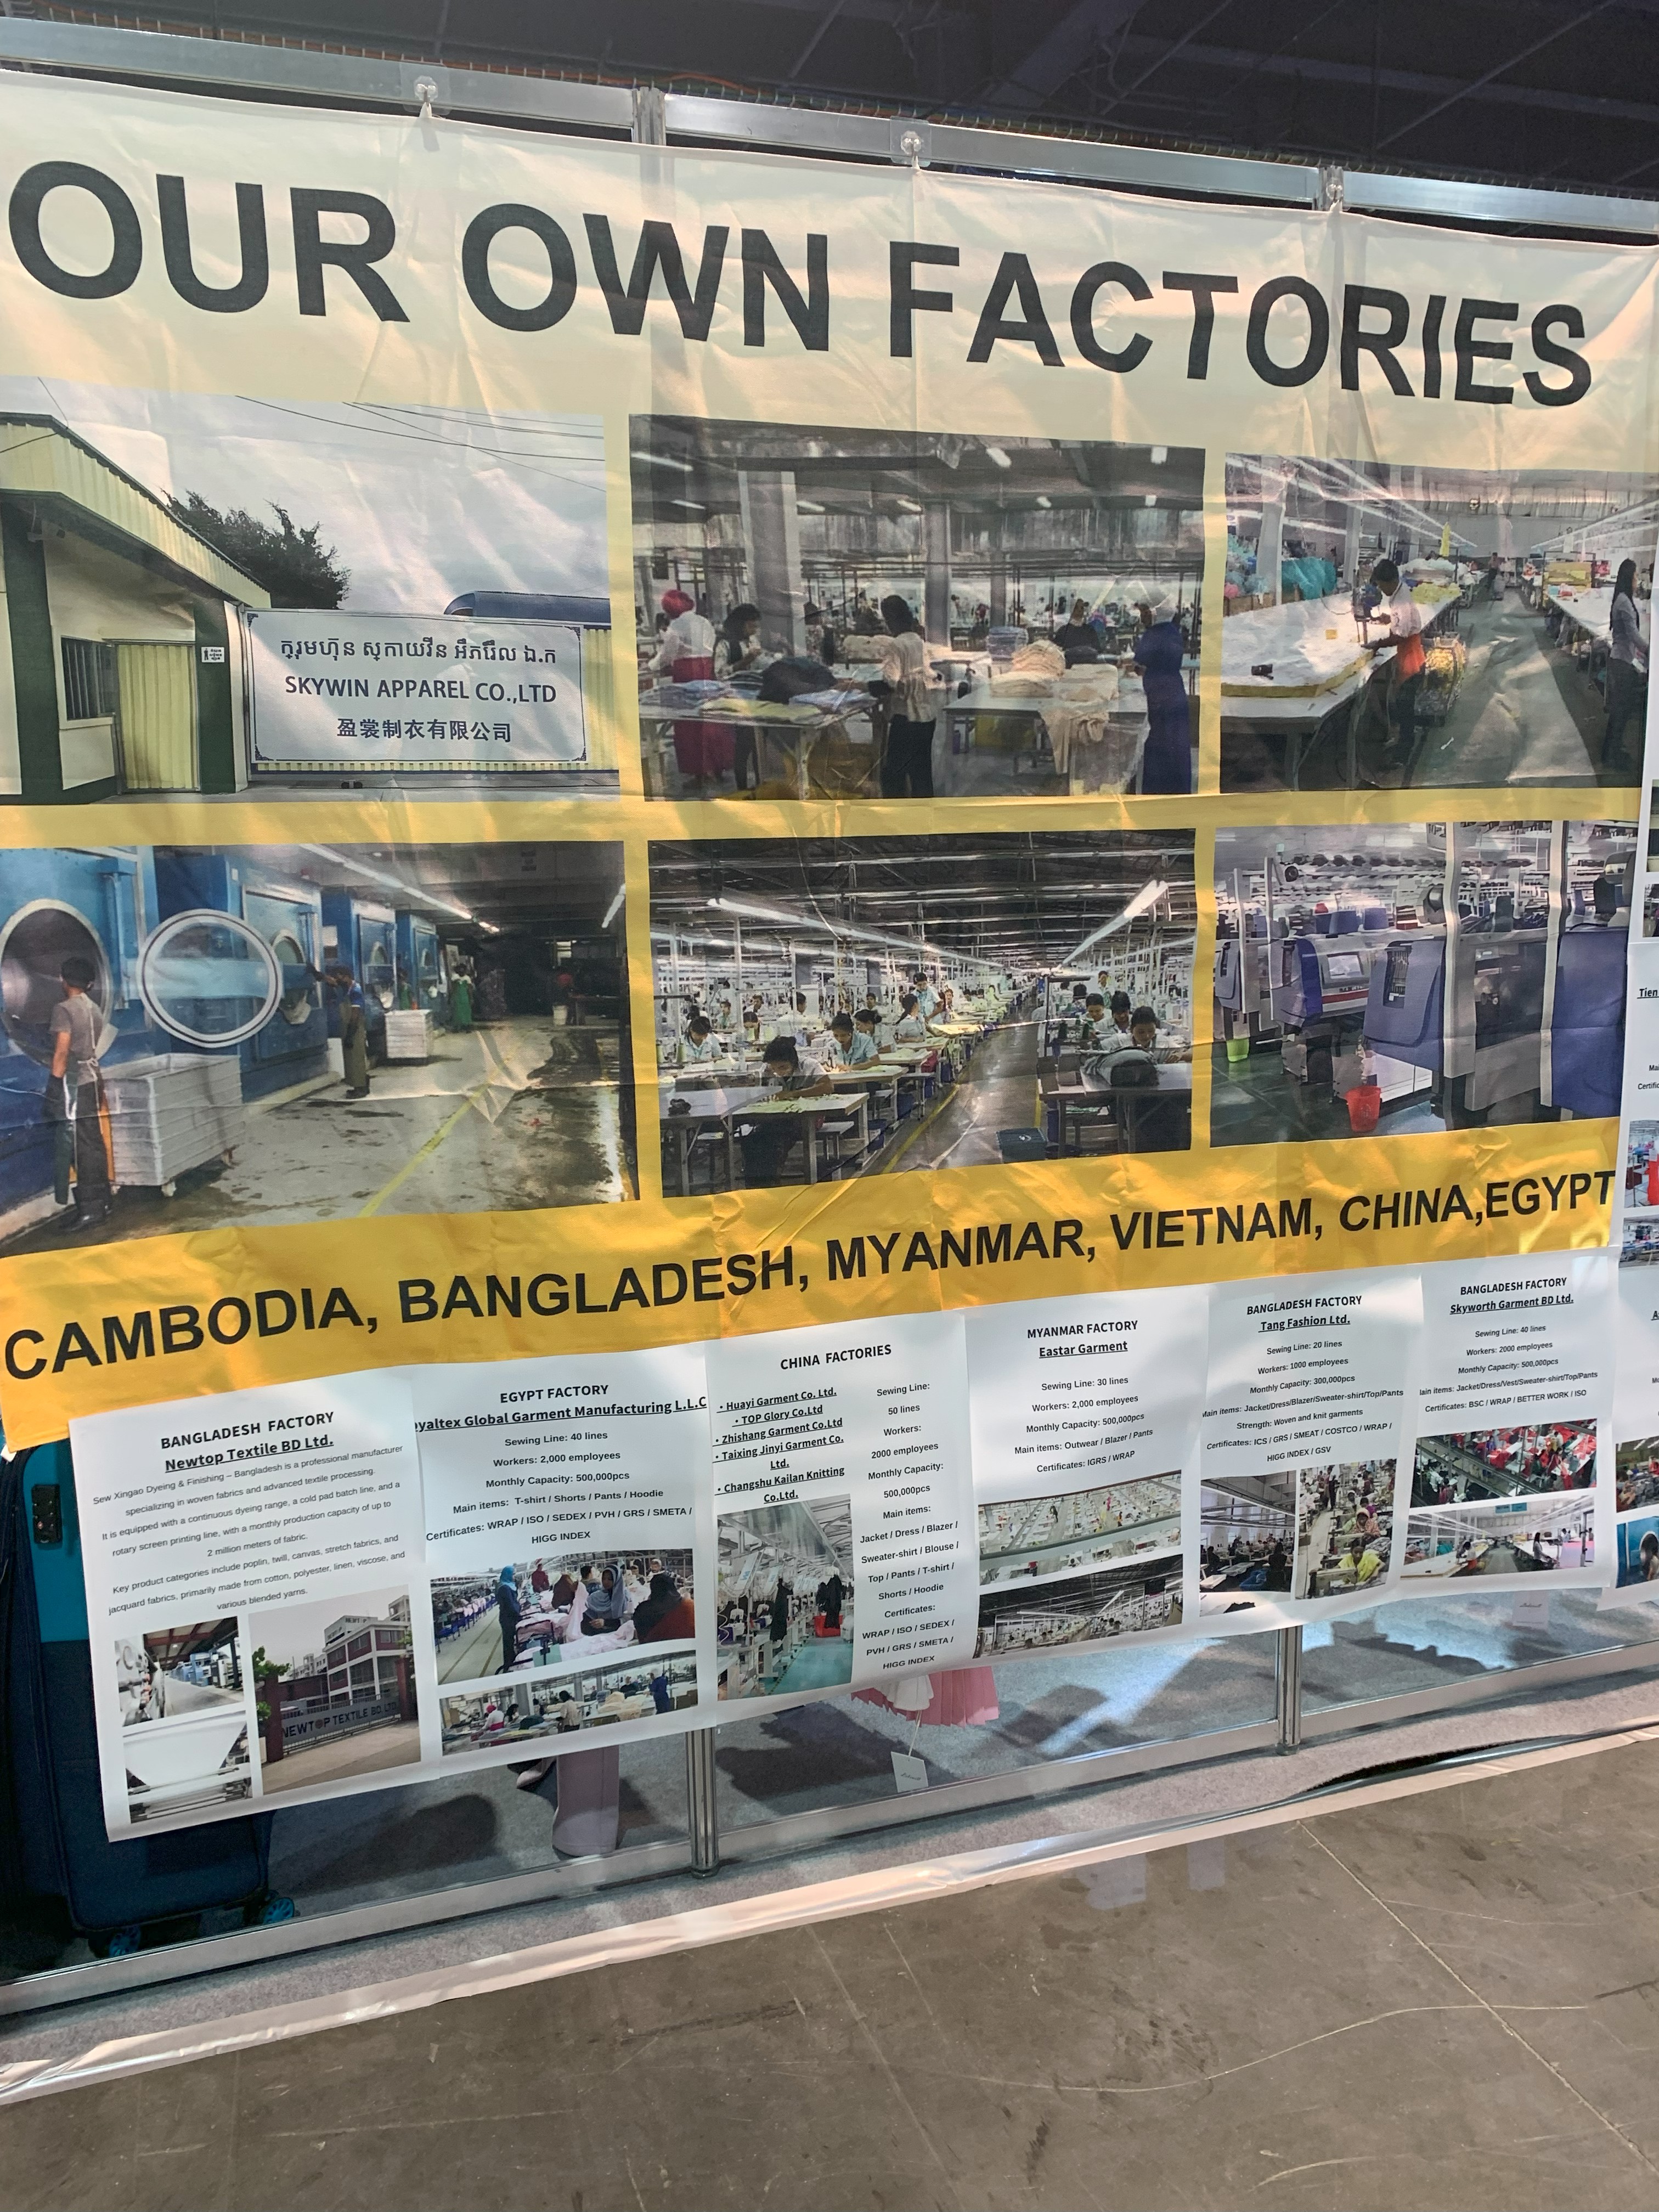
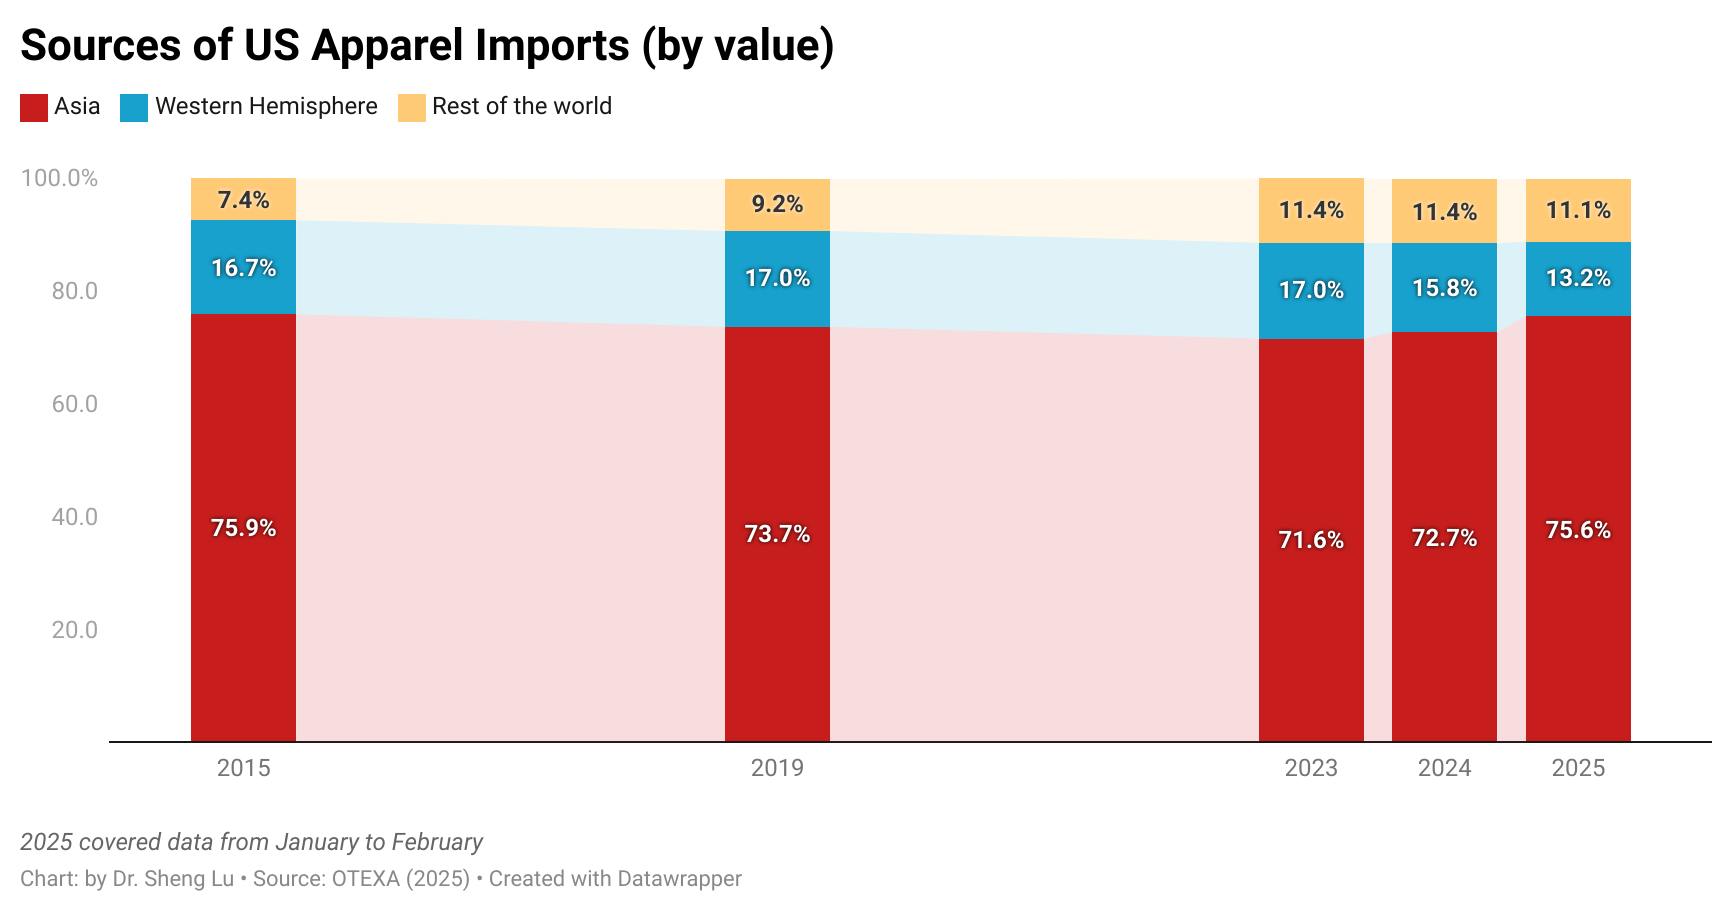
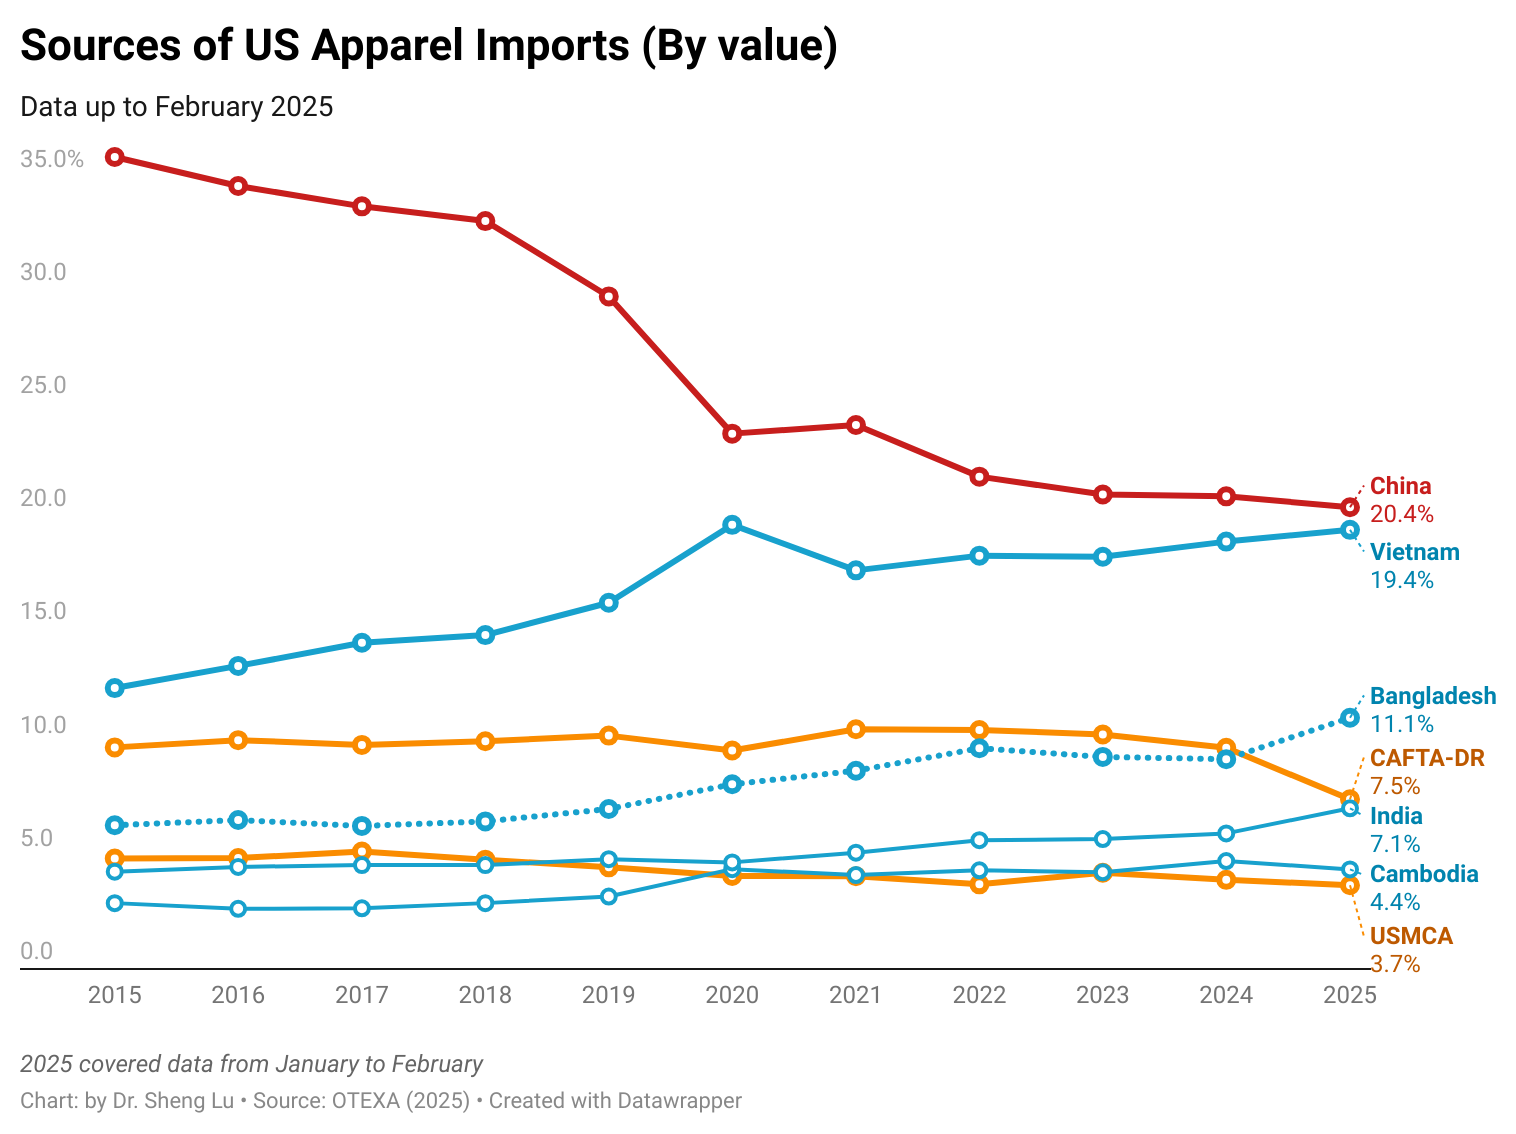
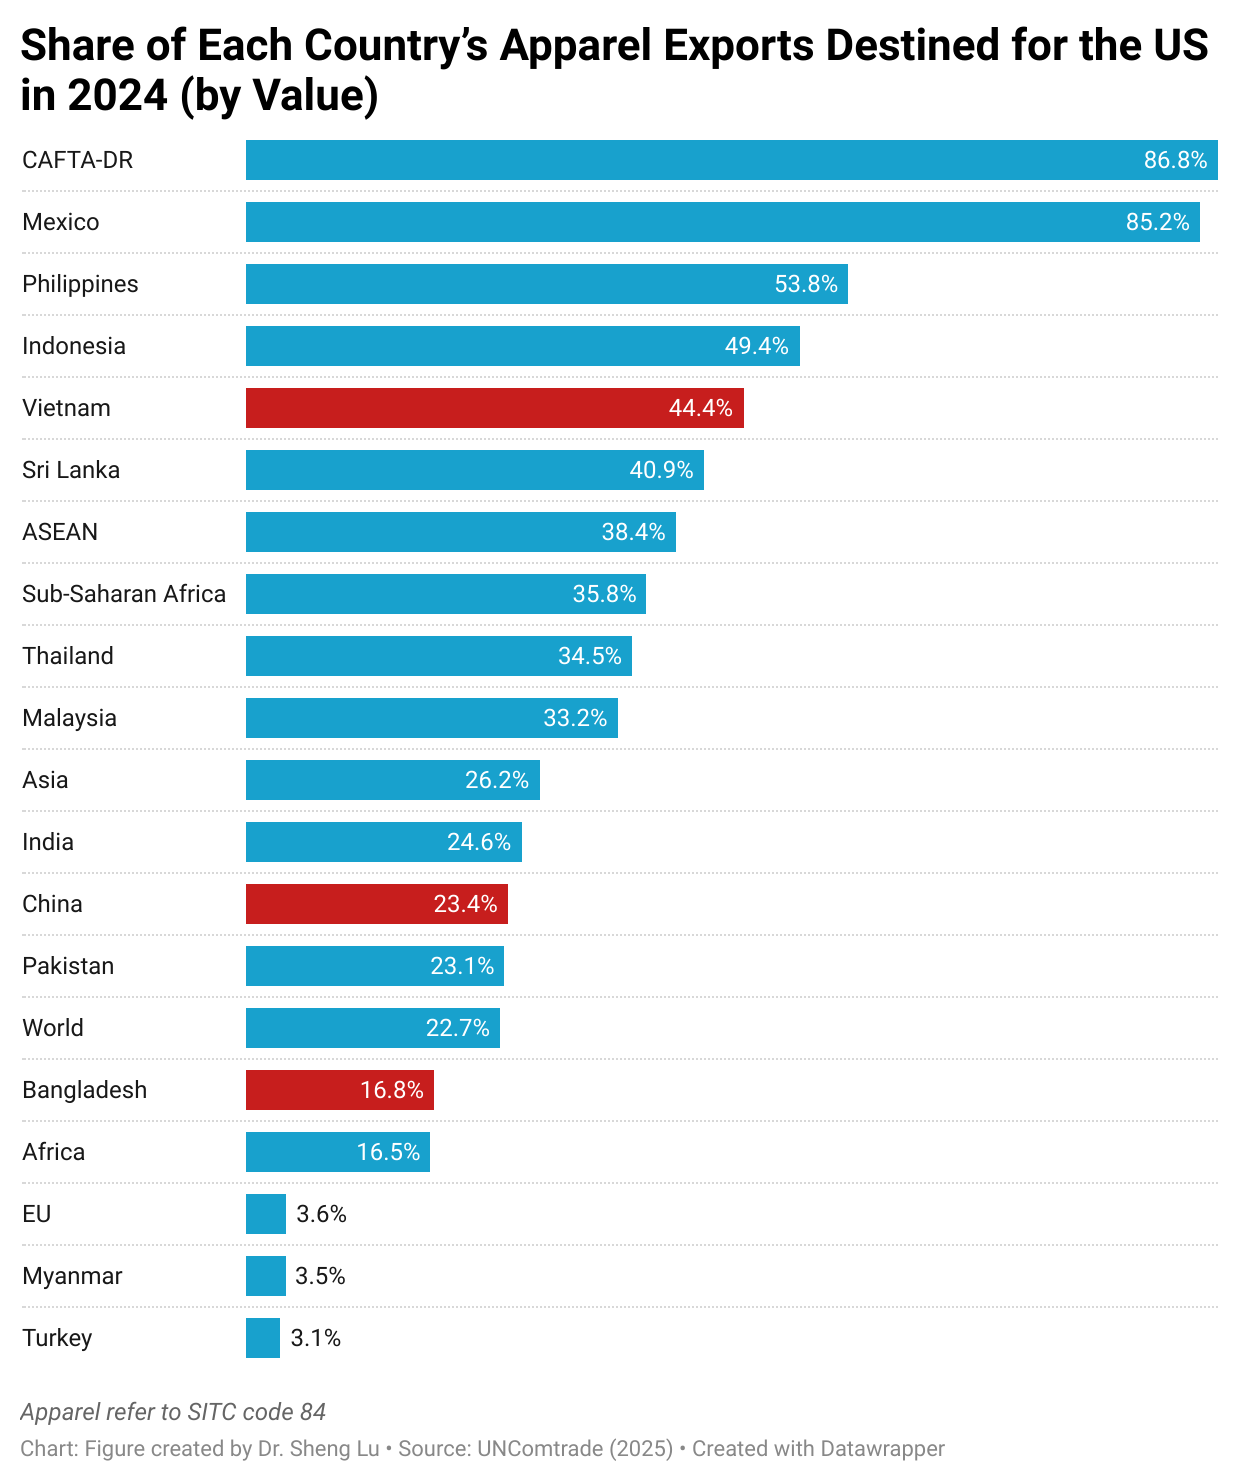
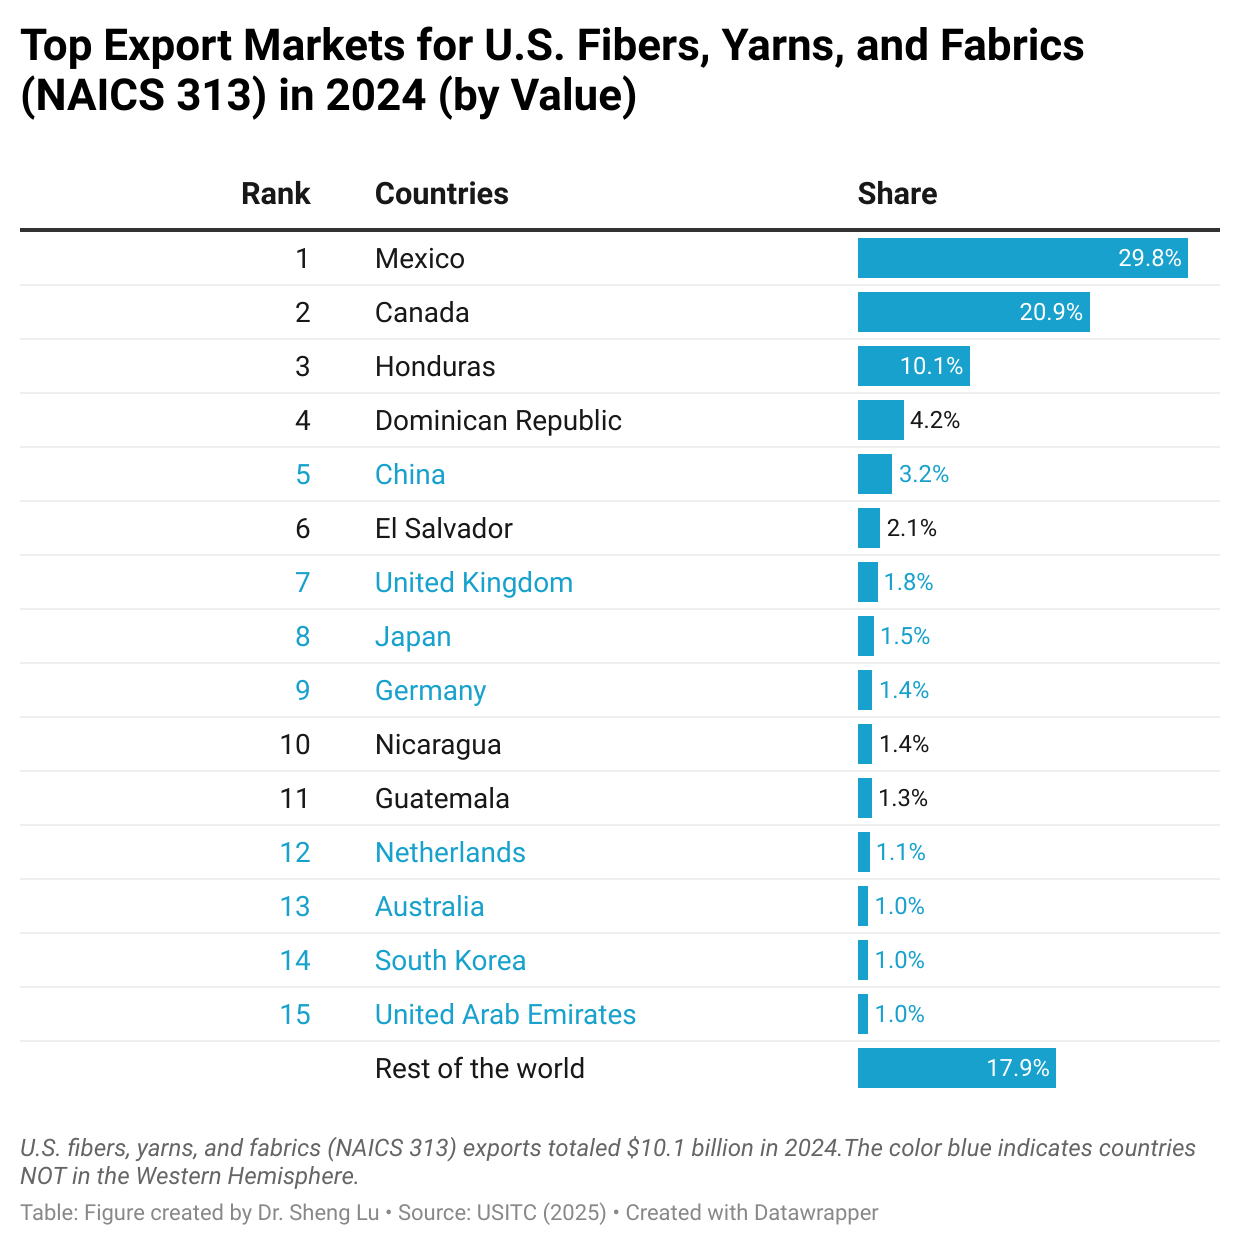
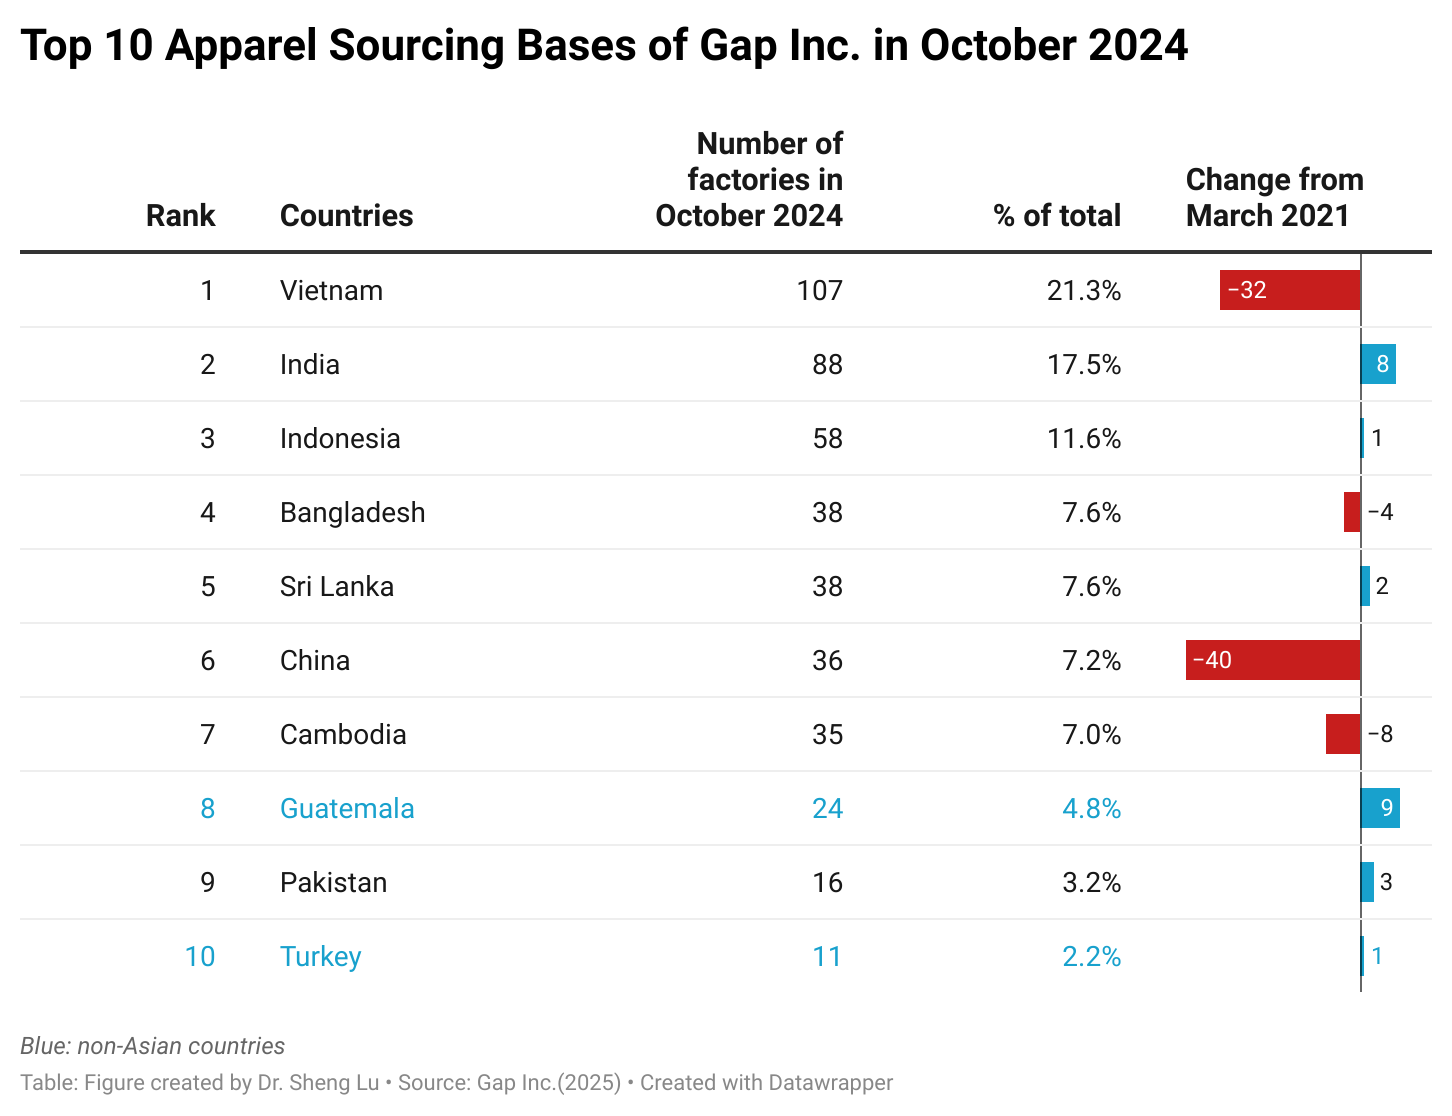
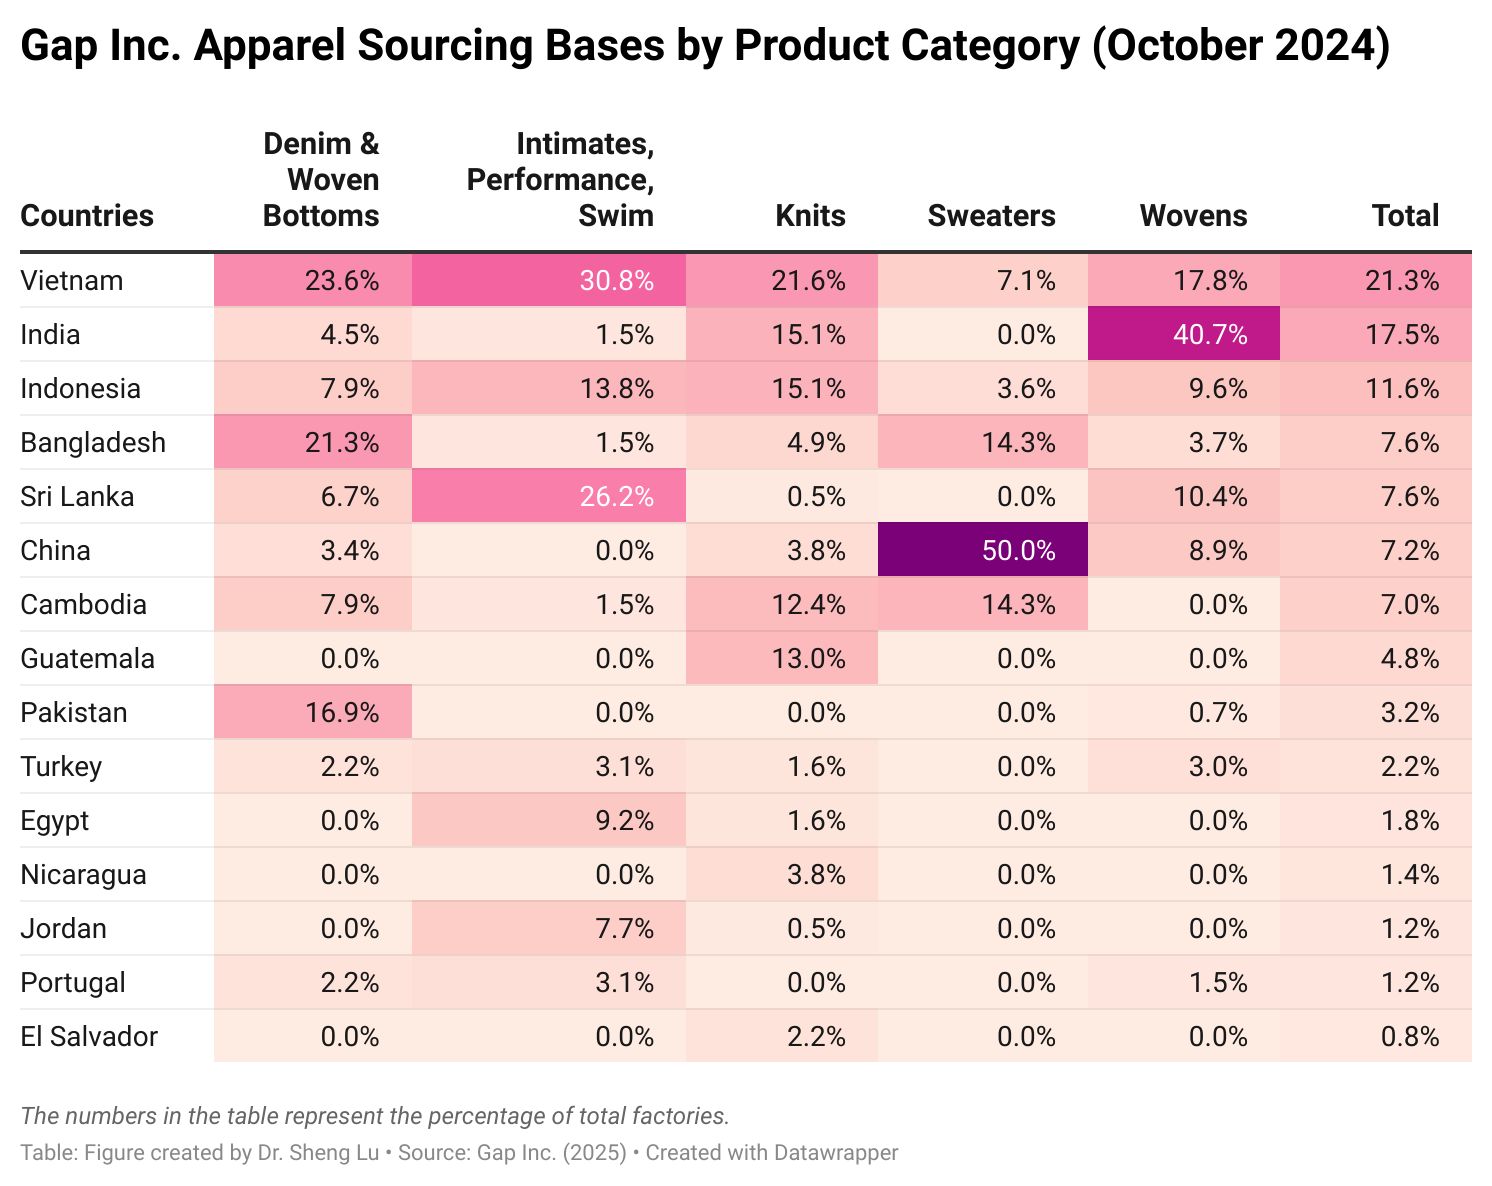
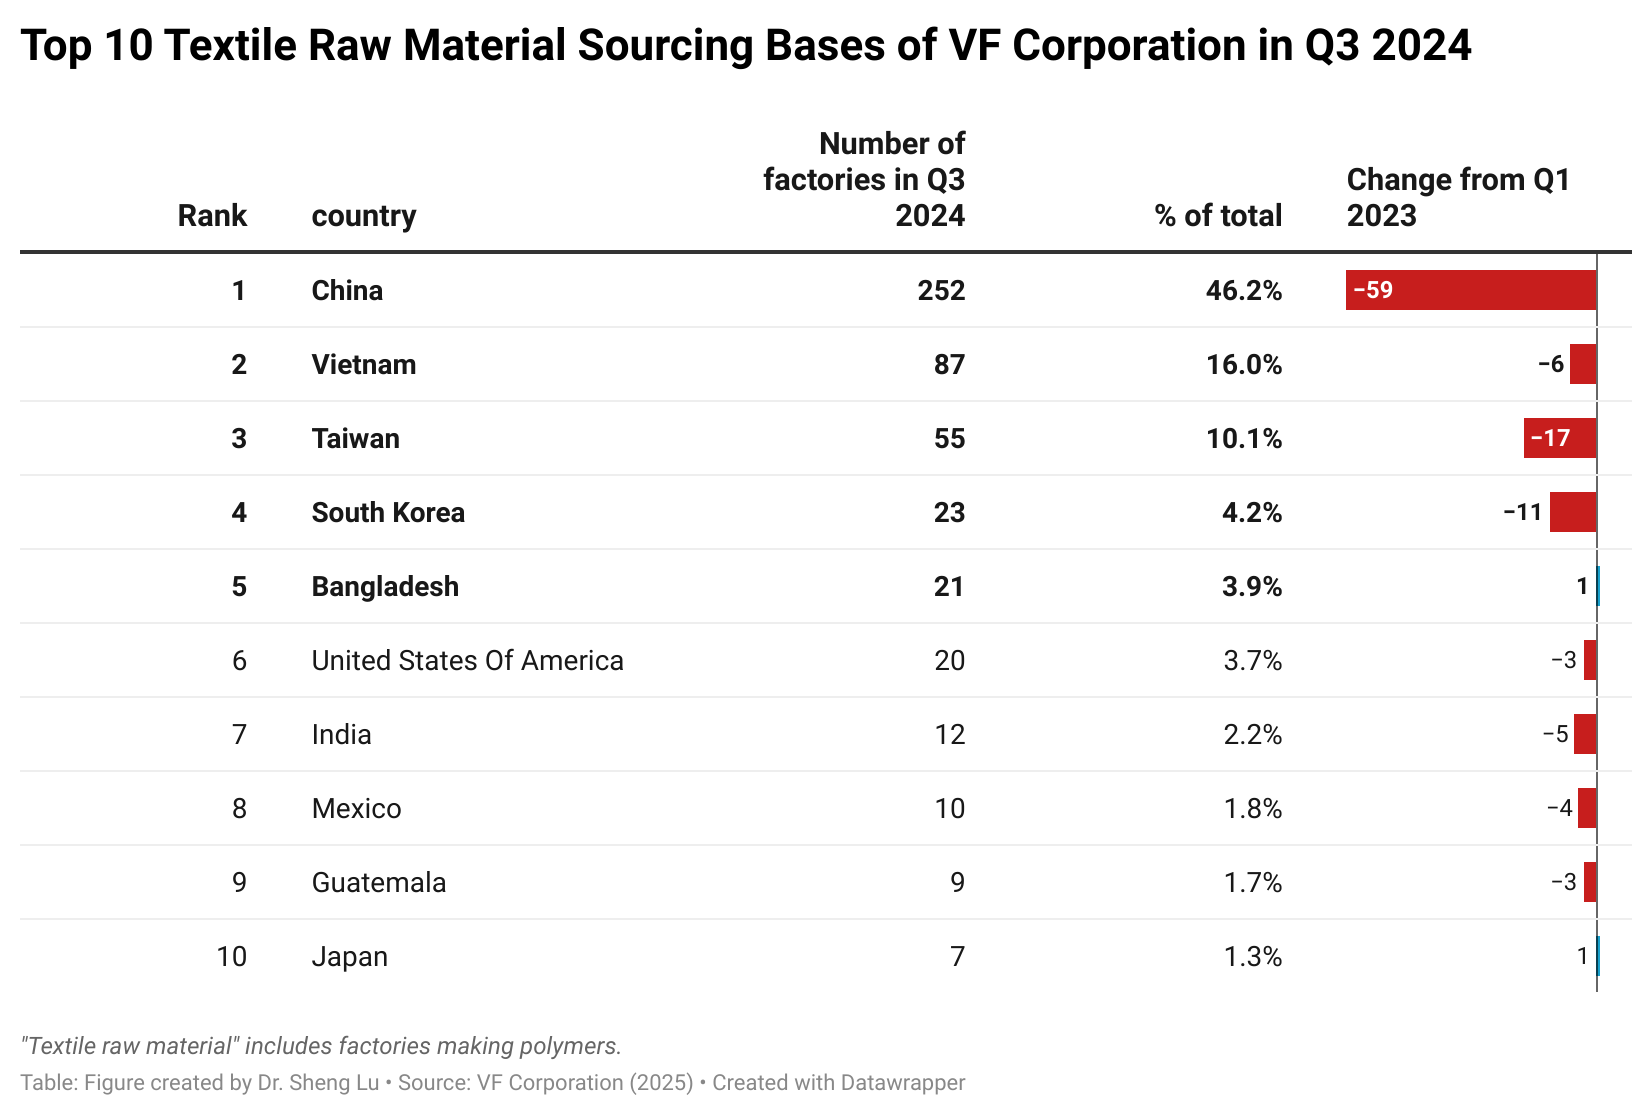
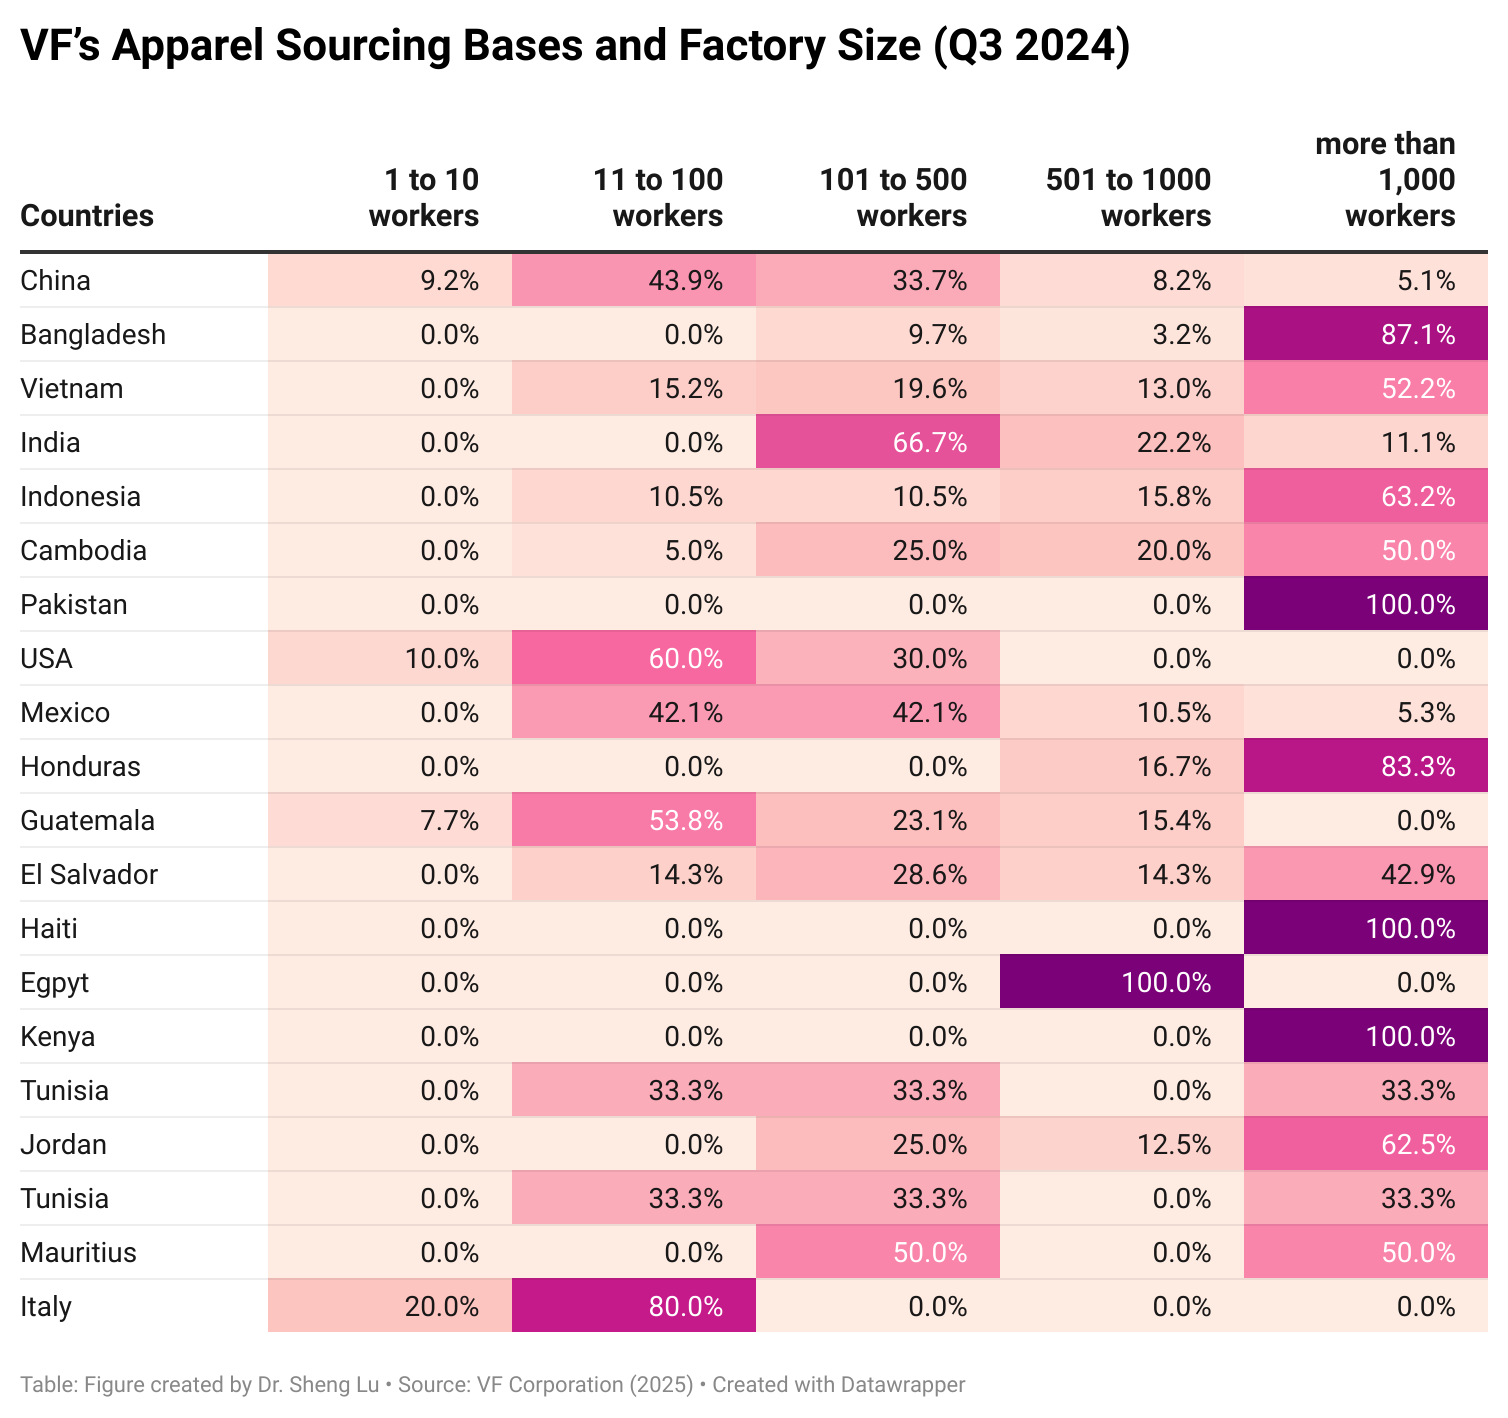
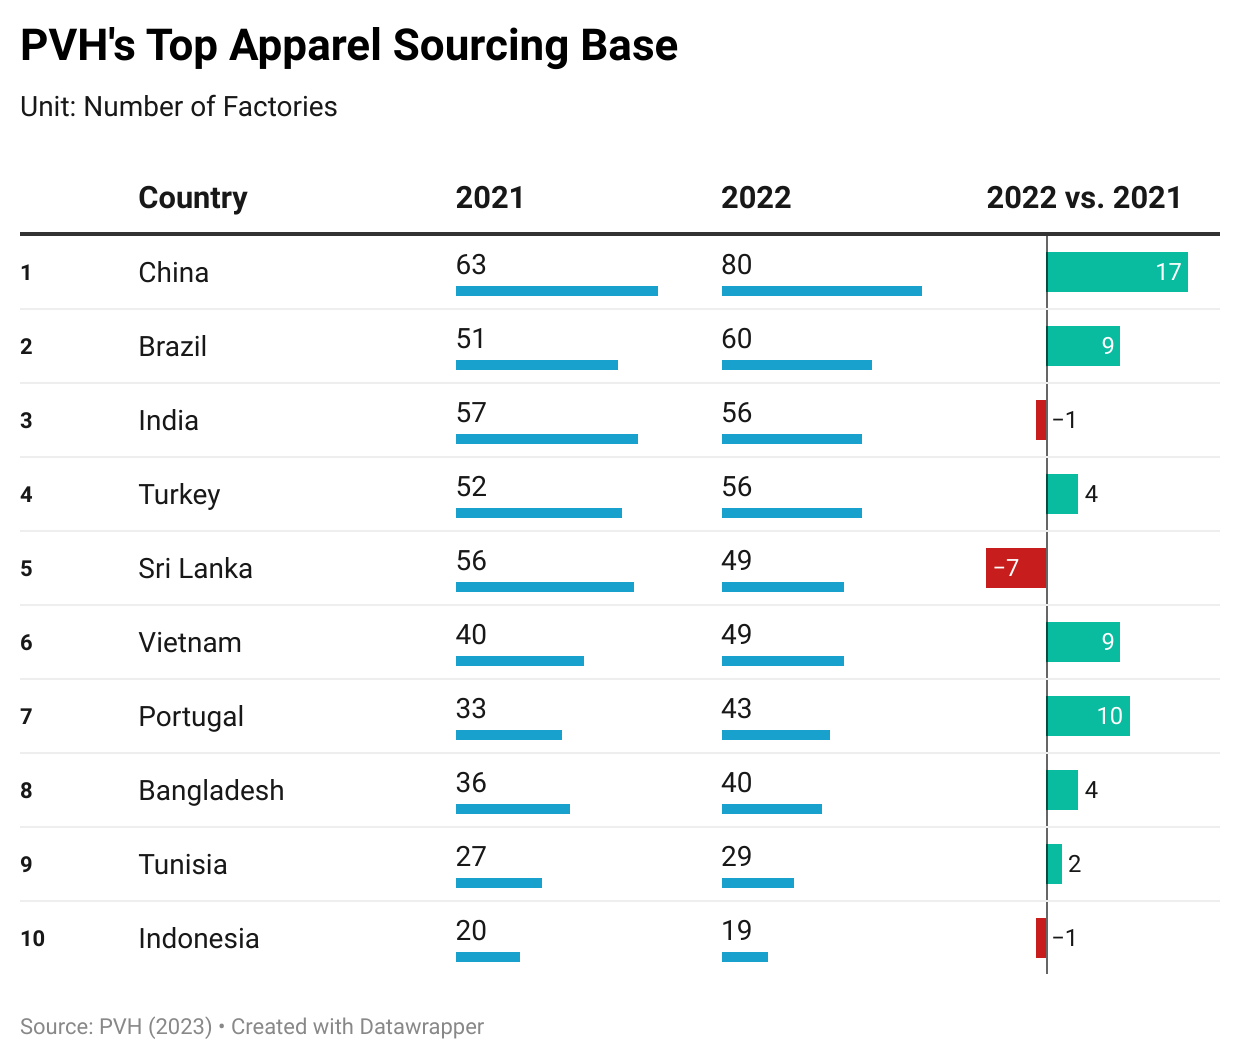
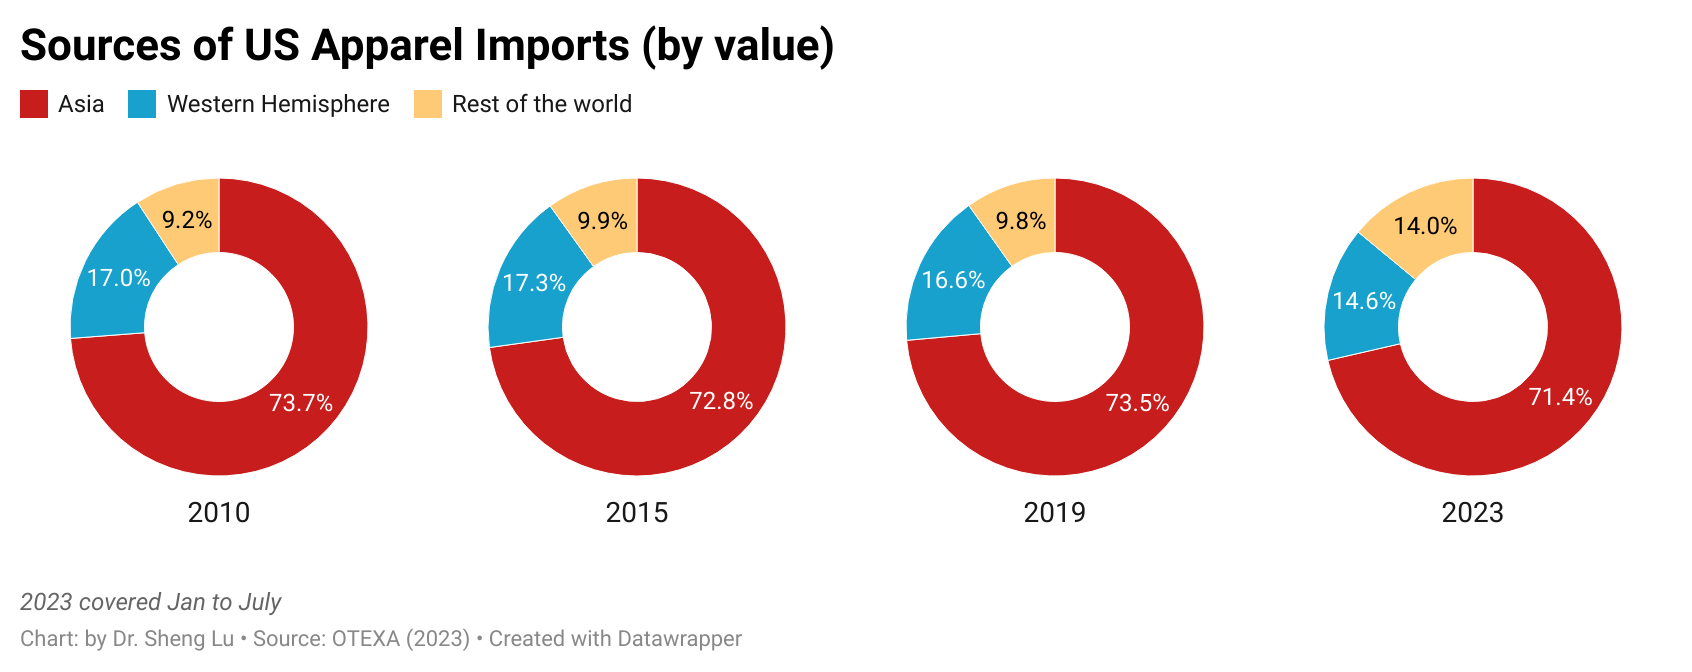
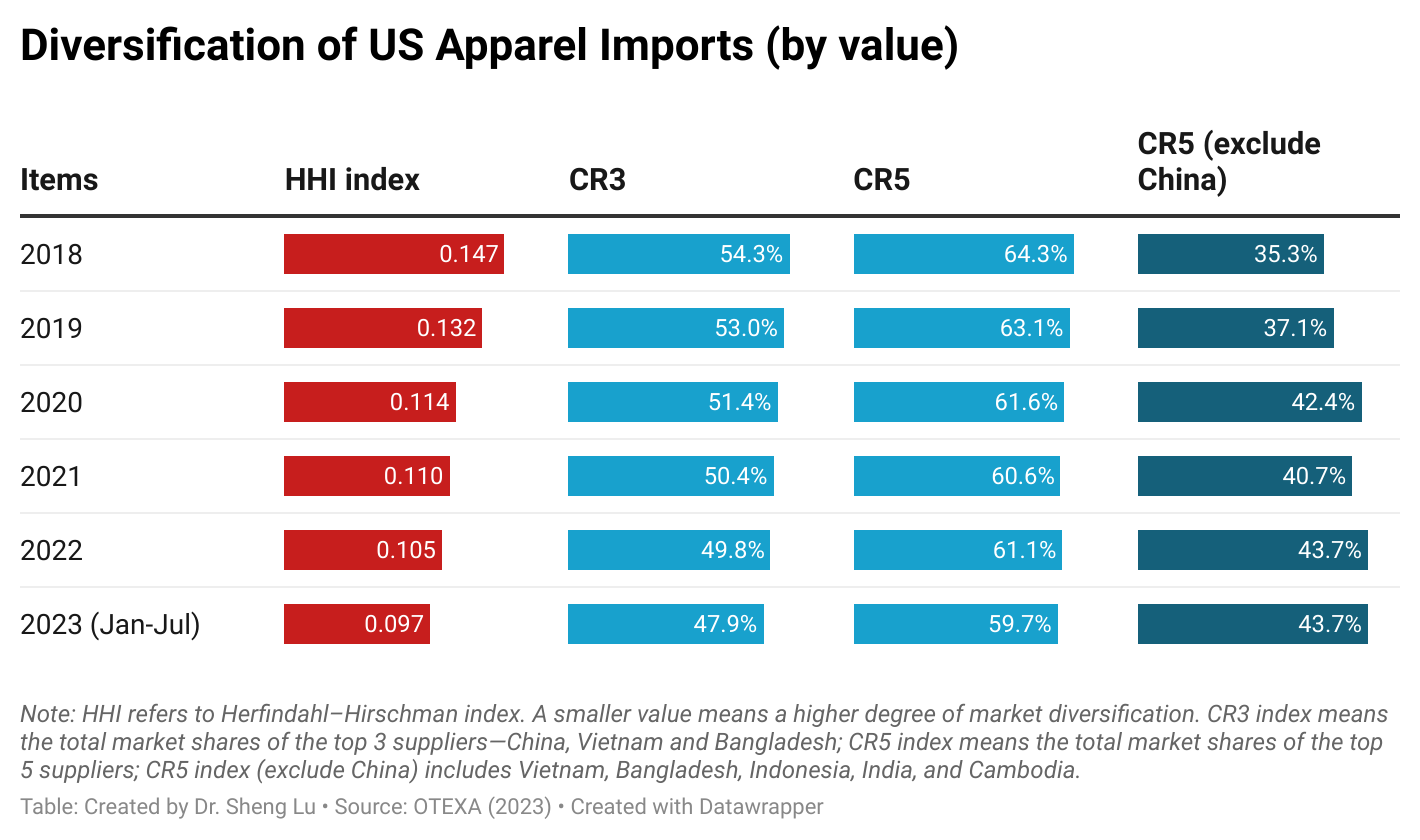
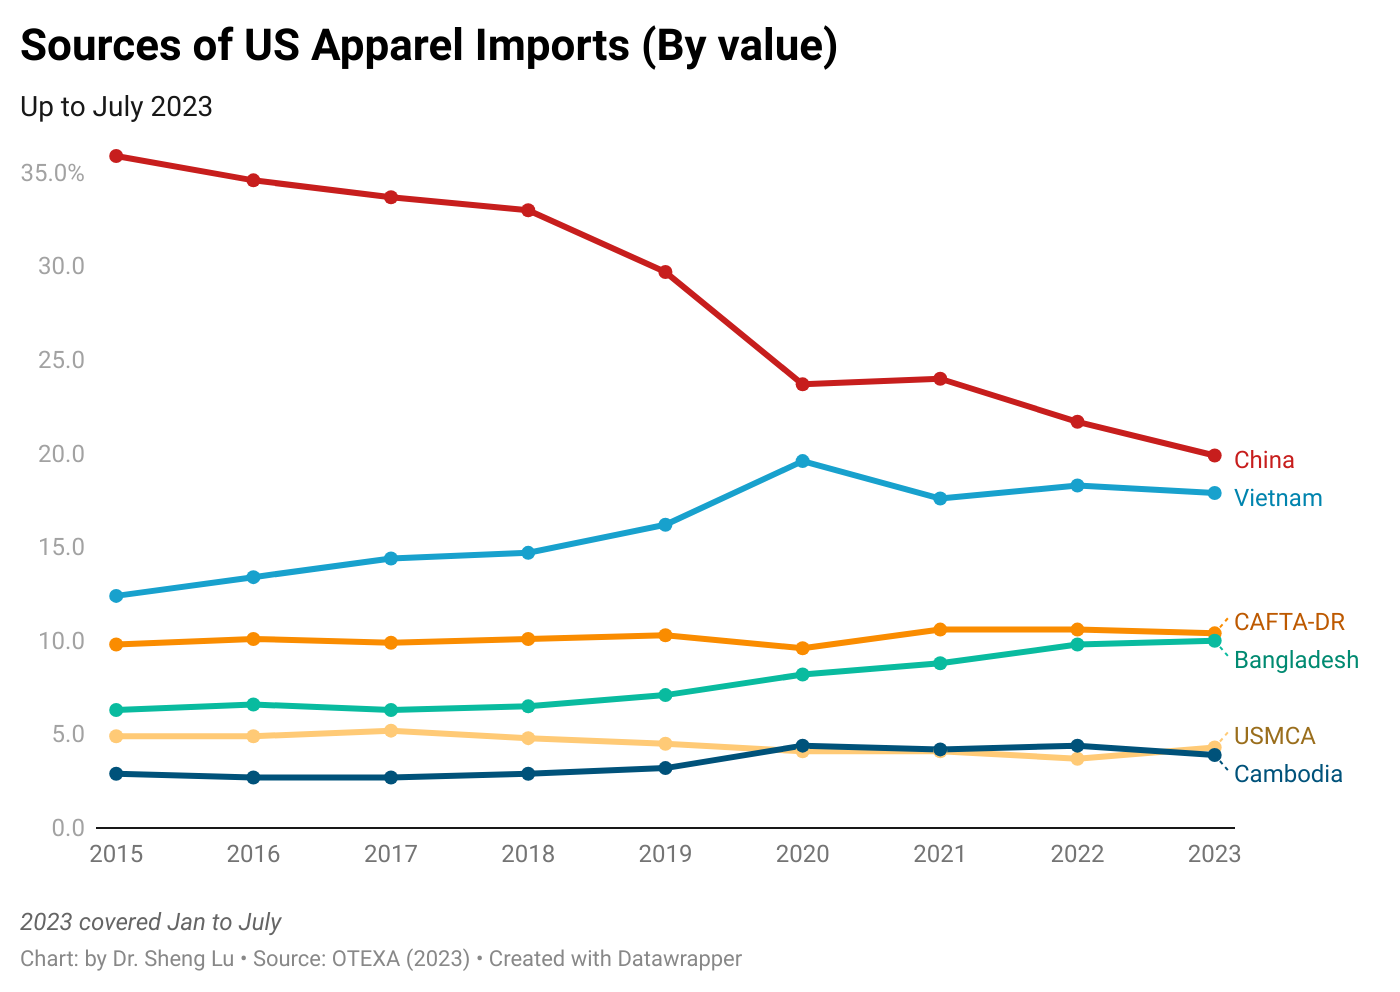
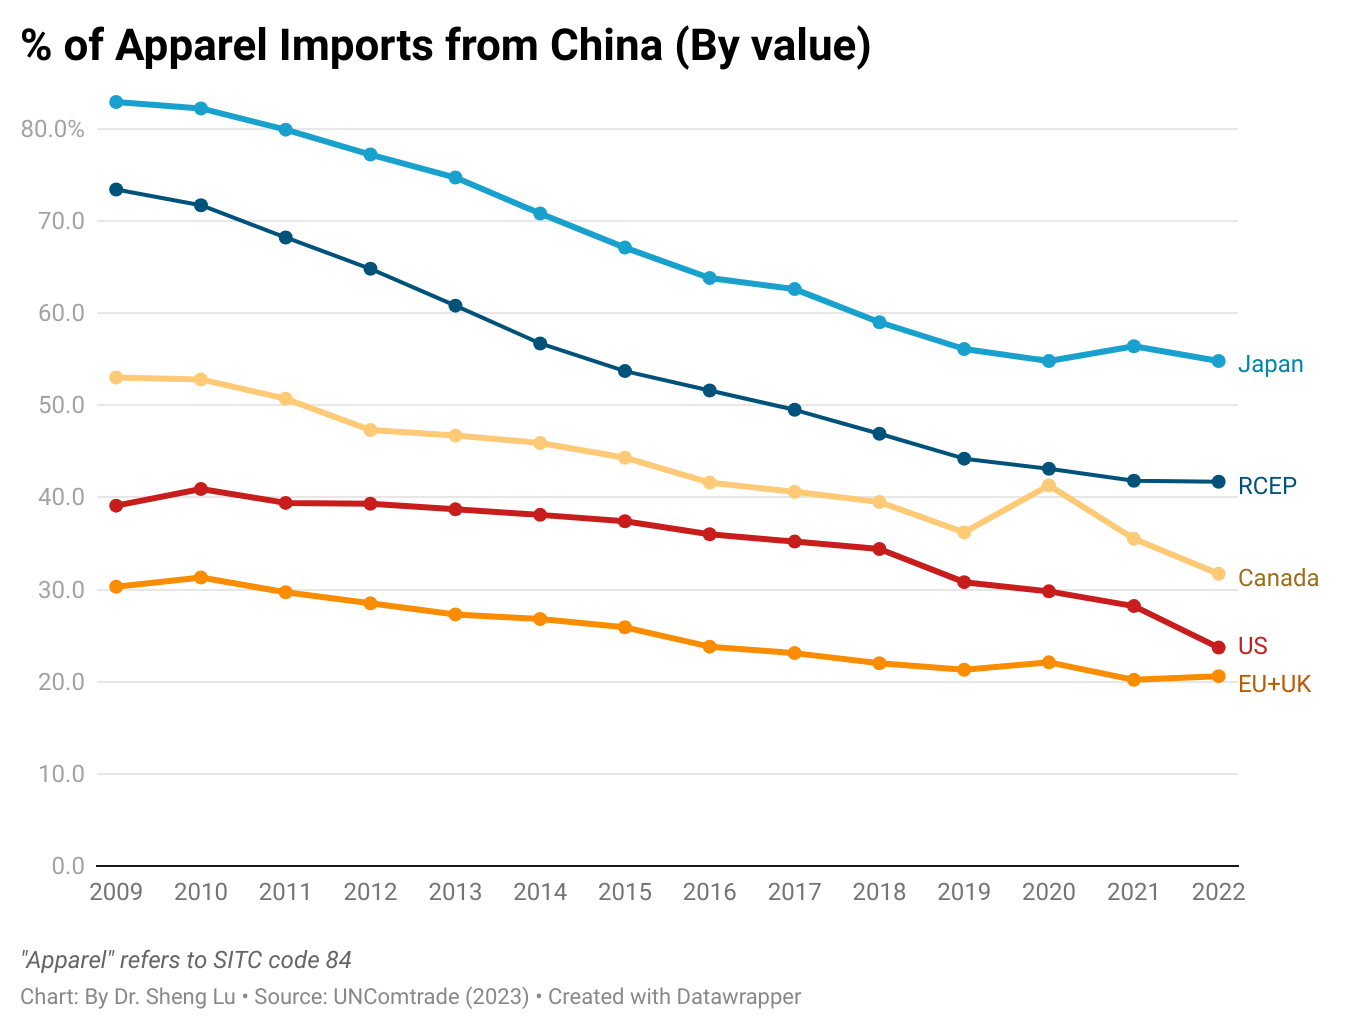
Third, regarding the apparel sourcing base, four strategies stand out: 1) continue sourcing diversification including reducing sourcing from China; 2) expand sourcing from other lower-cost manufacturing hubs in Asia, such as Bangladesh and Vietnam; 3) explore near-shoring opportunities in Mexico and Central America and take advantage of lower tariff benefits; 4) carefully monitor newly negotiated trade agreement with the US, especially those with textile and apparel-specific provisions, such as the one with Bangladesh. Meanwhile, many companies noted that full sourcing realignment takes 12–18 months or more. For example:
- Oxford industries: “Early in fiscal 2025, approximately 40% of our apparel and related products were expected to be sourced from producers located in China. Through the actions we took during the year, that figure declined to slightly less than 30% of our product purchases in fiscal 2025, and our annualized run rate entering fiscal 2026 has been reduced to approximately 15%.”
- Abercrombie & Fitch: “Obviously we’ve talked a lot about our sourcing footprint over the course of the last year or so. Really proud of that diversified network that we have in place, and it’s taken us years to build. We currently source from over 16 different countries. That’s been obviously a core enabler for us and our read and react model here. Approach isn’t changing…”
- Kontoor Brands: “Of particular interest to us is the trade agreement with Bangladesh, which we highlighted. That trade agreement reflected a potential reciprocal tariff ranging from 0% to 19%, depending on the U.S.-grown cotton content of products sourced from Bangladesh. More than 80% of the product we source from Bangladesh does include U.S.-grown cotton. Bangladesh is our largest country of origin from a sourcing perspective, so by nature, it’s also our largest source of tariff pressure.”
- Gildan: “we are pleased to announce that we are moving forward with phase two of our Bangladesh complex. Over the next 18 months, we will begin construction of our second large-scale textile facility, with initial production expected to come online in the later part of 2027. Expanding our Bangladesh footprint is central to reinforcing our cost leadership in ring spin and innerwear…we are increasing our internal capacity in Bangladesh and in Central America, obviously in anticipation to support the Hanes integration.”
- Land’s end: “our teams just got back from a sourcing trip in India with one of our major airline partners, and they couldn’t be happier about the breadth that we’re able to offer, and the opportunity that we’re creating for their employees.”
- Ralph Lauren: “You’ll start to see our broader mitigating actions take shape, country of origin shifts, optimization, merchandising actions. You’ll start to see those all come into play as we move through fiscal 2027”
Additionally, U.S. fashion companies closely monitor geopolitical tensions, including the ongoing conflict in the Middle East; however, the direct impact on sourcing remains limited, with greater concern centered on indirect disruptions to logistics and supply chain operations. For example:
- Nike: “This quarter, we also experienced traffic disruption from the Middle East, and we also are you know taking that into consideration as we’re thinking about where this business stands, and also as we look forward”
- Abercrombie & Fitch: “as it relates to some of the more near term news in the Middle East, you know, we do have some sourcing operations there in the region. Haven’t experienced any disruptions that would have any sort of meaningful impact to the receipt plans here that underpin our outlook. You know, we’ll keep monitoring that and we’ll keep agile with our sourcing base in total.”
- PVH: “It’s important to highlight that significant uncertainty remains around the conflict in the Middle East as well as evolving global trade policies, the broader macroeconomic environment and consumer spend in behavior. Our business in the Middle East, excluding Turkey, is about 1% of our total revenue and solely a wholesale business, so the profit impact is disproportionate at approximately 7%.”
- Victoria’s Secret: “in terms of Middle East, we’re obviously staying very close to the situation and monitoring the developments and how long this may last. There’s two areas right now that we’re paying close attention to. One is just shipments to North America. We are experiencing some delays, but not material that are gonna have a broader impact on the business that way. As you said, we’ve got franchise partners in the Middle East. There are a handful of store closures right now.”
By Sheng Lu
Read the full paper: Lu, S. (2026). U.S. Fashion Companies’ Evolving Sourcing and Business Practices. Global Textile Academy, International Trade Centre (ITC). Geneva, Switzerland