About the interview
When learning about apparel sourcing and trade, our students often notice how much they are affected by trade policies and regulations—from tariffs, and something called “de minimis” to UFLPA. These issues are not only critical for fashion companies but can also be quite technical.
We are fortunate to have Nicole Bivens Collinson, Managing Principal and Practice Leader of International Trade and Government Relations of Sandler, Travis & Rosenberg, P.A. (ST&R), a true expert in trade policy and the legal aspects of trade, join us. In the interview, Nicole clarified key U.S. trade rules and provided valuable insights into their apparel sourcing and trade implications, including:
- What is a tariff, and why is it a big issue for US fashion brands and retailers?
- Why have the so-called IEEPA “reciprocal tariffs” imposed by the Trump administration so far this year raised so many concerns?
- What does the term “transshipment” mean in international trade? And why did this issue emerge in the context of higher tariffs this year?
- What is the “20% US content” rule and its implications for fashion companies?
- What is “tariff engineering”? Is it legal or illegal? How have fashion companies used it to mitigate the tariff impacts, potentially?
- What is de minimis? Why was it created, and then became controversial? Since the “de minimis” rule was officially terminated recently, what impacts could we expect now?
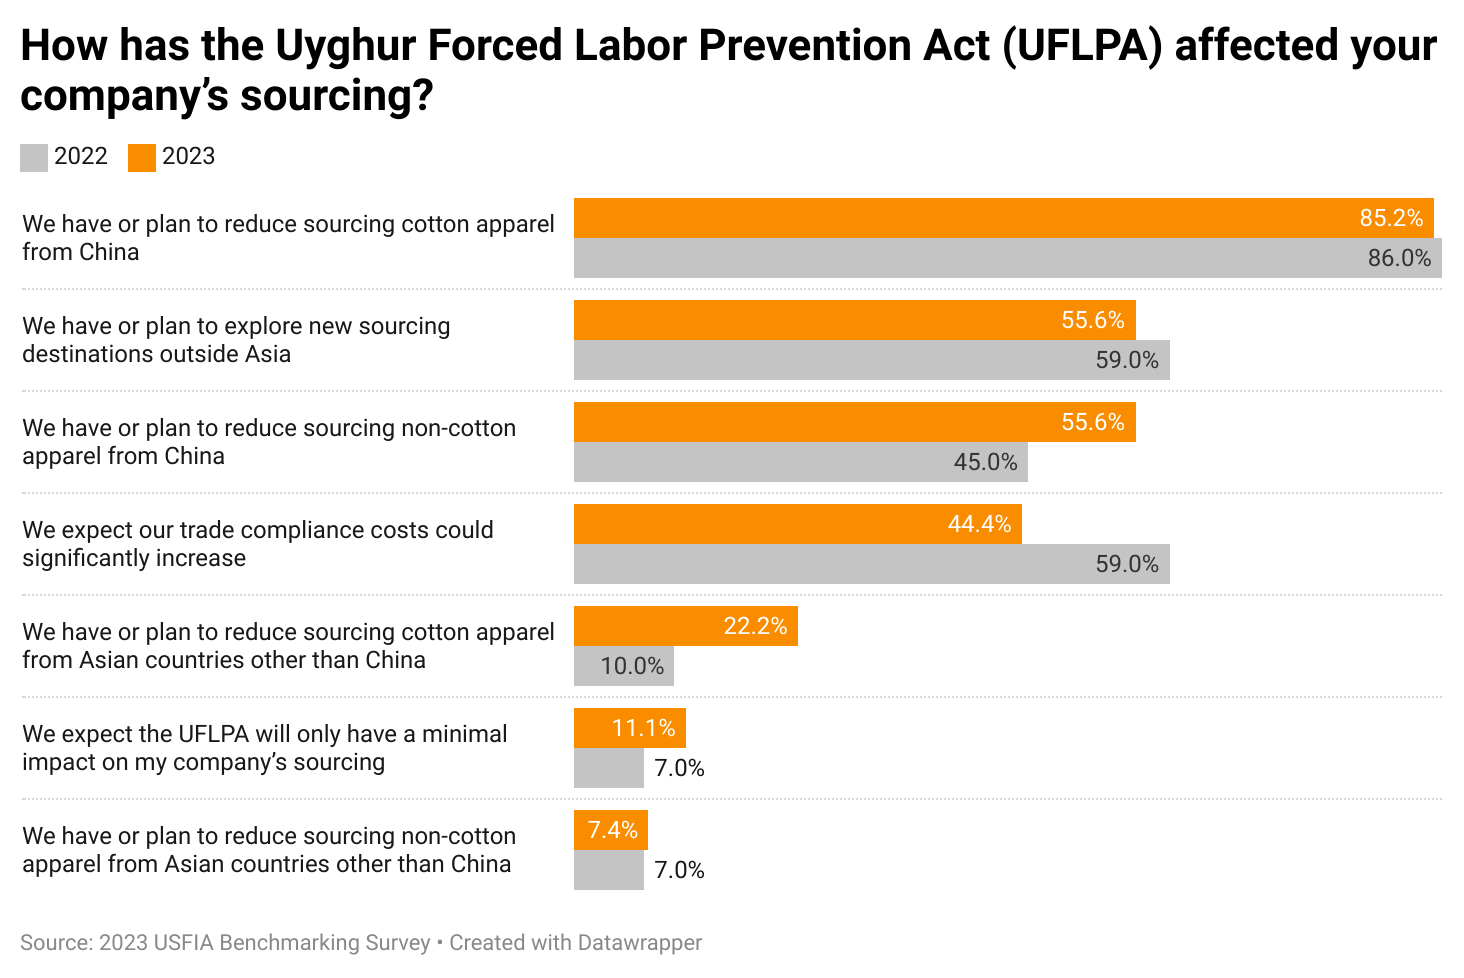
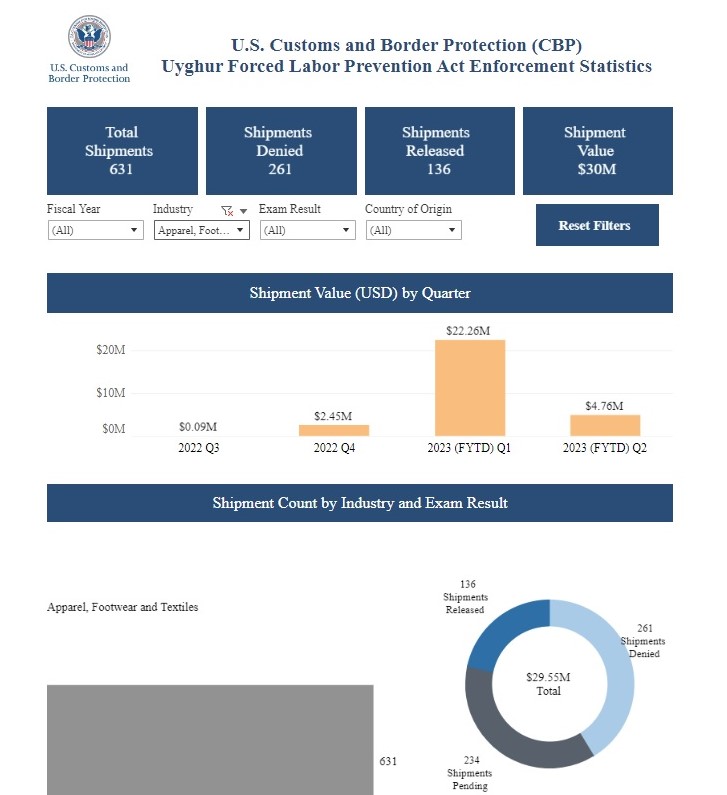
- What is the Uyghur Forced Labor Prevention Act (UFLPA) and what does it aim to do? How has the implementation of the UFLPA affected U.S. fashion companies’ apparel sourcing?
- For fashion students interested in working in trade compliance, trade policy, or the legal aspects of the fashion industry, what steps can they take to get started?
About Nicole Bivens Collinson
Nicole Bivens Collinson is the Managing Principal and Practice Leader of International Trade and Government Relations with Sandler, Travis & Rosenberg, P.A. (ST&R). Nicole is a commentator on trade matters on MSNBC, NPR, and BBC the producer of the Two Minutes in Trade podcast.
Nicole has nearly 40 years of experience in government and public affairs and lobbying. She prepares countries, companies, and associations for negotiations with the United States on free trade agreements, trade and investment agreements, labor disputes, and preferential trade programs.
Prior to joining ST&R, Nicole served as assistant chief negotiator for the Office of the U.S. Trade Representative, responsible for the negotiation of bilateral agreements with Latin America, Eastern Europe, Southeast Asia, the Sub-Continent, and Africa. She also served as a country specialist in the International Trade Administration at the Department of Commerce, where she was responsible for the preparation of negotiations on specific topics between the U.S. and Latin America, Eastern Europe, China, and Hong Kong as well as the administration of complex textile agreements.
Nicole holds a master’s degree in international relations from The George Washington University and a triple bachelor’s degree in political science, European studies, and French from Georgetown College. She also studied at the Université de Caen in France.
Nicole is past chair of the Women in International Trade Charitable Trust, past president of Women in International Trade, an advisory board member of America’s TradePolicy.com, treasurer and board member of the Washington International Trade Association, and a member of the Washington International Trade Association Foundation and Women in Government Relations. She serves on the board of trustees for Georgetown College and is the past executive director for the U.S. Hosiery Manufacturers Coalition, the U.S. Apparel Industry Coalition, and the U.S. Sock Distributors Coalition.
About Katie Yasik (moderator)
Katie Yasik is a master’s student & graduate instructor in Fashion and Apparel Studies (FASH) at the University of Delaware (UD). Katie graduated from UD & FASH with a B.S. in Fashion Design and Product Innovation & Sustainable Apparel minor. Driven by her strong passion for sustainability, she interned with the Worldwide Responsible Accredited Production (WRAP) in Spring 2024.