First Sale rule legally allows importers, such as U.S. fashion brands and retailers, to “use the price paid in the ‘first or earlier sale’ as the basis for the customs value of the goods rather than the price the importer ultimately paid for the goods, in certain circumstances.”
According to a 2009 study by the U.S. International Trade Commission (USITC), based on data input from the Customs and Border Protection (CBP), from September 1, 2008, to August 31, 2009, about 6.07% of imported woven apparel (HS Chapter 62) and 5.48% of imported knitted apparel (HS Chapter 61) used the “first-sale” rule, compared with the average of 2.4% for all U.S. goods imports over the same period. The report also noted that “Only the textiles, apparel, and footwear sector had both above-average First Sale use and an above-average tariff rate.”
While there have been no official updated statistics, media reports indicate that fashion companies, including EU luxury brands, were interested in leveraging the “First sale” rule as part of their strategies to legally mitigate the impacts of tariff hikes during President Trump’s second term.
However, in February 2026, Bill Cassidy (R-LA) and Sheldon Whitehouse (D-RI) introduced a bill called the Last Sale Valuation Act of 2026. The proposal would require customs duties to be calculated based on the last sale before export to the United States, effectively eliminating the current First Sale rule.
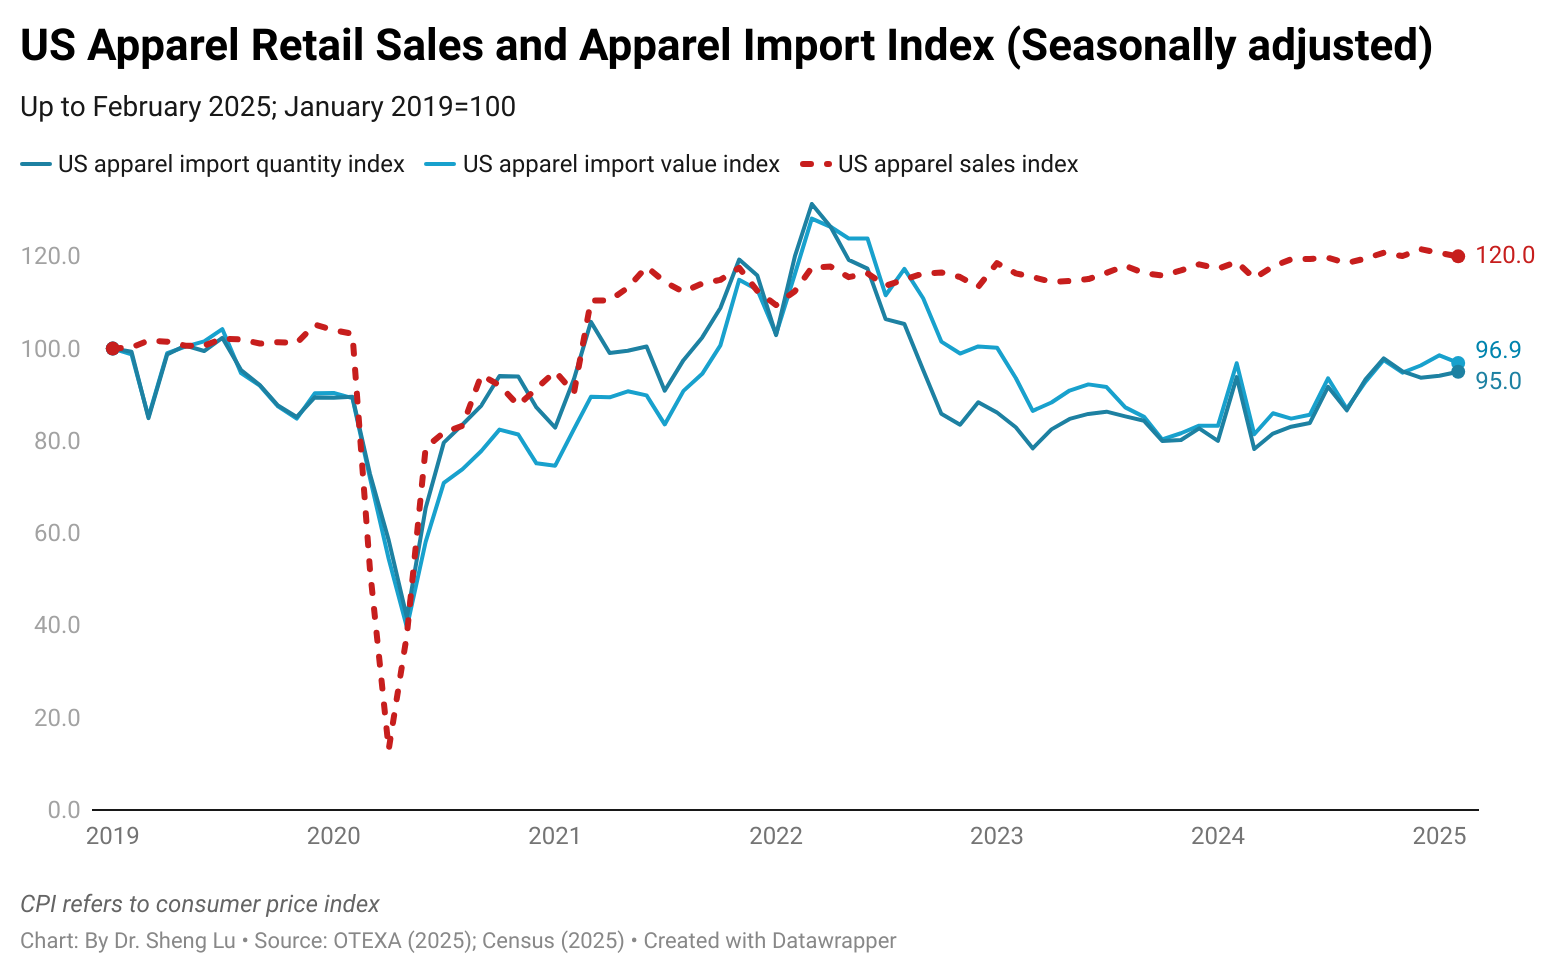
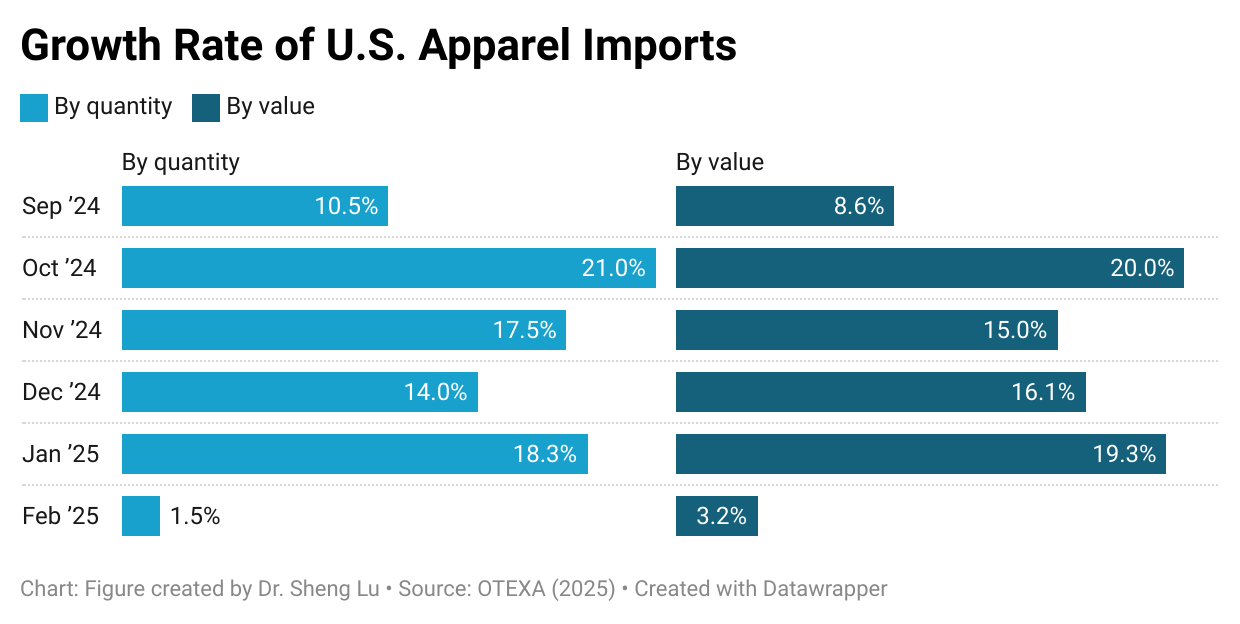
First, the growth of U.S. apparel imports significantly slowed as fashion companies shifted from eagerly piling up stock to the wait-and-see mode. Specifically, in February 2025, U.S. apparel imports moderately went up 3.2% in value and 1.5% in quantity, much lower than the 18-19% increase seen in late 2024 and January 2025. The much-slowed growth confirmed that the earlier U.S. apparel import surge was largely driven by fashion companies’ worries about the upcoming tariff hikes rather than an actual increase in consumer demand.
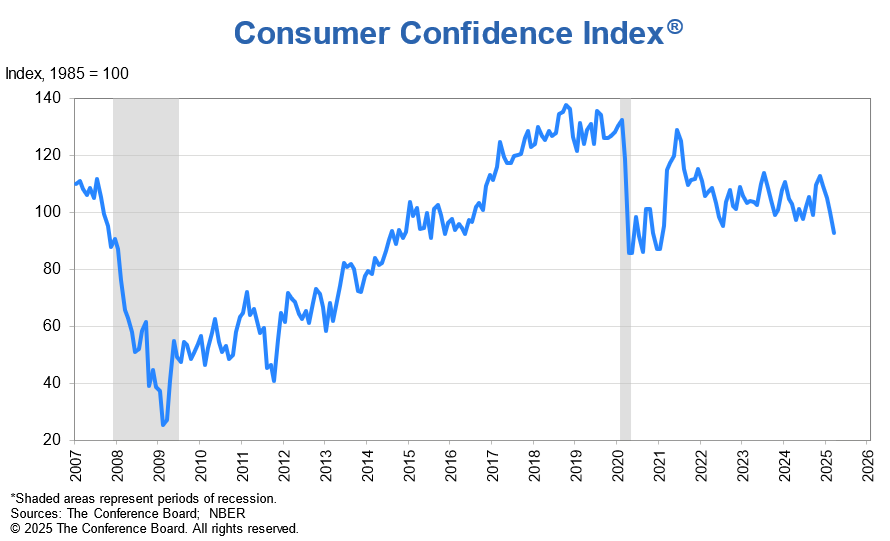
Adding to the concern, U.S. consumer confidence fell sharply, which could lead to a steep drop in U.S. apparel imports ahead. For example, the Consumer Confidence Index dropped to a two-year low of 92.9 in March 2025, down from 100.1 the previous month (1985=100). Similarly, the Expectations Index—which measures consumers’ short-term outlook for income, business, and labor market conditions—plunged to 65.2, marking its lowest level in 12 years. With the announcement of reciprocal tariffs and the growing likelihood of an economic recession, U.S. consumer demand for clothing may decline significantly, potentially leading to the cancellation of many sourcing orders.
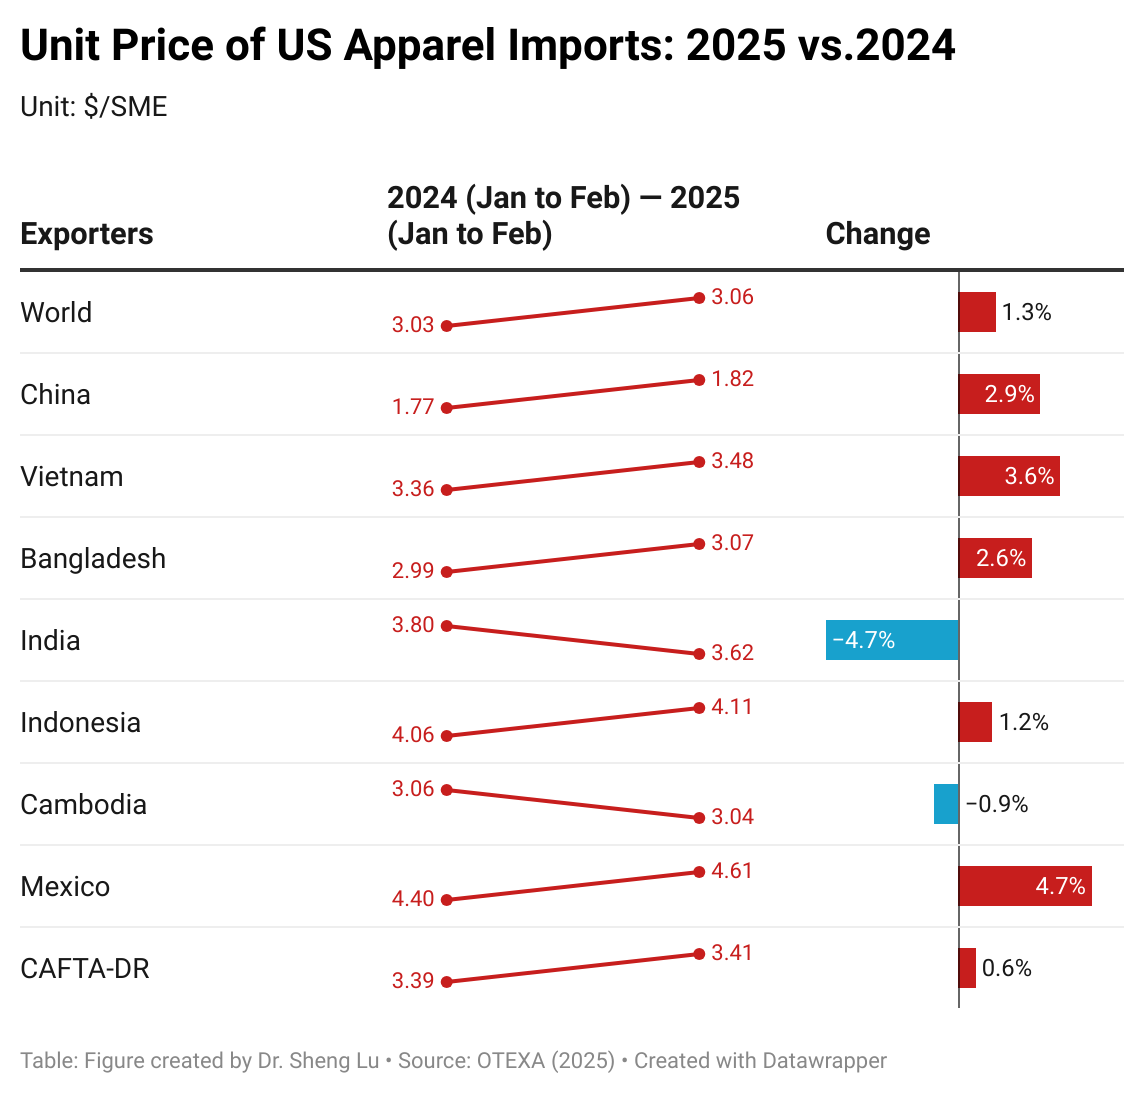
Second, apparel imports have become more expensive. Measured in dollars per square meters equivalent (SME), the unit price of U.S. apparel imports averaged $3.06/SME in the first two months of 2025, up from $3.03/SME a year ago (or a 1.3% increase). The unit price of U.S. apparel imports from many leading Asian countries rose at a notably higher rate, including China (up 2.9%), Vietnam (up 3.6%), and Bangladesh (up 2.6%), as well as those from Mexico (up 4.7%) and CAFTA-DR (up 0.6%). This result reflected the growing pressure of sourcing and production costs facing U.S. fashion companies and their suppliers, driven by rising labor costs and raw material prices among other factors. Indeed, if Trump’s reciprocal tariffs ultimately take effect, import prices could increase even more significantly.
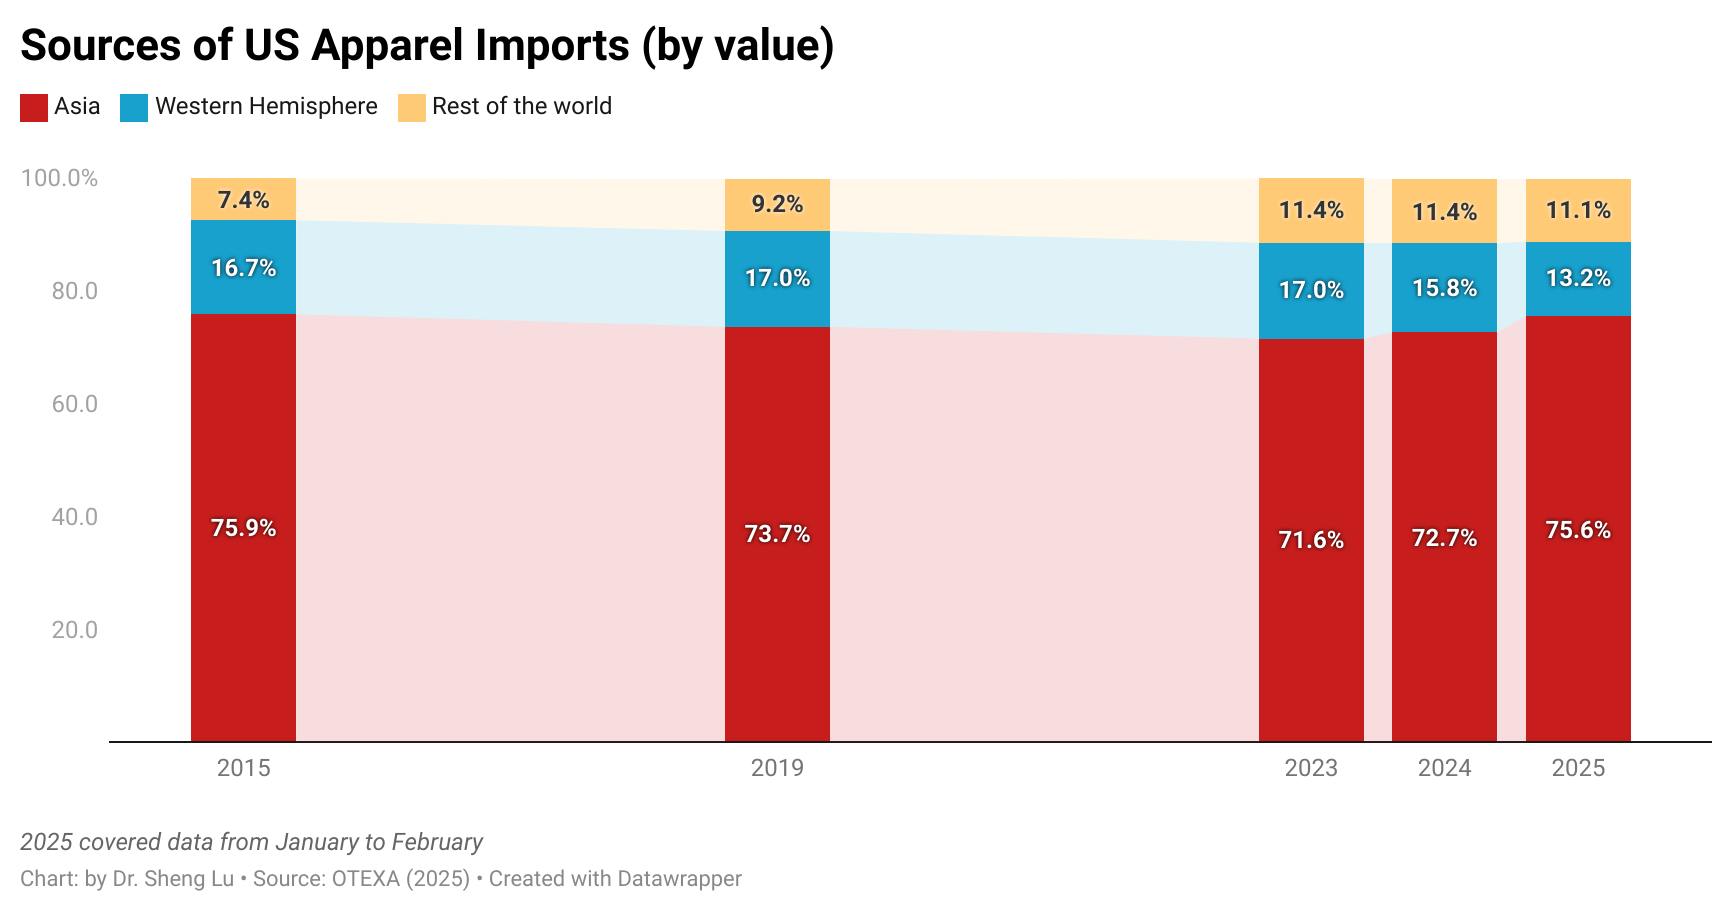
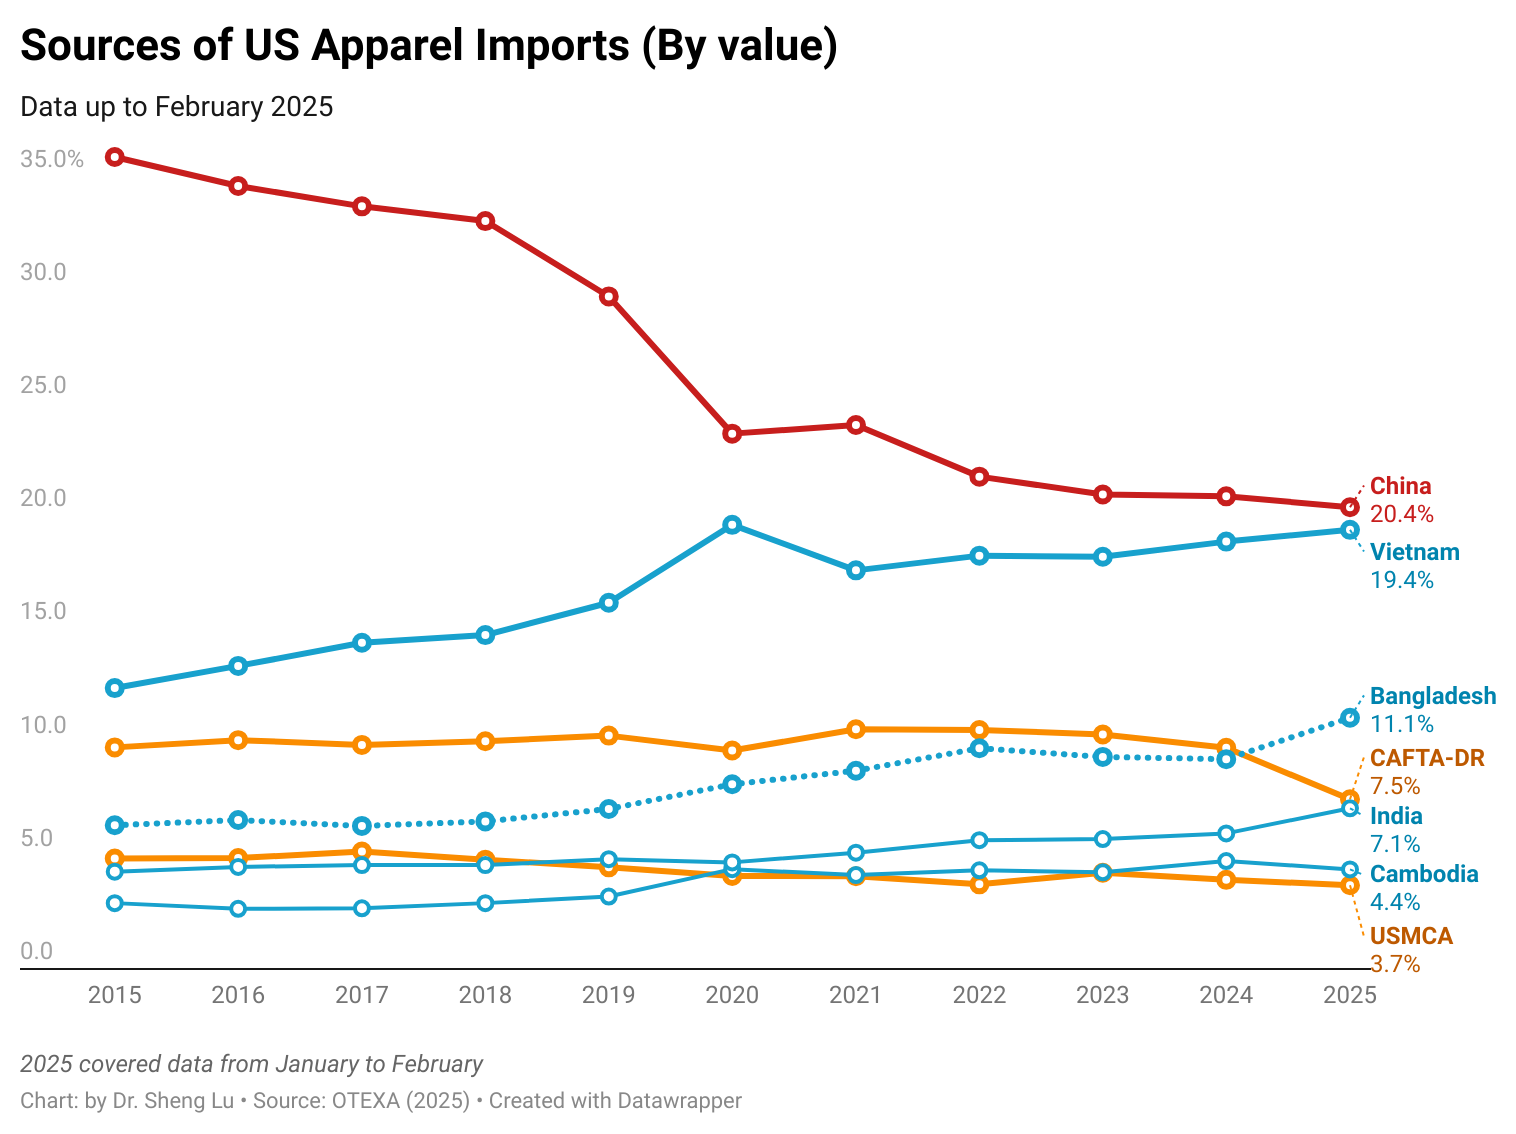
Third, U.S. fashion companies’ sourcing diversification efforts appeared to slow amid rising uncertainty. In February 2025, Asian countries collectively accounted for 71.5% of the total value of U.S. apparel imports—unchanged from a year earlier. Similarly, in the first two months of 2025, the top five suppliers (China, Vietnam, Bangladesh, Cambodia, and India) made up 63.7% of total apparel imports by value, up from 59.7% during the same period in 2024. Even China’s market share remained largely stable at 18.4% in value and 32% in quantity, compared to a year ago.
These figures suggest that U.S. fashion companies somehow have become more hesitant to adjust their sourcing base in response to the universal tariffs imposed by the Trump administration, which target nearly all U.S. trading partners. As a result, U.S. fashion companies may find the sourcing diversification strategies no longer as effective as in the past in effectively mitigating their sourcing risks.
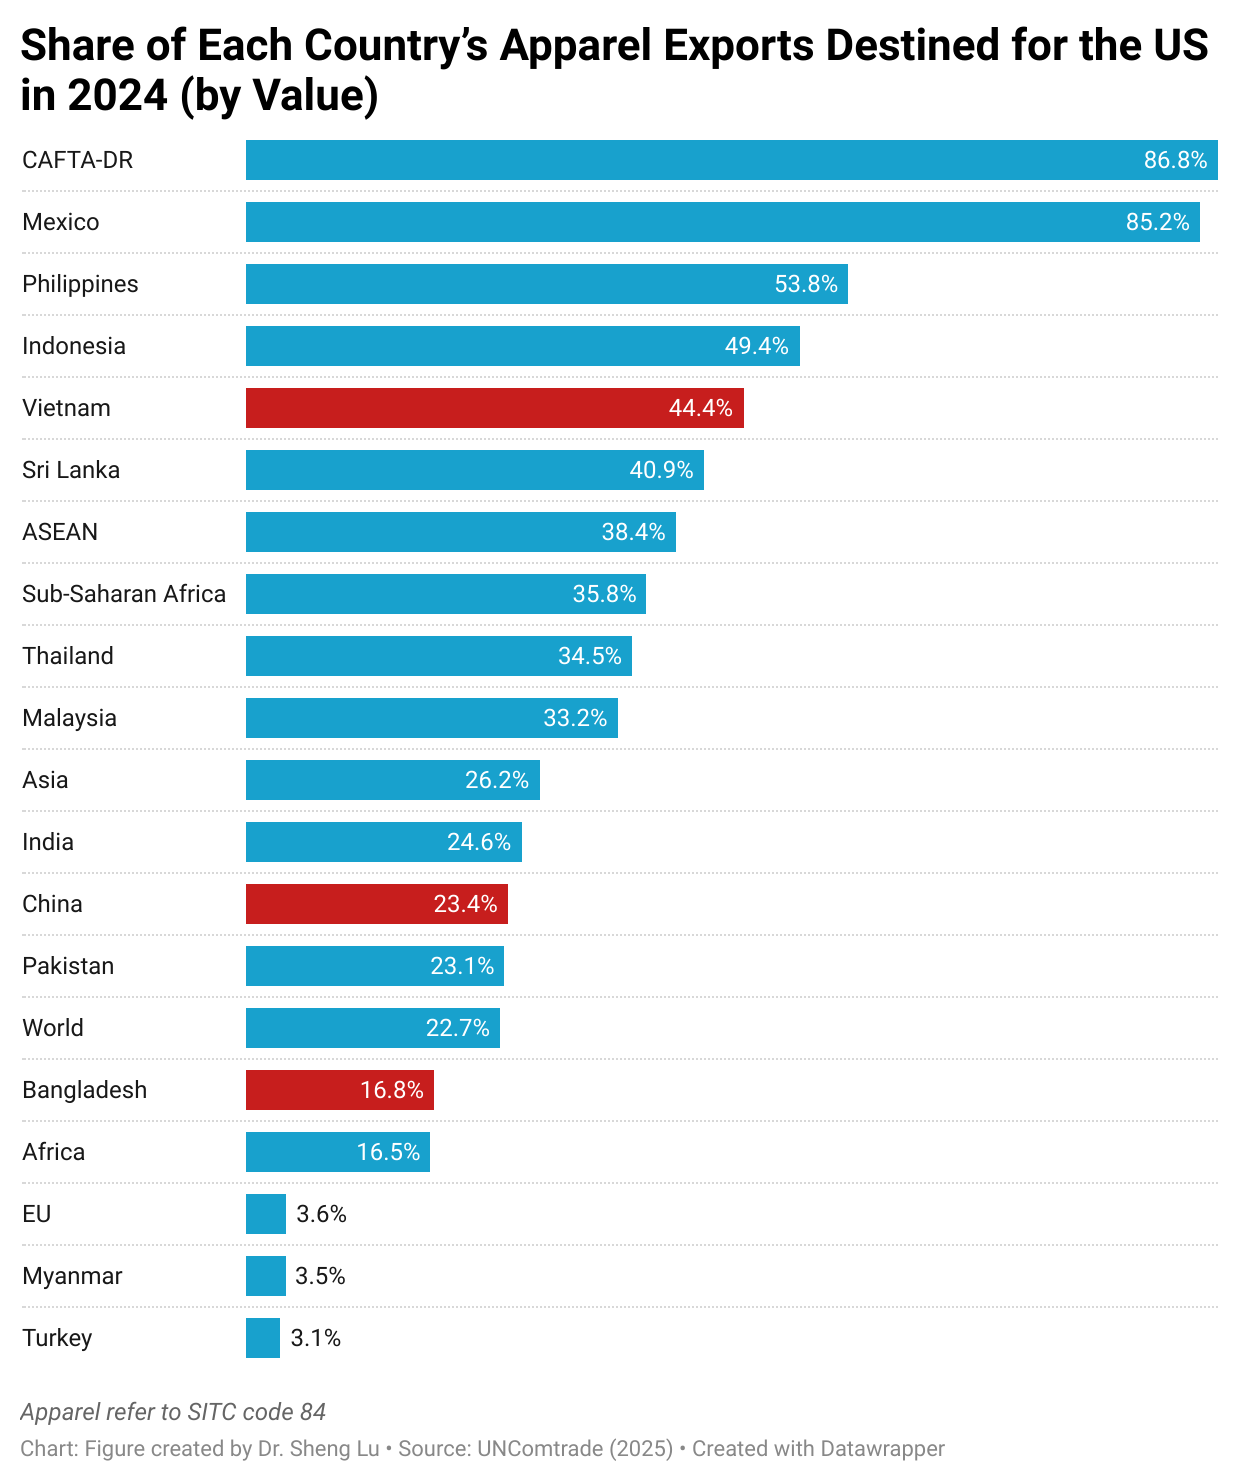
Meanwhile, data from the United Nations (UN Comtrade) show that Asian countries’ dependence on the U.S. market for apparel exports varied. In 2024, Vietnam, Sri Lanka, and ASEAN members exported about 40% of their apparel to the U.S., whereas the U.S. accounted for only about 20% of China’s and Bangladesh’s total apparel exports to the world. At the same time, the U.S. remained the single largest export market for Mexico and CAFTA-DR members, due to the integrated Western Hemisphere textile and apparel supply chain.
Fourth, no evidence shows that the current trading environment has benefited from near-shoring from the Western Hemisphere. On the contrary, measured in quantity, in February 2025, only 7.6% of U.S. apparel imports came from CAFTA-DR members, a notable drop from 9.6% a year ago. Similarly, Mexico accounted for 2.3% of U.S. apparel imports in February 2025, also lower than 2.4% a year earlier.
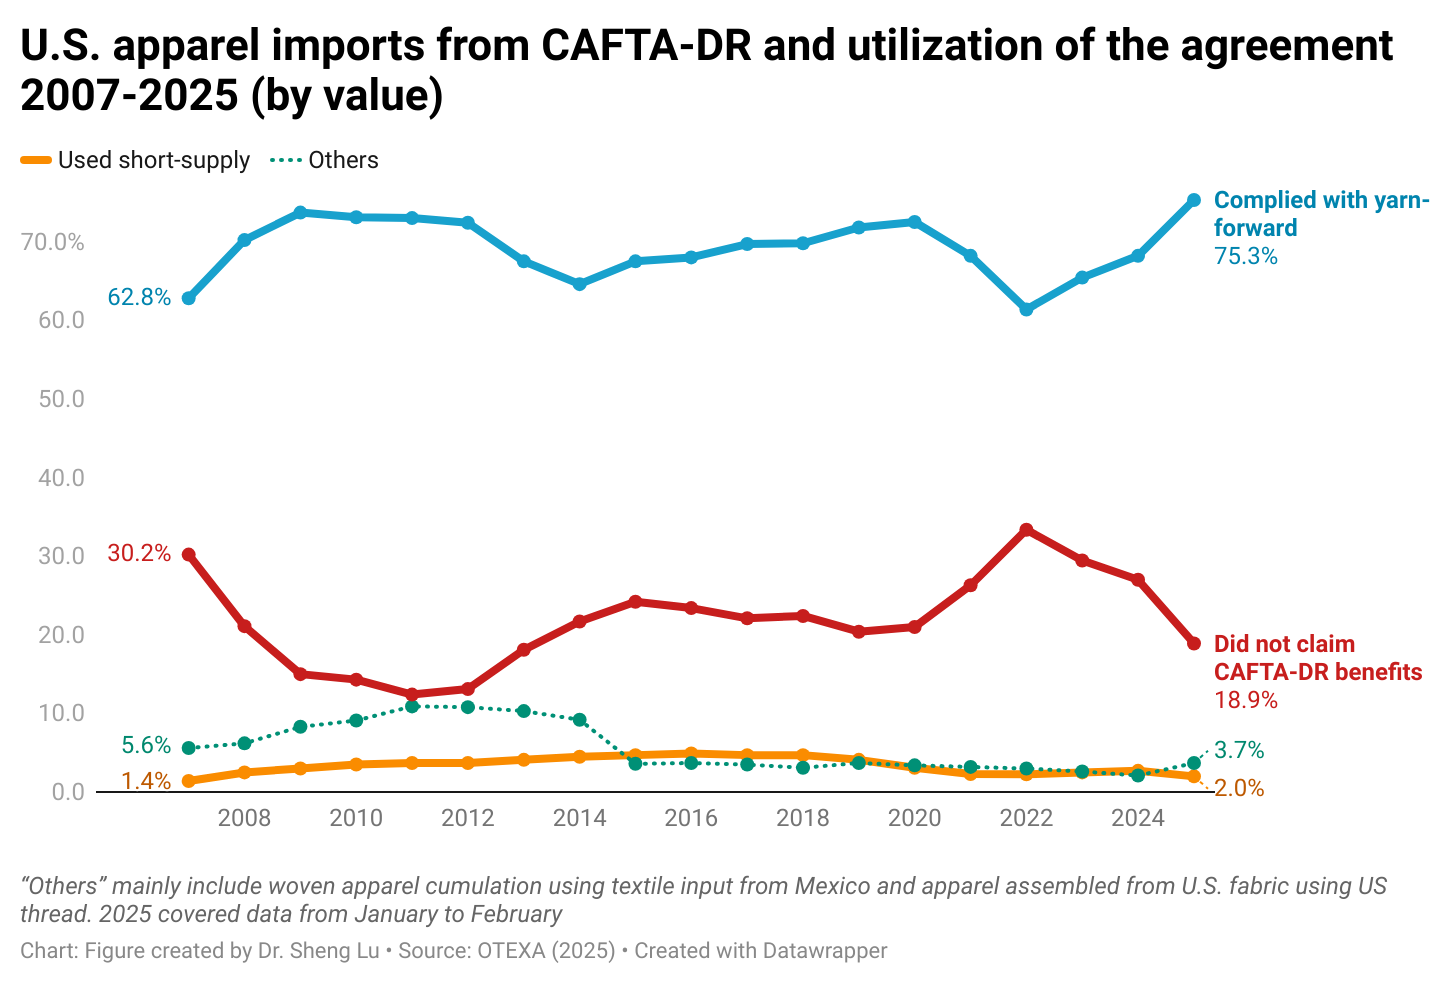
As a silver lining, the utilization rate of CAFTA-DR reached 81.1% in 2025 (January to February), much higher than 73.8% over the same period in 2024. About 75.3% of U.S. apparel imports from CAFTA-DR in 2025 (January to February) complied with the yarn-forward rules of origin compared to 67.4% a year ago. However, the use of “short-supply” remained low–only about 2.0% in 2025 so far.
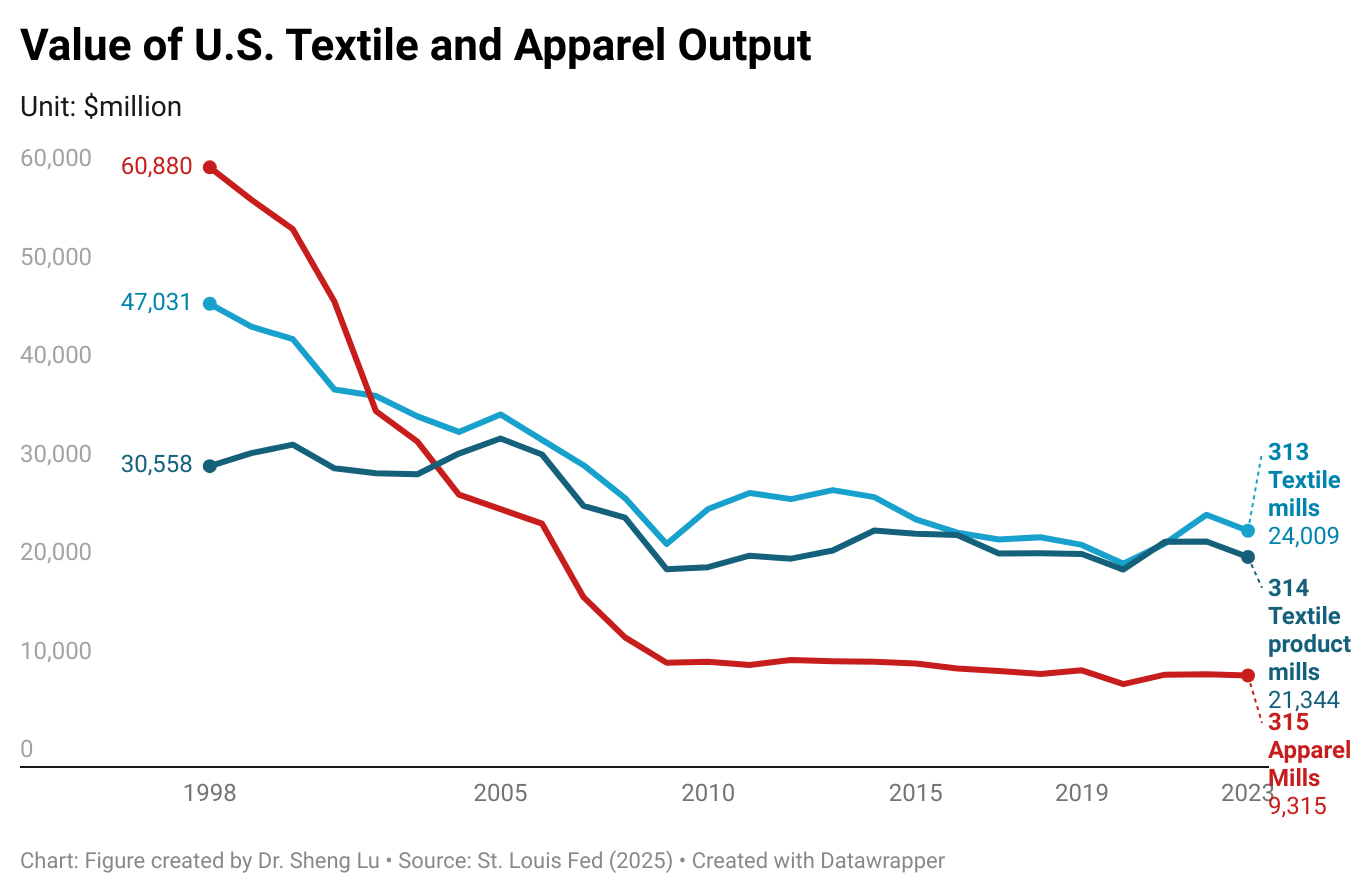
Textile and apparel manufacturing in the U.S. has significantly decreased over the past decades due to factors such as automation, import competition, and the changing U.S. comparative advantages for related products. However, thanks to companies’ ongoing restructuring strategies and their strategic use of globalization, the U.S. textile and apparel manufacturing sector has stayed relatively stable in recent years. For example, the value of U.S. yarns and fabrics manufacturing (NAICS 313) totaled $24 billion in 2023 (the latest data available), up from $23.3 billion in 2018 (or up 2.8%). Over the same period, U.S. made-up textiles (NAICS 314) and apparel production (NAICS 315) moderately declined by only 1.8% and 1.6%.
More importantly, the U.S. textile and apparel manufacturing sector is evolving. Several important trends are worth watching:
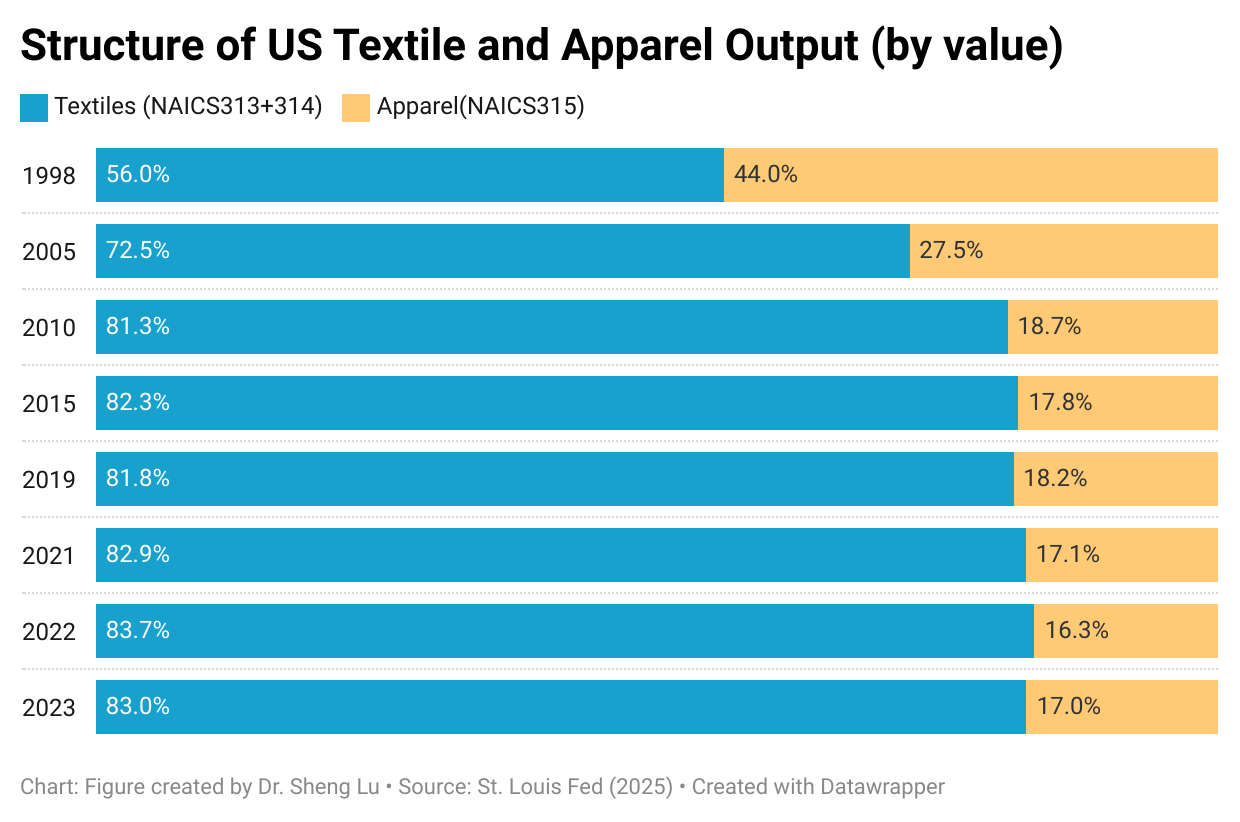
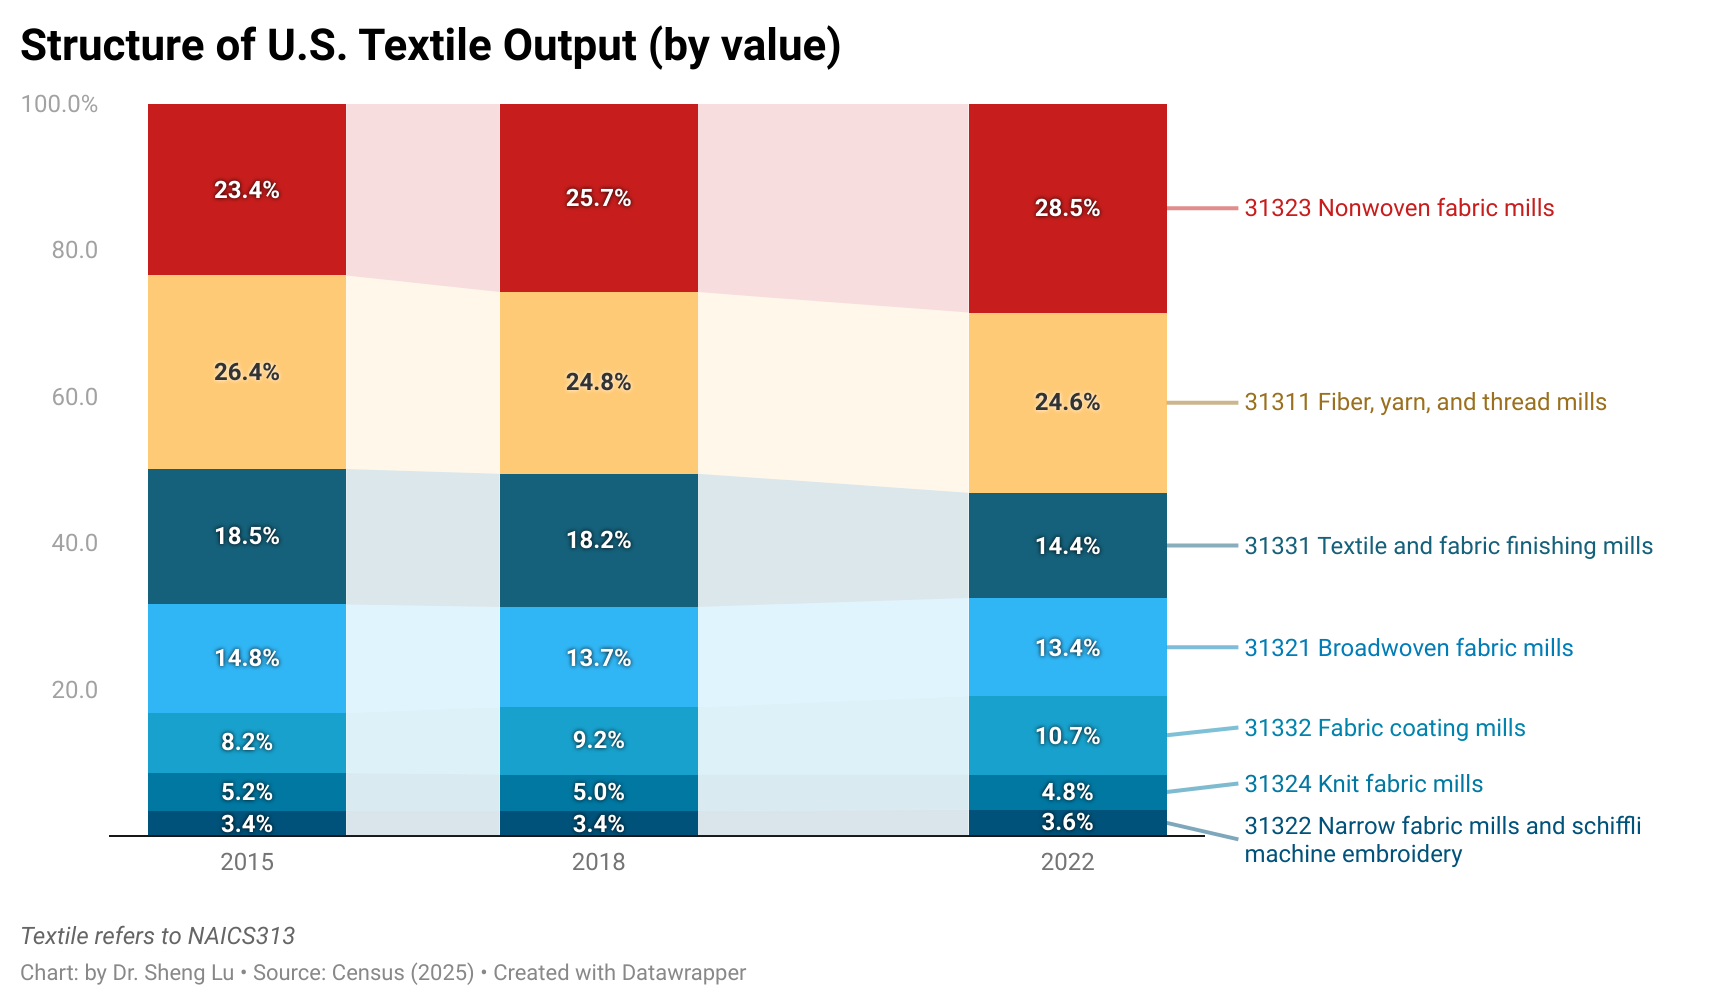
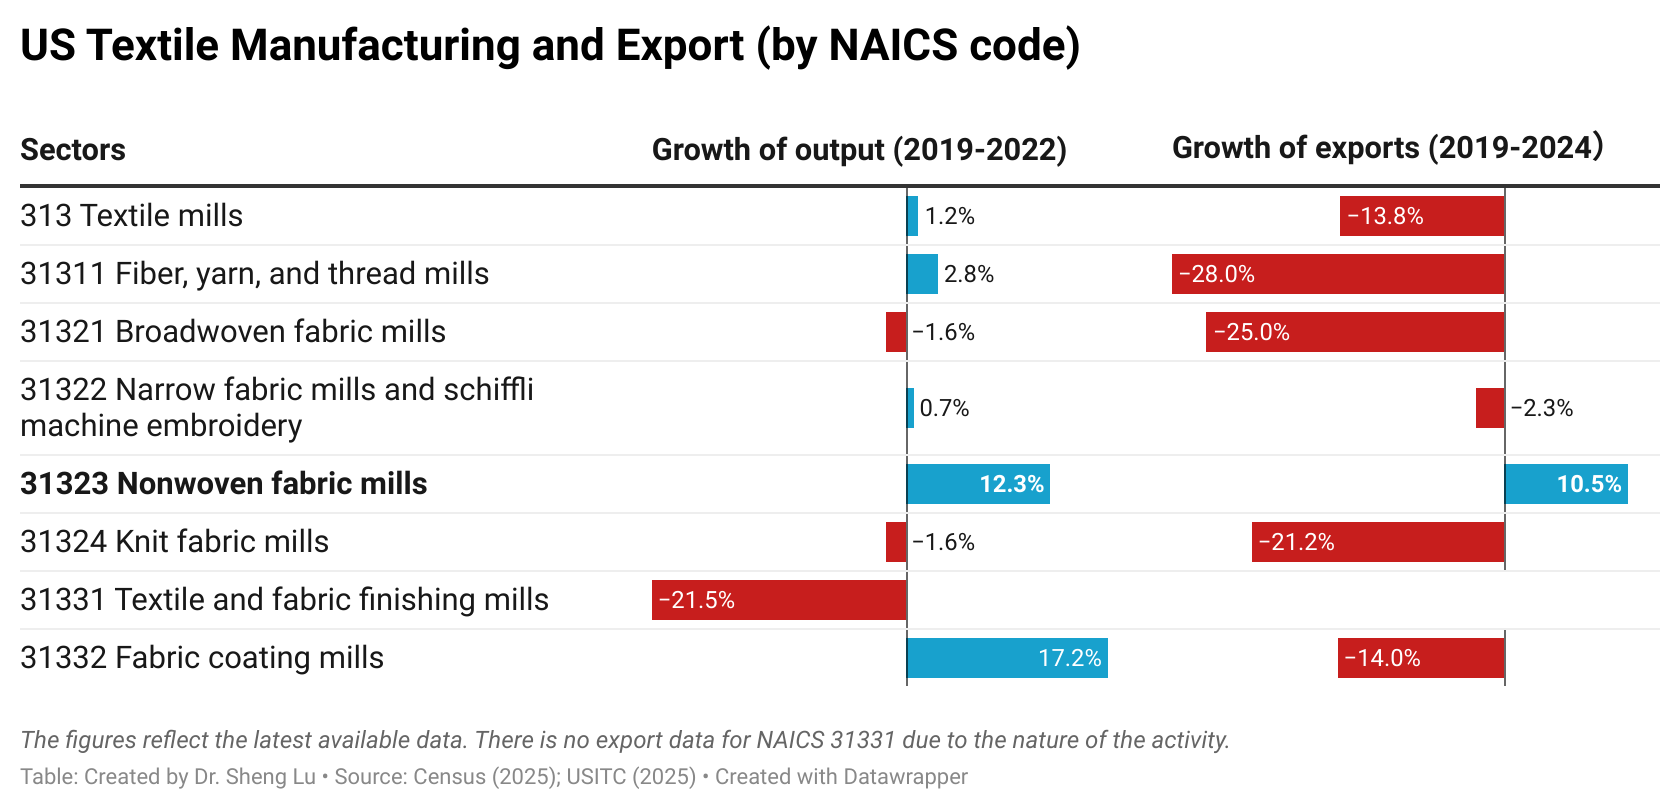
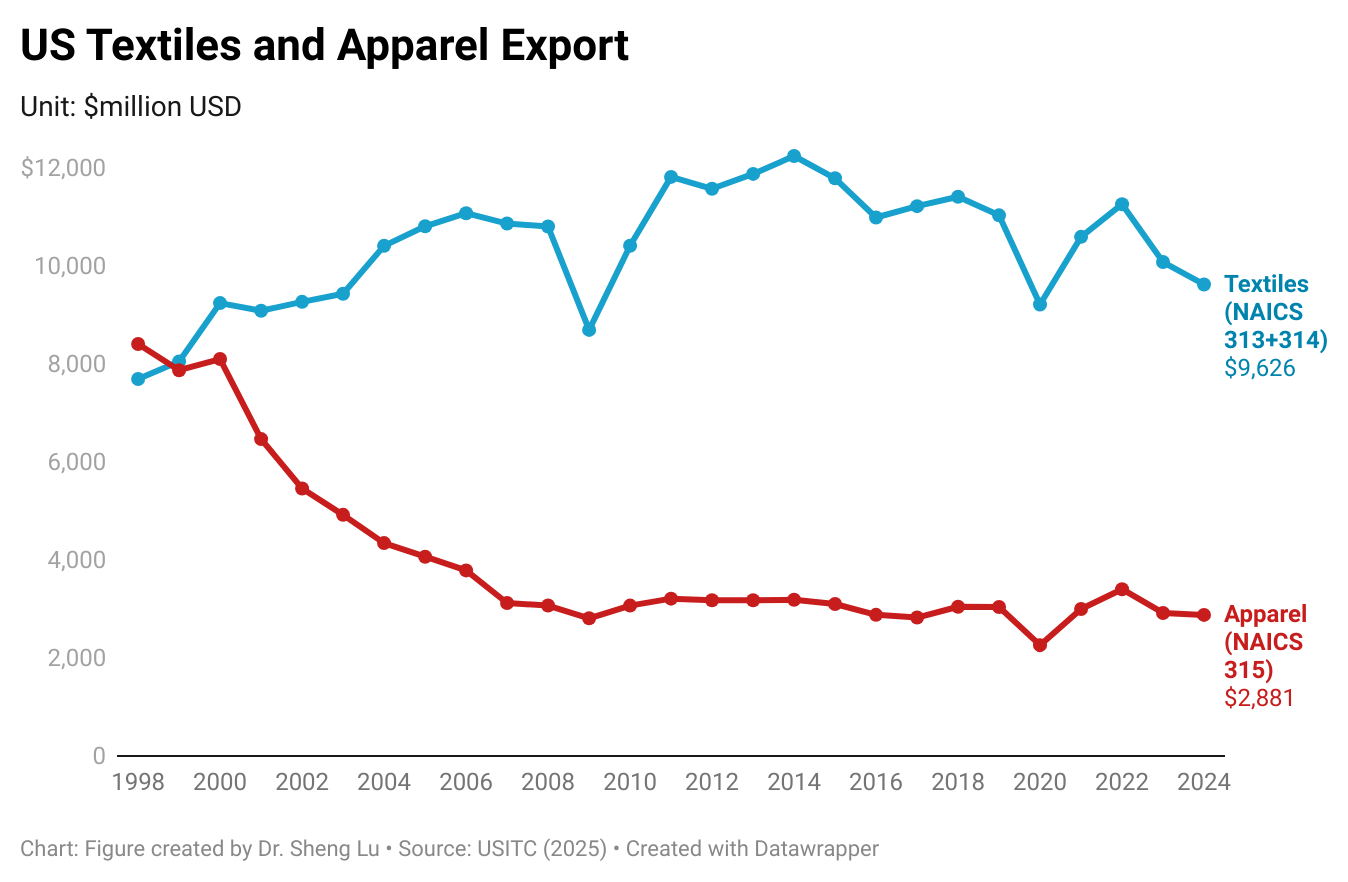
First, “Made in the USA” increasingly focuses on textile products, particularly high-tech industrial textiles that are not intended for apparel manufacturing purposes. Specifically, textile products (NAICS 313+314) accounted for over 83% of the total output of the U.S. textile and apparel industry as of 2023, much higher than only 56% in 1998 (U.S. Census, 2025). Textiles and apparel “Made in the USA” are growing particularly fast in some product categories that are high-tech driven, such as medical textiles, protective clothing, specialty and industrial fabrics, and non-woven. These products are also becoming the new growth engine of U.S. textile exports. Notably, between 2019 and 2022, the value of U.S. “nonwoven fabric” (NAICS 31323) production increased by 12.32%, much higher than the 1.15% average growth of the textile industry (NAICS 313). Similarly, while U.S. textile exports decreased by 13.75% between 2019 and 2024, “nonwoven fabric” exports surged by 10.48%--including nearly 40% that went to market outside the Western Hemisphere (U.S. International Trade Commission, 2025).
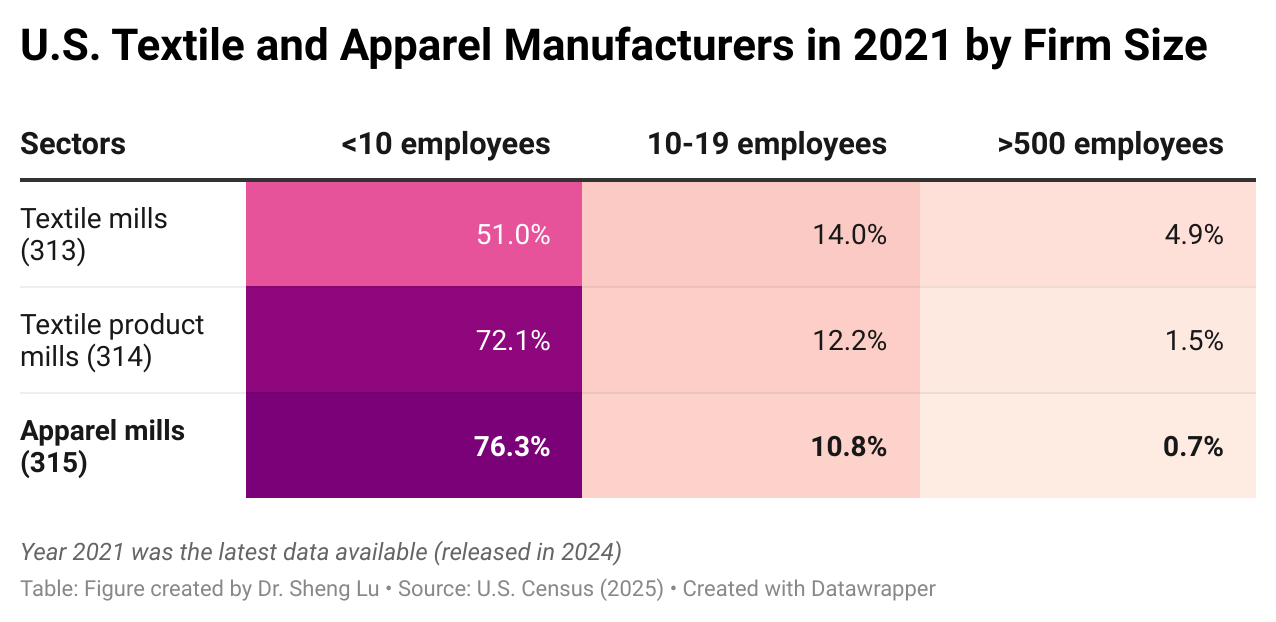
Second, U.S. apparel manufacturers today are primarily micro-factories, and they supplement but are not in a position to replace imports. As of 2021 (the latest data available), over 76% of U.S.-based apparel mills (NAICS 315) had fewer than 10 employees, while only 0.7% had more than 500 employees. In comparison, contracted garment factories of U.S. fashion companies in Asia, particularly in developing countries like Bangladesh, typically employ over 1,000 or even 5,000 workers.
Instead of making garments in large volumes, most U.S.-based apparel factories are used to produce samples or prototypes for brands and retailers. In other words, replacing global sourcing with domestic production is not a realistic option for U.S. fashion brands and retailers in the 21st-century global economy. Nor are U.S. fashion companies showing interest in shifting their business strategies from focusing on “designing + managing supply chain+ marketing” back to manufacturing.
Meanwhile, due to mergers and acquisitions (M&A) and to leverage economies of scale, approximately 5% of U.S. textile mills (NAICS313) had more than 500 employees as of 2021–this is a significant number, considering that textile manufacturing is a highly capital-intensive process.
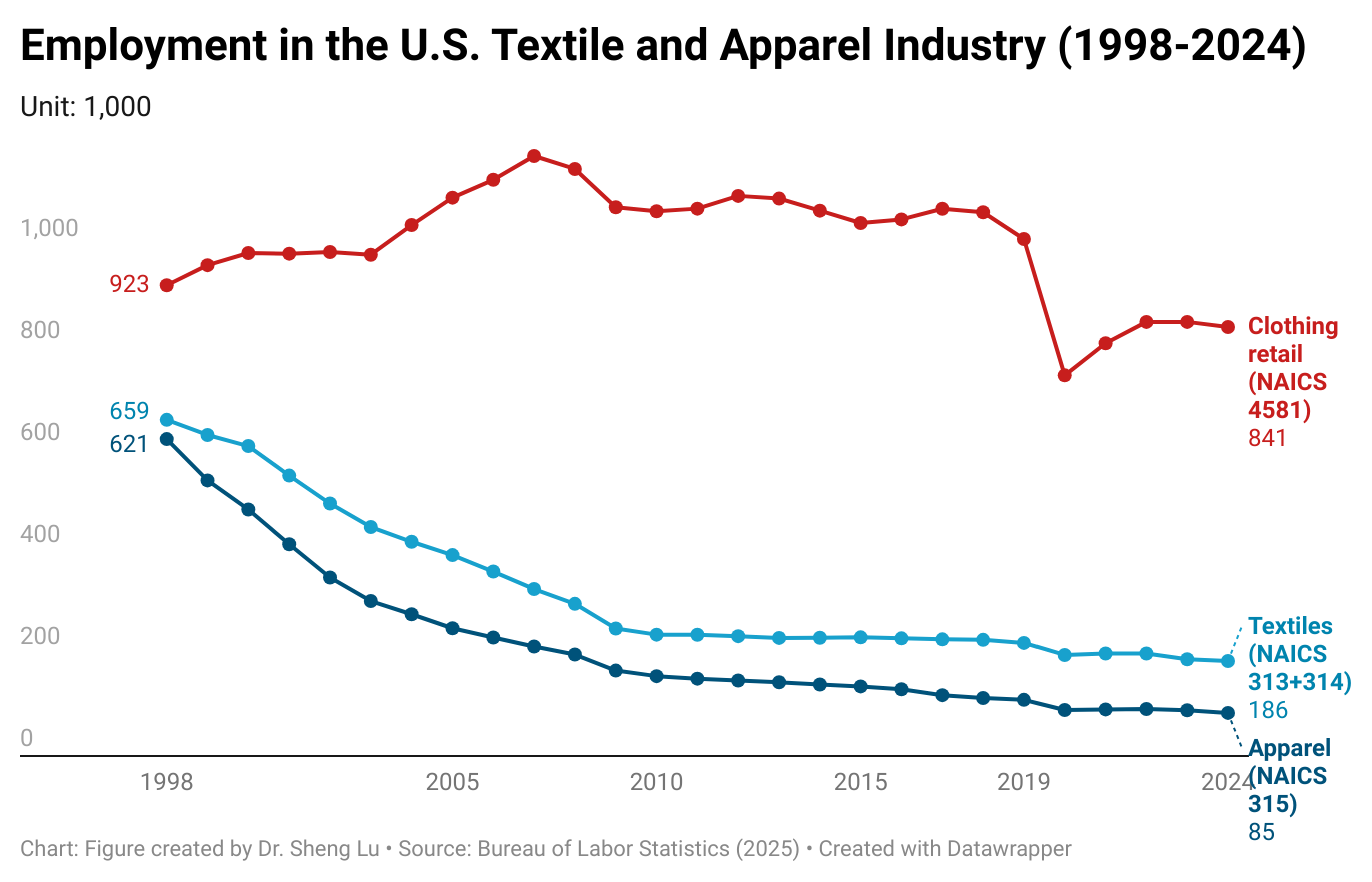
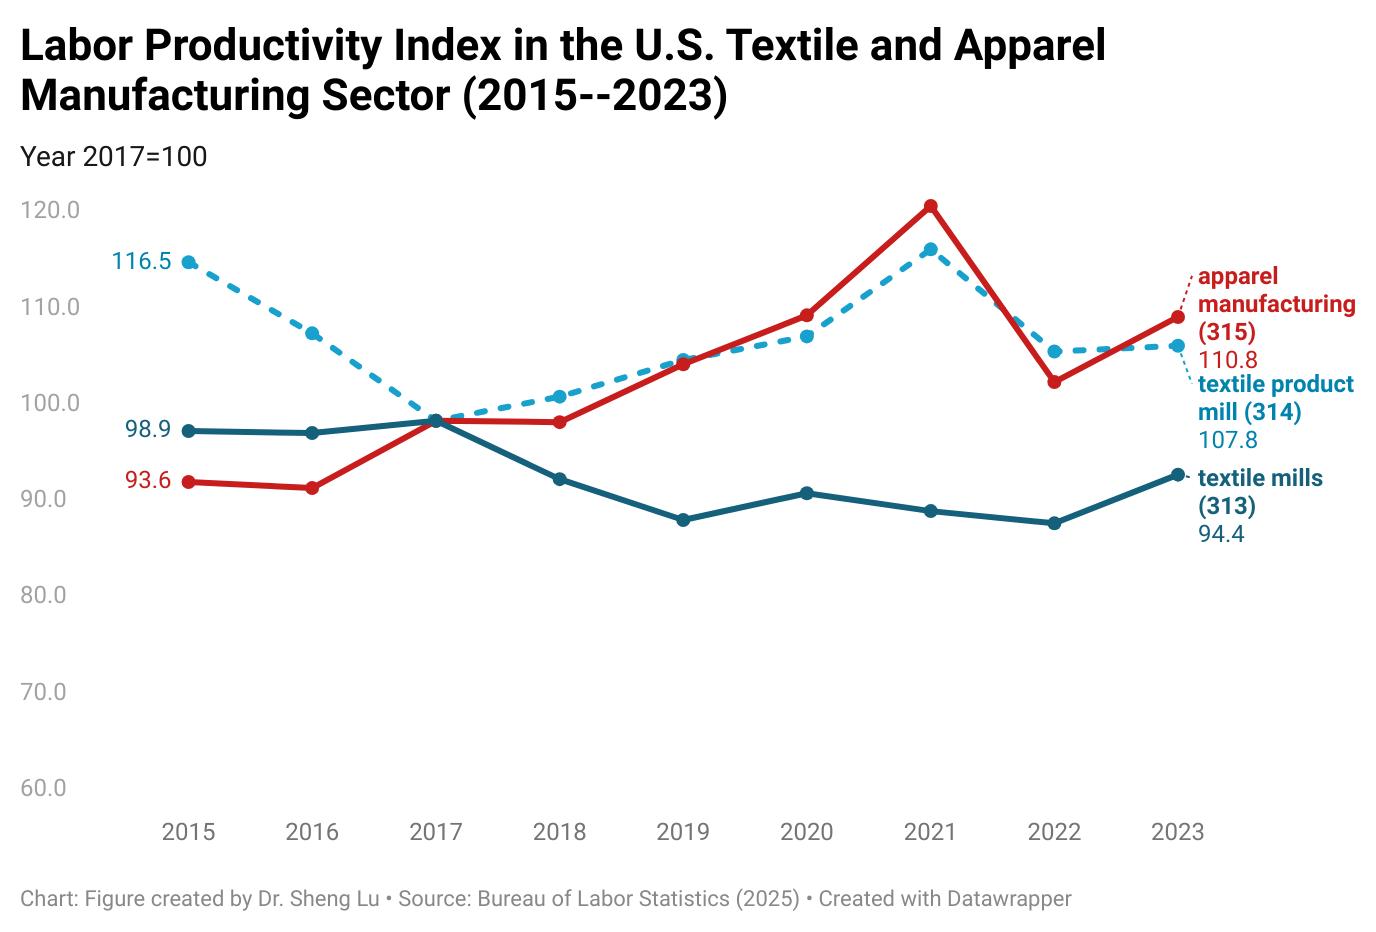
Third, employment in the U.S. textile and apparel manufacturing sector continued to decline, with improved productivity and technology being critical drivers. As of 2024, employment in the U.S. textile and apparel manufacturing sector (NAICS 313, 314, and 315) totaled 270,700, a decrease of 18.4% from 33,190 in 2019. Notably, U.S. textile and apparel workers had become more productive overall—the labor productivity index of U.S. textile mills (NAICS 313) increased from 89.7 in 2019 to 94.4 in 2023, and the index of U.S. apparel mills (NAICS 315) increased from 105.8 to 110.78 over the same period.
On the other hand, clothing retailers (NAICS 4481) accounted for over 75.7% of employment in the U.S. textile and apparel sector in 2024.
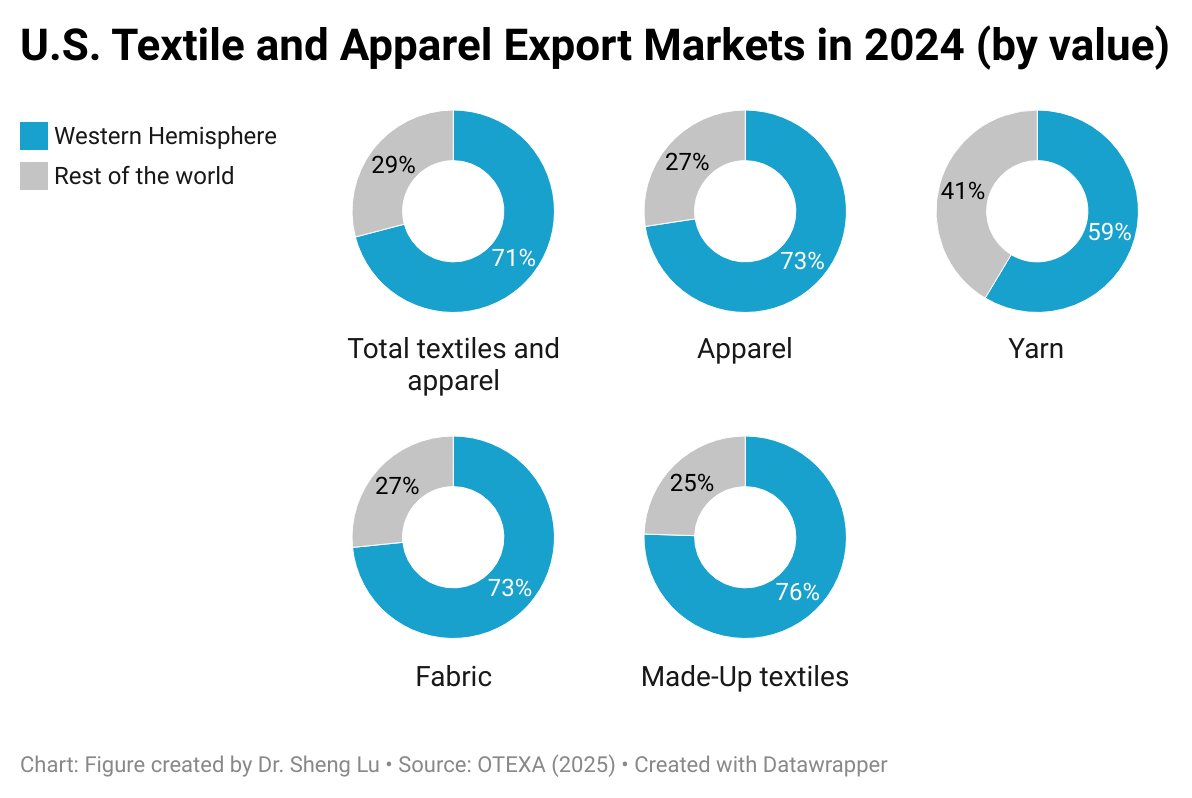
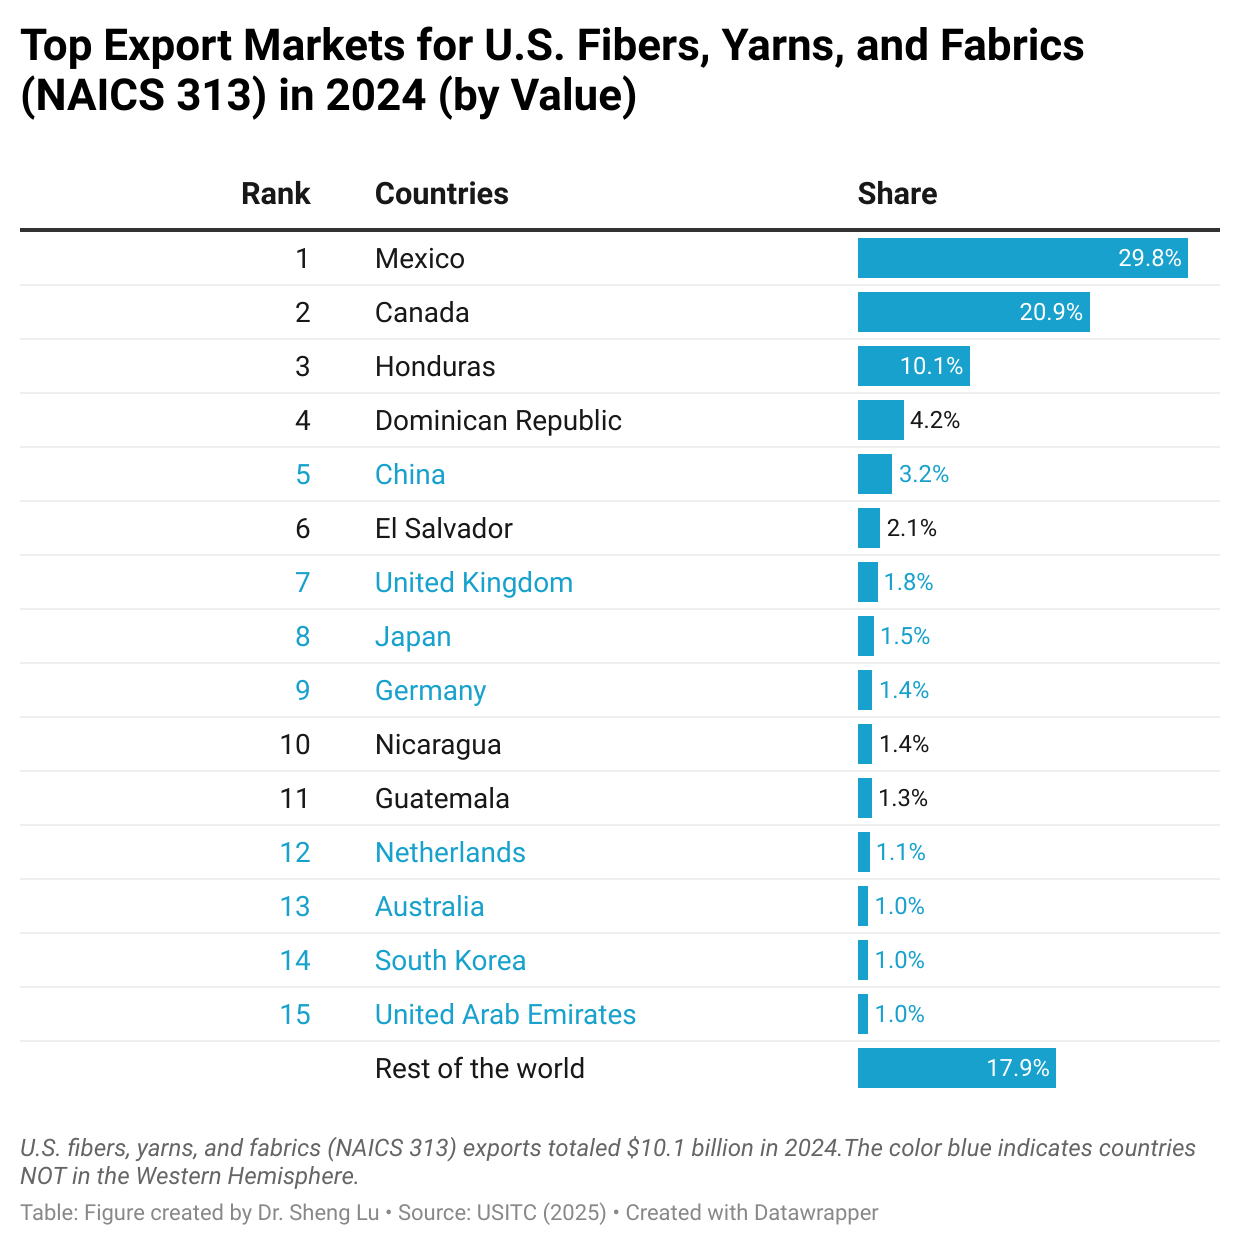
Fourth, international trade, BOTH import and export, supports textiles and apparel “Made in the USA.” On the one hand, U.S. textile and apparel exports exceeded $12.5 billion in 2024, accounting for more than 30% of domestic production as of 2023 (NAICS 313, 314 and 315). Thanks to regional free trade agreements, particularly the U.S.-Mexico-Canada Agreement (USMCA) and the Dominican Republic-Central America Free Trade Agreement (CAFTA-DR), the Western Hemisphere stably accounted for over 70% of U.S. textile and apparel exports over the past decades. However, for specific products such as industrial textiles, markets in the rest of the world, especially Asia and Europe, also become increasingly important. Thus, lowering trade barriers for U.S. products in strategically significant export markets serves the interest of the U.S. textile and apparel industry.
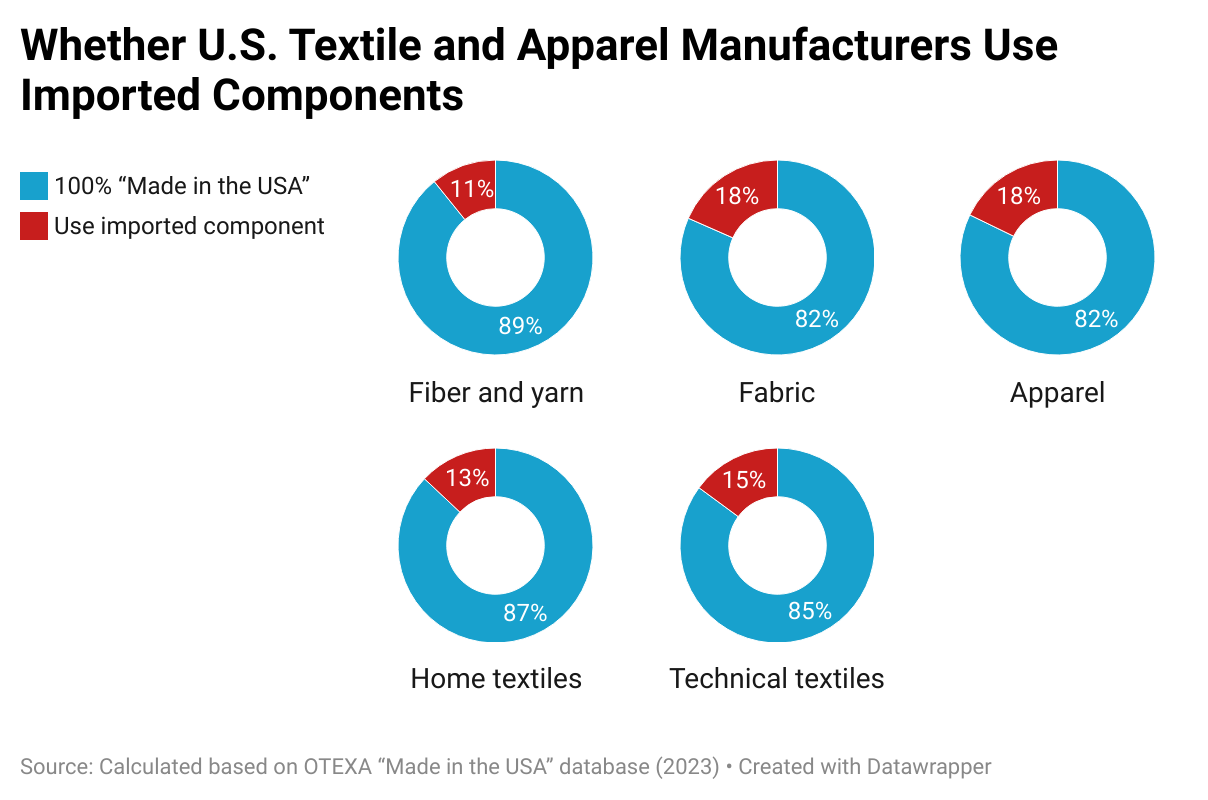
On the other hand, imports support textiles and apparel “Made in the USA” as well. A 2023 study found that among the manufacturers in the “Made in the USA” database managed by the U.S. Department of Commerce Office of Textile and Apparel, nearly 20% of apparel and fabric mills explicitly say they utilized imported components. Partially, smaller U.S. textile and apparel manufacturers appear to be more likely to use imported components–whereas 20% of manufacturers with less than 50 employees used imported input, only 10.2% of those with 50-499 employees and 7.7% with 500 or more employees did so. The results indicate the necessity of supporting small and medium-sized (SME) U.S. textile and apparel manufacturers to more easily access their needed textile materials by lowering trade barriers like tariffs.
Apparel products are often subject to high tariffs for various reasons. In developed countries such as the United States, apparel has long been considered an “import-sensitive” sector, with relatively high tariff rates imposed primarily to “protect” specific domestic interest groups with political influences.
However, as importers, not exporters, pay the tariffs, heavy import duties have been a significant concern for US fashion companies for decades. According to data from the US International Trade Commission (USITC), in 2024, apparel (HS chapters 61 and 62) accounted for about 2.5 percent of total US imports but contributed approximately 15.6 percent of total tariff duties. Likewise, US fashion companies paid $11.9 billion in tariffs on apparel imports in 2024, an increase from $11.6 billion in 2023. The average applied tariff rate for apparel items reached 14.6% in 2024, a notable increase from 13.7% before the imposition of Section 301 tariffs on Chinese products. Additionally, due to retail markups, every $1 in tariffs could result in a $1.50 to $2 increase in the final retail price.
Meanwhile, developing countries, especially those least developed, also often impose high tariffs on apparel—either to protect their nascent domestic industries from import competition or to generate government revenues. For example, in Africa, the apparel import tariff rate commonly exceeds 35% as of 2023 (the latest data available).
In February 2025, President Trump announced the imposition of a so-called “reciprocal tariff,” aiming to “match” the tariff rates that other countries impose on US exports, thereby promoting “fairer trade practices.” However, the details of the “reciprocal tariff” idea remain highly uncertain.
In theory, if strict “tariff matching” is required on a product-by-product basis, US apparel imports from most leading sourcing destinations—particularly those in Asia without a free trade agreement with the US–would face a significant increase in tariffs. Similarly, beneficiary countries under the African Growth and Opportunity Act (AGOA) could face a similar issue, as AGOA is a trade preference program that does not provide duty-free market access for US products in Africa. If apparel exports from AGOA-member countries to the US were subjected to the same 35%+ tariff rates that US products currently face in their markets, it would be a devastating scenario.
By Sheng Lu
(note: this post is not open for comment/discussion)
According to the “America First Trade Policy” released in January 2025, the Trump administration aims to leverage tariffs to achieve various policy objectives, from reducing the U.S. trade deficit to countering “unfair” trading practices.
On February 1, 2025, the Trump Administration further announced the implementation of a 25% punitive tariff on imports from Canada and Mexico, along with an additional 10% punitive tariff on goods from China, in addition to the existing duties. With over 98% of clothing sold in the U.S. imported from abroad, U.S. fashion apparel companies are likely to be among the hardest hit by the tariff increase, particularly since Mexico and China are two of the leading apparel-sourcing destinations for the country.
This study aims to explore the dynamic relationship between U.S. apparel import tariffs, U.S. apparel import prices, and U.S. apparel retail prices. Since tariff rates, import prices, and retail prices are interrelated, a vector autoregression model (VAR) was used to analyze their interactions. The analysis was based on monthly data from January 2015 to November 2024 (latest data available), including:
U.S. apparel tariff rate (data source: USITC; tariff rate=value of calculated duties/custom values)
Price index of U.S. apparel imports (data source: St. Lous Federal Reserve; January 2015=100)
Price index of U.S. apparel retail price(data source: St. Louis Federal Reserve; January 2015=100)
Index of U.S. apparel retail sales(data source: St. Louis Federal Reserve; January 2015=100)
Consumer Price Index for all U.S. urban consumers (data source: St. Louis Federal Reserve; January 2015=100)
The results show that:
First, from January 2015 to November 2024, the average U.S. apparel tariff rate ranged from 12% to 17%. The fluctuation of the tariff rate during that period was primarily caused by the U.S. imposition of Section 301 punitive tariffs on imports from China, along with fashion companies shifting their sourcing from China to other countries, including members of U.S. free trade agreements.
Second, the average price of U.S. apparel imports rose by approximately 6% from January 2015 to November 2024, which aligns with the U.S. apparel retail price increase of 4%. However, this increase was significantly lower than the 34% rise in the U.S. Consumer Price Index (CPI) over the same period. This pattern shows that despite overall inflation and higher operational costs, apparel exporters and U.S. retailers remained cautious about increasing prices due to intense market competition.
Third, the impulse response function (IRF) indicates that a positive tariff shock (i.e., a tariff increase) would lead to a rise in the U.S. apparel retail price. However, the magnitude of this effect is moderate, with the impact being most felt two months later. Specifically, a one-standard-deviation increase in tariffs would result in a 0.16 standard deviation increase in retail prices during Period 3. In other words, the price effect of the tariff increase typically appears in about two months. However, U.S. fashion retailers usually do not transfer the entire burden of tariffs to consumers, likely because of fierce competition in the market.
Fourth, the impulse response function (IRF) indicates that a positive tariff shock (i.e., a tariff increase) would lead to a slight decline in U.S. apparel import prices. This price decrease would also persist for about three months. Specifically, a one-standard-deviation increase in tariffs would result in approximately a 0.01 standard deviation decrease in apparel import prices through Period 4. This result aligns with previous studies indicating that following the implementation of Section 301 punitive tariffs in 2018, some Chinese exporters agreed to reduce their selling prices to keep sourcing orders.
Fifth, the impulse response function (IRF) further shows that a positive tariff shock (i.e., a tariff increase) could hurt U.S. apparel retail sales in the short to medium term. Specifically, a one-standard-deviation increase in tariffs would lead to approximately a 0.82-2.33 standard deviation decrease in U.S. apparel retail sales from Period 3 through Period 5. This result may be driven by higher selling prices, suppressing consumer spending on clothing.
Additionally, the variance decomposition analysis reveals that, in the short to medium term, about 50% to 80% of the variation in U.S. retail prices is explained by its own past values, underscoring the persistence of retailers’ pricing practices. Meanwhile, U.S. apparel retail sales account for about 27% of the changes in U.S. apparel retail prices. In comparison, apparel tariff changes explained only about 5% of the retail price fluctuations. In other words, market factors, particularly consumer demand, play a more significant role in shaping fashion companies’ pricing decisions than tariffs.
In summary, the study’s findings confirm the interconnections between apparel tariff rates, U.S. apparel import prices, and U.S. retail prices,although these relationships turn out to be more complex and nuanced than previously suggested. It is important to note that only apparel imports from China were subject to tariff increases during the examined period in this study. If tariffs were to increase on apparel products from a broader range of countries during Trump’s second term, the economic impact on U.S. apparel retail prices could be much more significant and persistent.
Note: The revealed comparative advantage (RCA) index measures a country’s relative export performance of a particular product compared to the world average. It helps identify sectors in which a country holds a competitive edge in international trade. RCA =(Country’s exports of product X/Country’s total exports)/(World exports of product X/World total exports).
RCA > 1: A value greater than 1 indicates that the country has a revealed comparative advantage in the product, meaning the product has a higher export share in the country’s portfolio compared to the global average. This suggests the country is more competitive in exporting that product relative to the rest of the world.
RCA < 1: A value less than 1 means the country has a revealed comparative disadvantage in that product. It indicates that the country is less competitive in exporting that product compared to the global average.
Observe the sectors in which the U.S. enjoyed a revealed comparative advantage (i.e., RCA > 1) in 2023. How does this compare with Bangladesh? What is your explanation for the observed differences?
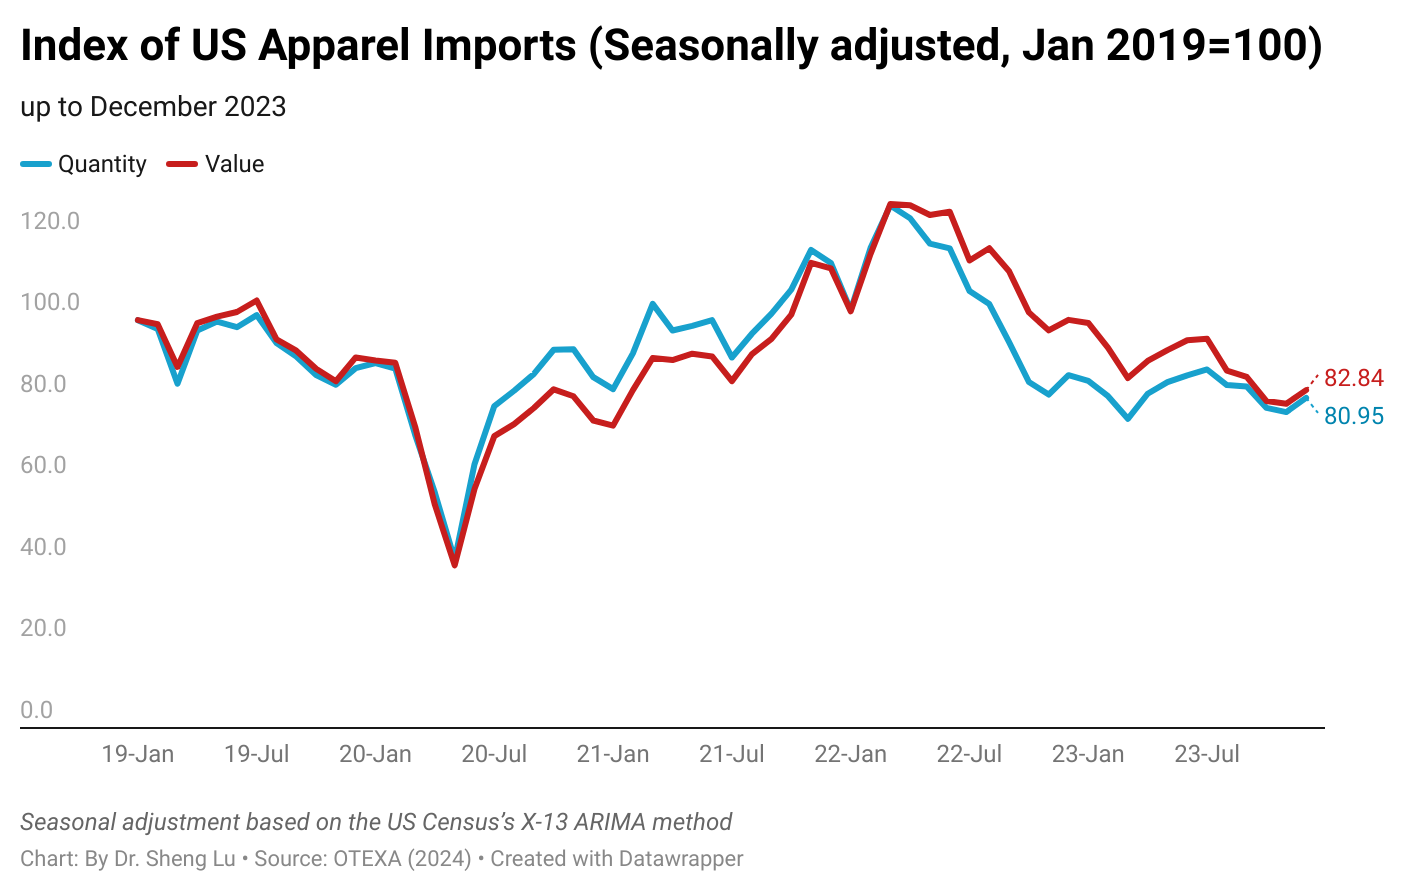
First, affected by the macro economy, US apparel import volume in 2023 suffered the most significant decline since the pandemic. Specifically, US apparel imports decreased by 22% in quantity and value in 2023 compared to 2022, with none of the top ten suppliers experiencing positive growth.
Nevertheless, after several months of straight decline, US apparel imports finally bounced back in December 2023. Thanks to the holiday season and a gradual improvement of the US economy, seasonally adjusted US apparel imports in December 2023 were about 4.5% higher in quantity and 4.2% higher in value than the previous month. Highly consistent with trends, the US Consumer Confidence Index (CCI) increased from 67.2 in November to 76.4 in December (January 2019=100), suggesting US households turned more confident about their financial outlook and willing to spend. That being said, the latest January 2024 International Monetary Fund (IMF) forecasts still predicted the US GDP growth would slow down from 2.5% in 2023 to 2.1% in 2024. Thus, whether the US apparel import volume could continue to maintain growth after the holiday season remains a big question mark.
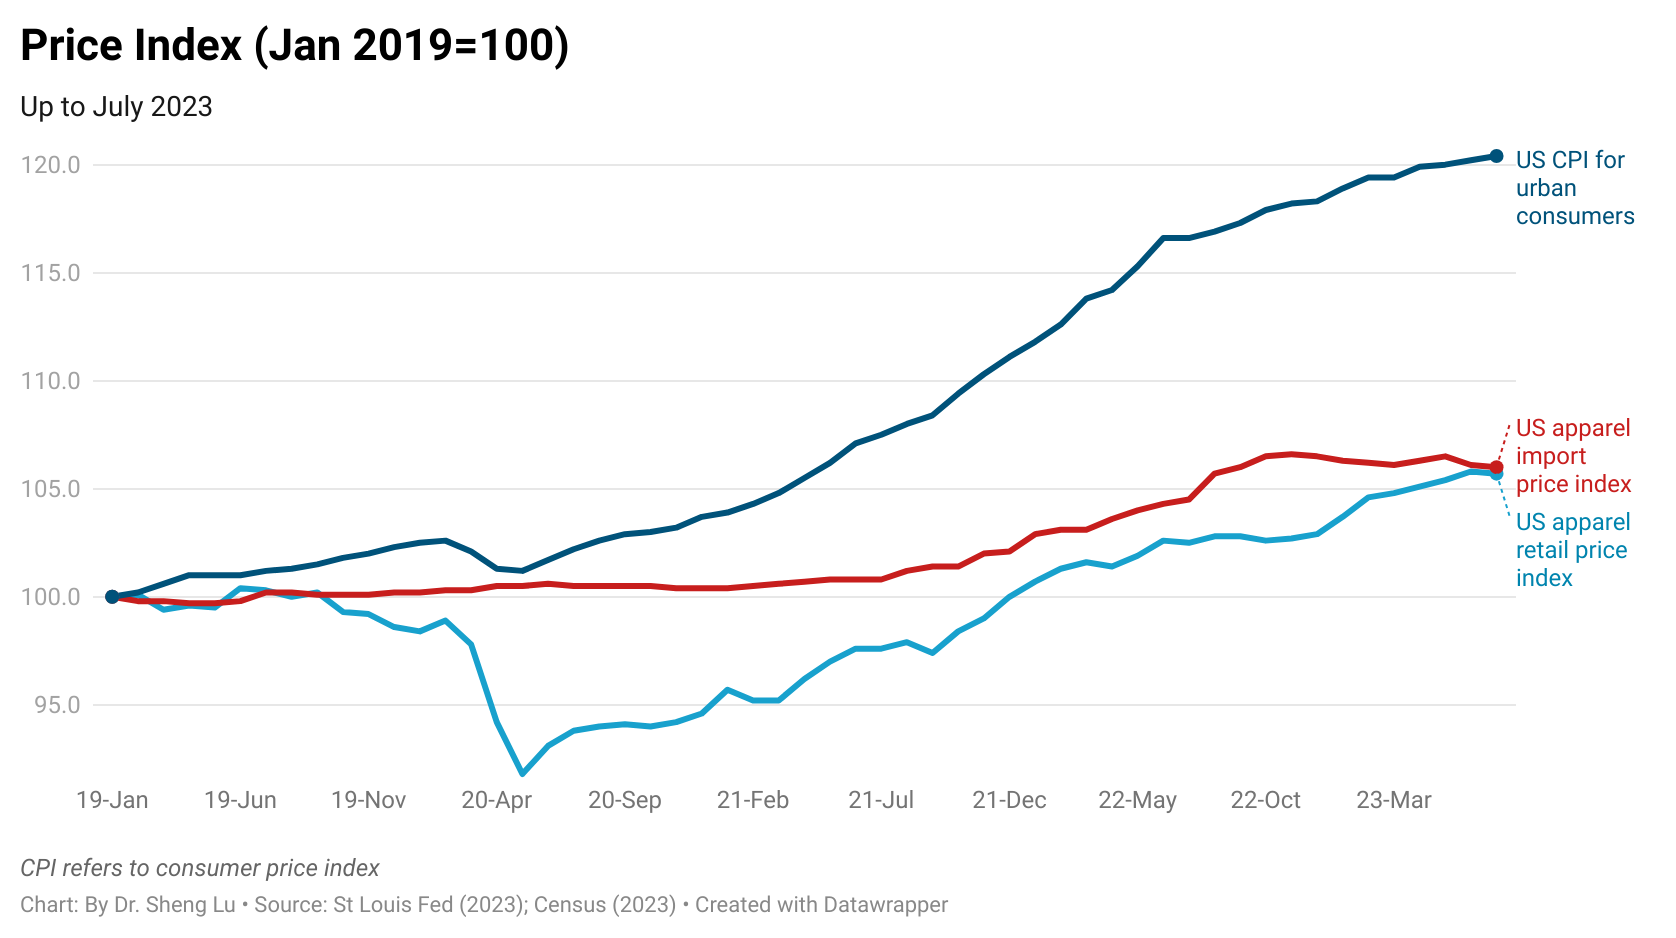
Second, while the pace of sourcing cost increases has slowed, the costs and financial pressure facing US fashion companies are far from over. Specifically, as of December 2023, the price index of US apparel imports stood at 106 (January 2019=100), almost no change from January 2023. However, two emerging trends are worth watching. One is the declining US apparel retail price index since August 2023, which means US fashion companies may have to sacrifice their profits to attract consumers to the store. The second trend is the surging shipping costs as a result of the recent Red Sea shipping crisis, which were not reflected in the December price data. According to J.P. Morgan, during the week of January 25, 2024, the container shipping rates from China to the US West Coast and East Coast saw a significant spike of around 140% and 120% from November 2023, respectively. Even worse, there is no sign that the Red Sea crisis will soon be solved. Therefore, 2024 could pose another year of financial challenges for many US fashion companies.
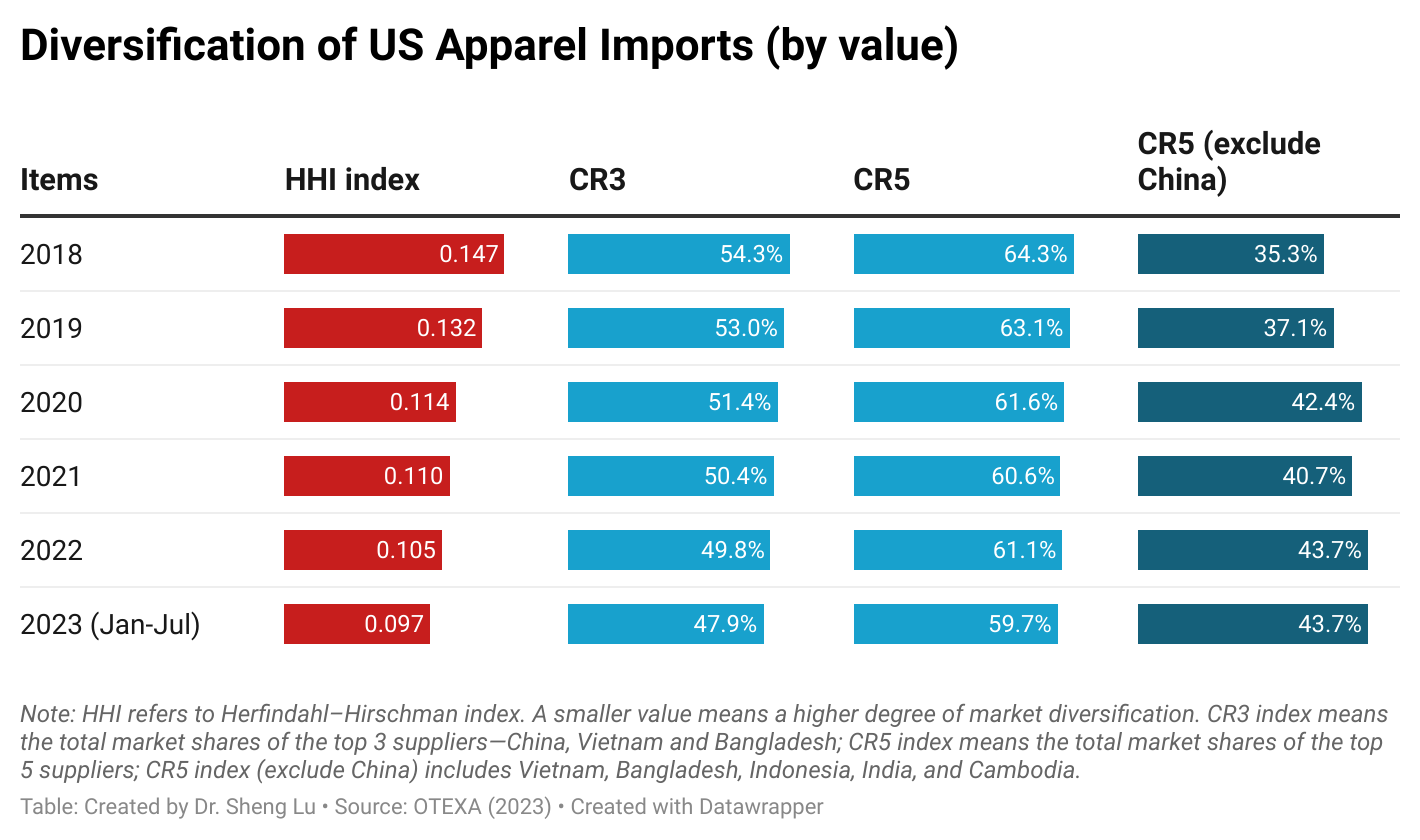
Third, diversification remained a pivotal trend in US fashion companies’ sourcing strategy in 2023. For example, the Herfindahl–Hirschman index (HHI), a commonly used measurement of market concentration, went down from 0.105 in 2022 to 0.101 in 2022, suggesting that US apparel imports came from even more diverse sources.
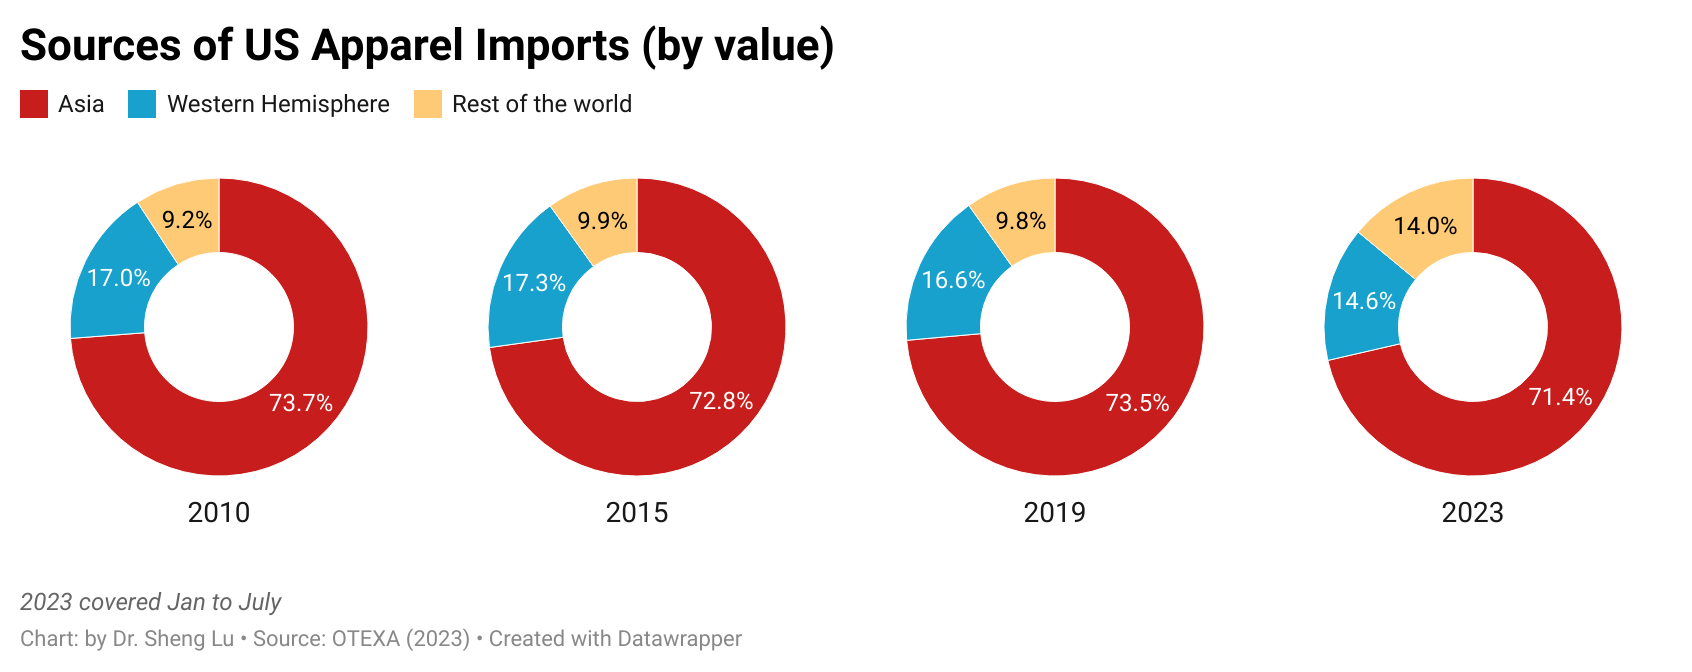
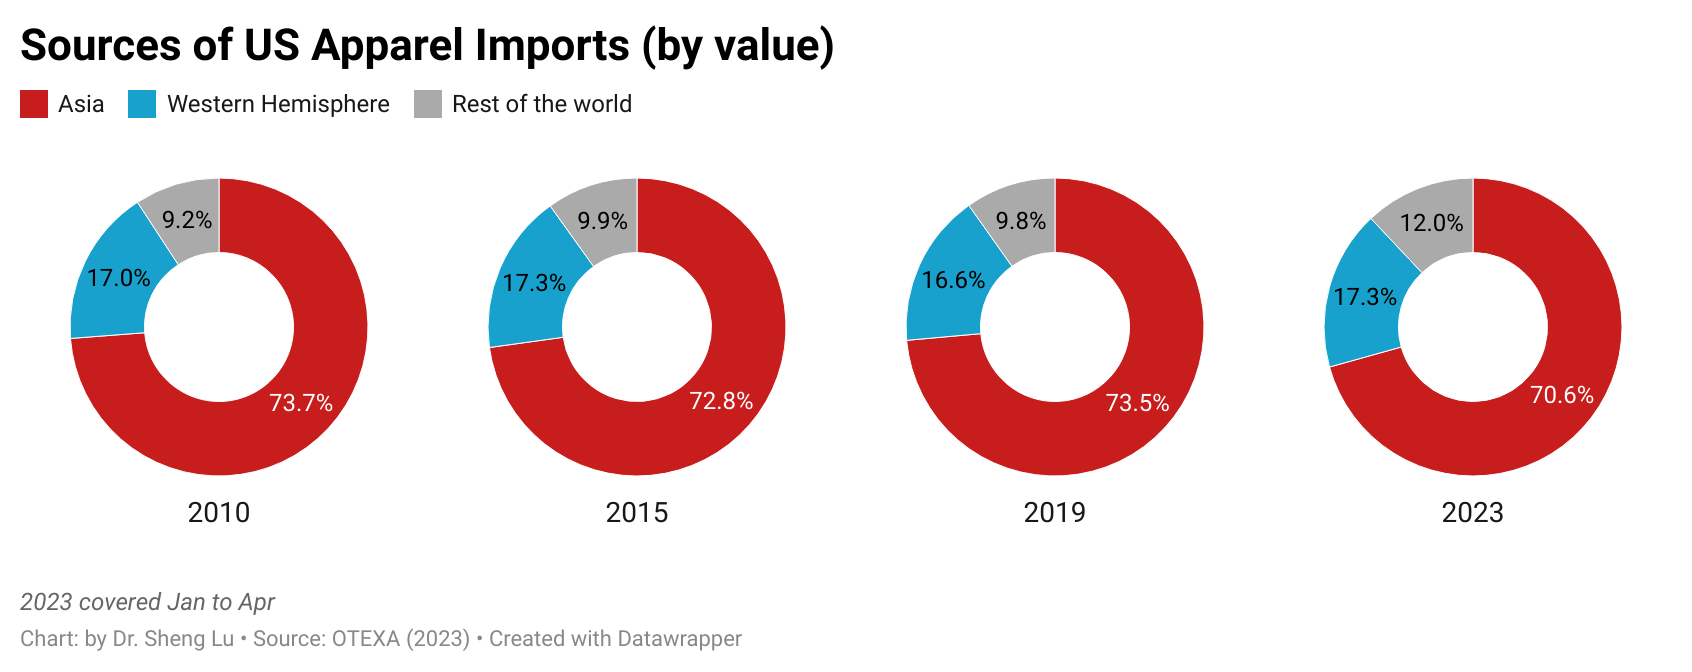
Notably, measured in value, only 71.6% of US apparel imports came from Asia in 2023, the lowest in five years. Highly consistent with the US Fashion Industry Association’s Benchmarking Survey results, OTEXA’s data reflected companies’ intention to diversify their sourcing away from Asia due to increasing geopolitical concerns, particularly the rising US-China strategic competition.
However, it should be noted that Asia’s reduced market share did not benefit “near-shoring” from the Western hemisphere much. For example, in 2023, approximately 14.6% of US apparel imports originated from USMCA and CAFTA-DR members, nearly the same as the 14.3% recorded in 2022. Instead, US apparel imports outside Asia and the Western Hemisphere jumped to 11.4% in 2023 from 9.8% a year ago. Some emerging EU and African suppliers, such as Turkey, Romania, Morocco, and Tunisia, performed relatively well in the US market in 2023, although their market shares remained small. We could highly expect the sourcing diversification strategy to continue in 2024 as many companies regard the strategy as the most effective to mitigate various market uncertainties and sourcing risks.
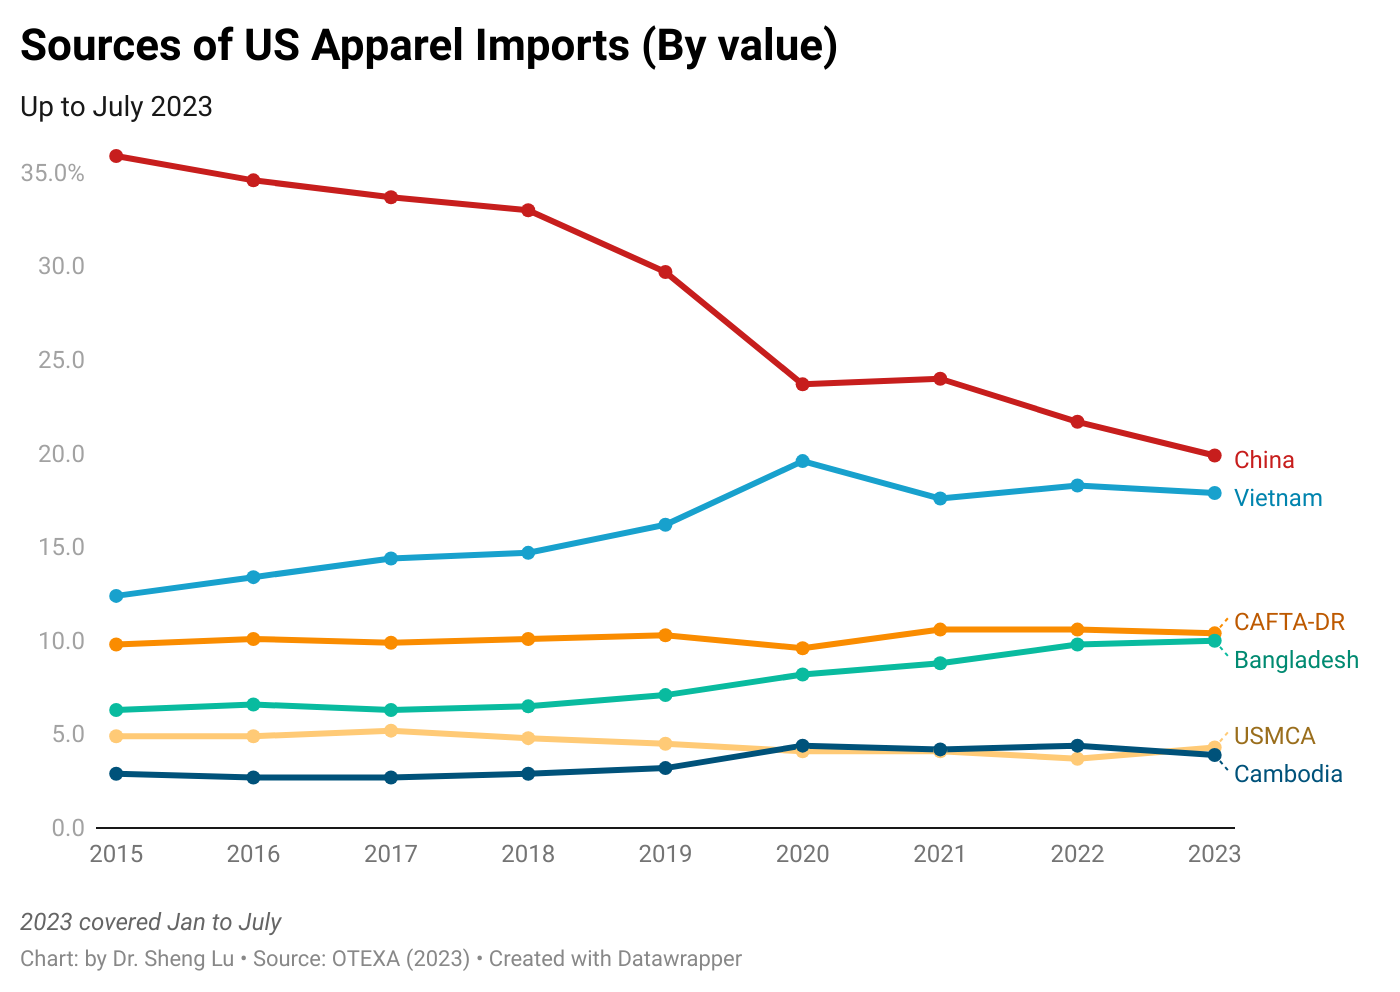
Fourth, US fashion companies continued reducing their China exposure as much as possible, but China will remain a key player in the game. On the one hand, about 20.0% of US apparel imports in value and 25.9% in quantity came from China in 2023, both hit a new low in the past decade. Recent studies also show that it became increasingly common for China to no longer be the largest source of apparel imports for many US fashion companies.
However, China remains highly competitive in terms of the variety of products it offers. For example, the export product diversification index, calculated based on trade data at the 6-digit HTS code level (Chapters 61 and 62), shows that few other countries can match China’s product variety. Likewise, product level data collected from industry sources indicates that China offered far more clothing styles (measured in Stock Keeping Units, SKUs) than its competitors in 2023. According to the results, rather than identifying 1-2 specific “next China,” US fashion companies appeared to leverage “category killers”—for example, utilizing Vietnam as a sourcing base for outerwear, underwear, and swimwear; India for dresses, and Bangladesh for large-volume basic knitwear items.
Related to this, another recent study found that the top five largest Asian suppliers next to China, including Vietnam, Bangladesh, Indonesia, India, and Cambodia, collectively can offer diverse product categories almost comparable to those from China in the US market.
Fifth, trade data reveals early signs that US fashion companies are gradually reducing sourcing cotton apparel products from Asia because of the implementation of the Uyghur Forced Labor Prevention Act (UFLPA). Notably, when concerns about cotton made by Xinjiang forced labor initially emerged in 2018, US fashion companies quickly shifted sourcing orders for cotton apparel (OTEXA code 31) from China to other Asian countries. However, UFLPA’s enforcement increasingly targets imports from Asian countries other than China due to the highly integrated regional textile and apparel supply chain and Asian countries’ heavy reliance on textile inputs from China. Consequently, Asia (excluding China) accounted for a declining share in the total imports of US cotton apparel in 2023.
Meanwhile, affected by UFLPA’s enforcement, only 11.8% of US cotton apparel imports came from China in 2023, marking a further decline from 13% in 2022 and reaching a new low for the past decade. China also deliberately decreased the percentage of cotton apparel in its total apparel exports to the US market, dropping from nearly 40% in 2017 to only 25% in 2023. In comparison, cotton apparel consistently represented about 45% of total US apparel imports during the same period.
Additionally, while there was no substantial increase in the volume of US apparel imports from CAFTA-DR members, as a silver lining, the utilization of the trade agreement improved. In 2023, about 19.2% of US apparel imports claimed duty-free benefits under US free trade agreements and trade preference programs, a notable increase from 17.7% in 2022. Most such imports came under CAFTA-DR (45.4%) and USMCA (19.7%).
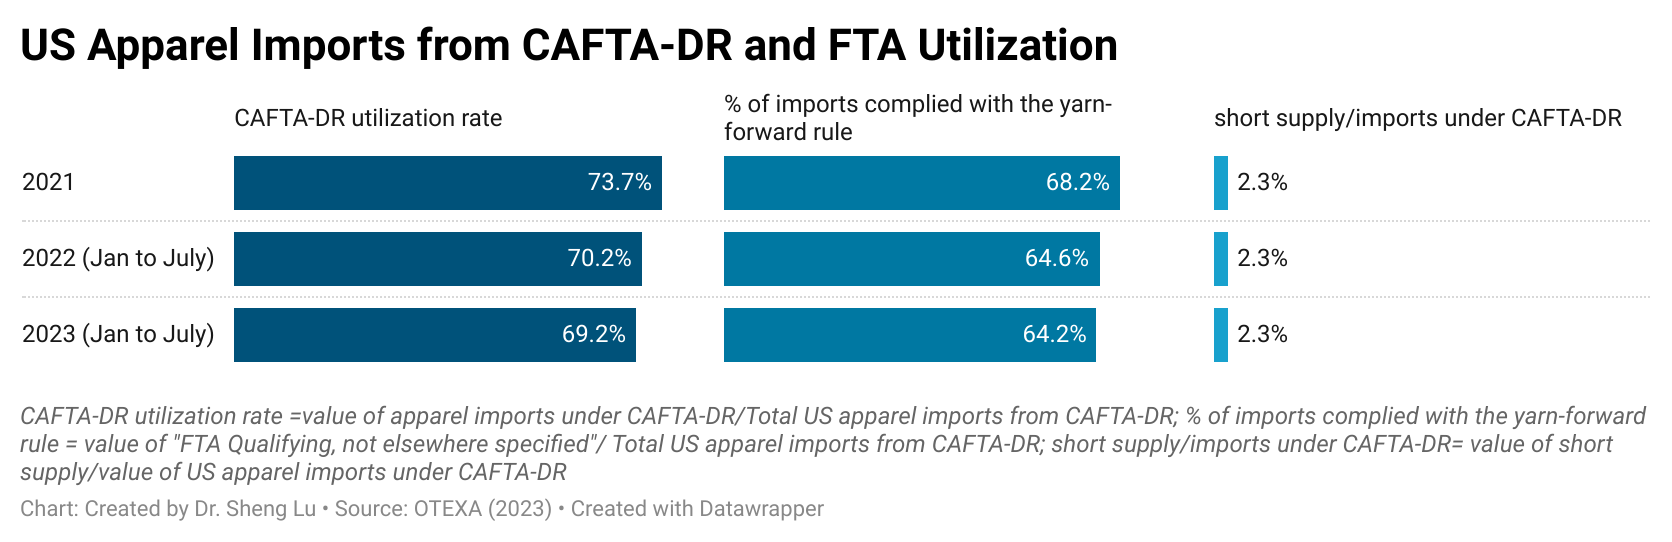
Meanwhile, in the first 12 months of 2023 (latest OTEXA data), about 70.2% of US apparel imports came from CAFTA-DR members claimed the duty-free benefit, up from 66.6% the same period a year ago. Particularly, 65.4% of US apparel imports under CAFTA-DR complied with the yarn-forward rules of origin in 2023, a notable increase from 61.3% in 2022. Another 2.6% of imports utilized the agreement’s short supply mechanism, which also went up from 2.3% in 2022. The results could reflect an ever more integrated regional textile and apparel supply chain among CAFTA-DR members due to increasing investments made in the region in recent years. However, there is still much that needs to be done to effectively increase the volume of US apparel imports from the region.
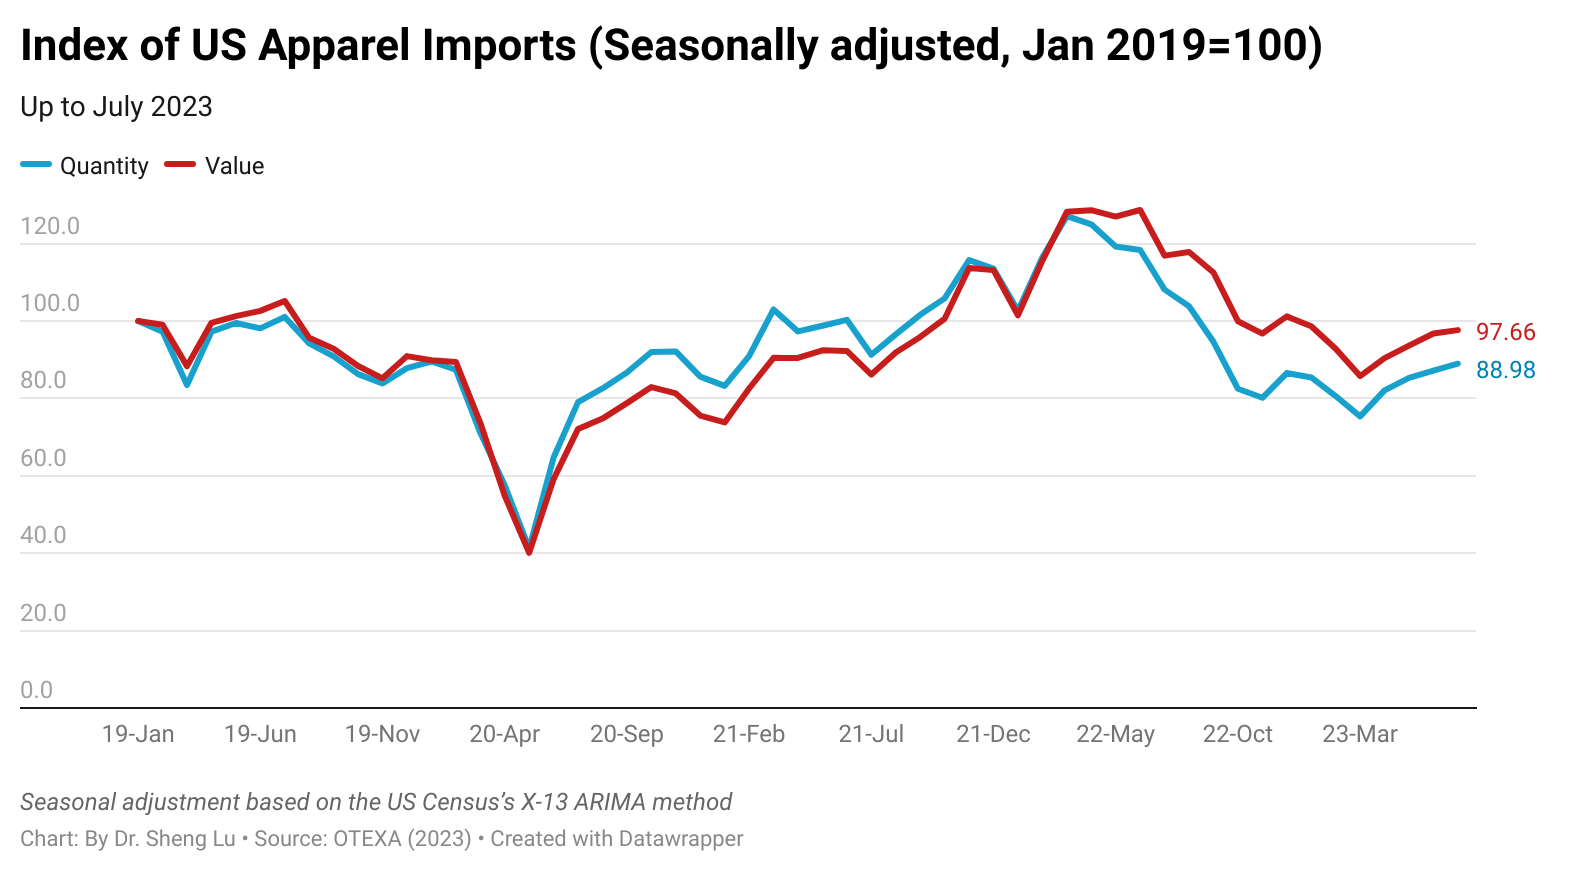
First, while US apparel imports gradually recovered, the import demand remained weak overall. For example, US apparel imports in July 2023 increased by 0.9% in value and 2% in quantity from June (seasonally adjusted). However, the trade volume still experienced a decrease of approximately 17-18% compared to the previous year. Meanwhile, the US consumer confidence index fell again in August 2023, suggesting the economic uncertainties are far from over. Notably, so far in 2023 (January to July), US apparel imports decreased by 22.3% in value and 28% in quantity from the previous year, the worst performance since the pandemic.
As a silver lining, the price of US apparel imports has stabilized, although inflation remains an issue for the US economy.
Secondly, because of the seasonal pattern, Asian countries were able to capture relatively higher market shares since June. For example, measured in value, China, ASEAN, and Bangladesh accounted for over 64% of total US apparel imports in July 2023, a notable increase from 61% in June and 58% in May 2023.
Nevertheless, US fashion companies continue diversifying their sourcing base to mitigate various supply chain risks and rising geopolitical tensions. For example, the HHI Index for US apparel imports dropped to 0.097 in the first seven months of 2023, which is lower than the 0.106 recorded in the same period the previous year (January to July 2022), indicating a greater diversity in the sources of imports.
Third, despite an apparent rebound in exports to the US, China continued to experience a further decline in its market share. For instance, in July 2023, China’s market share was more than 3 percentage points lower in value (27.2% in July 2022 vs. 24.1% in July 2023) and 2.5 percentage points lower in quantity (43.1% in July 2022 vs. 40.6% in July 2023). This marked the worst performance since April 2023. In other words, consistent with recent industry surveys, US fashion companies continue to reduce their China exposure given the adverse business environment.
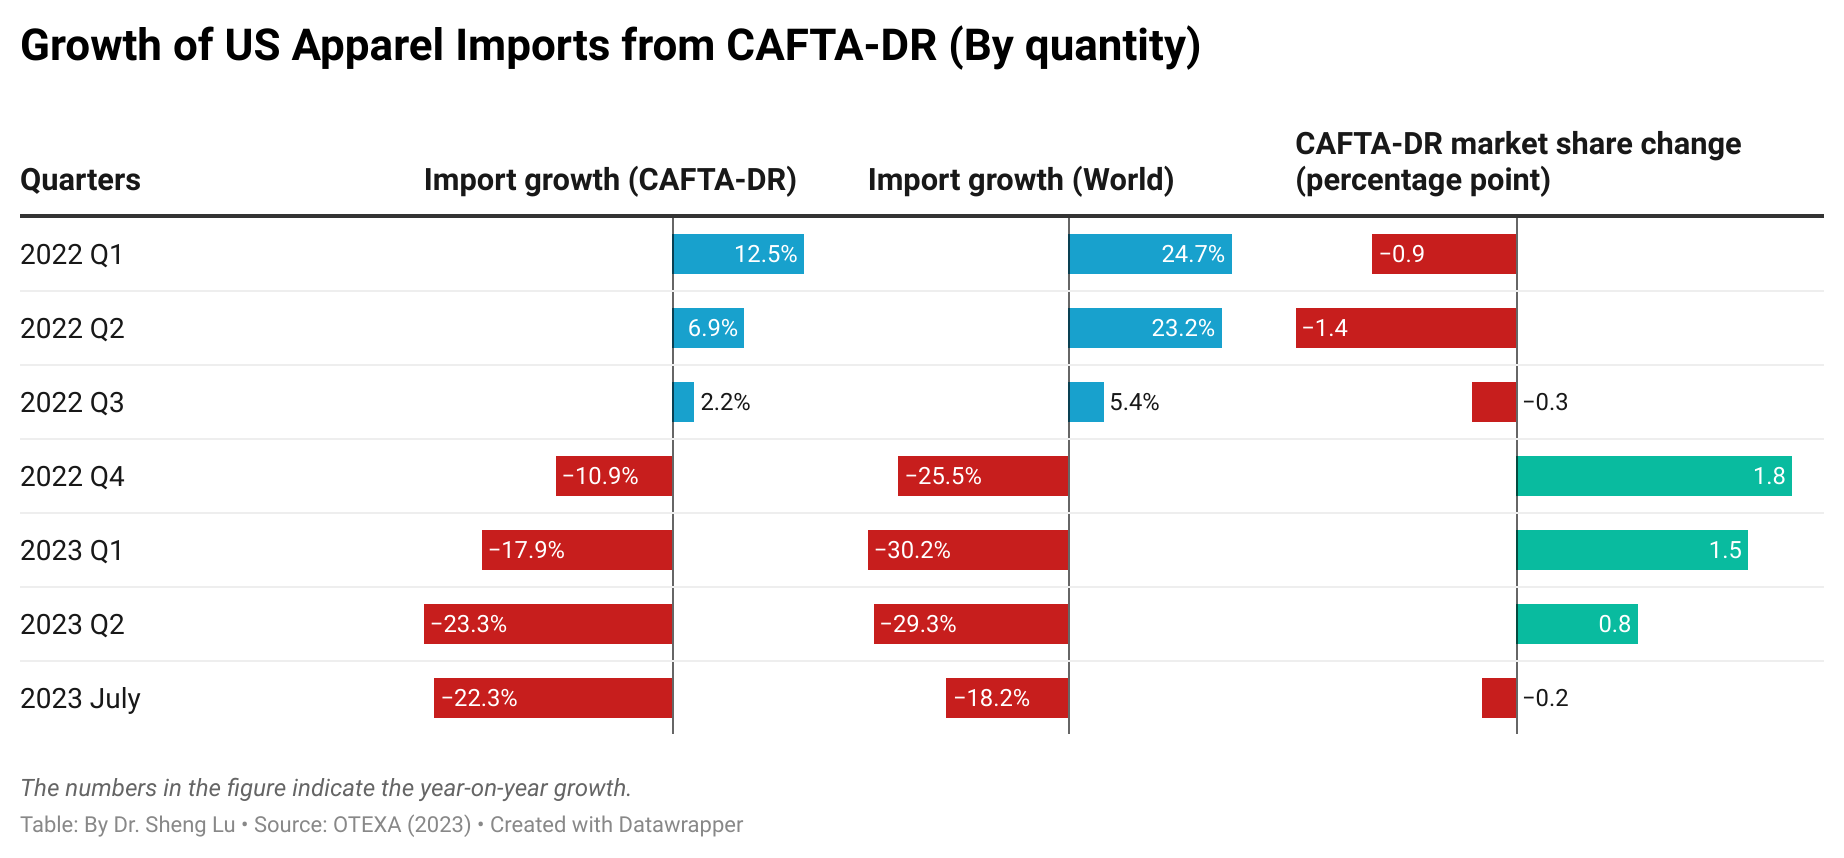
Fourth, the latest data suggests that US apparel imports from CAFTA-DR members remain stagnant, and some critical problems, such as the underutilization of the agreement, even worsened. For example, about 9.5% of US apparel imports in value and 8.5% in quantity came from CAFTA-DR members in July 2023, lower than 10.2% and 9.0% in the previous year (i.e., July 2022). In absolute terms, US apparel imports from CAFTA-DR in 2023 were about 20% lower than in 2022.
Additionally, CAFTA-DR’s utilization rate (i.e., the value of imports claiming the duty-free benefits under CAFTA-DR divided by the total value of imports from CAFTA-DR) fell from 70.2% in 2022 (Jan to July) to a new low of 69.2% in 2023 (Jan to July). Likewise, the value of imports utilizing CAFTA-DR’s short supply decreased by more than 20%. Thus, how to leverage CAFTA-DR to meaningfully encourage more US apparel imports from the region, particularly in light of US fashion companies’ eagerness to reduce their exposure to China, calls for sustained efforts and probably new strategies.
The latest OTEXA trade data suggests several US apparel import patterns:
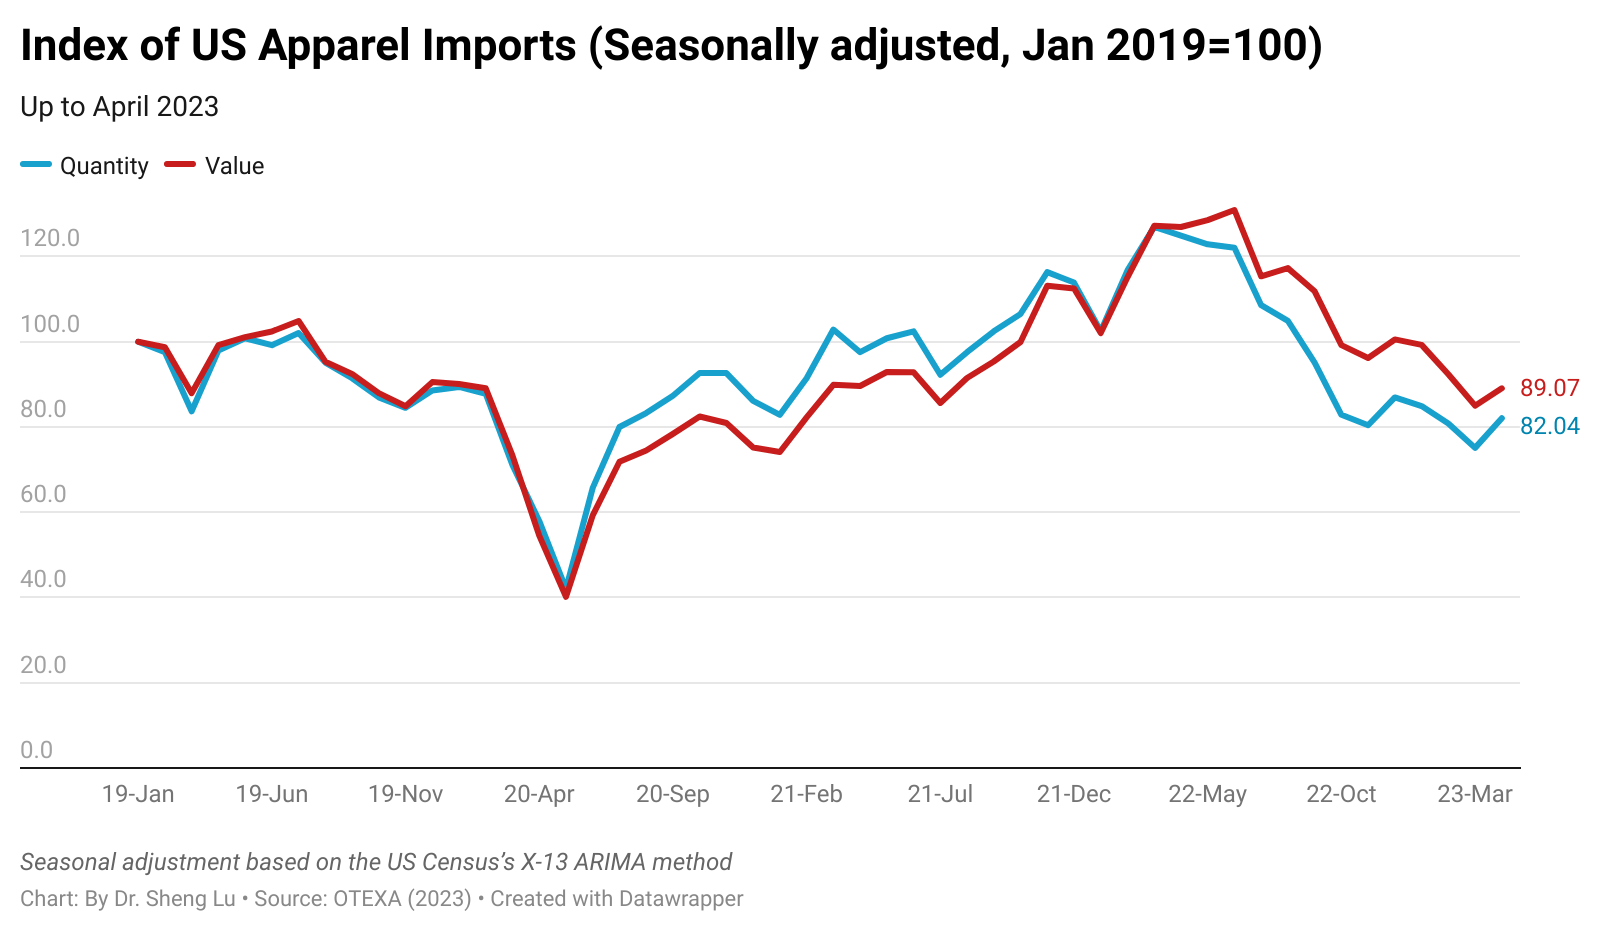
First, US apparel imports indicated a slow improvement in April 2023 but remained weak this year. For example, measured in quantity, US apparel imports fell by 33.9% in April 2023 from a year ago, but it was less significant than in March (i.e., down 40.2% YoY*). Likewise, measured in value, US apparel imports fell by 29.3% YoY in April 2023, which improved from a 32.7% YoY decline in March 2023. (*YoY: Year-over-year)
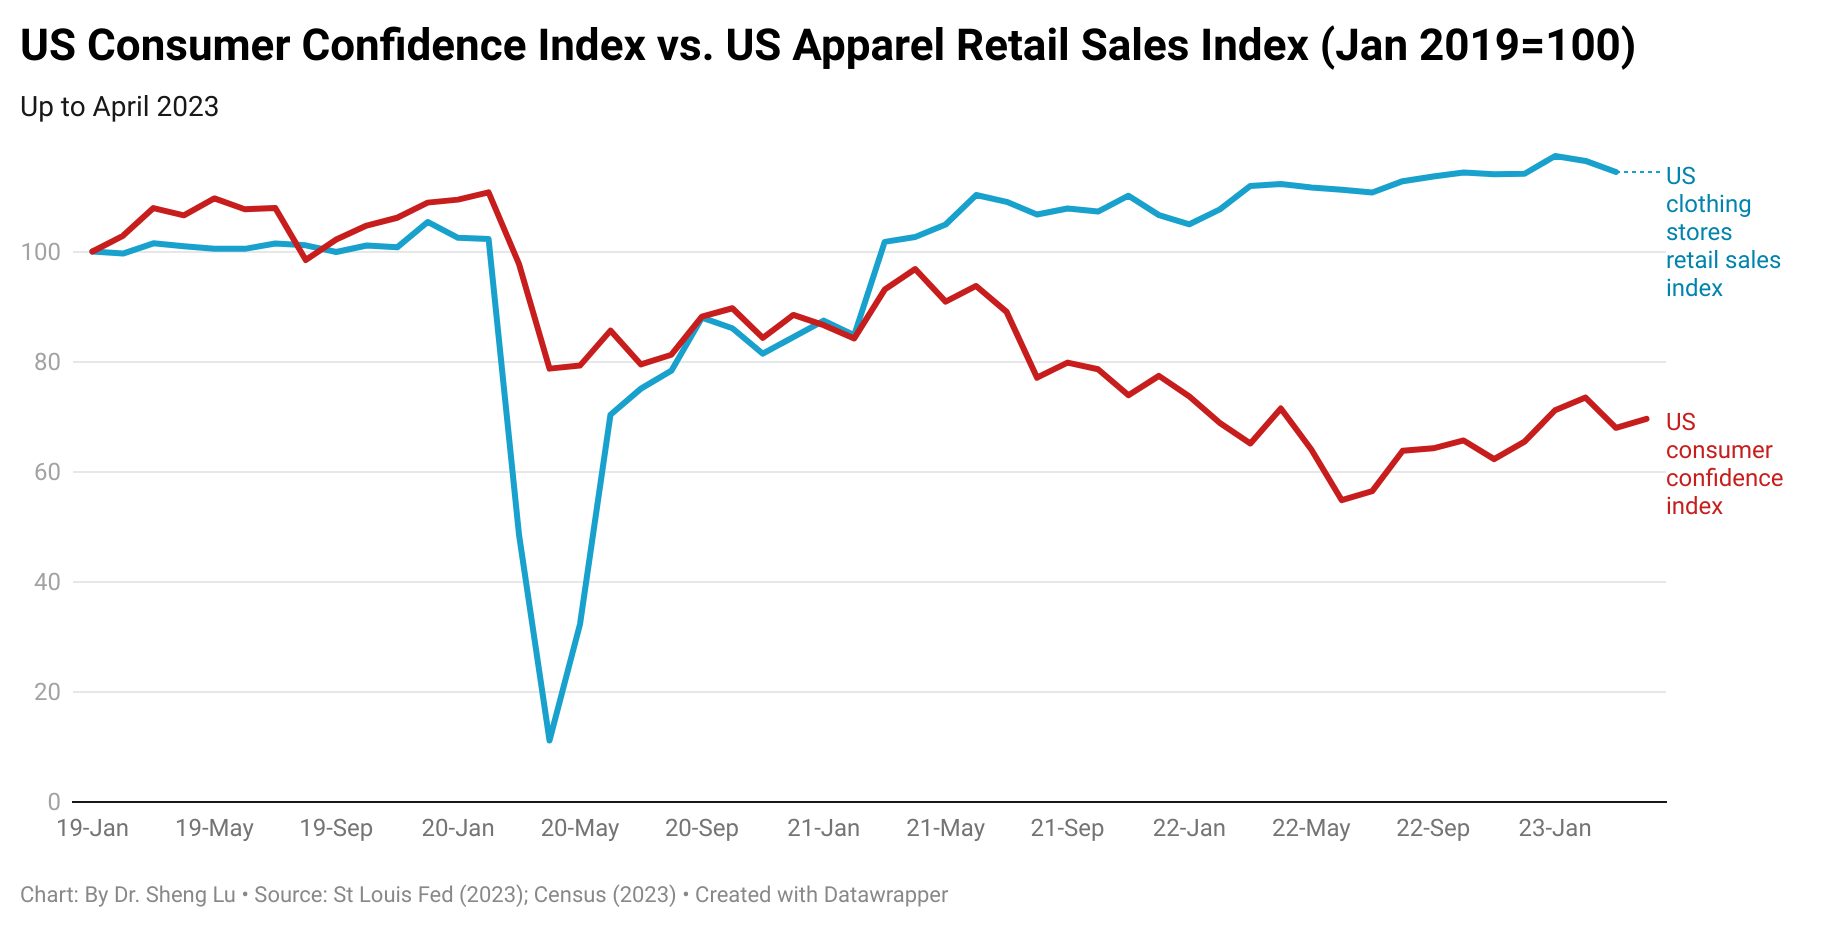
Overall, the shrinking US apparel import volume reflected the headwinds in the US economy and consumers’ hesitancy to purchase clothing amid financial uncertainties and high inflation. Recent economic indicators also present a mixed picture of the US economy’s growth trajectory. For example, while the US consumer confidence index slightly went up from 68.0 in March to 69.6 in April 2023 (January 2019=100), the advanced clothing store sales index in April fell to 115.6 (Jan 2019=100), the lowest so far in 2023 (e.g., was 120.6 in January 2023). However, since summer is traditionally a peak season for clothing sales, followed by events like back-to-school shopping, there remains hope that US apparel imports may experience a slight recovery at some point in the second half of the year.
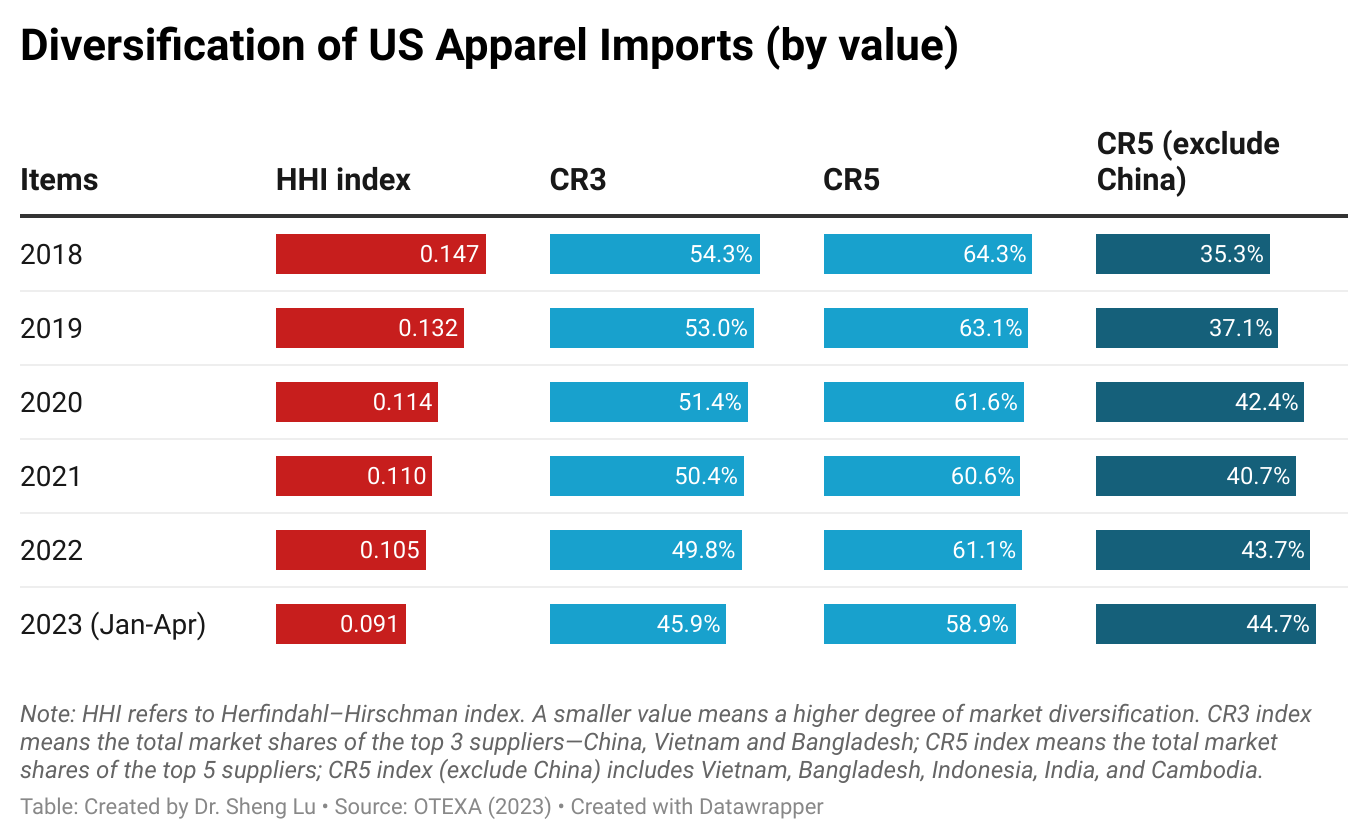
Second, trade data suggested that US apparel imports came from more diverse sources. For example, the Herfindahl–Hirschman index (HHI) fell below 0.1 in the first four months of 2023. Likewise, the market shares of the five largest suppliers (CS5) fell below 60% for the first time since 2018. The result suggested that leveraging sourcing diversification is a prevalent strategy among US fashion companies to mitigate supply chain risks and address market uncertainties.
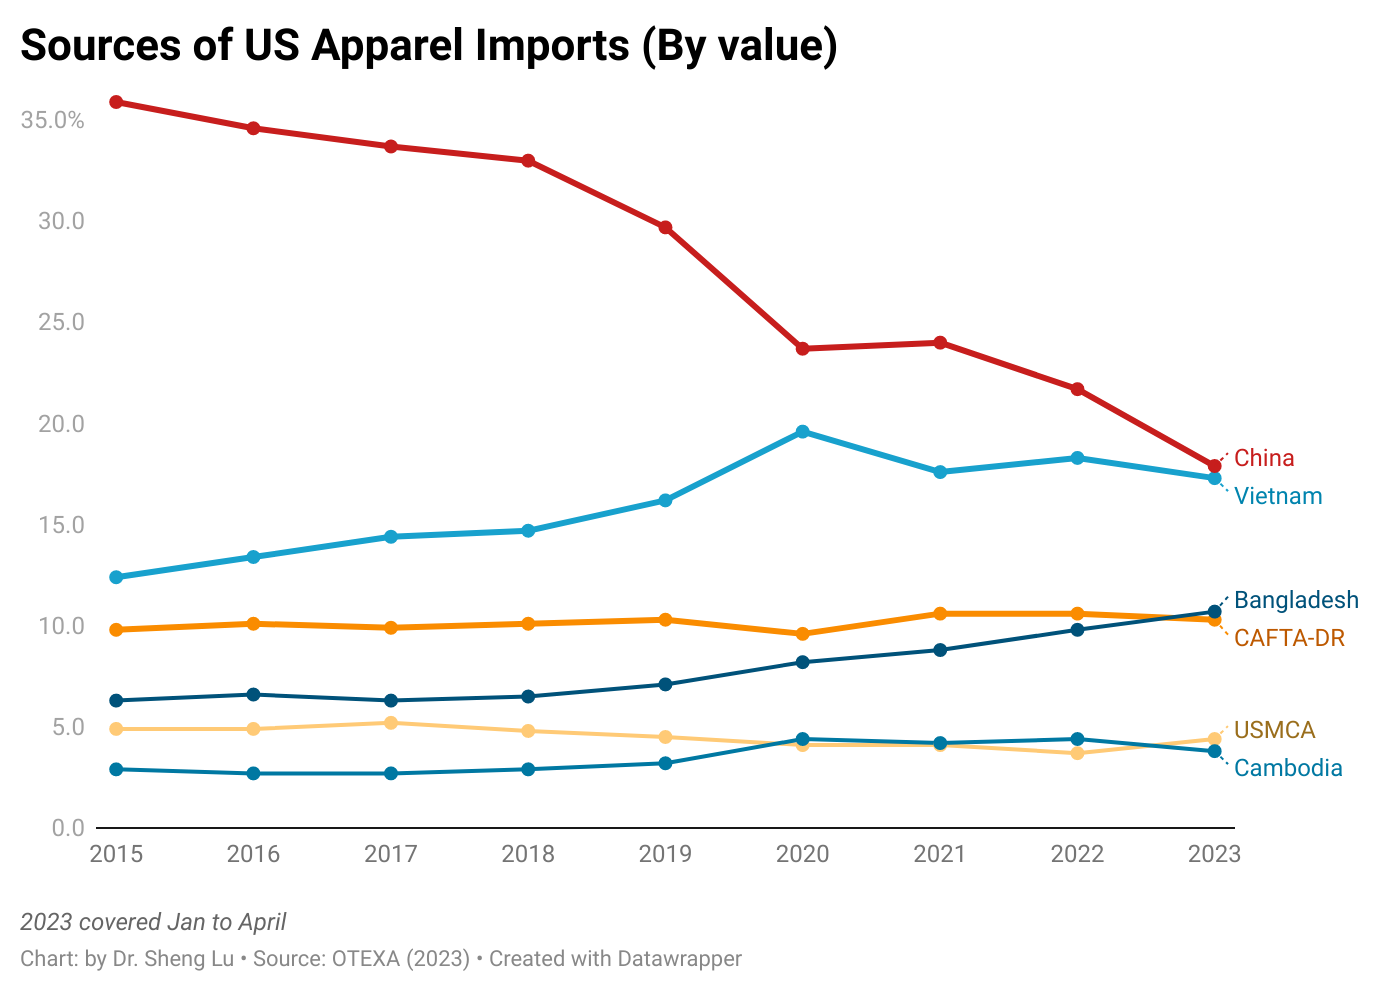
Third, US fashion companies are serious and eager to further reduce their “China exposure.” Although China remained the top apparel supplier to the US, its market share fell to a new low of 17.9% in value and 30.6% in quantity in the first four months of 2023. Notably, for the first time in decades, less than 10% of US cotton apparel imports came from China in March/April 2023, revealing the significant impact of the Uyghur Forced Labor Prevention Act (UFLPA) on US fashion companies’ China sourcing strategies.
Related, US fashion companies appear to be increasingly cautious about sourcing apparel from Vietnam as its supply chain is too exposed to China, raising concerns about forced labor risks. In value, Vietnam accounted for 17.3% of US apparel imports in the first four months of 2023, down from 18.6% a year ago. Notably, almost the same amount of Vietnam’s textile and apparel products were subject to the CBP’s UFLPA investigation as China in FY2023.
Fourth, large-scale Asian countries benefited the most as US fashion companies looking for China’s alternatives. Specifically, measured in value, about 70.6% of US apparel imports came from Asia in the first four months of 2023, down from 74.9% in 2022. However, the five largest apparel exporting countries in Asia other than China (i.e., Vietnam, Bangladesh, Indonesia, India, and Cambodia) accounted for 44.7% of US apparel imports in the first four months of 2023, a new high since 2018 (i.e., was 35.3%). These countries are among the most popular “alternatives to China” because of their balanced performance regarding production capacity, cost, flexibility, and compliance risks.
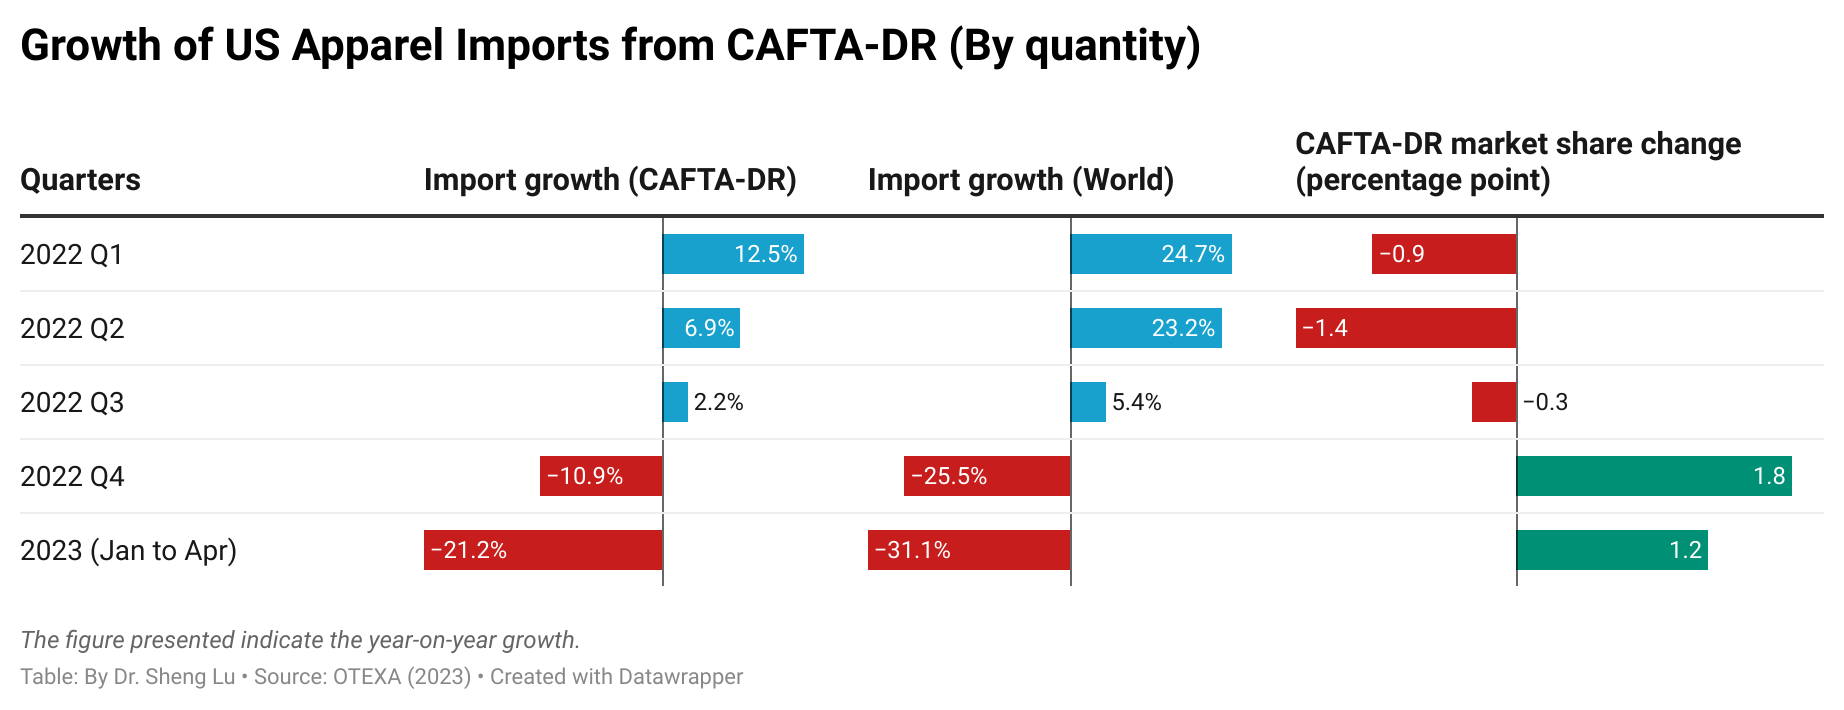
Fifth, US fashion companies are also actively exploring new near-shoring opportunities from the Western Hemisphere. For example, about 17.3% of US apparel imports came from Western Hemisphere countries in the first four months of 2023, up from 15.6% in 2023. That being said, measured in quantity, US apparel imports from Mexico and CAFTA-DR members fell by 13.0% and 21.2% in the first four months of 2023 from a year ago due to the struggling US economy. It will be interesting to see whether CAFTA-DR and Mexico can keep or enhance their market shares when the US import demand recovers.
According to the World Trade Statistical Review 2021 report released by the World Trade Organization (WTO), the textiles and apparel trade patterns in 2020 include both continuities and new trends affected by the pandemic and companies’ evolving production and sourcing strategies in response to the shifting business environment.
Pattern #1: COVID-19 significantly affected the world textile and apparel trade volumes, resulting in substantial growth of textile exports and a declined demand for apparel.
Driven by increased personal protective equipment (PPE) production, global textile exports grew by 16.1% in 2020, reaching $353bn. In comparison, affected by lockdown measures, worsened economy, and consumers’ tighter budget for discretionary spending, global apparel export decreased by nearly 9% in 2020, totaling $448bn, the worst performance in decades. The apparel sector is not alone. The world merchandise trade in 2020 also suffered an unprecedented 8% drop from a year ago, with COVID-19 to blame.
Notably, as economic activities returned in the second half of 2020, the world clothing export quickly rebounded to around 95% of the pre-covid level by the end of 2020. That being said, the unexpected resurgence of COVID cases in summer 2021, especially the delta variant, caused new market uncertainties. Overall, the world textile and apparel trade recovery process from COVID-19 will differ from our experiences during the 2008 global financial crisis.
Pattern #2: COVID-19 did NOT shift the competitive landscape of the world textile exports; Meanwhile, textile exports from China and Vietnam gained new momentum during the pandemic.
China, the European Union (EU), and India remained the world’s three largest textile exporters in 2020. Together, these top three accounted for 65.8% of the world’s textile exports in 2020, similar to 66.9% before the pandemic (2018-2019).
Notably, China and Vietnam enjoyed a substantial increase in their textile exports in 2020, up 28.9% and 10.7% from a year ago, respectively. The complete textile and apparel supply chain and considerable production capability allow these two countries to switch clothing production to PPE manufacturing quickly. In particular, Vietnamexceeded South Korea and ranked the world’s sixth-largest textile exporter in 2020 ($10 bn of exports), the first time in history.
The United States dropped one place and ranked the world’s fifth-largest textile exporter in 2020 (was 4th from 2015 to 2019), accounting for 3.2% of the shares (was 4.4% in 2019). Production disruptions at the beginning of the pandemic and the shift toward PPE production for domestic consumption were the two primary contributing factors behind the decline in U.S. textile exports. Due to the regional trade patterns, around 67% of U.S. textile exports went to the Western Hemisphere in 2020, including 46% for members of the U.S.-Mexico-Canada Trade Agreement (USMCA) and another 17.2% for members of the Dominican Republic-Central America Free Trade Agreement (CAFTA-DR).
Pattern #3: Fashion companies’ efforts to diversify apparel sourcing from China somehow slowed during the pandemic.
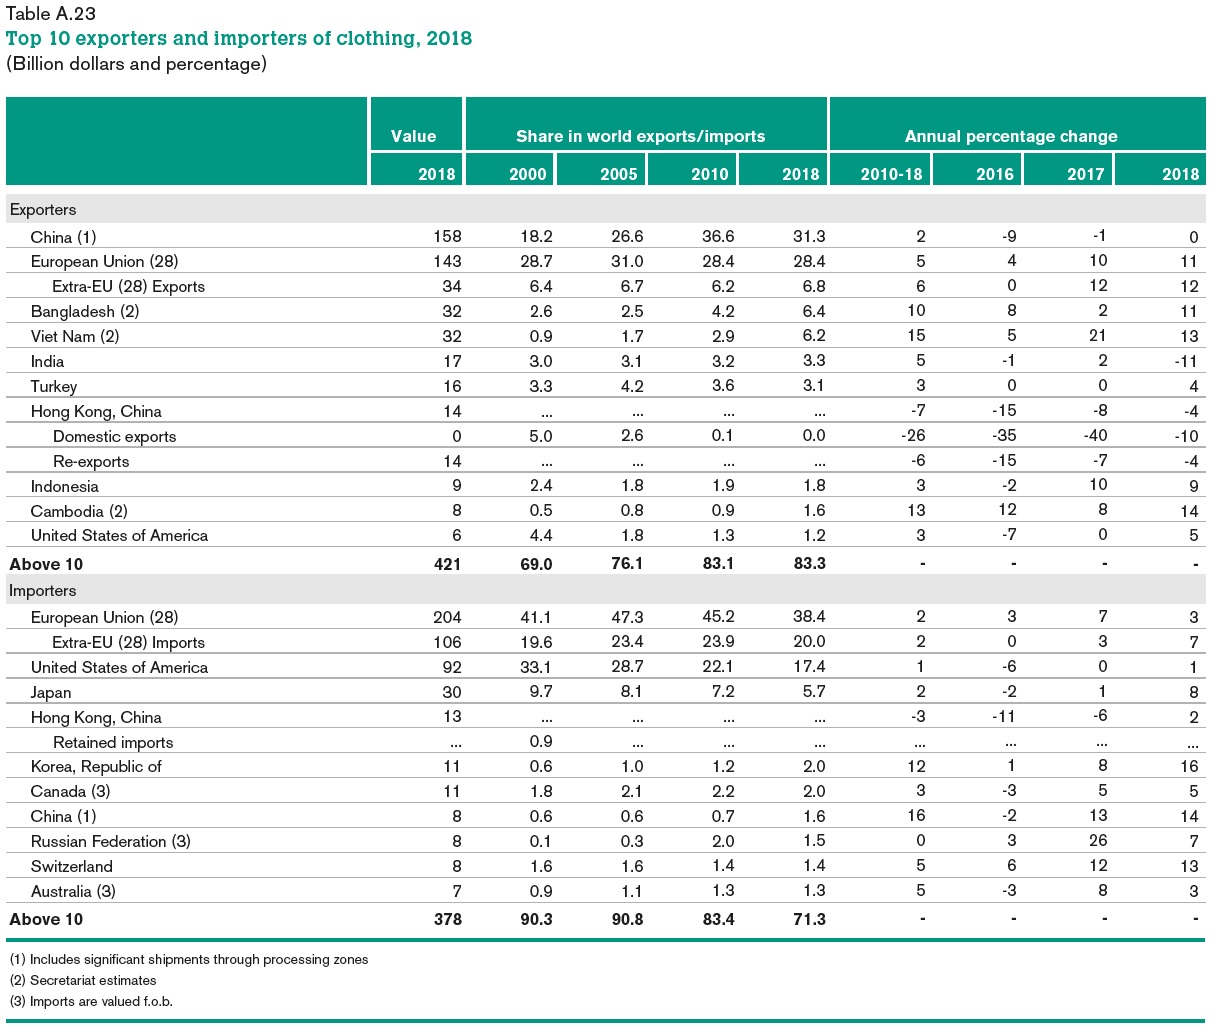
China, the European Union, Vietnam, and Bangladesh unshakably remained the world’s four largest apparel exporters in 2020. Altogether, these top four accounted for 72.2% of the world market shares in 2020, higher than 71.4% in 2019.
Notably, while China steadily accounted for declining shares in the world’s total apparel exports since 2015, its market shares rebounded to 31.6% in 2020 from 30.7% in 2019. We can observe a similar pattern in Canada (up from 36.2% to 41.2%) and the EU (31.2% to 31.3%), two of the world’s leading apparel import markets. Even in the U.S. market, where Chinese goods face adverse impacts of the tariff war, the market shares of “Made in China” only marginally decreased from 30.8% in 2019 to 29.8% in 2020, compared with a more significant drop before the pandemic (i.e., fell from 34.4% 2018 to 30.8% in 2019).
Several factors could explain the resilience of China’s apparel exports: 1) fashion brands and retailers’ particular sourcing criteria match China’s competitiveness during the pandemic (e.g., flexibility, agility, and total landed sourcing cost). 2) China has one of the world’s most complete textile and apparel supply chains, allowing garment factories to access textile raw material and accessories locally. 3) Compared with many other apparel exporting countries, China suffered a shorter COVID lockdown period and resumed apparel production earlier and more quickly. Most Chinese textile and apparel factories started to reopen in April 2020, and they resumed an overall 90%-95% operational capacity rate by July 2020.
Nonetheless, fashion companies are NOT reversing their long-term strategies to reduce “China exposure” for apparel sourcing. On the contrary, non-economic factors, particularly the concerns about forced labor in China’s Xinjiang region, push most western fashion brands and retailers to develop apparel sourcing capacities beyond China. Meanwhile, no single country has yet and will likely become the “Next China” because of capacity limits. Instead, from 2015 to 2020, China’s lost market shares in the world apparel exports (around 7.8 percentage points) were picked up jointly by its competitors in Asia, including ASEAN members (up 4.4 percentage points), Bangladesh (up 1.3 percentage points), and Pakistan (up 0.3 percentage point). Such a trend is most likely to continue in the post-COVID world.
Pattern #4: Developed economies led textile PPE imports during the pandemic, whereas the developing countries imported fewer textiles as their apparel exports dropped.
On the one hand, the value of textile imports by developed economies, including EU members, the United States, Japan, and Canada, surged by more than 30 percent in 2020, driven mainly by their demand for PPE. The result also reveals the significant contribution of international trade in supporting the supply and distribution of textile PPE globally. On the other hand, the developing countries engaged in apparel production and export drove the import demand for textile raw materials like yarns and fabrics. However, most of these developing countries’ textile imports fell in 2020, corresponding to their decreased apparel exports during the pandemic.
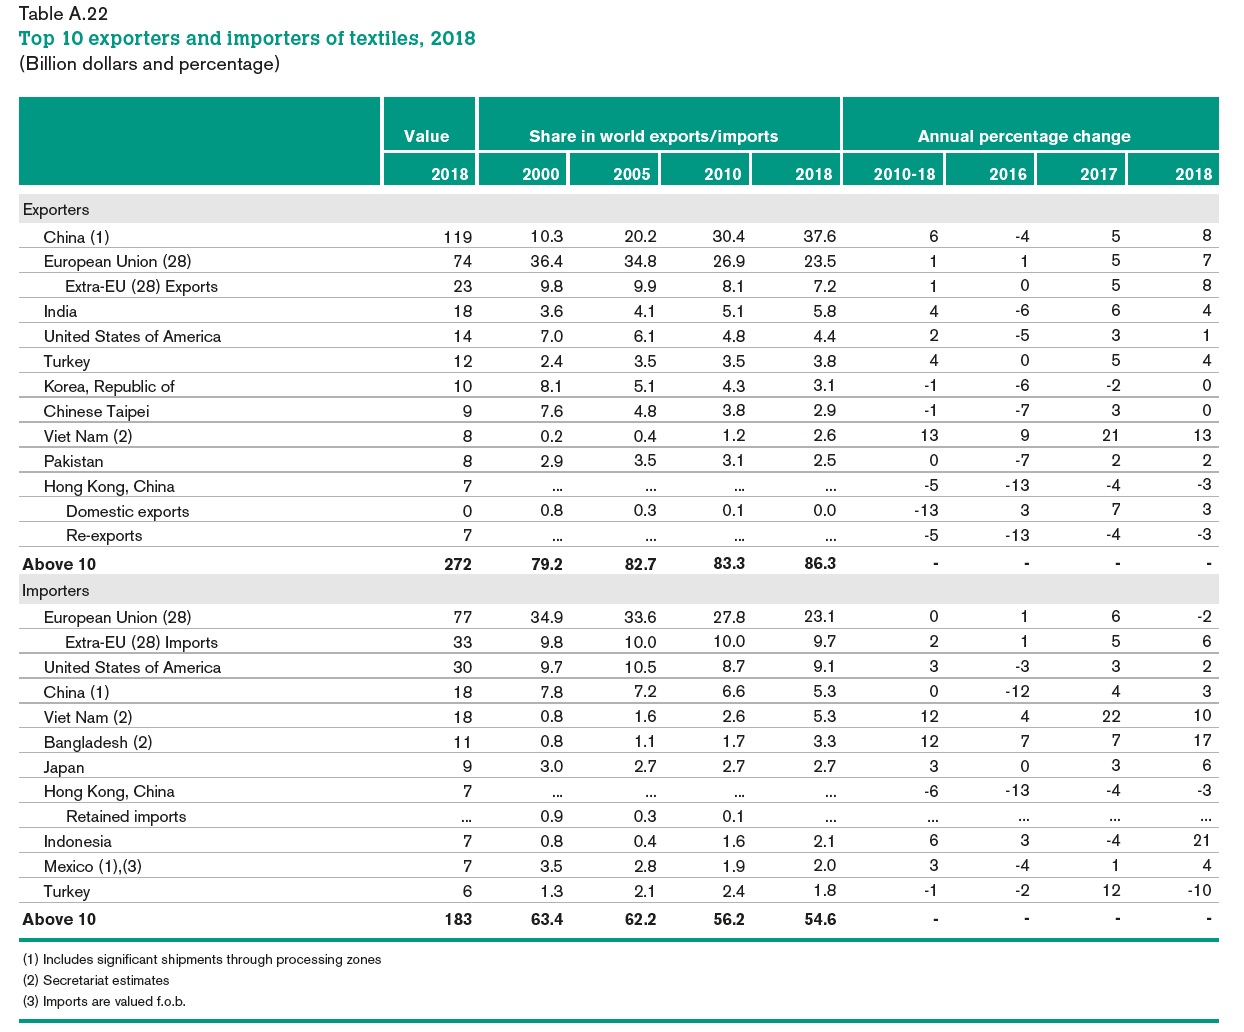
Pattern #5: Despite COVID-19, the world apparel import market continues to diversify. The import demand increasingly comes from emerging economies with a booming middle class.
Affected by consumers’ purchasing power (often measured by GDP per capita) and the size of the population, the European Union, the United States, and Japan remained the world’s three largest apparel importers in 2020, a stable pattern that has lasted for decades. While these top three still absorbed 56.2% of the world’s apparel imports in 2020, it was a new record low in the past ten years (was 58.1% in 2019 and 61.5% in 2018), and much lower than 84% back in 2005.
Behind the numbers, it is not the case that consumers in the EU, the United States, and Japan necessarily purchase less clothing over the years. Instead, several emerging economies have become fast-growing apparel-consuming markets with robust import demand. For example, despite COVID-19, China’s apparel imports totaled $9.5bn in 2020, up 6.5% from 2019. From 2010 to 2020, China’s apparel imports enjoyed a nearly 15% annual growth, compared with only 0.56% of the traditional top three. Around 30% of China’s apparel imports today are luxury items made in the EU.
Impact of COVID19 on Fashion Companies’ Businesses
The overwhelming majority of respondents report “economic and business impacts of the coronavirus (COVID-19)” as their top business challenge in 2020. The business difficulties caused by COVID-19 will not go away anytime soon, and U.S. fashion companies have to prepare for a medium to the long-term impact of the pandemic.
COVID-19 has caused severe supply chain disruptions to U.S. fashion companies. The disruptions come from multiple aspects, ranging from a labor shortage, shortages of textile raw materials, and a substantial cost increase in shipping and logistics.
COVID-19 has resulted in a widespread sales decline and order cancellation among U.S. fashion companies. Almost all respondents (96 percent) expect their companies’ sales revenue to decrease in 2020.
As sales drop and business operations are significantly disrupted, not surprisingly, all respondents (100 percent) say they more or less have postponed or canceled sourcing orders. Nearly half of self-identified retailers say the sourcing orders they canceled or postponed go beyond the 2nd quarter of 2020. Another 40 percent expect order cancellation and postponement could extend further to the fourth quarter of 2020 or even beyond. The order cancellation or postponement has affected vendors in China, Bangladesh, and India the most.
Impact of COVID-19 and US-China Trade War on Fashion Companies’ Sourcing
As high as 90 percent of respondents explicitly say, the U.S. Section 301 action against China has increased their company’s sourcing cost in 2020, up from 63 percent last year.
COVID-19 and the trade war are pushing U.S. fashion companies to reduce their “China exposure” further. While “China plus Vietnam plus Many” remains the most popular sourcing model among respondents, around 29 percent of respondents indicate that they source MORE from Vietnam than from China in 2020, up further from 25 percent in 2019.
As U.S. fashion companies are sourcing relatively less from China, they are moving orders mostly to China’s competitors in Asia. All respondents (100 percent) say they have “moved some sourcing orders from China to other Asian suppliers” this year, up from 77 percent in 2019.
However, no clear evidence suggests that U.S. fashion companies are sourcing more from the Western Hemisphere because of COVID-19 and the U.S.-China trade war.
Emerging Sourcing Trends
Sourcing diversification is slowing down, and more U.S. fashion companies are switching to consolidate their existing sourcing base. Close to half of the respondents say they plan to “source from the same number of countries, but work with fewer vendors,” up from 40 percent in last year’s survey.
China most likely will remain a critical sourcing base for U.S. fashion companies. However, non-economic factors could complicate companies’ sourcing decisions. Benefiting from U.S. fashion companies’ reduced sourcing from China, Vietnam and Bangladesh are expected to play a more significant role as primary apparel suppliers for the U.S. market.
Given the supply chain disruptions experienced during the pandemic, U.S. fashion companies are more actively exploring “Made in the USA” sourcing opportunities to improve agility and flexibility and reduce sourcing risks. Around 25 percent of respondents expect to somewhat increase sourcing locally from the U.S. in the next two years, which is the highest level since 2016.
US-Mexico-Canada Trade Agreement (USMCA)
For companies that were already using NAFTA for sourcing, the vast majority (77.8 percent) say they are “ready to achieve any USMCA benefits immediately,” up more than 31 percent from 2019. Even for respondents who were not using NAFTA or sourcing from the region, about half of them this year say they may “consider North American sourcing in the future” and explore the USMCA benefits. Some respondents expressed concerns about the rules of origin changes. These worries seem to concentrate on denim products in particular.
African Growth and Opportunity Act (AGOA)
Close to 37 percent of respondents say they have been sourcing MORE textile and apparel from sub-Saharan Africa (SSA) since the latest AGOA renewal in 2015, a substantial increase from 27 percent in the 2019 survey. More than 40 percent of respondents say AGOA and its “third-country fabric provision” are critical for their sourcing from the SSA region. More than 40 percent of respondents say AGOA and its “third-country fabric provision” are critical for their sourcing from the SSA region.
However, respondents still demonstrate a low level of interest in investing in the SSA region directly. Around 27 percent of respondents say the temporary nature of AGOA and the uncertainty associated with the future of the agreement have discouraged them.
With AGOA’s expiration date quickly approaching, the discussions on the future of the agreement and the prospect of sourcing from SSA begin to intensify. Among the various policy options to consider, “Renew AGOA for another ten years with no major change of its current provisions” and “Replace AGOA with a permanent free trade agreement that requires reciprocal tariff cut and continues to allow the third-country fabric provision” are the most preferred by respondents.
The latest statistics from the Office of Textiles and Apparel (OTEXA) show that while the negative impacts of COVID-19 on U.S. apparel imports continued in June 2020, there appeared to be early signs of economic recovery. Specifically:
While the value of U.S. apparel imports decreased by 42.8% in June 2020 from a year ago, the speed of the decline has slowed (was down 60% year over year in May 2020). Nevertheless, between January and June 2020, the value of U.S. apparel imports decreased by 30.4% year over year, which has been much worse than the performance during the 2008-2009 global financial crisis (down 11.8%).
The latest trade statistics support the view that U.S. fashion companies continue to treat China as an essential apparel-sourcing base, despite COVID-19, the trade war, and companies’ sourcing diversification strategy. As the first country hit by COVID-19, China’s apparel exports to the U.S. dropped by as much as 49.0% from January to June 2020 year over year. In February 2020, China’s market shares slipped to only 11%, and both in March and April 2020, U.S. fashion companies imported more apparel from Vietnam than from China. However, China’s apparel exports to the U.S. are experiencing a “V-shape” recovery: as of June 2020, China had quickly regained its position as the top apparel supplier to the U.S., with a 29.1% market share in value and 43.4% share in quantity.
Moreover, U.S. apparel imports from China are also becoming more price-competitive—the unit price slipped from $2.25/Square meters equivalent (SME) in 2019 to $1.88/SME in 2020 (January to June), or down more than 16% (compared with a 4.6% price drop of the world average). As of June 2020, the unit price of U.S. apparel import from China was only 65% of the world average, and around 25—35 percent lower than those imported from other Asian countries. On the other hand, the official Chinese statistics report a 19.4% drop in China’s apparel exports to the world in the first half of 2020.
Despite Covid-19, Asia as a whole remains the single largest source of apparel for the U.S. market. Other than China, Vietnam (20.3% YTD in 2020 vs. 16.2% in 2019), ASEAN (34.4% YTD in 2020 and vs. 27.4% in 2019), Bangladesh (8.9% YTD in 2020 vs.7.1% in 2019), and Cambodia (4.5% YTD in 2020 vs. 3.2% in 2019) all gain additional market shares in 2020 from a year ago.
However, still, no clear evidence suggests that U.S. fashion brands and retailers have been giving more apparel sourcing orders to suppliers from the Western Hemisphere because of COVID-19 and the trade war. In the first six months of 2020, only 8.8% of U.S. apparel imports came from CAFTA-DR members (down from 10.3% in 2019) and 4.2% from NAFTA members (down from 4.5% in 2019).
Notably, U.S. fashion companies source products from Asia (including China) and the Western Hemisphere for different purposes. In general, US companies tend to source either price-sensitive or more sophisticated items from Asia, where factories overall have higher productivity and more advanced production techniques. Meanwhile, the Western Hemisphere is typically used to source products that require faster speed-to-market or more frequent replenishments during the selling season. Some studies further show that there is more divergence in the products imported into the United States from Asian countries and the Western Hemisphere from 2015 to 2019. In contrast, over the same period, China, ASEAN, and Bangladesh appear to be exporting increasingly similar products to the United States.
That being said, as USMCA enters into force on July 1, 2020, a more stable trading environment could encourage more U.S. apparel sourcing from Mexico down the road (assuming garment factories there can gradually resume production and no further COVID-19 related shutdown).
As a reflection of weak demand, the unit price of U.S. apparel imports dropped in the first six months of 2020 (price index =100, meaning the same nominal price as in 2010). The price index was 104.7 in 2019. The imports from Mexico (price index =87.1 YTD in 2020 vs. 112.1 in 2019) and China (price index = 69.9 YTD in 2020 vs. 83.5 in 2019) have seen the most notable price decrease so far.
First, the volume of world textiles and apparel trade reduced in 2019 due to weakened demand and the negative impacts of trade tensions. According to the WTO, the value of the world textiles (SITC 65) and apparel (SITC 84) exports totaled $305bn and $492bn in 2019, respectively, decreased by 2.4% and 0.4% from a year ago. The world merchandise trade also fell by nearly 3% measured by value and 0.1% measured by volume 2018-2019, in contrast with a positive 2.8% growth 2017-2018. Put these numbers in context, the year 2019 was the first time that world merchandise trade fell since the 2008 global financial crisis, and the decline happened even before the pandemic. As noted by the WTO, the economic slowdown and the escalating trade tensions, particularly the tariff war between the United States and China, were among the major contributing factors for the contraction of trade flows.
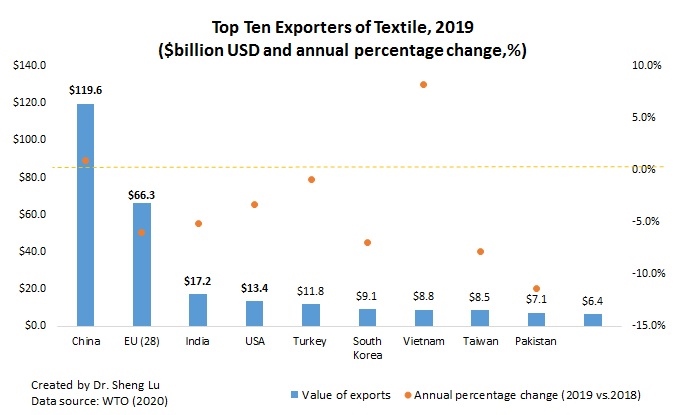
Second, the pattern of world textile exports overall stays stable in 2019; Meanwhile, China and Vietnam continue to gain momentum. China, European Union (EU28), and India remained the world’s top three exporters of textiles in 2019. Altogether, these top three accounted for 66.9% of the value of world textile exports in 2019, almost no change from two years ago. Notably, despite the headwinds, China and Vietnam stilled enjoy the positive growth of their textile exports in 2019, up 0.9%, and 8.3%, respectively. In particular, Vietnam exceeded Taiwan and ranked the world’s seventh-largest textile exporter in 2019 ($8.8bn of exports, up 8.3% from a year earlier), the first time in history. The change also reflects Vietnam’s efforts to continuously upgrade its textile and apparel industry and strengthen the local textile production capacity are paying off.
Third, the pattern of world apparel exports reflects fashion companies’ shifting strategies to reduce sourcing from China. China, the European Union (EU28), Bangladesh, and Vietnam unshakably remained the world’s top four exporters of apparel in 2019. Altogether, these top four accounted for as much as 71.4% of world market shares in 2019, which, however, was lower than 74% from 2016 to 2018—primarily due to China’s reduced market shares.
China is exporting less apparel and more textiles to the world. Notably, China’s market shares in world apparel exports fell from its peak of 38.8% in 2014 to a record low of 30.8% in 2019 (was 31.3% in 2018). Meanwhile, China accounted for 39.2% of world textile exports in 2019, which was a new record high. It is important to recognize that China is playing an increasingly critical role as a textile supplier for many apparel-exporting countries in Asia.
On the other hand, even though apparel exports from Vietnam (up 7.7%) and Bangladesh (up 2.1%) enjoyed fast growth in absolute terms in 2019, their gains in market shares were quite limited (i.e., no change for Vietnam and marginally up 0.3 percentage point from 6.8% to 6.5% for Bangladesh). This result indicates that due to capacity limits, no single country has yet emerged to become the “Next China.” Instead, China’s lost market shares in apparel exports were fulfilled by a group of Asian countries altogether.
Fourth, associated with the shifting pattern of world apparel production, the world textile import is increasingly driven by apparel-exporting countries in the developing world. Notably, 2019 marks the first time that Vietnam emerged to become one of the world’s top three largest importers of textiles, primarily due to its expanded apparel production and heavy dependence on imported textile raw materials. In comparison, although the US and the EU remain the world’s top two largest textile importers, their total market shares had declined from nearly 40% in 2010 to only 31.2% in 2019, the lowest in the past ten years. Furthermore, both the US and the EU have been importing more finished textile products (such as home furnishings and carpets) as well as highly specialized technical textiles, rather than conventional yarns and fabrics for apparel production purposes. The weakening import demand for intermediary textile raw materials also suggests that reshoring (i.e., making apparel locally rather than sourcing from overseas) has NOT become a mainstream industry practice in the developed economies like the US and the EU.
Fifth, the world apparel import market is becoming ever more diversified as import demand is increasingly coming from emerging economies with a booming middle class. Affected by consumers’ purchasing power (often measured by GDP per capita) and size of the population, the European Union (EU28), US, and Japan remained the world’s top three importers of apparel in 2019. This pattern has lasted for decades. Altogether, these top three absorbed 58.1% of world apparel in 2019, which, however, was a new historic low (was 84% back in 2005). Behind the numbers, it is not the case that consumers in the EU, US, and Japan are necessarily purchasing less clothing. Instead, several emerging economies are becoming fast-growing apparel consumption markets and starting to import more. For example, China’s apparel imports totaled $8.9bn in 2019, up 8.1% from a year earlier. From 2010 to 2019, China’s apparel imports enjoyed a nearly 15% annual growth, compared with only 1.9% of the traditional top three.
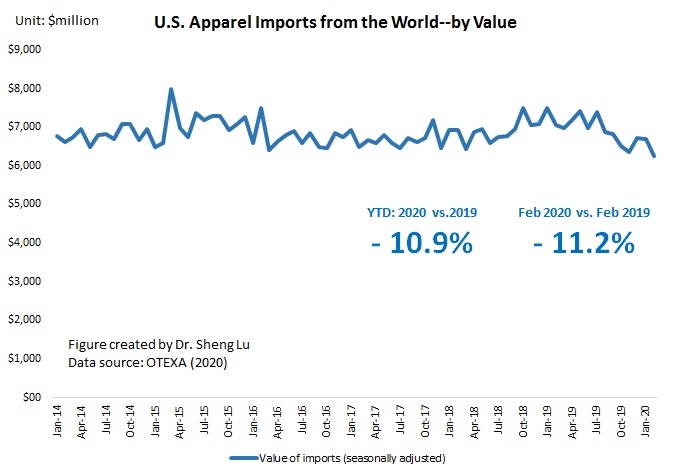
The spread of the coronavirus (COVID-19) has already resulted in a plummet of U.S. apparel imports that we have never seen in history. According to latest statistics from the Office of Textiles and Apparel (OTEXA) under the U.S. Department of Commerce, as of February 2020:
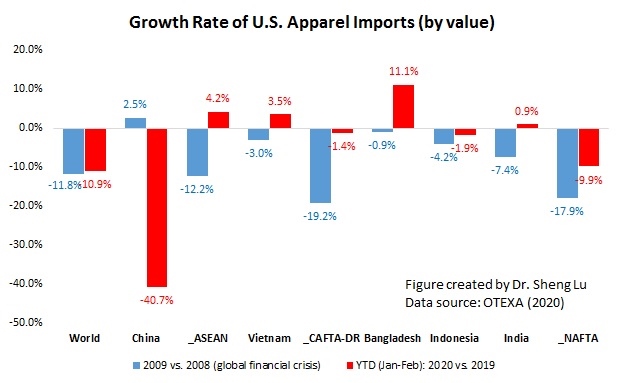
The value of U.S. apparel imports sharply decreased by 11.2% in February 2020 from a year earlier. Between January and February 2020, the amount of U.S. apparel imports decreased by 10.9% year over year, which is nearly the same loss as in the 2008-2009 global financial crisis.
As the first country took a hit by COVID-19, China’s apparel exports to the United States nearly collapsed in February 2020–down as much as 46.1% compared with a year ago (and -40.6% drop YTD). This result is also worse than the official Chinese statistics, which reported an overall 20% drop in China’s apparel exports in the first two months of 2020).
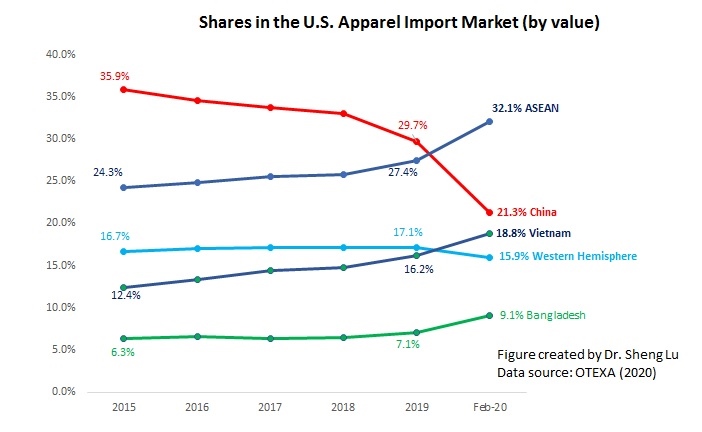
China’s market shares in the U.S. apparel import market dropped to 21.3% in February 2020, a new record low in history (was 30% in 2019 and 23.9% in January 2020). However, it is important to note that such a downward trend started in October 2019, as U.S. fashion brands and retailers were eager to reduce their exposure to sourcing from China.
China’s lost market shares have been picked up mostly by other Asian suppliers, particularly Vietnam (18.8% YTD in 2020 vs. 16.2% in 2019) and Bangladesh (9.1% YTD in 2020 vs.7.1% in 2019). However, there is no clear evidence suggesting that U.S. fashion brands and retailers are giving more apparel sourcing orders to suppliers from the Western Hemisphere. In the first two months of 2020, only 9.5% of U.S. apparel imports came from CAFTA-DR members (down from 10.3% in 2019) and 4.2% from NAFTA members (down from 4.5% in 2019).
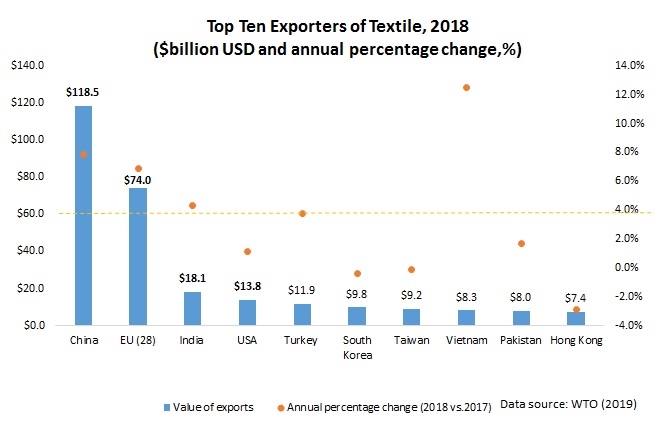
According to the World Trade Statistical Review 2019 newly released by the World Trade Organization (WTO), the current dollar value of world textiles (SITC 65) and apparel (SITC 84) exports totaled $315 billion and $505 billion in 2018 respectively, increased by 6.4% and 11.1% from a year earlier. This has been the fastest growth of world textile and apparel trade since 2012. Specifically:
I. Textile export
China, European Union (EU28), and India remained the world’s top three exporters of textiles in 2018. Altogether, these top three accounted for 66.9% of world textile exports in 2018, a new record high since 2011. Notably, China and EU (28) also enjoyed a faster-than-world-average export growth in 2018, up 7.9% and 6.9% respectively. The United States remained the world’s fourth top textile exporter in 2018, accounting for 4.4% of the shares, down slightly from 4.6% in 2017.
II. Apparel export
China, the European Union (EU28), Bangladesh, and Vietnam unshakably remained the world’s top four largest exporters in 2018. Altogether, these top four accounted for as much as 72.3% of world market shares in 2018, which, however, was lower than 75.8% in 2017 and 74.3% in 2016—primarily due to China’s declining market shares. Notably, even though apparel exports from Vietnam (up 13.4%) and Bangladesh (up 11.1%) enjoyed a fast growth in absolute terms in 2018, their gains in market shares were quite limited (up 0.3 percentage point from 5.9% to 6.2% for Vietnam and up 0.1 percentage point from 6.4% to 6.5% for Bangladesh). This result once again suggests that due to capacity limits, no single country has emerged to become the “Next China.” Instead, China’s lost market shares in apparel exports were fulfilled by a group of countries, a phenomenon which can be linked with fashion brands and retailers’ sourcing diversification strategy.
III. Textile import
The European Union (EU28), the United States, and China were the top three largest importers of textiles in 2018, accounting for 37.5% of the world’s total textile imports that year. Although the market shares of the top three in 2018 were close to 37.7% a year earlier, it nevertheless was much lower than over 50% back in the 2000s. The increasing diversification of textile import market is associated with the shifting pattern of world apparel manufacturing and export closely.
IV. Apparel import
Affected by consumers’ purchasing power (often measured by GDP per capita) and size of the population, the European Union, the United States, and Japan remained the world’s top three importers of apparel in 2018. Altogether, these top three absorbed 61.5% of world apparel in 2018, which, however, was lower than 62.3% in 2017 and a significant drop from 84% back in 2005. Behind the result, it is not the case that consumers in the EU, U.S., and Japan are importing less clothing. Instead, several emerging economies (such as China) are becoming fast-growing apparel consumption markets and starting to import more. As consumers’ purchasing power in these emerging economies continues to improve, we could expect a more diversified world apparel import market in the years ahead.
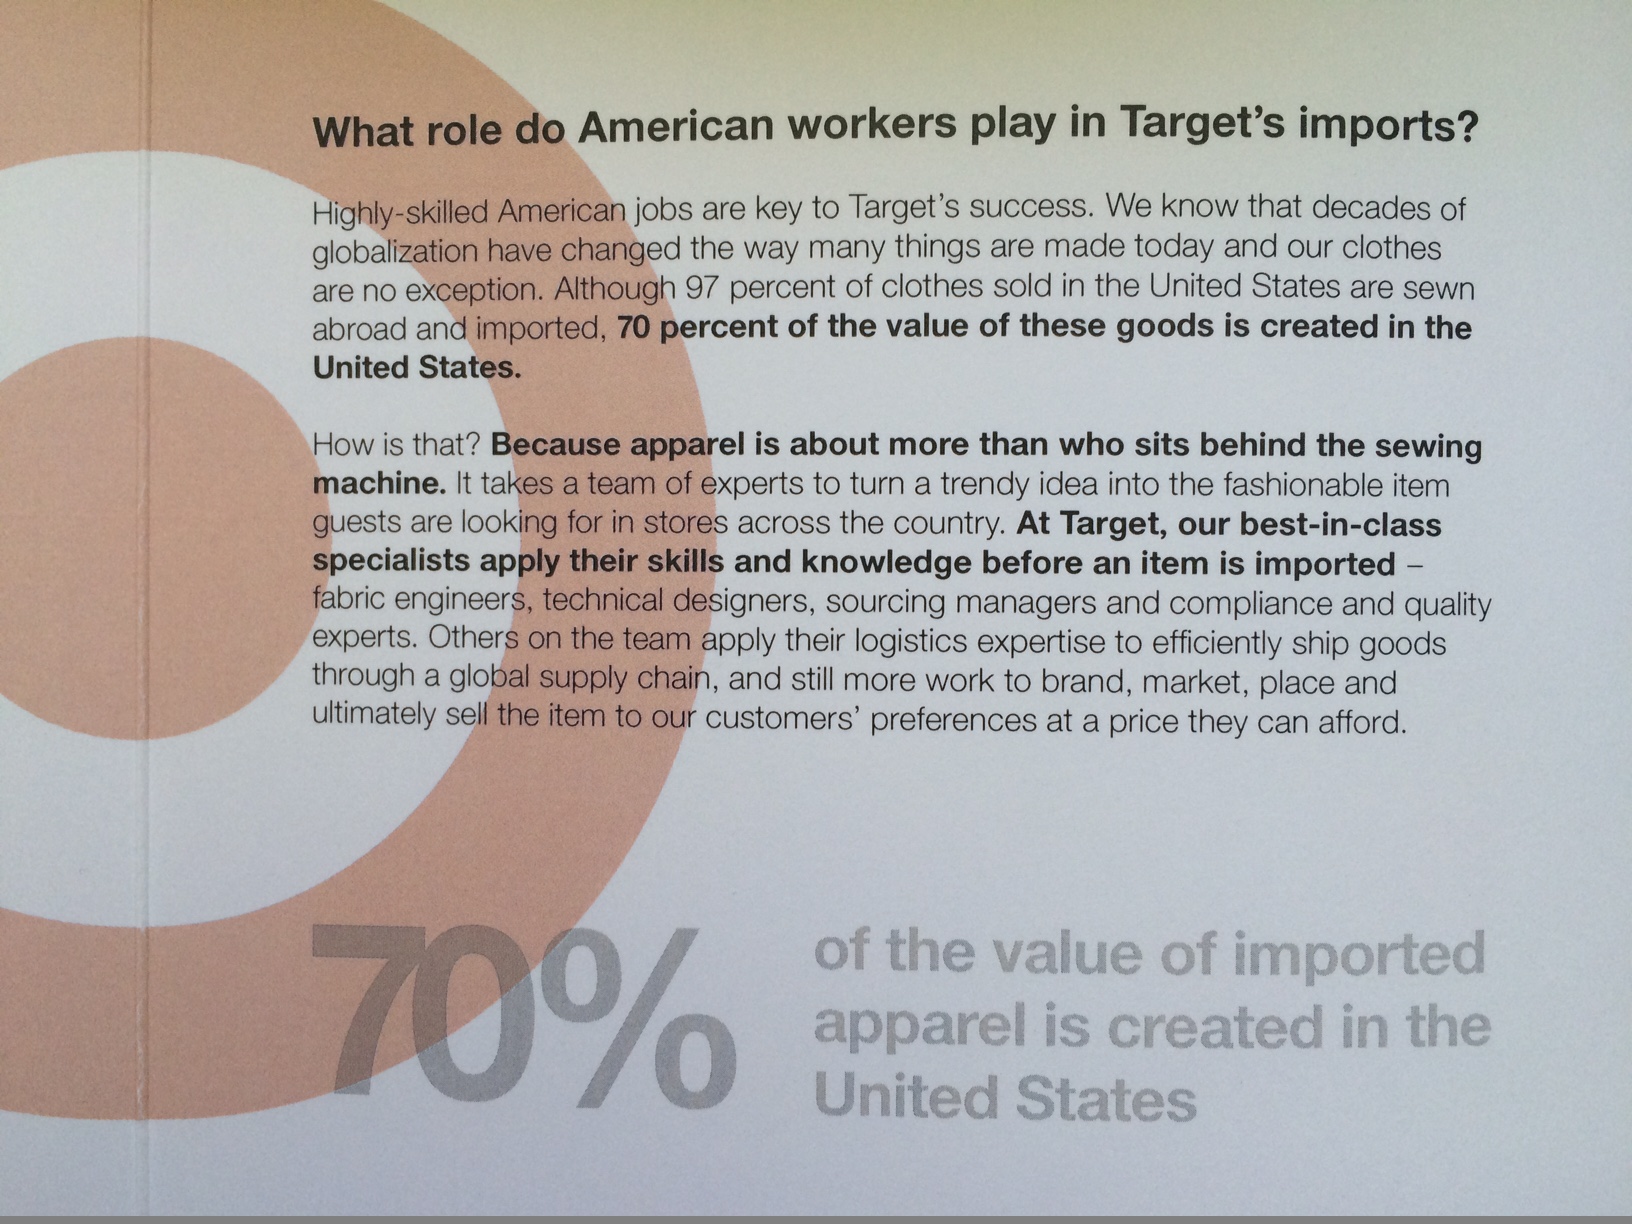
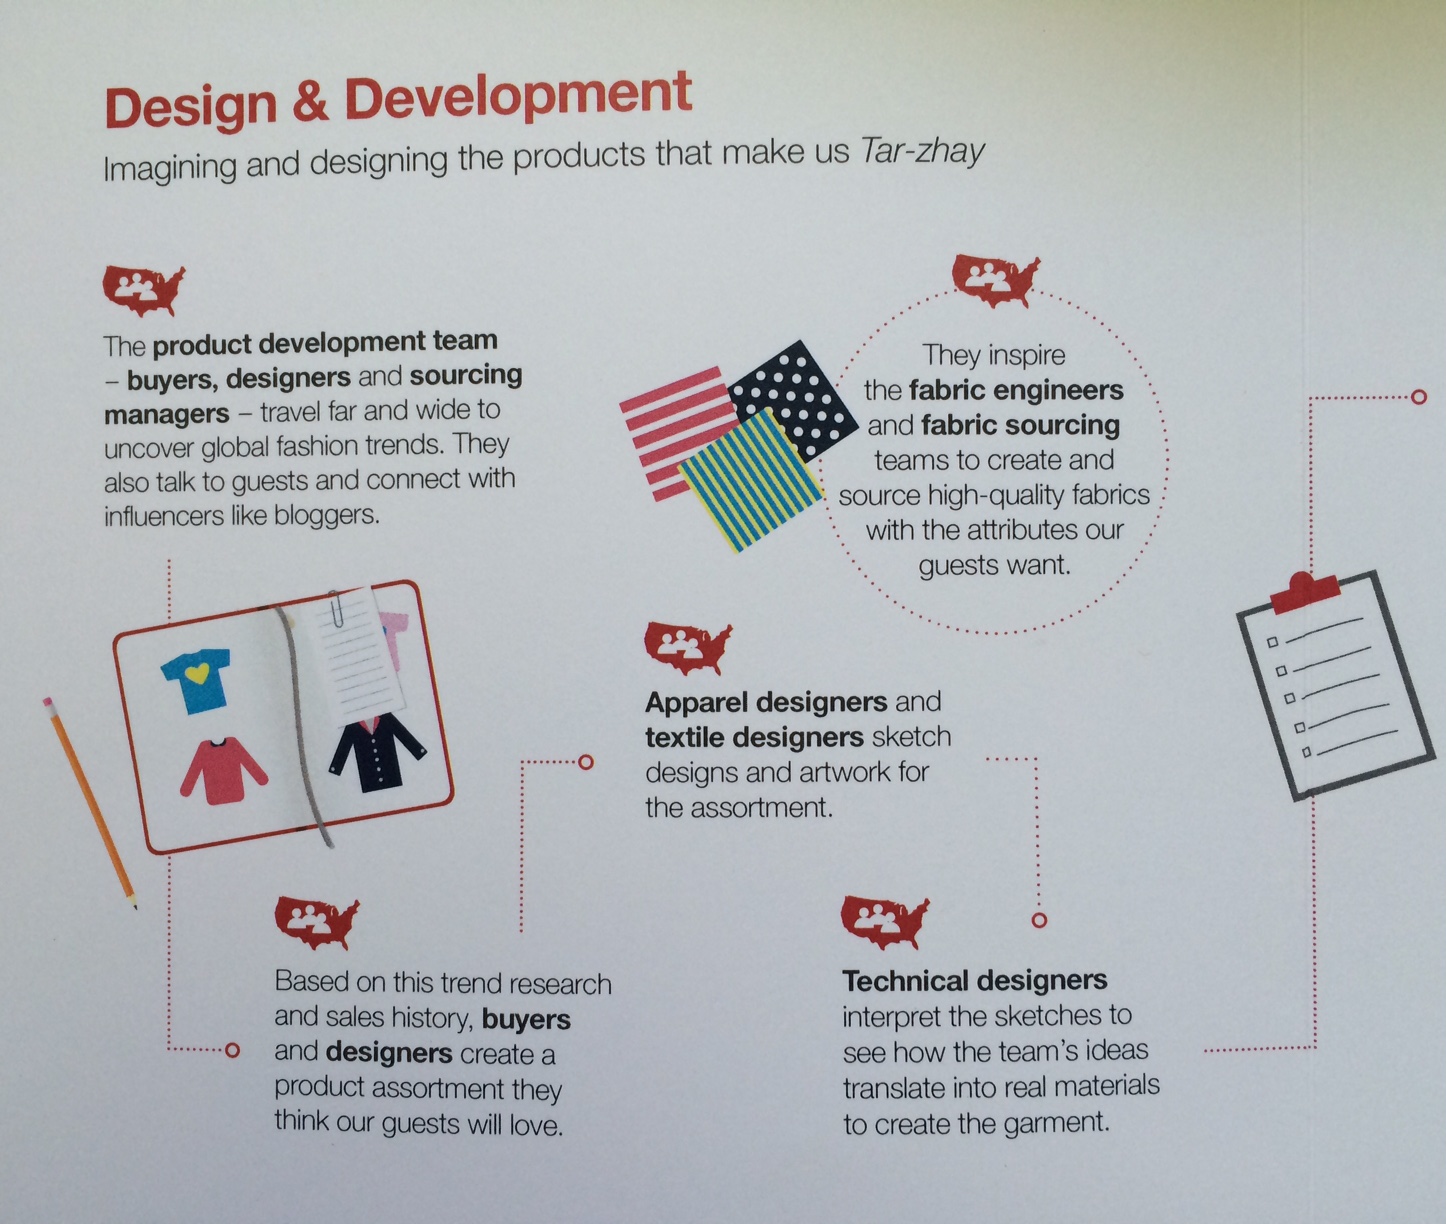
A global view in mind means more career opportunities: except material production and cut and sew, other well-paid jobs in the apparel value chain stay in the United States.
Source: Moongate Association (2017). Analyzing the Value Chain for Apparel Designed in the United States and Manufactured Overseas
A fact-checking review of trade statistics in 2016 of a total 167 categories of T&A products categorized by the Office of Textiles and Apparel (OTEXA) suggests that textile and apparel (T&A) “Made in China” have no near competitors in the U.S. import market. Specifically, in 2016:
Of the total 11 categories of yarn, China was the top supplier for 2 categories (or 18%);
Of the total 34 categories of fabric, China was the top supplier for 25 categories (or 74%);
Of the total 106 categories of apparel, China was the top supplier for 88 categories (or 83%);
Of the total 16 categories of made-up textiles, China was the top supplier for 12 categories (or 68%);
In comparison, for those Asian T&A suppliers regarded as China’s top competitors:
Vietnam was the top supplier for only 5 categories of apparel (less than 5% of the total);
Bangladesh was the top supplier for only 2 categories of apparel (less than 2% of the total)
India was the top supplier for 2 categories of fabric (9% of the total), one category of apparel (1% of the total) and 5 categories of made-up textiles (41.7% of the total)
Notably, China not only was the top supplier for many T&A products but also held a lion’s market shares. For example, in 2016:
For the 34 categories of fabric that China was the top supplier, China’s average market shares reached 41%, 23 percentage points higher than the 2nd top suppliers for these categories
For the 88 categories of apparel that China was the top supplier, China’s average market shares reached 53%, 38 percentage points higher than the 2nd top suppliers for these categories.
For the 16 categories of made-up textiles that China was the top supplier, China’s average market shares reached 57%, 40 percentage points higher than the 2nd top suppliers for these categories.
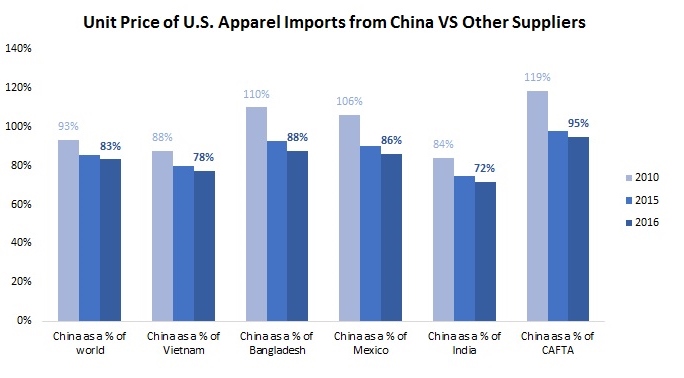
It is also interesting to see that despite the reported rising labor cost, T&A “Made in China” are NOT becoming more expensive. On the contrary, the unit price of U.S. T&A imports from China in 2016 was 6.8% lower than a year earlier, whereas over the same period the unit price for U.S. T&A imports from rest of the world only declined by 2.9%.
Furthermore, T&A “Made in China” are demonstrating even bigger price competitiveness compared with other suppliers to the U.S. market. For example, in 2016, the unit price of “Made China” was only 78% of the price of “Made in Vietnam” (in 2012 was 89%), 88% of “Made in Bangladesh” (in 2012 was 100%), 86% of “Made in Mexico” (in 2012 was 103%) and 72% of “Made in India” (in 2012 was 81%).
Are the results surprising? How to explain China’s demonstrated price competitiveness despite its reported rising labor cost? What’s your outlook for the future of China as a sourcing destination for U.S. fashion brands and retailers? Please feel free to share your views.
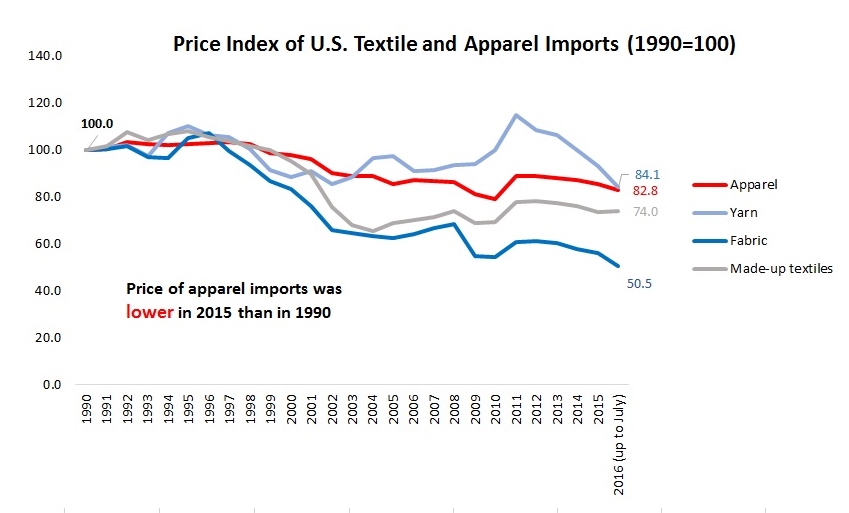
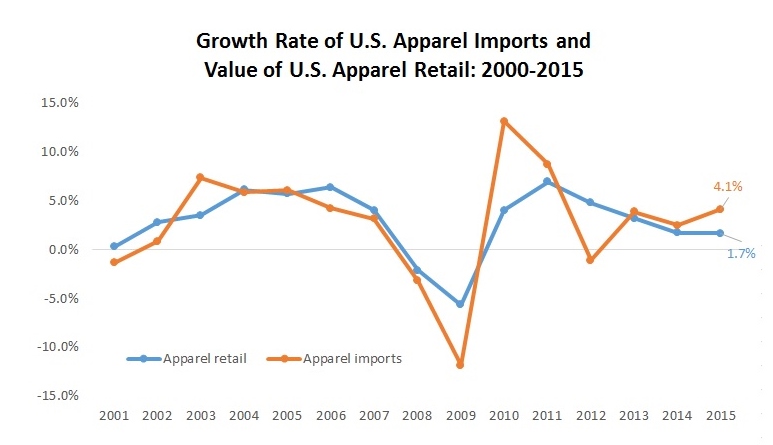
U.S. textile and apparel imports enjoy steady growth from 2000 to 2015. Specifically, the value of U.S. textile imports reached $26,763 million in 2015, up 4.2 percent from 2014 and 85.1 percent from 2000. The value of U.S. apparel imports reached $85,165 million in 2015, up 4.1 percent from 2014 and 48.8 percent from 2000. It is forecasted that the value of U.S. textile and apparel imports could reach $27,355 million (up 2.2 percent) and $85,719 million (up 0.7 percent) respectively in 2016.
Because the United States is no longer a major apparel manufacturer but one of the largest apparel consumption markets in the world, apparel products accounted for 76.1 percent of total U.S. textile and apparel imports in 2015, followed by made-up textiles (16.9 percent), fabrics (5.8 percent) and yarns (1.3 percent).
In terms of source of products, U.S. imported apparel from as many as 150 countries in 2015. However, Herfindahl index reached 0.15 for knitted apparel (HS chapter 61) and 0.18 for woven apparel (HS chapter 62) in 2015, suggesting this is a market with a high concentration of supplying countries. Specifically, all top apparel suppliers to the United States in 2015 (by value) are developing countries and most of them are located in Asia, including China (35.9 percent), Vietnam (12.4 percent), Bangladesh (6.3 percent), Indonesia (5.8 percent), India (4.3 percent) and Mexico (4.2 percent).
U.S. textile and apparel imports are also becoming even cheaper. For example, U.S. apparel imports in 2015 on average was only 85.7 percent of the price in 1990 and the price of imported fabrics cut almost by half over the same period.
From 2013 to 2015, the fastest growing textile and apparel import categories unusually include several fabric products, such as blue denim (OTEXA code 225, up 74.8%), Cheesecloths (OTEXA code 226, up 74.3%) and woven fabrics (OTEXA code 611, up 49.3%). It is likely that the growing business of apparel “Made in USA” has led to an increased demand for imported fabrics.
Additionally, U.S. apparel imports overall mirror the pattern of apparel retail sales in the U.S. market. This reflects the fact that the performance of the U.S. economy is the leading factor shaping the size of demand for imported apparel. It is also interesting to note that the value of U.S. apparel imports grew at a faster rate than the value of U.S. apparel retail sales in 2015 (4.1 percent v.s. 1.7 percent), suggesting import penetration ratio (i.e. the percentage of apparel consumed in the United States that is supplied by imports) continues to rise.
Data source: Office of Textiles and Apparel (OTEXA), U.S. Department of Commerce
According to Thanh Nien News, Vietnam’s textile and apparel (T&A) exports only increased 5.1 percent to $10.7 billion in the first half of 2016. This was the lowest growth rate since 2010. Data from the General Statistics Office of Vietnam shows that Vietnam’s T&A exports totaled $22.63 million in 2015, up 8.2 percent from a year earlier.
In the U.S. market, apparel imports from Vietnam also see a much slower growth in the first five months of 2016: 4.1% by value (compared with 13.1% on average between 2010 and 2015) and 5.0% by quantity (compared with 11.8% on average between 2010 and 2015).
The new trade data echos the findings in the latest 2016 US Fashion Industry Benchmarking Study. Although Vietnam remains one of the top sourcing destinations, respondents seem to be more conservative about Vietnam’s growth potential in the next two years. Only 4 percent of respondents expect a strong increase of sourcing value or volume from the country, which is a substantial drop from 21.4 percent in the 2015 study.
In January 2015, Mexico announced a set of new measures aimed at combating “unfair” trade practices in T&A imports and enhancing the competitiveness of domestic T&A sector in the face of increasing foreign competition.
The proposed measures will particularly target those imports considered to be “undervalued” by the Mexican government. According to Inside US Trade and Sourcing Journal Online, one of these measures is to establish a minimum reference price for imported T&A products. If shipments enter at below that price, they would be subject to an investigation by the Mexican government that could lead to the imposition of additional duties and taxes. To be noted, the proposed new measures will be taken separately from traditional trade remedy measures such as anti-dumping, countervailing duty and safeguard.
Other proposed measures intend to strengthen custom enforcement, including:
Mexico will required a mandatory registry for T&A imports. A similar registry system has been required for footwear;
Mexico will postpone the import duty reduction that was expected to be implemented at the beginning of 2016 on 73 apparel items and seven textile made-ups. Originally slated to enter into force on January. 1, 2013, the duty reduction from 25 percent to 20 percent has been twice postponed for one-year periods and will now be delayed until 2018;
Importers will be required to provide advance notice of shipments to the Mexican Economy Secretariat in the future;
Mexico will break down the current eight-digit tariff lines for textile and apparel products into 10 digits, which an industry source said would allow tariff rates to be more specific in light of the fact that apparel products have evolved to be more specialized;
Moreover, Mexico will implement a new financing mechanism with total available credit of 450 million pesos (around $30 million USD) over the next 12 months to help the domestic T&A industry (especially small- and medium-sized enterprises) upgrade their machinery and equipment, pursue innovative strategies and develop new products. The Mexican Service Agency for the Commercialization and Development of Agricultural Markets (Aserca) will further support the purchase of cotton from domestic growers by textile manufacturers.
According to WWD, the US T&A industry has three major concerns about Mexican’s proposed measures: one is the potential delay in custom clearance and more complicated documentation requirements; second is the additional tariff rate and increased cost of exporting from the United States or anywhere else in the world to Mexico; third is the lack of policy transparency adding to the potent business risks.
Industry Background
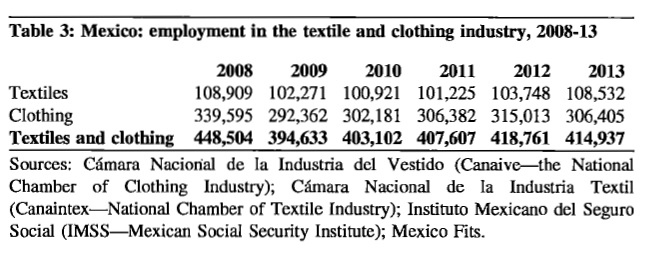
T&A industry accounted for 3.7 percent of Mexico’s GDP in 2013 (1.3 percent for textiles and 2.5 percent for apparel). About 415,000 workers directly employed in the sector in 2013, among which 74 percent worked for the apparel sector.
One important feature of Mexico’s T&A industry is the so called “Maquiladora” operation: simple sewing of garments made from imported fabrics and using cheap labor. The “Maquiladora” operation is largely coordinated by US-based apparel brands and retailers. Most of “Maquiladora” factories are located in the free trade zones, in which equipment and imported materials (such as fabrics) can be duty-free. Output of “Maquiladora” are exported, mostly to the United States.
Mexico imported $8.6 billion T&A in 2013, among which $2.4 billion were fabrics, followed by made-up textiles ($0.55 billion) and yarns ($0.39 billion). This pattern reveals Mexico’s heavy reliance on imported textiles due to limited domestic textile manufacturing capacity.
At the same time, Mexico’s apparel imports increased from $2.4 billion in 2008 to $2.9 billion in 2013. Particularly, Mexico’s apparel imports from China surged by 558.8 percent between 2008 and 2013. In 2013 alone, apparel imports from China went up by 42.1% to $0.97 billion. It is said that China is the main target of Mexico’s proposed new import measures.