Background
In March 2026, the Office of the U.S. Trade Representative (USTR) initiated a new Section 301 investigation on Structural Excess Capacity and Production in Manufacturing Sectors. USTR defined “structural excess capacity” as “underutilized industrial production capacity that is sustained through governmental interventions or policies incentivizing companies to maintain or grow their unused capacity inefficiently.”
The investigation departs from a conventional Section 301 investigation in several ways: 1) instead of targeting a single country, the investigation targets as many as 16 countries, including China, the European Union, Singapore, Switzerland, Norway, Indonesia, Malaysia, Cambodia, Thailand, Korea, Vietnam, Taiwan, Bangladesh, Mexico, Japan and India ; 2) instead of targeting a specific policy practice, the investigation targets “structural excess capacity and production,” which can be linked to many different practices, such as government subsidies and state-owned enterprises (SOEs); 3) instead of focusing on a specific sector, the investigation is cross-sectoral, which could include textiles and apparel and extend to the entire manufacturing sector.
During the public comment period, several leading U.S. and foreign textile and apparel trade associations and companies submitted their comments regarding the investigation and proposed policy actions. These comments disagree on whether “structural excess capacity” existed in the textile and apparel industries and on whether additional U.S. import tariffs would be the appropriate approach to address the problem.
Arguments that there is a “structural excess capacity” problem in textiles and apparel
U.S.-based textile manufacturers and associated industry groups, in general, argue that there is a “structural excess capacity” problem in textiles and apparel manufacturing. They believe that excessive capacity exists when production infrastructure is built and maintained beyond what market demand alone would support and justify. They also regard government intervention, such as providing subsidies, as a main cause of the excess capacity problem. These groups primarily cite perceived low utilization of production capacity and government policy documents as their supporting evidence. Specifically:
- Unifi Manufacturing Ltd. (“Unifi”) and Nan Ya Plastics “Nan Ya” (note: U.S.-based textile yarn producers): Data from subscription service Wood Mackenzie showed that textured filament production capacity utilization rate in several Asian countries remained “low” or “underutilized,” including Bangladesh (66% in 2025 and 66% in 2026), China (74% in 2025 and 75% in 2026), India (70% in 2025 and 67% in 2026), Malaysia (65% in 2025 and 64% in 2026), Pakistan (both 68% in 2025 and 2026), South Korea (47% in 2025 and 45% in 2026), Taiwan (41% in 2025 and 40% in 2026) and Vietnam (35% in 2024 and 37% in 2026).
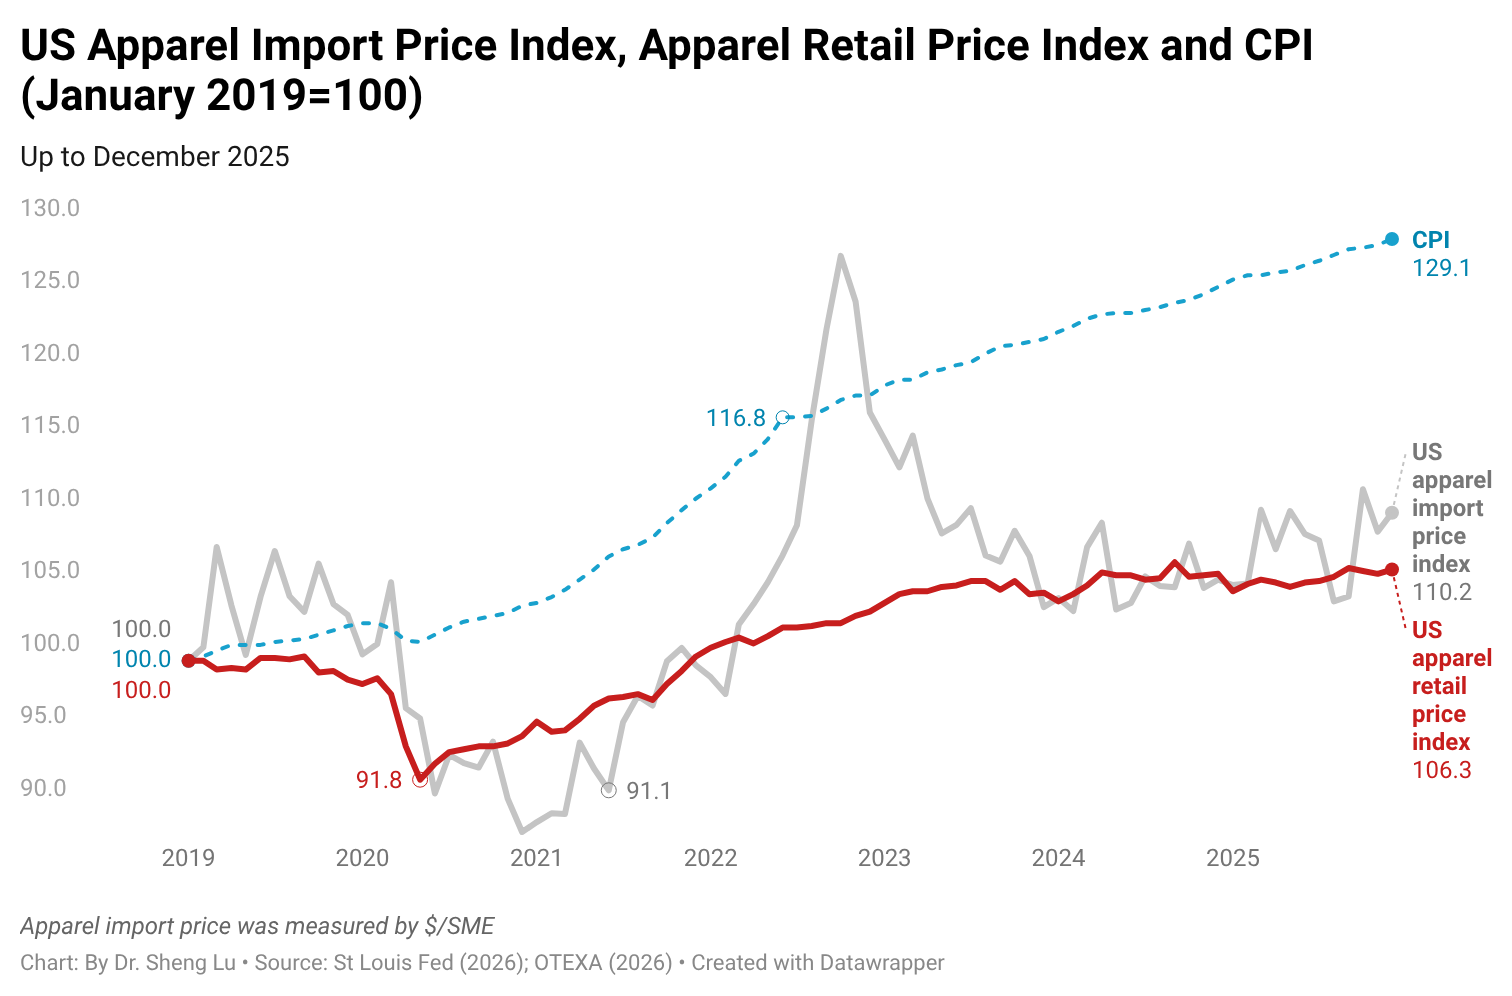
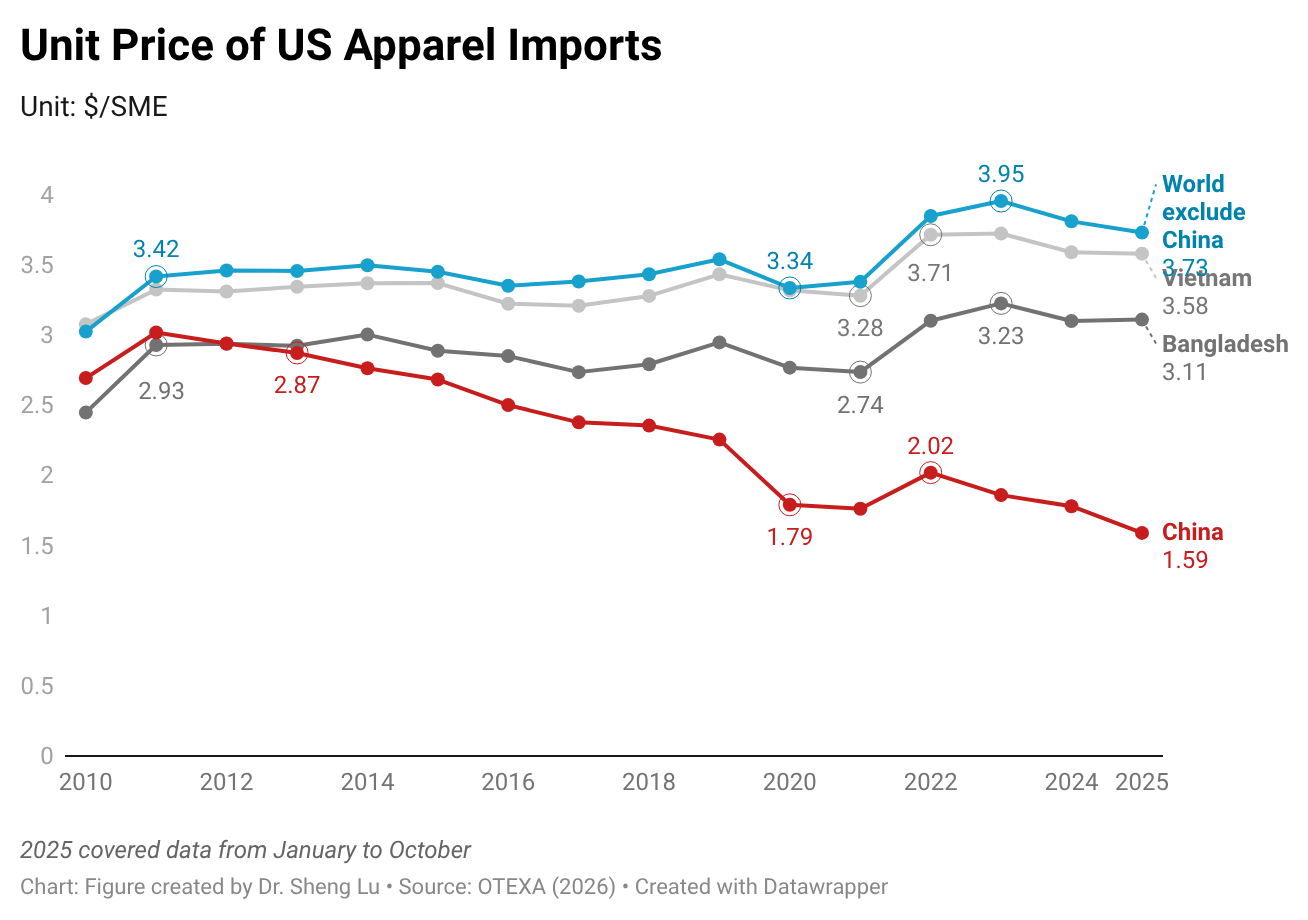
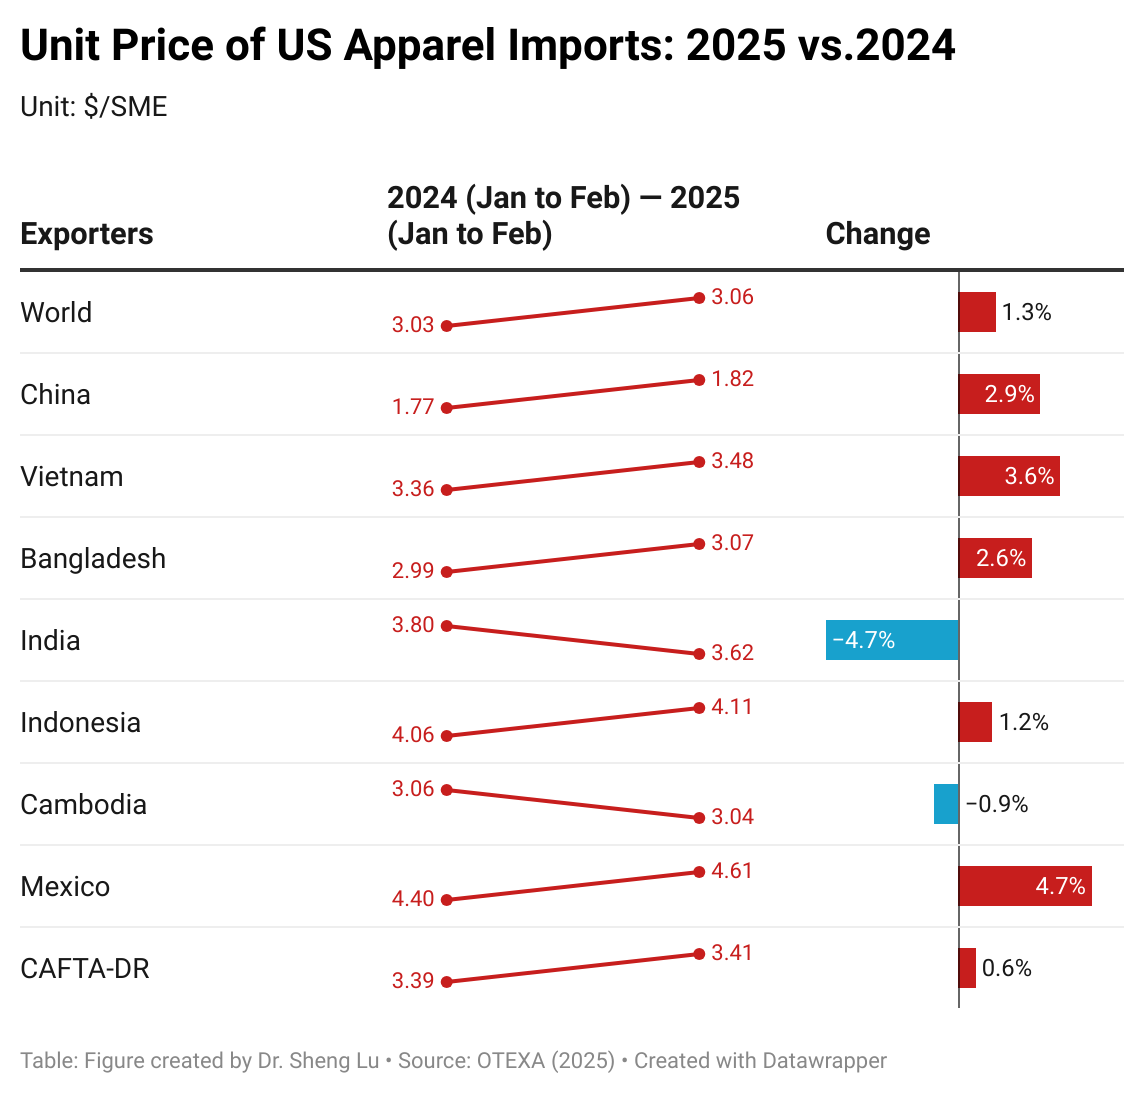
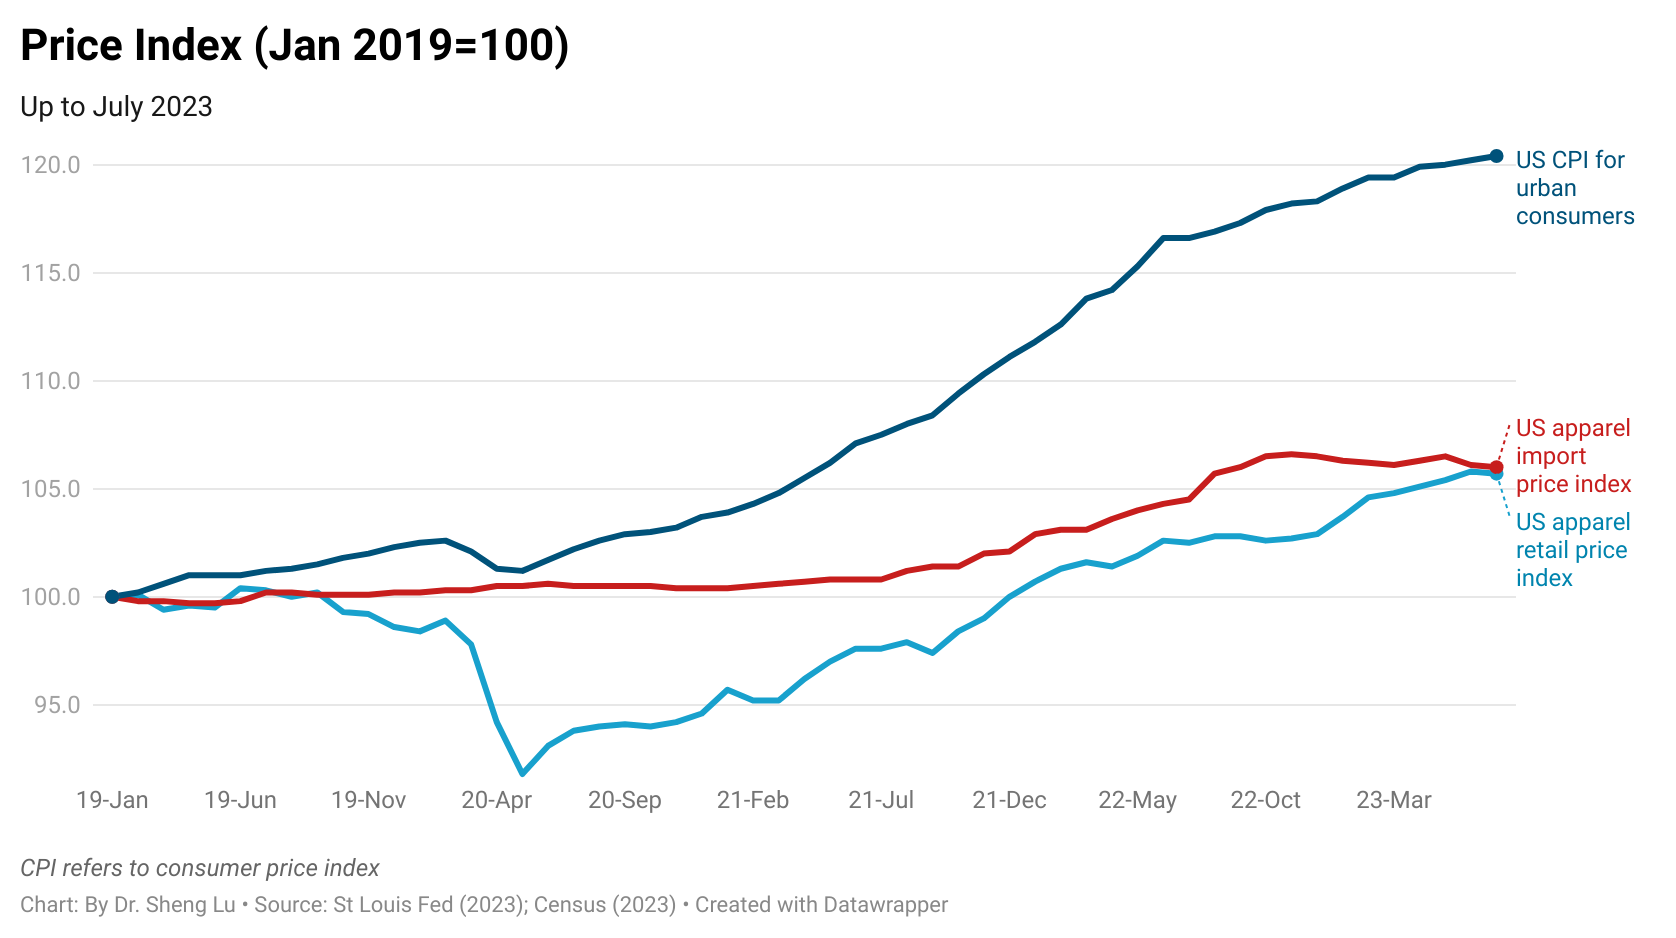
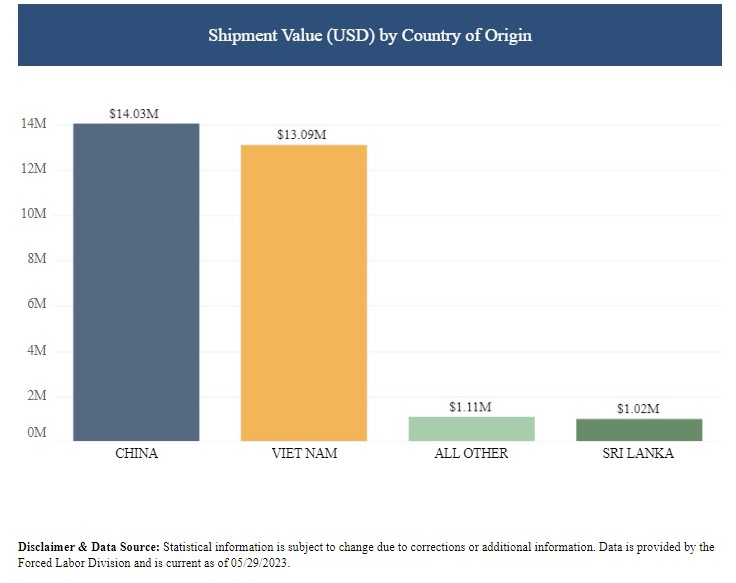
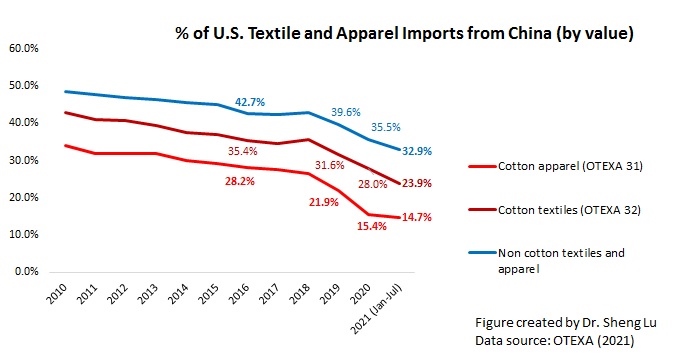
- National Council of Textile Organizations, NCTO (note: representing U.S.-domestic textile manufacturers): “China’s 15th Five-Year Plan (2026-2030) indicates textile and apparel production will continue to receive special government attention with its commitment to expand supply of high quality textiles…China’s history of providing subsidies and investment in manufacturing capacity, both centrally and locally, even when demand declines, allows companies operating in the country to maintain high production levels despite declining profits…These market dynamics have led to China’s rise as the world’s number one supplier of cheap apparel, which has dropped in price by roughly 28 percent since 2019.” (Note: No data source provided in the submitted comment, but it could refer to the OTEXA average unit price of U.S. apparel imports from China, calculated by $ per square meter equivalent). NCTO also claimed that Southeast Asian countries such as Vietnam, Bangladesh, and Cambodia heavily rely on textile raw material inputs from China and contribute to the excess production capacity problem that has caused the U.S. trade deficit in textiles and apparel.
- Association of the Nonwoven Fabrics Industry, INDA (note: representing the North American nonwoven fabrics and engineered materials industry): Expressed concern that China’s nonwoven production increased by 5.1% in 2024, supported by “government policies including subsidized inputs, low-cost financing, and export promotion.” “Similar dynamics exist or have the potential to exist in other investigated economies (e.g., Vietnam, India, Bangladesh, Indonesia, Cambodia, and Thailand), where textile and nonwoven-related production benefits from export incentives, capacity additions untethered to market demand, and bilateral trade surpluses with the United States.”
Arguments that there is NO “structural excess capacity” problem in textiles and apparel
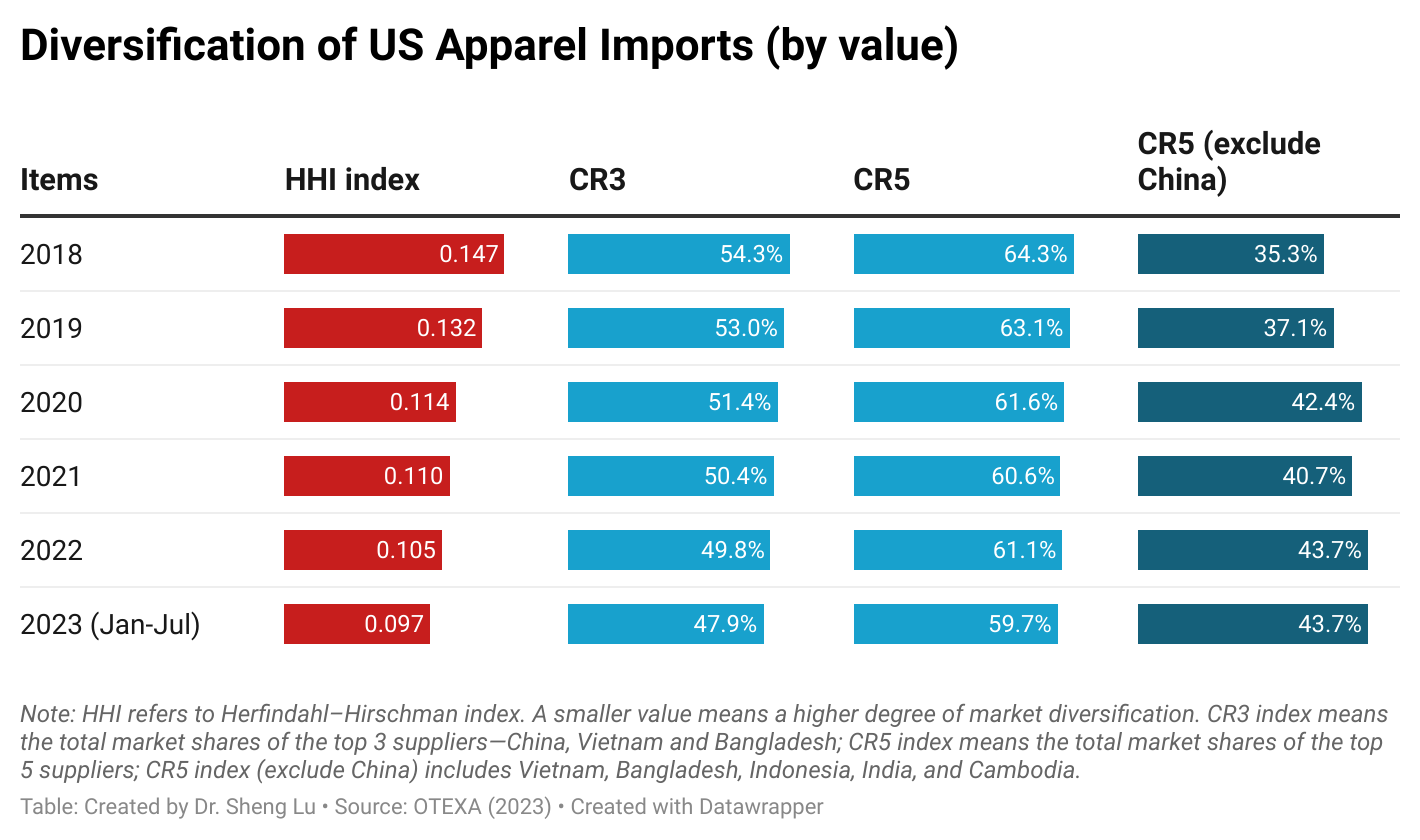
Industry associations representing U.S. fashion brands, retailers, and importers generally argue that the U.S. trade deficit in textiles and apparel and the high import volume should not be interpreted as the result of “excess capacity,” but rather as the natural outcome of each country’s comparative advantage in trade and today’s global apparel supply chain. Meanwhile, textile and apparel manufacturers from Asian countries argue that their export volumes reflect the sourcing decisions of U.S. fashion brands, not government-subsidized overproduction. Specifically:
- American Apparel and Footwear Association, AAFA (note: representing U.S. apparel brands and retailers): U.S. trade deficit in textiles and apparel is NOT an appropriate and relevant measurement of the excess production issue. Instead, “these trade flows reflect the organization of production within globally integrated supply chains, where capacity is developed and utilized in response to commercial sourcing decisions, long-term customer relationships, and evolving demand patterns. Production capacity in these sectors is generally responsive and mobile, and there is no indication of persistent or systemic underutilization of capacity maintained independent of market demand or sustained through policy intervention.”
- U.S. Fashion Industry Association, USFIA (note: representing U.S. fashion brands, retailers, and importers): Disagree that in the apparel sector “a country runs a trade surplus with the United States… it displaces existing U.S. domestic production or prevents investment and expansion in U.S. manufacturing production.” Instead, by applying the concept of comparative advantage, USFIA believes that “the cutting and sewing of apparel is the first rung on the ladder of industrial development, a rung the United States climbed long ago. As President Trump recently said: “They {China} can produce things that we don’t want to produce because it’s not really worth our while, making undergarments…. We don’t want to do that, and we can buy them inexpensively from other places in the world.” USFIA also pointed out that “Many countries, including notably the United States, often produce more than they can consume domestically and work to develop foreign markets to absorb that excess production. This is the very definition of international trade and is at the heart of the Trump Administration’s own efforts to dismantle foreign trade barriers.”
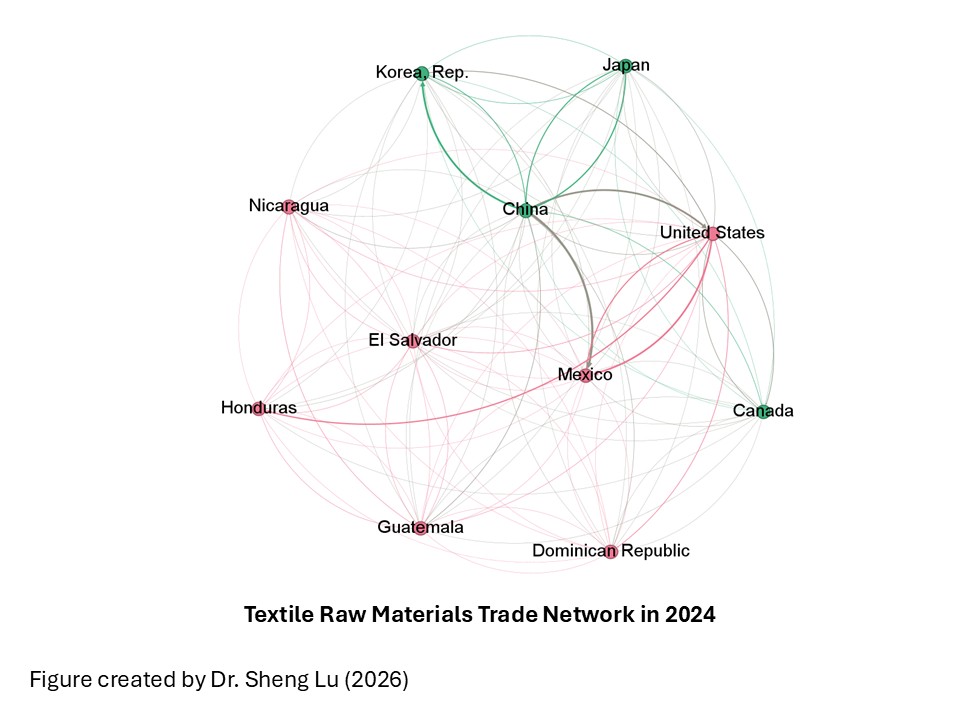
- Vietnam Textile and Apparel Association, VITAS (note: representing Vietnam textile and apparel manufacturers and exporters): First, “Viet Nam’s textile output is entirely demand-driven, manufactured against firm purchase orders from global brands. Output is manufactured exclusively against firm purchase orders placed by global brands and buyers.“ Second, Vietnam’s textile and apparel manufacturing sector remains profitable, so it continues to attract new foreign investment, indicating no overcapacity problem. In fact, 60% of Vietnam’s textile and apparel export revenues came from foreign-invested enterprises in the country. Third, the Vietnamese textile and garment industry depends heavily on imported raw materials for production; as such, it is unlikely to generate structural excess capacity. In particular, “the U.S. is currently the largest and most important supplier of cotton to Vietnam, accounting for nearly 50% of Vietnam’s total cotton imports.”
- Vietnam Cotton and Spinning Association, VCOSA (note: representing enterprises operating in the cotton and spinning industry in Vietnam): In Vietnam, “the cotton and spinning sector comprises about 180 enterprises, approximately 95% of which are privately owned or foreign-invested. In this context, decisions regarding capacity expansion, output levels, and investment are made independently by enterprises based on market signals, including market demand conditions, input costs and competitive pressures.” Similar to VITAS, VCOSA also argued that Vietnam’s cotton spinning industry relies heavily on imported raw cotton, including from the United States.
- Confederation of Indian Textile Industry: First, “the Indian Textile & Apparel (T&A) industry’s capacity expansion is closely aligned with domestic economic growth, market demand, and global trade dynamics, and is not driven by non-market interventions.” Second, India’s textile and apparel production “is stagnant or declining across the sector and value chain” due to competitions from countries like Vietnam and Bangladesh. Third, the Indian textile and apparel industry is “with a limited presence of large, vertically integrated players, capacity addition is inherently incremental, fragmented, and responsive to market signals, thereby preventing systemic overcapacity.”
- China Chamber of Commerce for Import and Export of Textiles, CCCT (note: representing China-based textile and apparel exporters): Claims that there is no excess capacity issue in China’s textile and apparel industry; however, no detailed data or evidence was provided to address concerns about China’s industrial policy and whether Chinese textile and apparel capacity has been expanded through state policy beyond what market demand would justify.
New Tariffs or Not?
Regarding whether USTR should impose additional tariffs as a result of the Section 301 investigation, textile and apparel industry associations also disagree, although the proposals were even more subtle.
First, U.S.-based textile manufacturers, including NCTO, generally support additional tariffs on finished textile and apparel products from Asia.
Second, U.S. fashion brands, retailers, and importers, including AAFA and USFIA, oppose imposing additional tariffs on textile and apparel imports, given 1) new tariffs are additional and unfair taxes on U.S. companies and consumers; 2) new tariffs will NOT bring back U.S. textile and apparel manufacturing, given the nature of the industry. AAFA also argues that existing mechanisms, such as the National Trade Estimate (NTE) report, should be the right tool to address USTR’s concerns, rather than using Section 301, which is supposed to be country-specific and very targeted.
Third, despite the general support for additional tariffs on finished goods, it is not uncommon for U.S. domestic textile and apparel manufacturers to request “tariff exclusions” for textile intermediates. For example:
- National Council of Textile Organizations, NCTO: “Exempt textile manufacturing inputs and machinery not available domestically from additional tariffs above existing MFN duties. American manufacturers need ready access to necessary manufacturing machinery and inputs not made domestically to maintain their global competitiveness against foreign producers who do not face similar tariffs.”
- Secondary Materials and Recycled Textiles Association, SMART: “In the wiping and cleaning sector, those tariffs have already had measurable and ongoing negative impacts that should be carefully considered before additional duties are imposed. Over the past several years, tariffs on textile inputs and finished wiping products have increased costs across the supply chain in ways that U.S. companies have largely been unable to avoid.”
- Association of the Nonwoven Fabrics Industry, INDA: “address the existing tariff imbalance by aligning the tariff treatment of nonwoven inputs (such as fibers) with that of finished nonwoven roll goods. This would eliminate the unintended cost disadvantage for domestic producers, encourage value-added manufacturing in the United States, and better support the objective of strengthening U.S. supply chain resilience.”
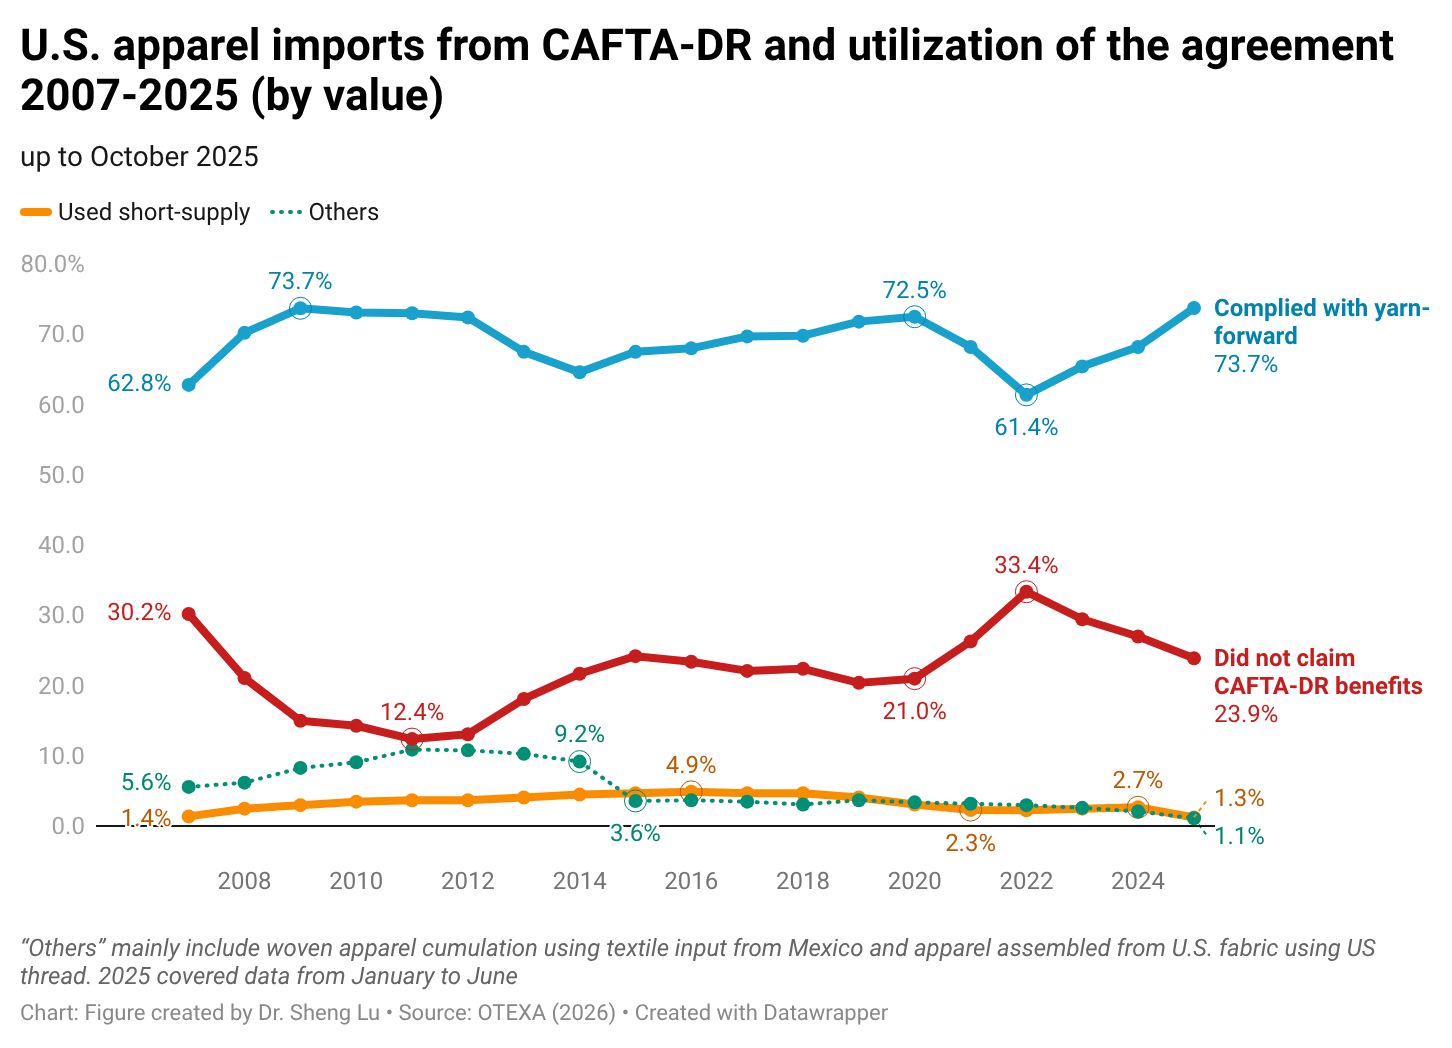
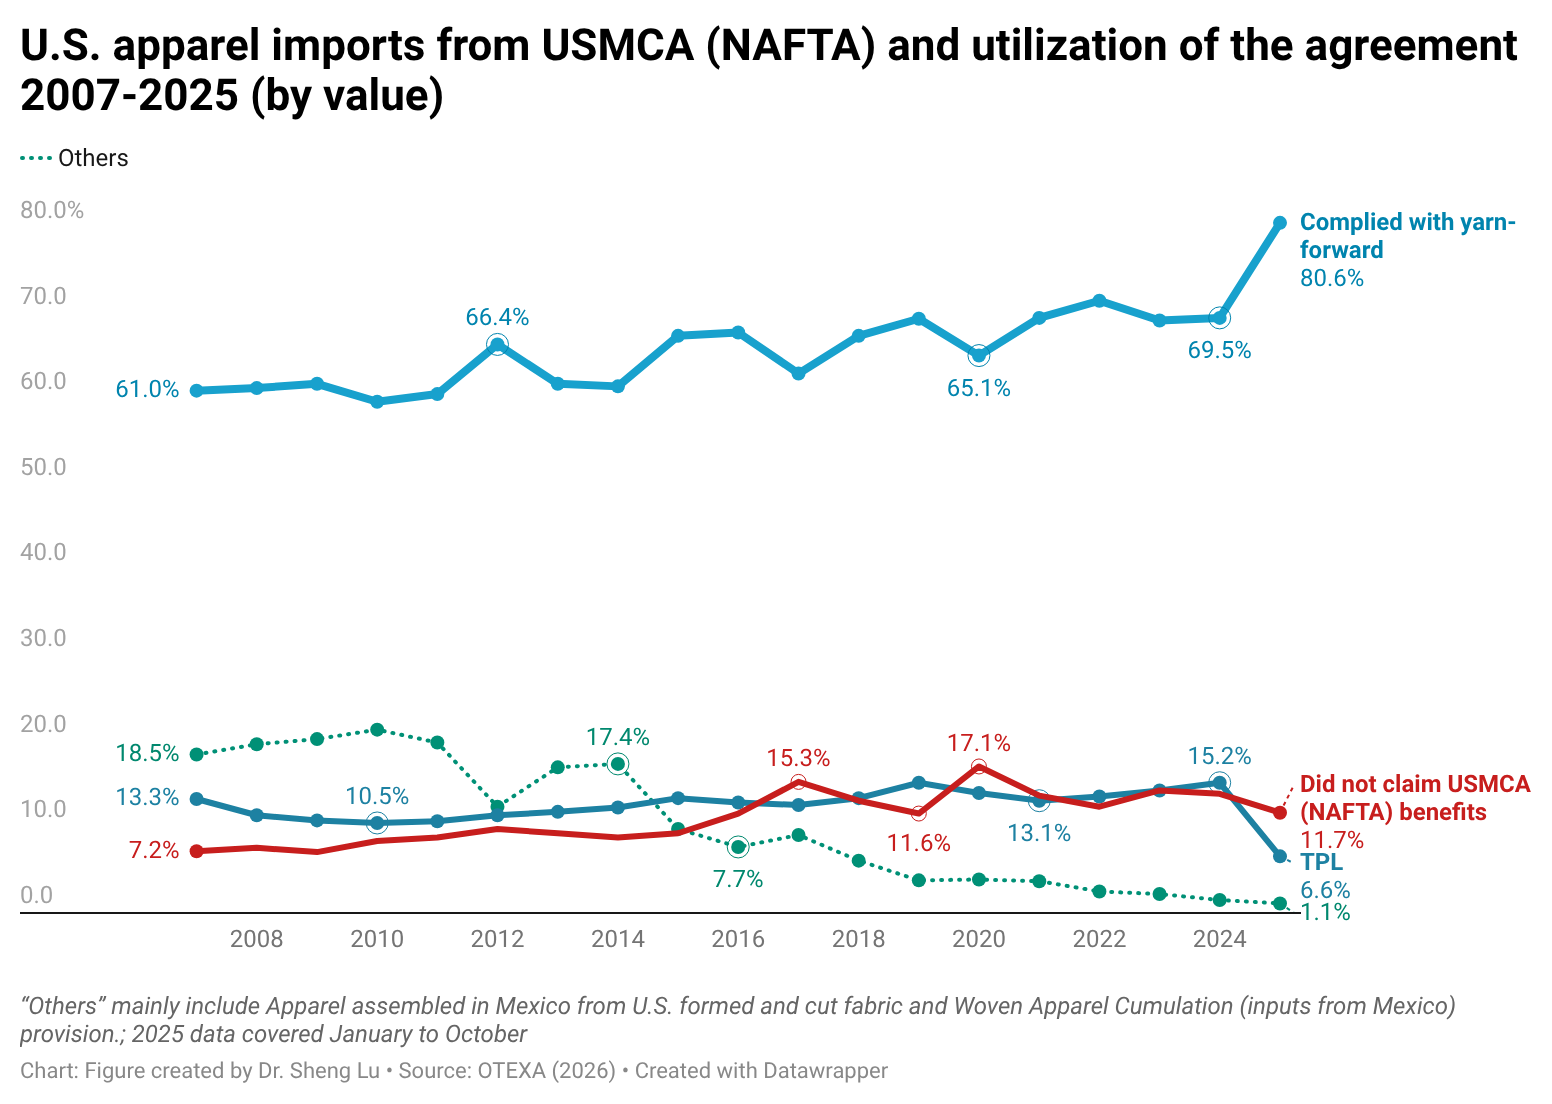
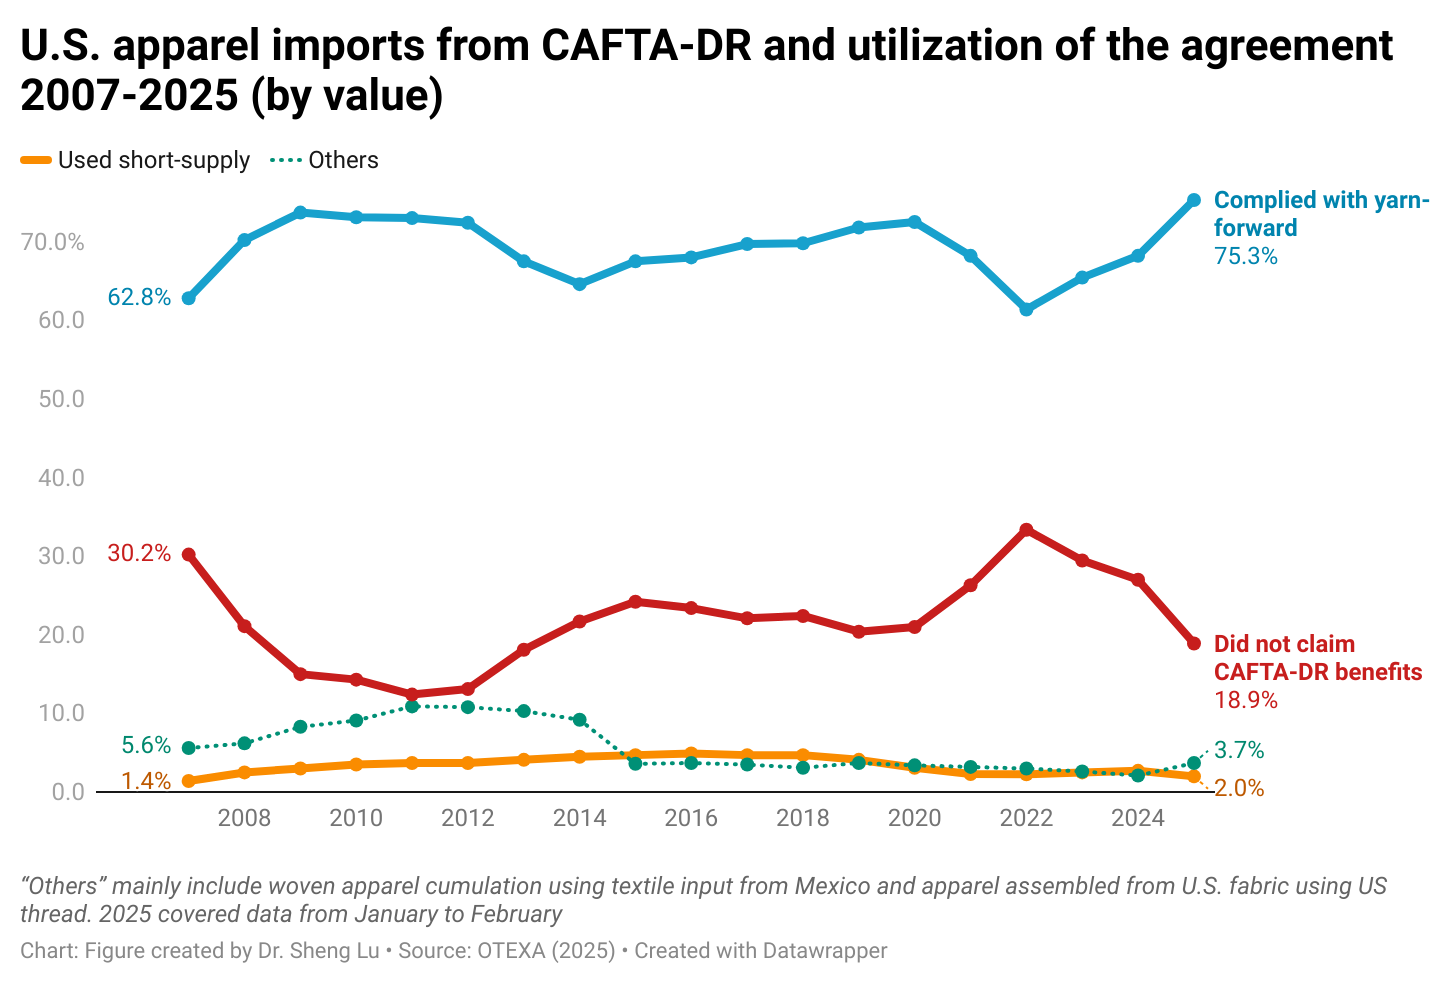
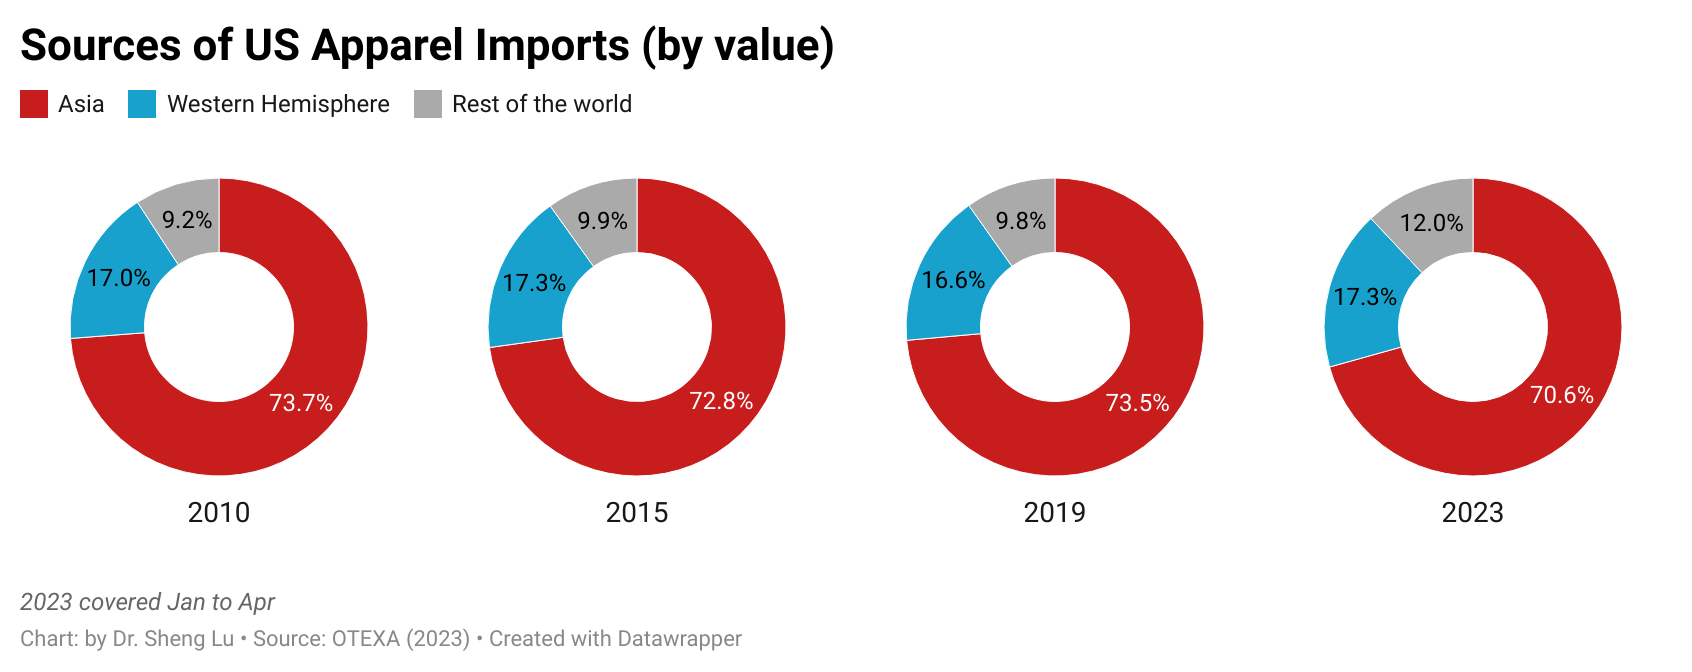
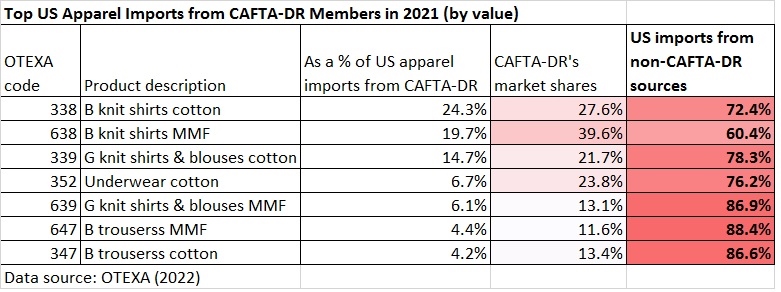
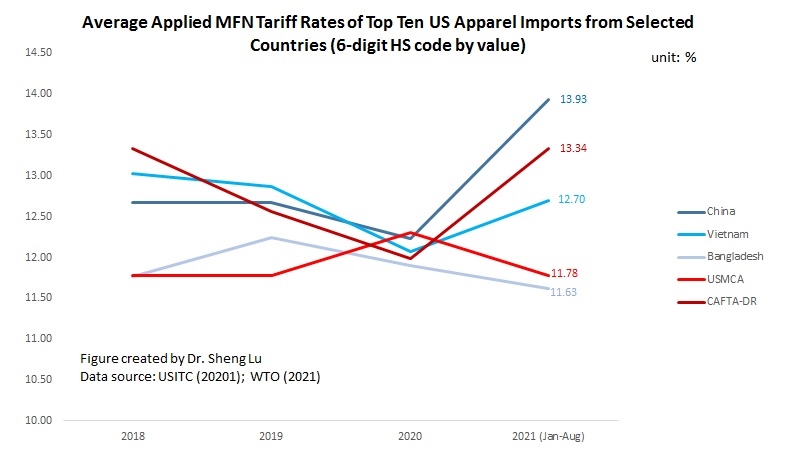
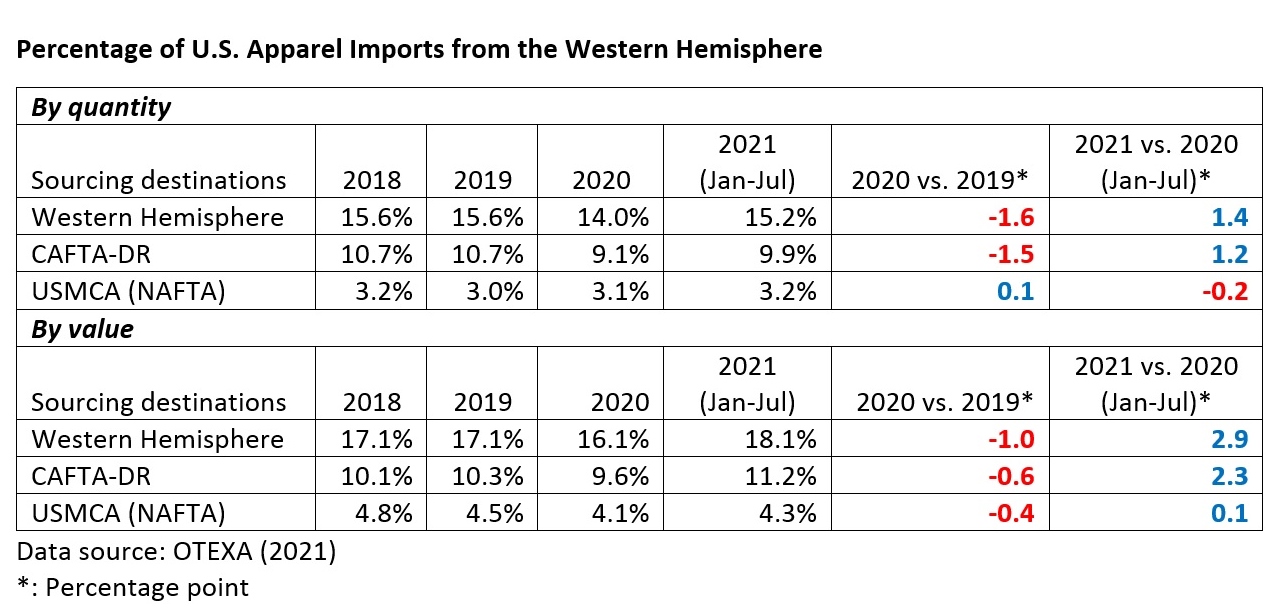
Fourth, there is a strong consensus among U.S. textile and apparel industry groups, including manufacturers, fashion brands, and retailers, against imposing additional U.S. import tariffs on textile and apparel products from the Western Hemisphere and in support of sourcing more apparel from the region.
- U.S. Fashion Industry Association, USFIA: “USFIA would like to highlight the importance of Western Hemisphere production for the entire textile and apparel supply chain…We support efforts to incentivize more sourcing from the Western Hemisphere.”
- National Council of Textile Organizations, NCTO: “Preserve critically important duty-free treatment for USMCA/CAFTA-DR qualified textiles and apparel. We urge the administration to preserve duty-free treatment for goods that qualify for preferential treatment under U.S. FTAs with Western Hemisphere countries, particularly the USMCA and the CAFTA-DR given the economic significance of these markets to U.S. textile manufacturers.”
- Association of the Nonwoven Fabrics Industry, INDA: “Coordinate with allied economies where appropriate and maintain exemptions or targeted approaches for partners (such as USMCA countries) that do not engage in the same distortive practices.”
Additional Assessment from an Academic View
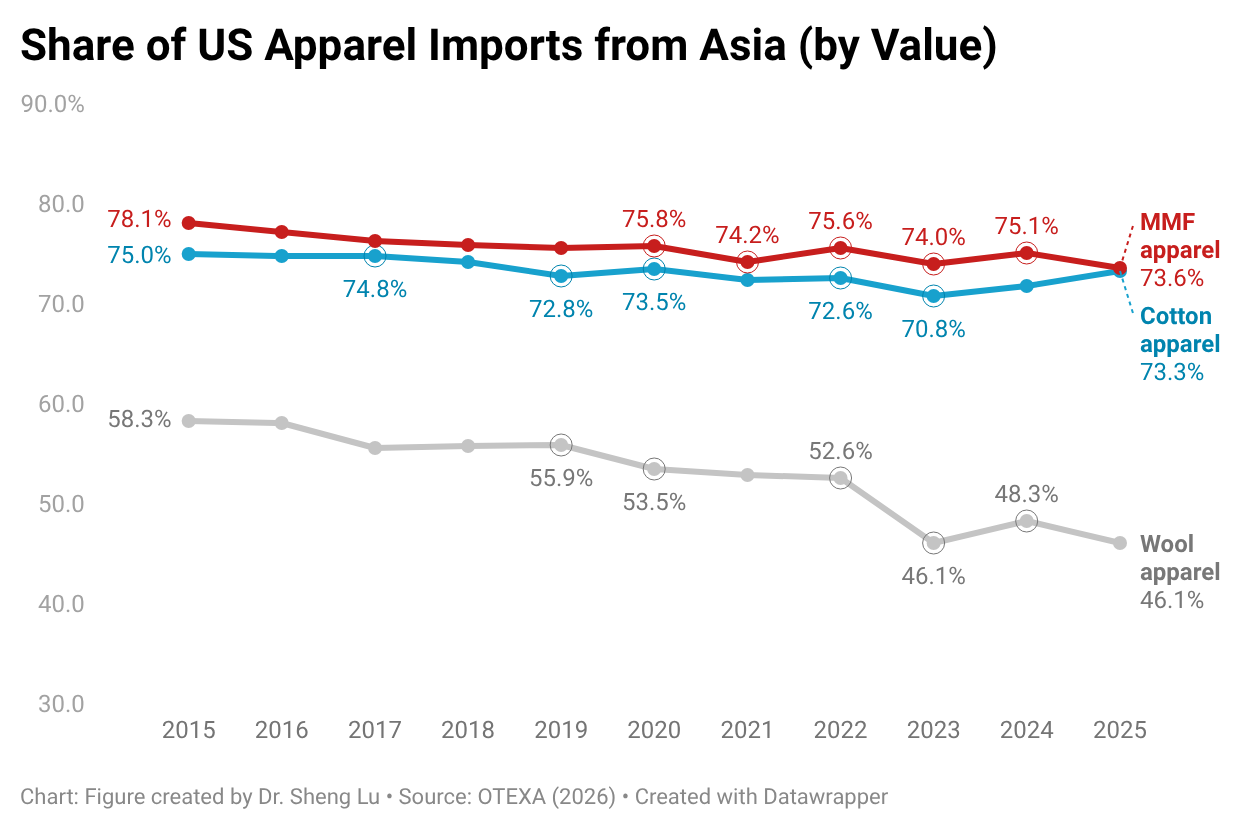
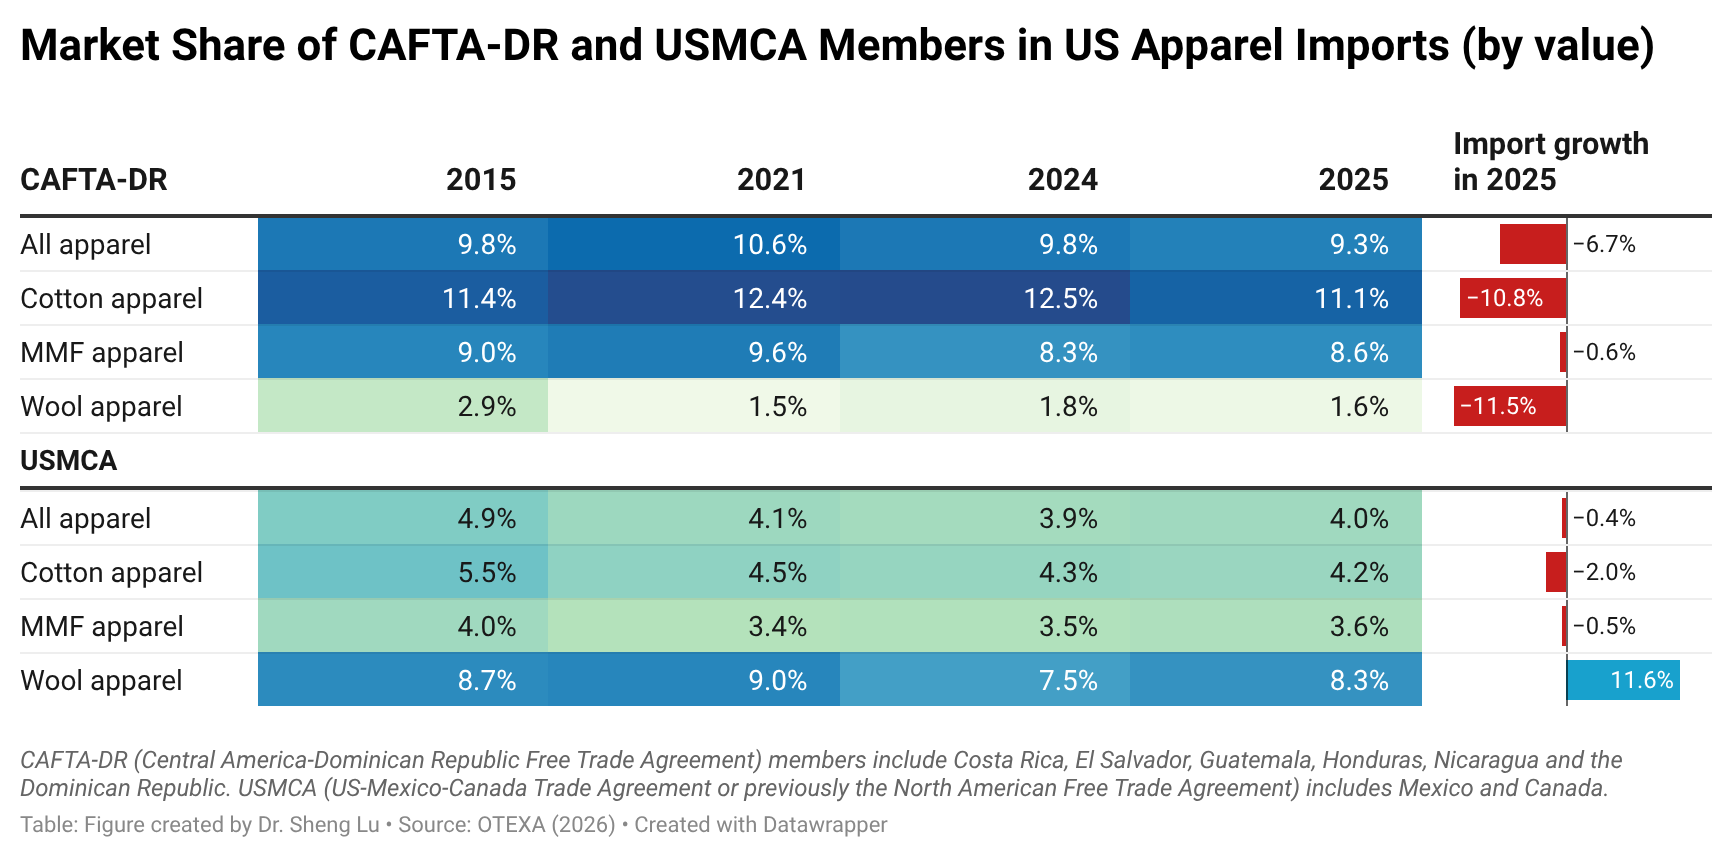
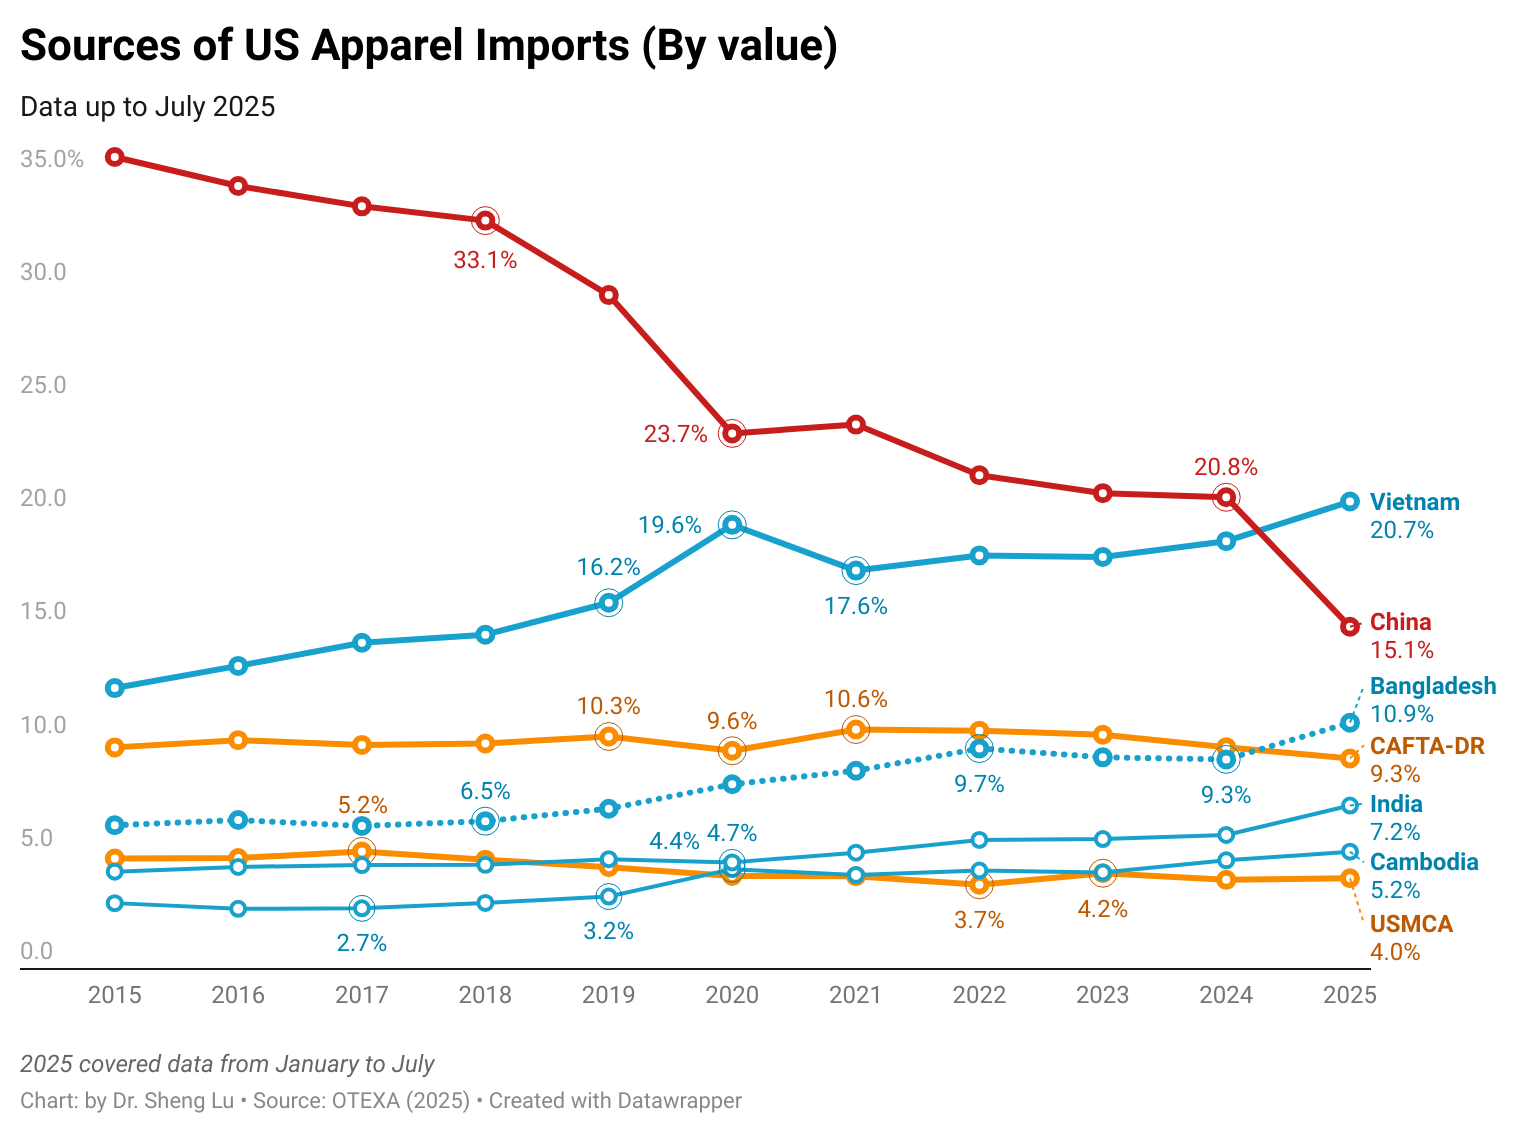
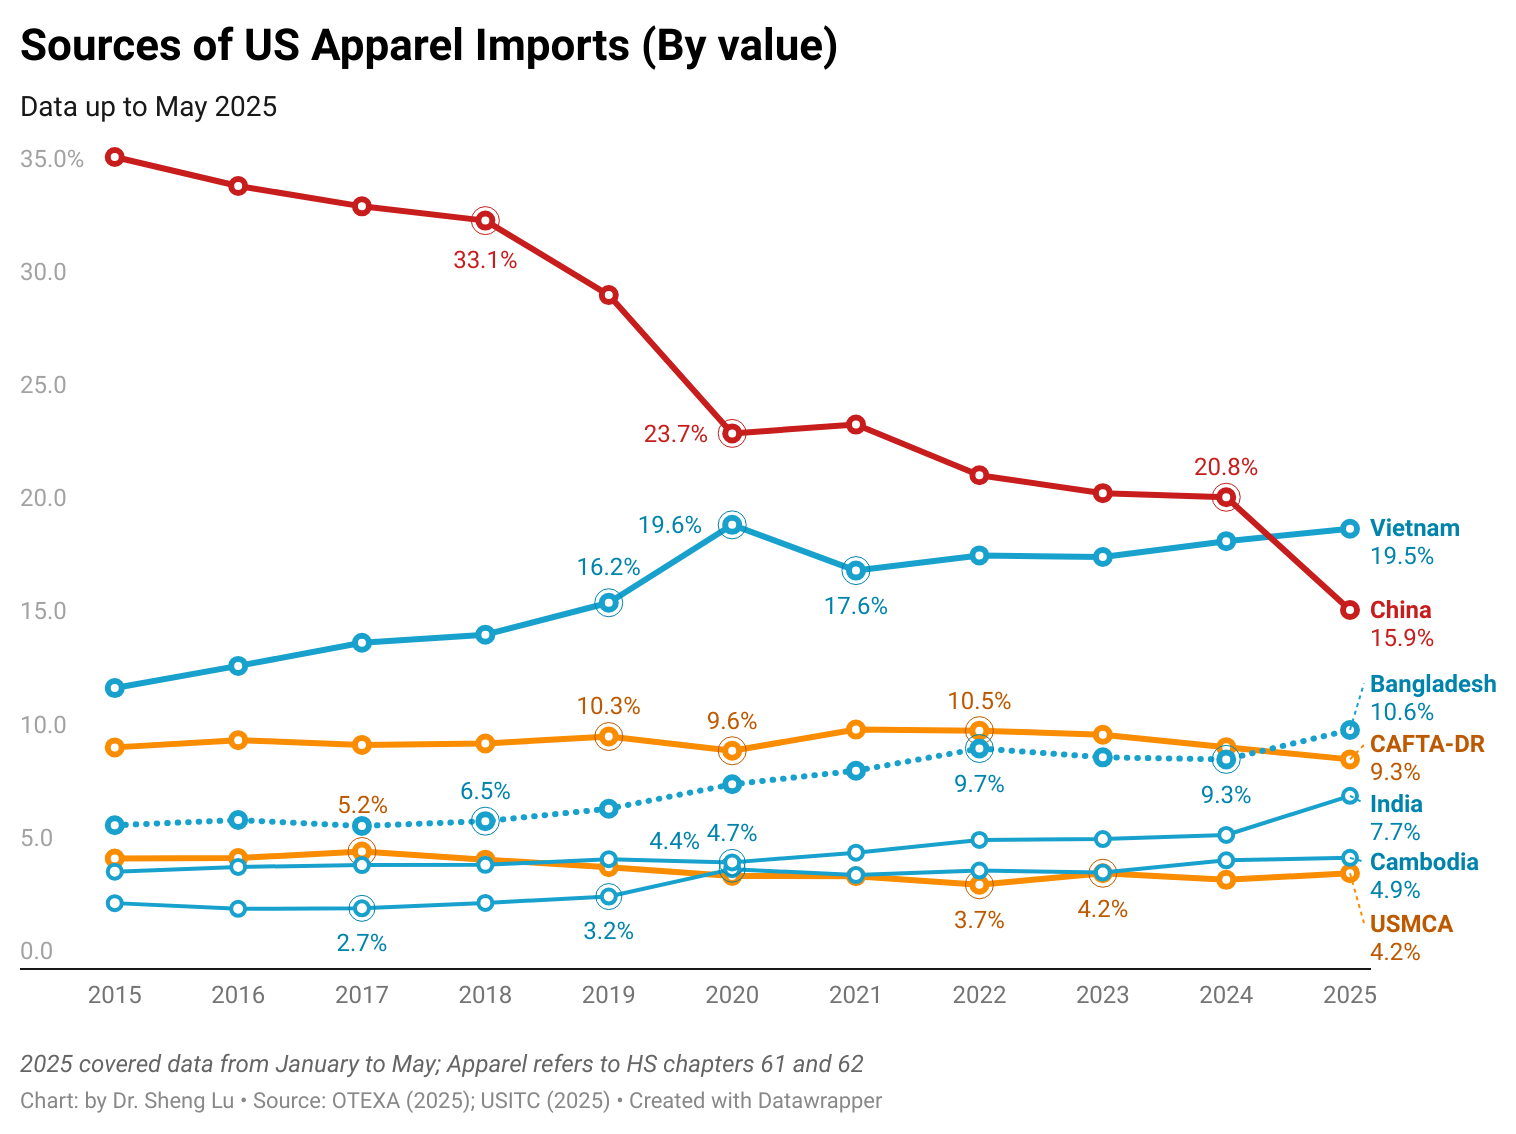
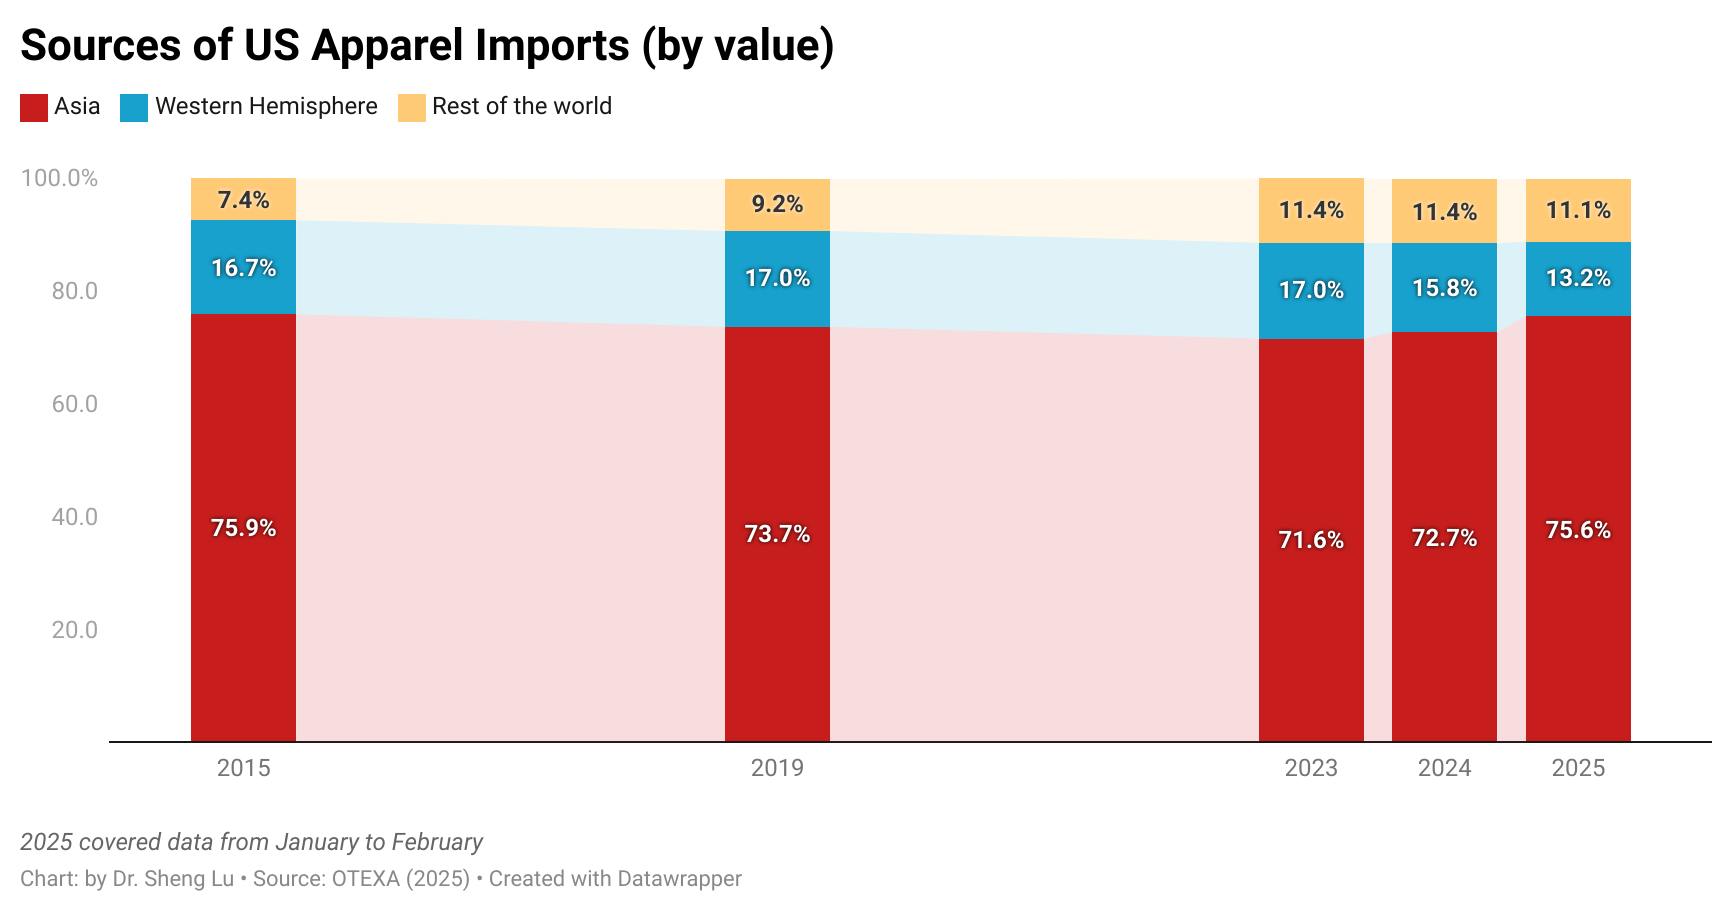
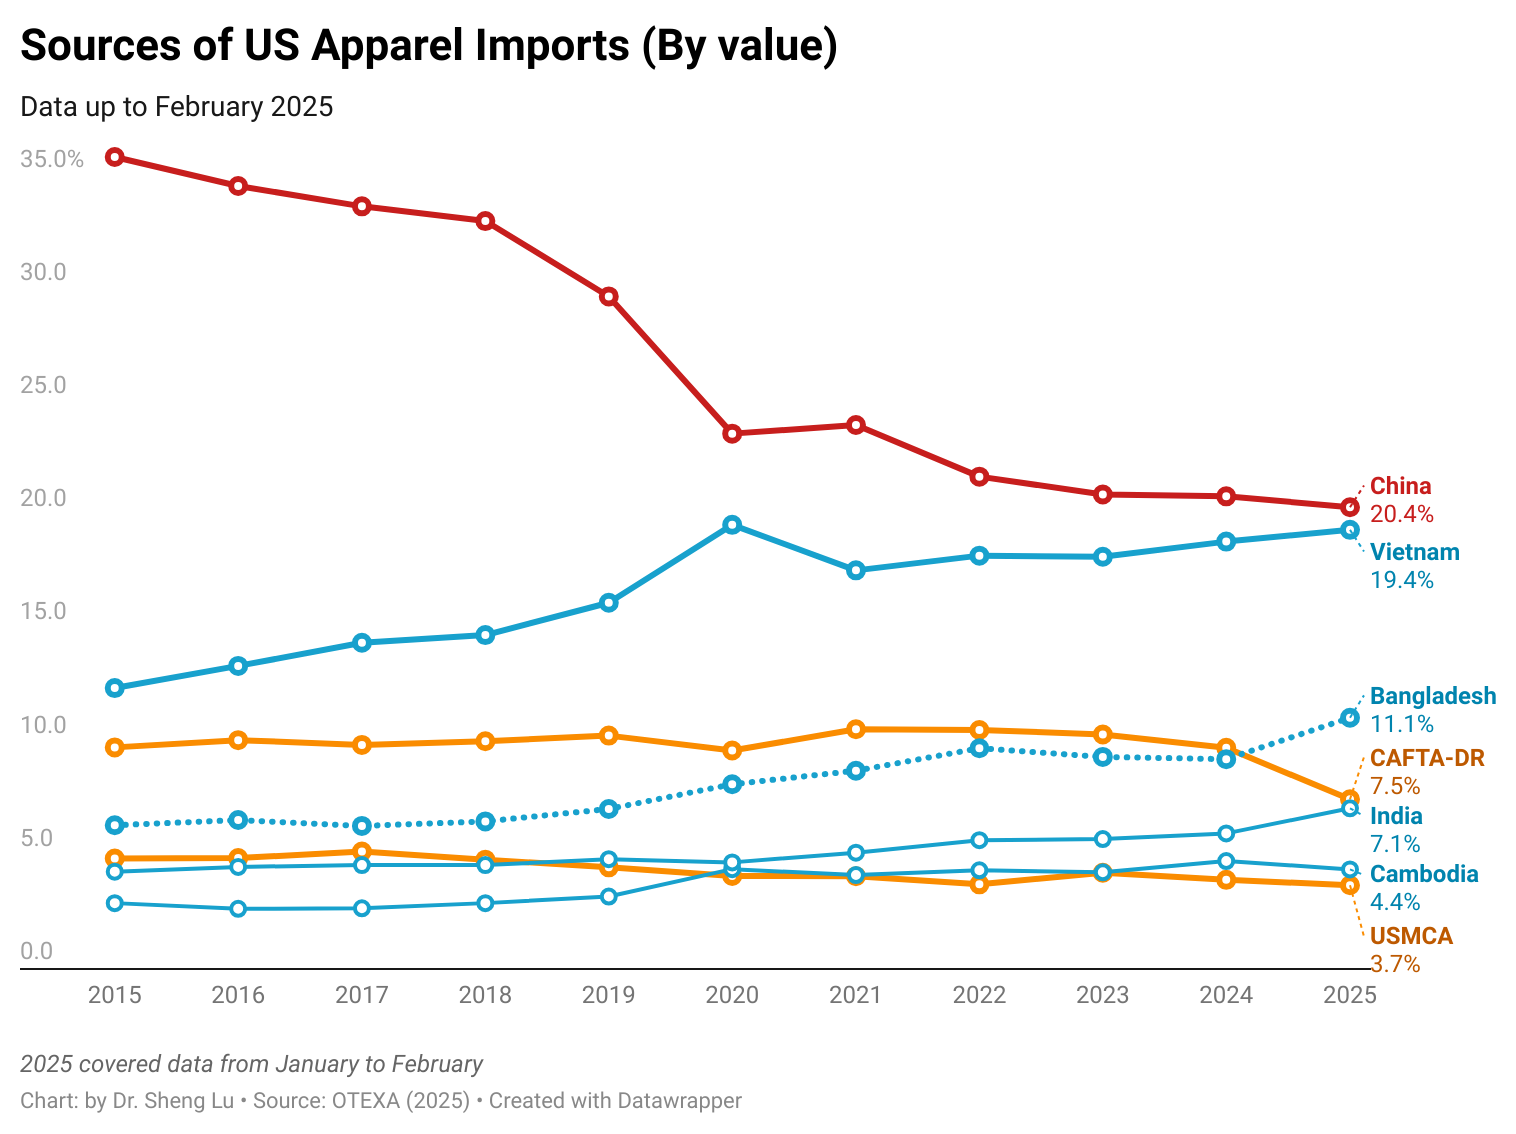
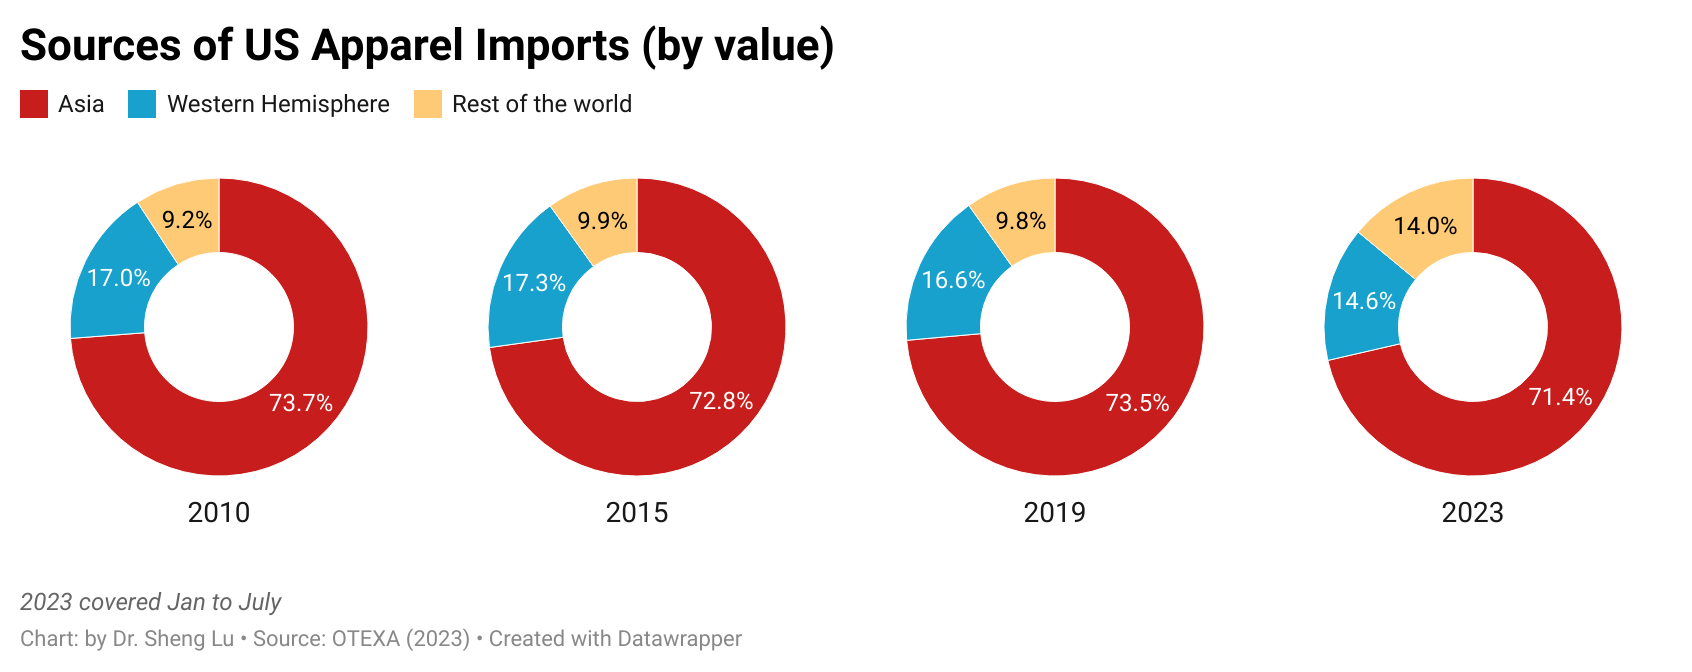
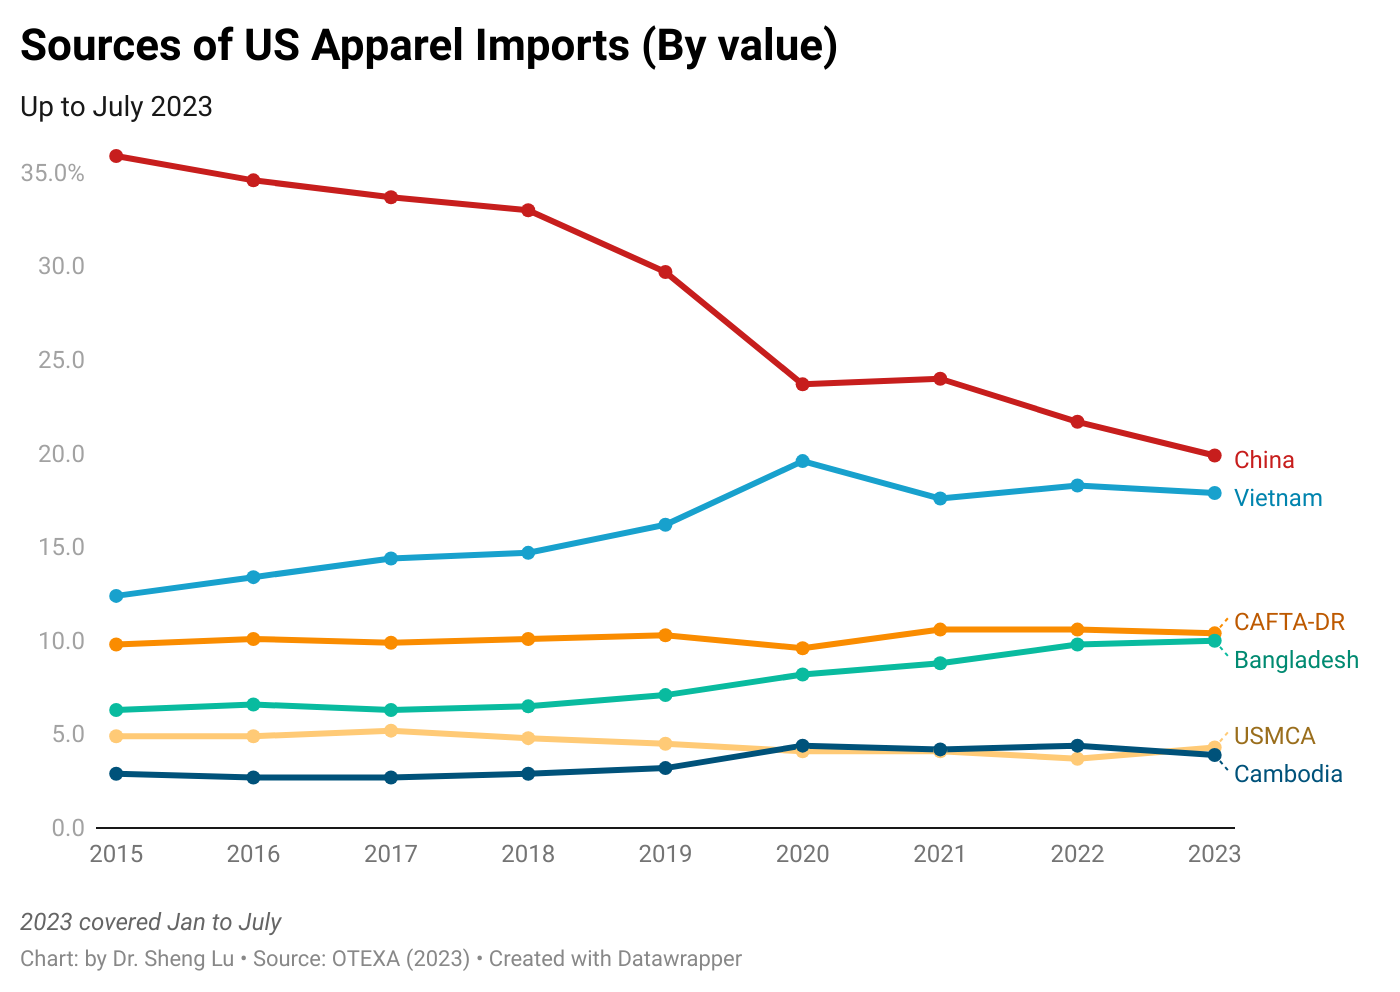
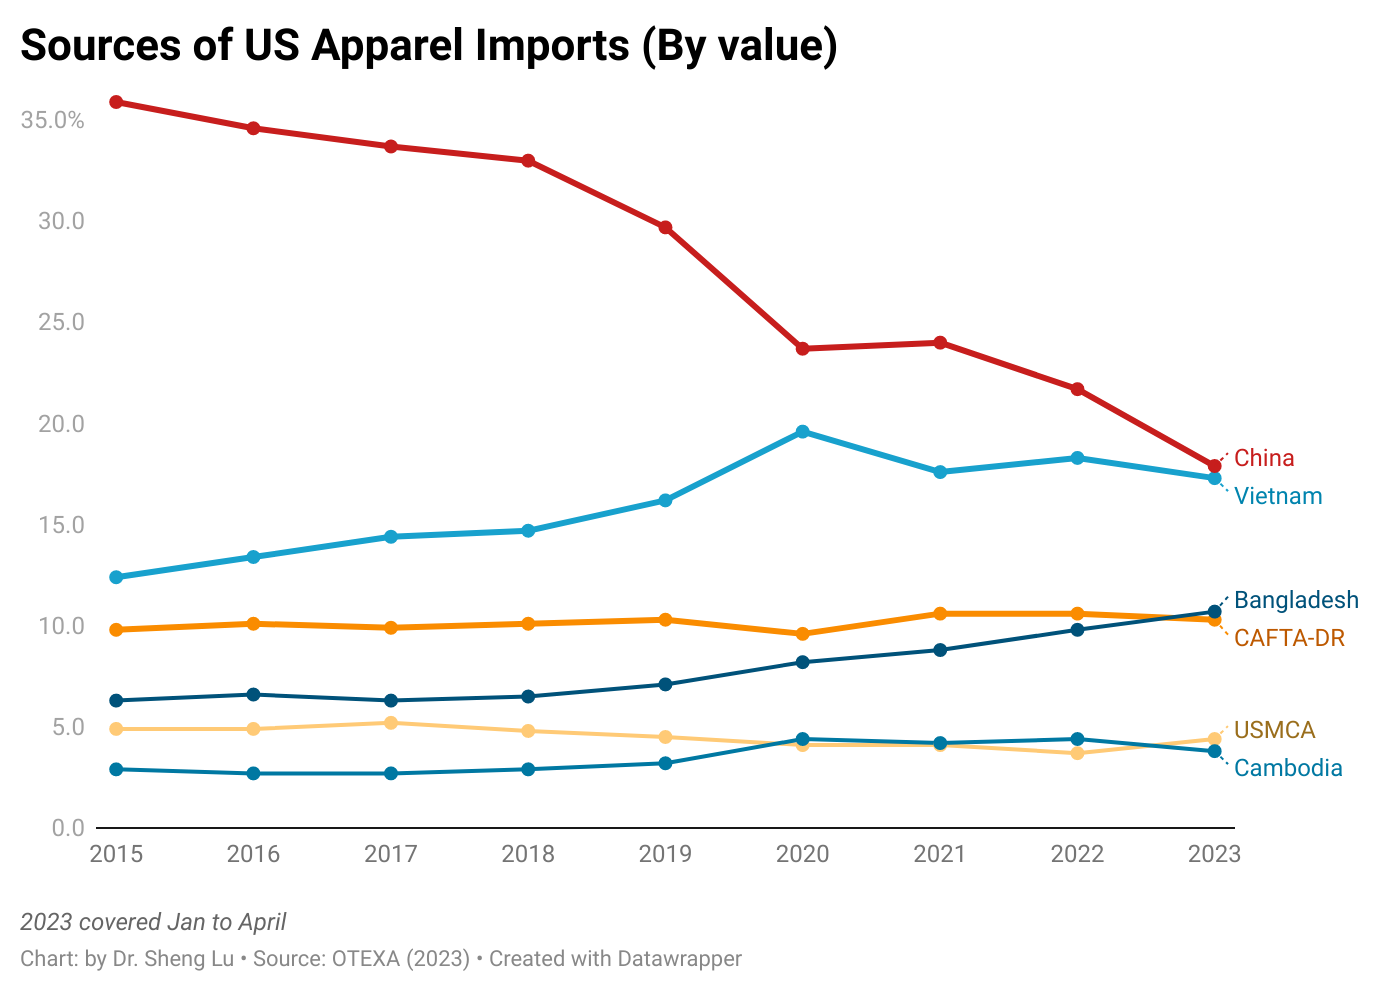
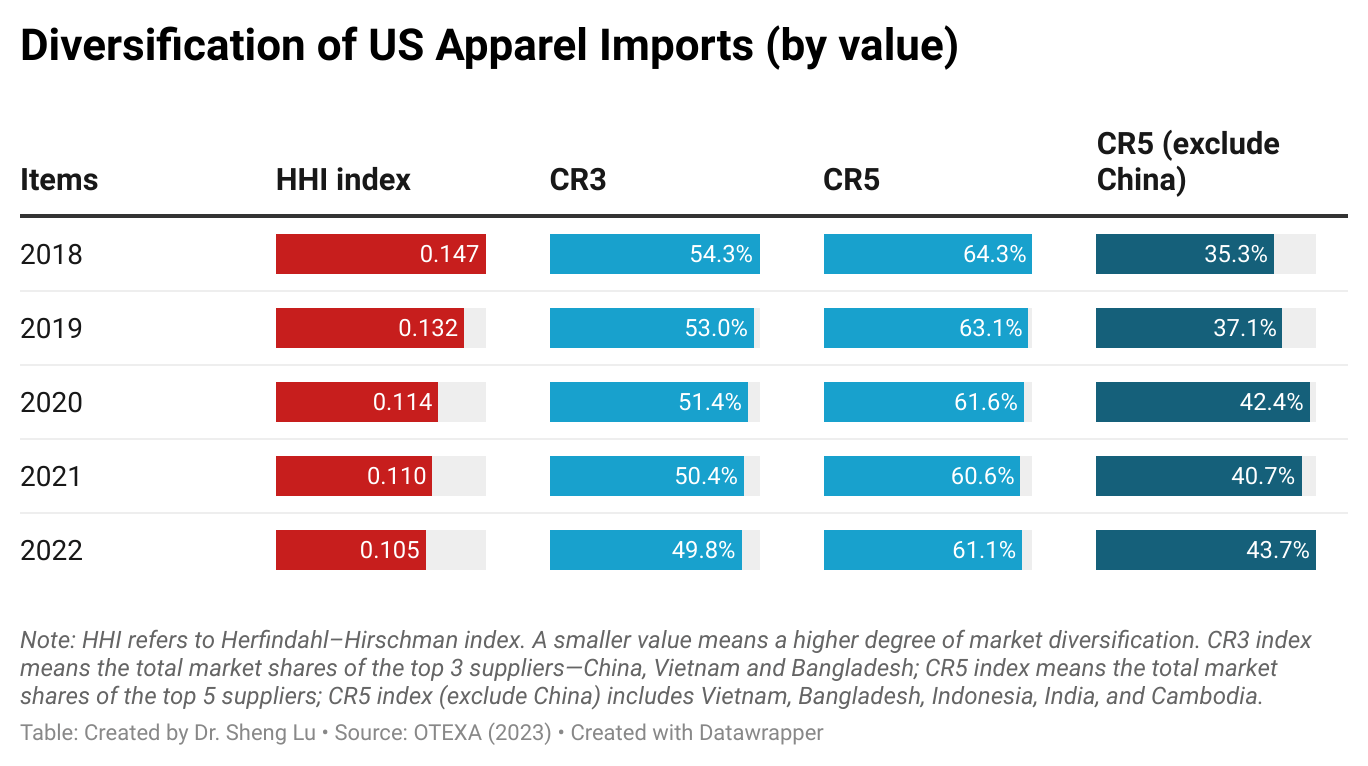
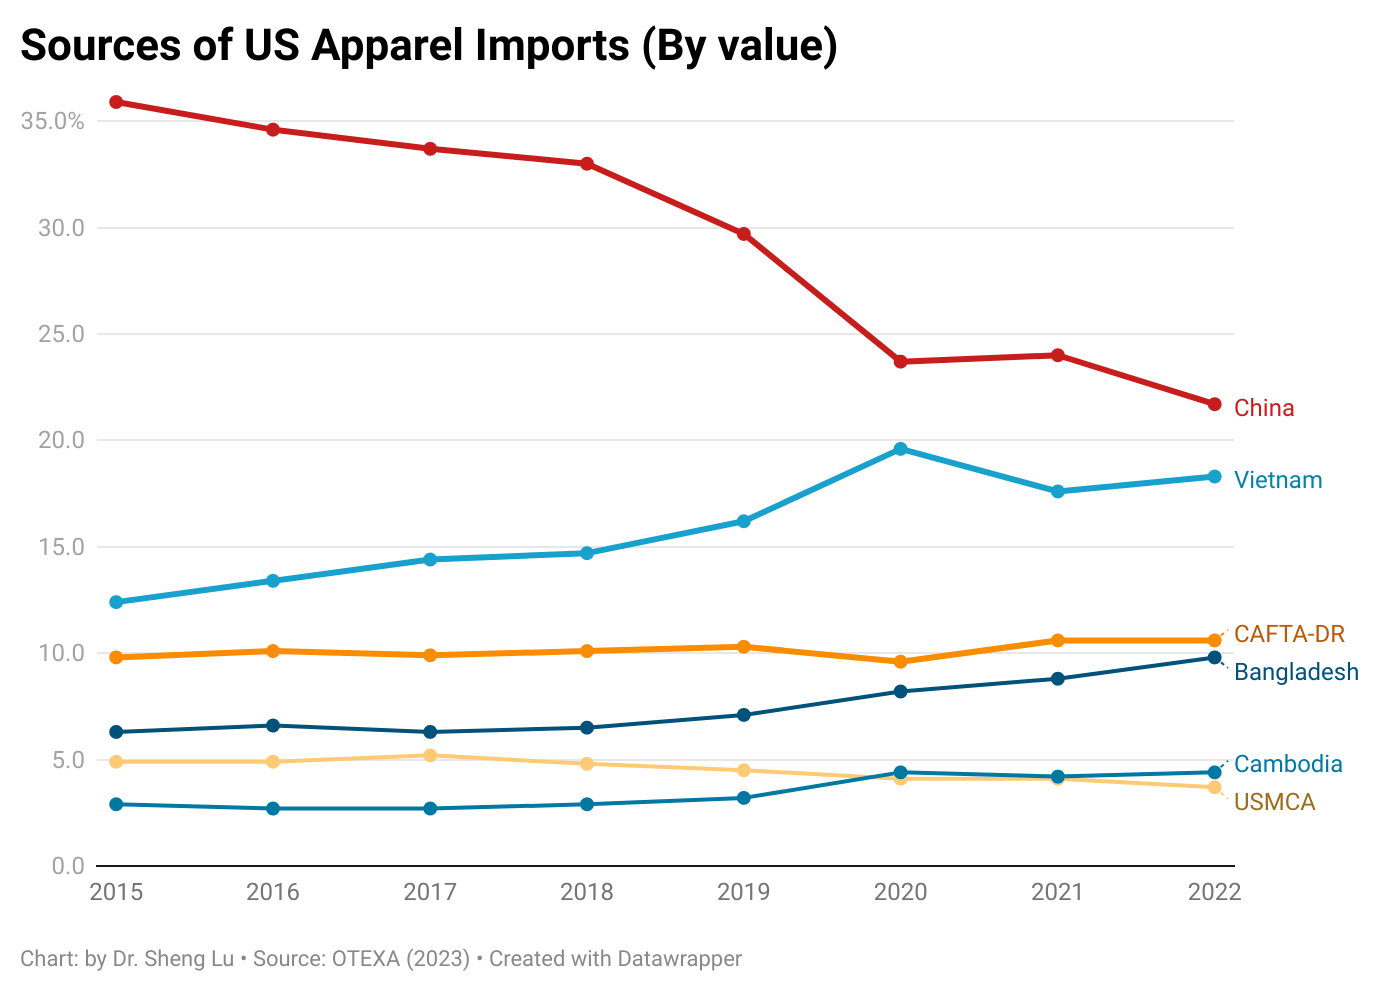
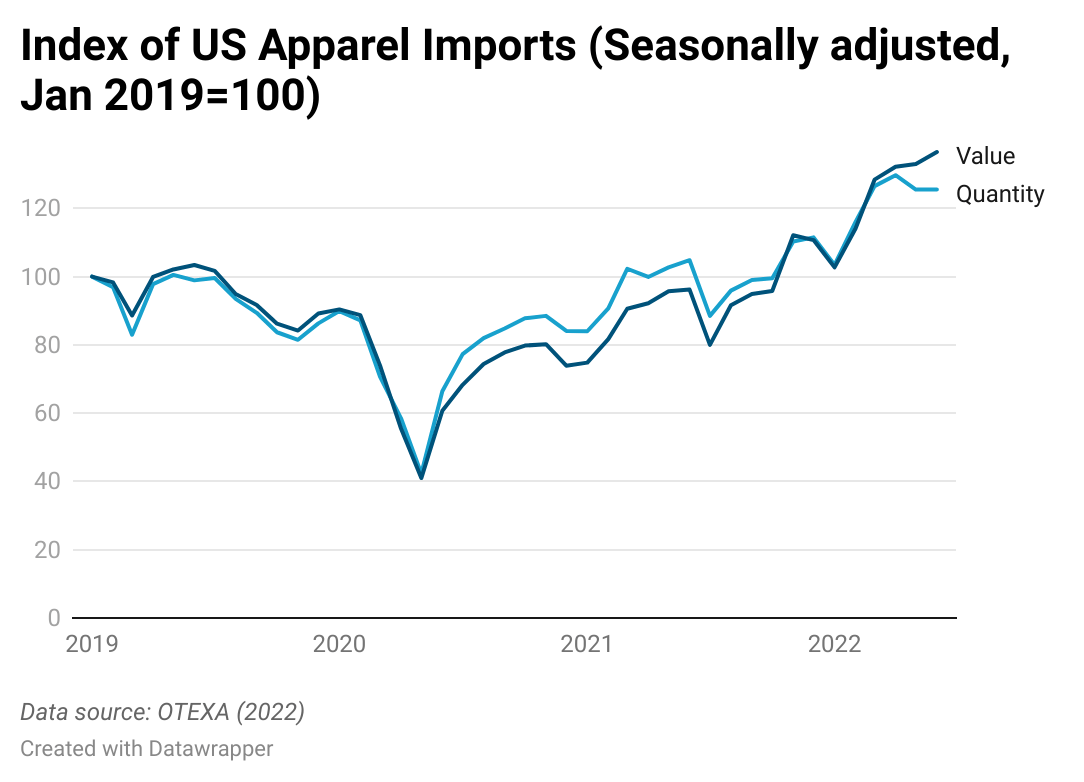
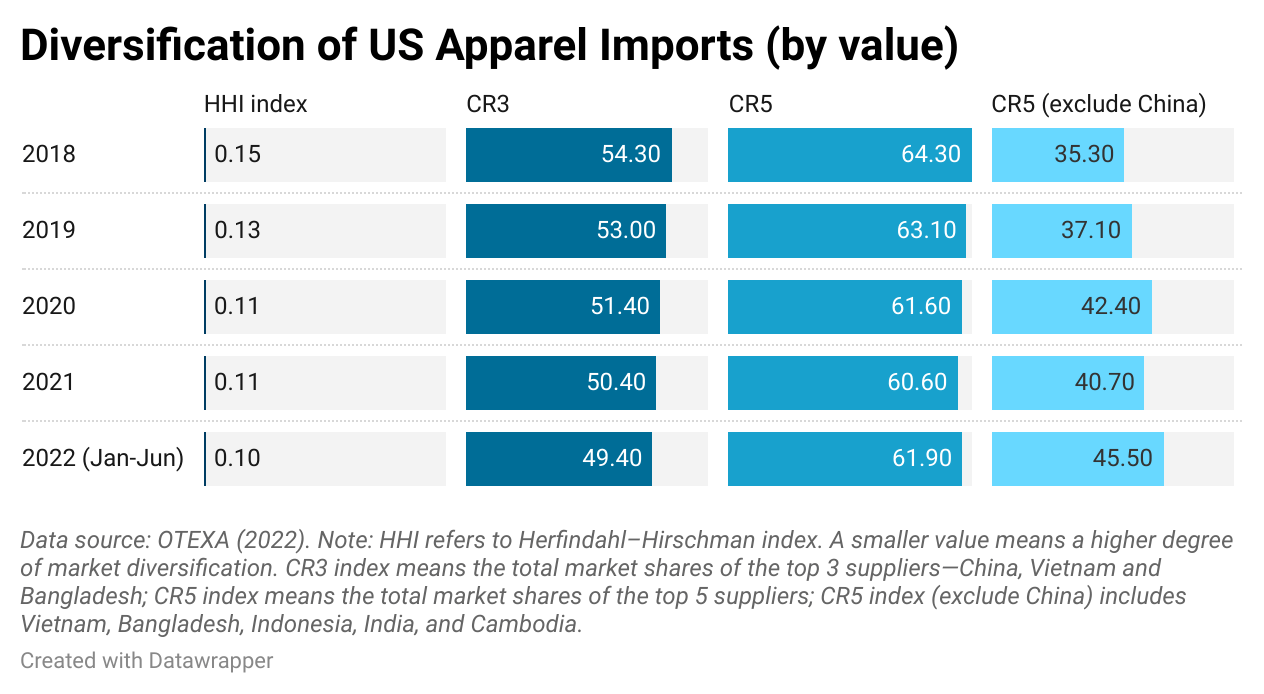
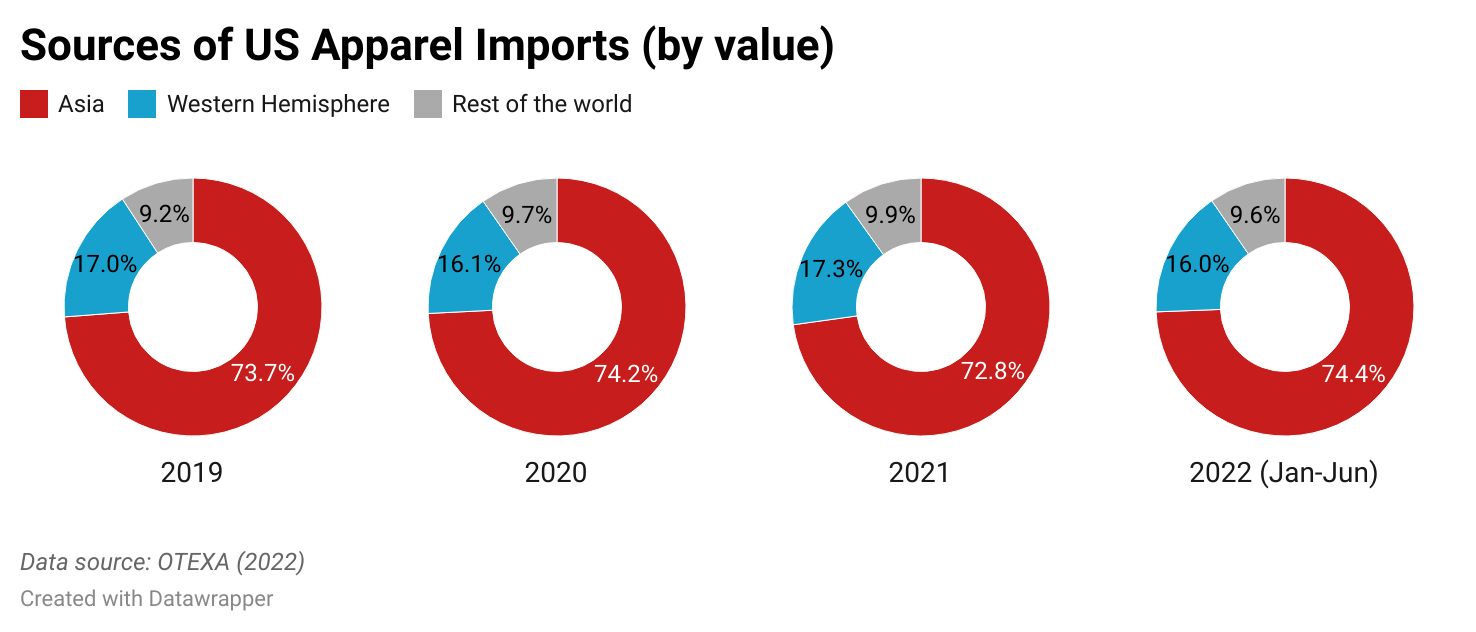
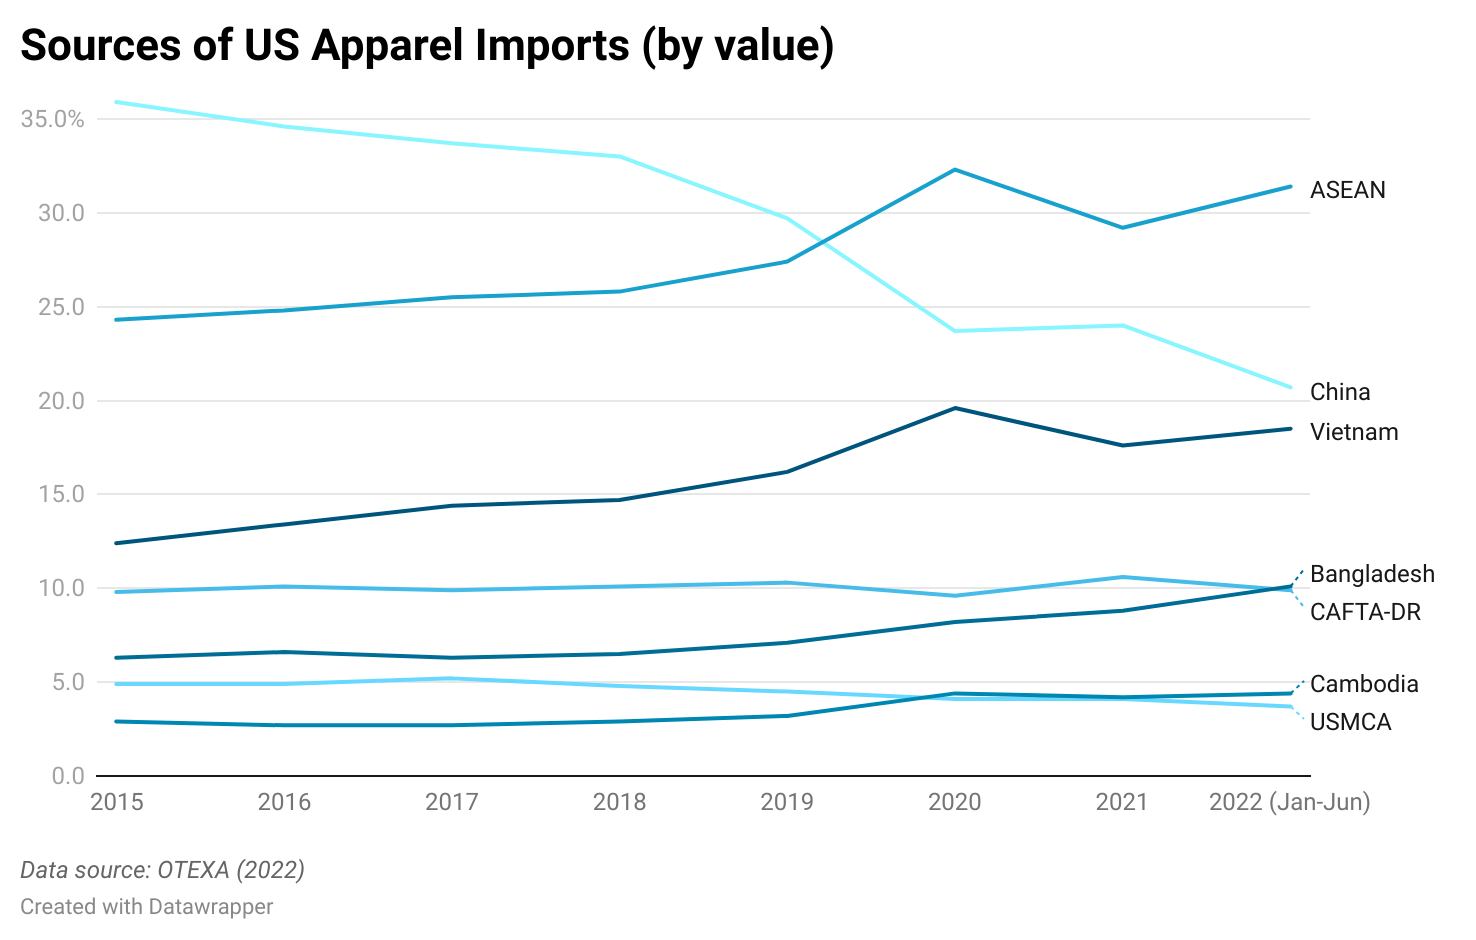
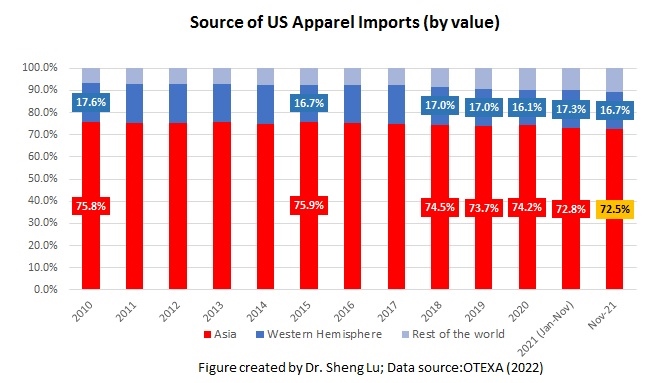
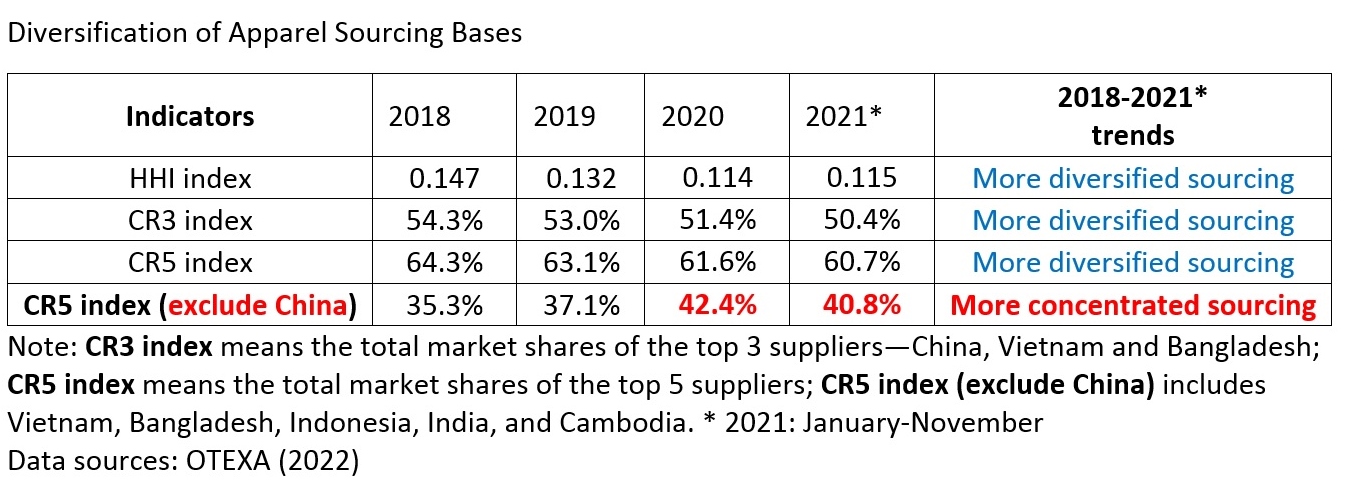
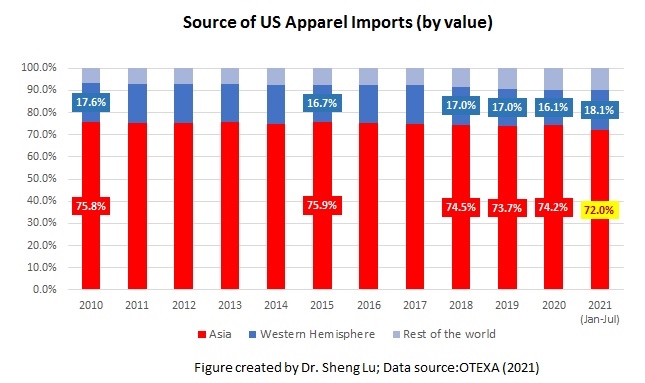
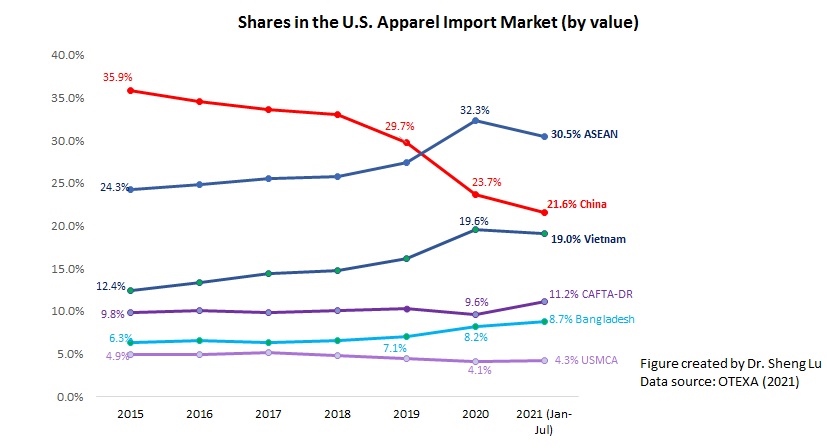
In theory, “excess capacity” is very unlikely in the apparel sector, given the industry’s nature. In particular, apparel manufacturing has relatively low barriers to entry and exit, and workers can move in and out of the sector relatively easily. As a result, if excess capacity emerges, factories typically adjust by scaling back production or reducing employment. Meanwhile, the apparel industry is “buyer-driven,” meaning production decisions are largely based on demand from fashion brands and retailers rather than supply-side expansion by manufacturers. (See the shifting market share in the U.S. apparel import market by supplying countries)
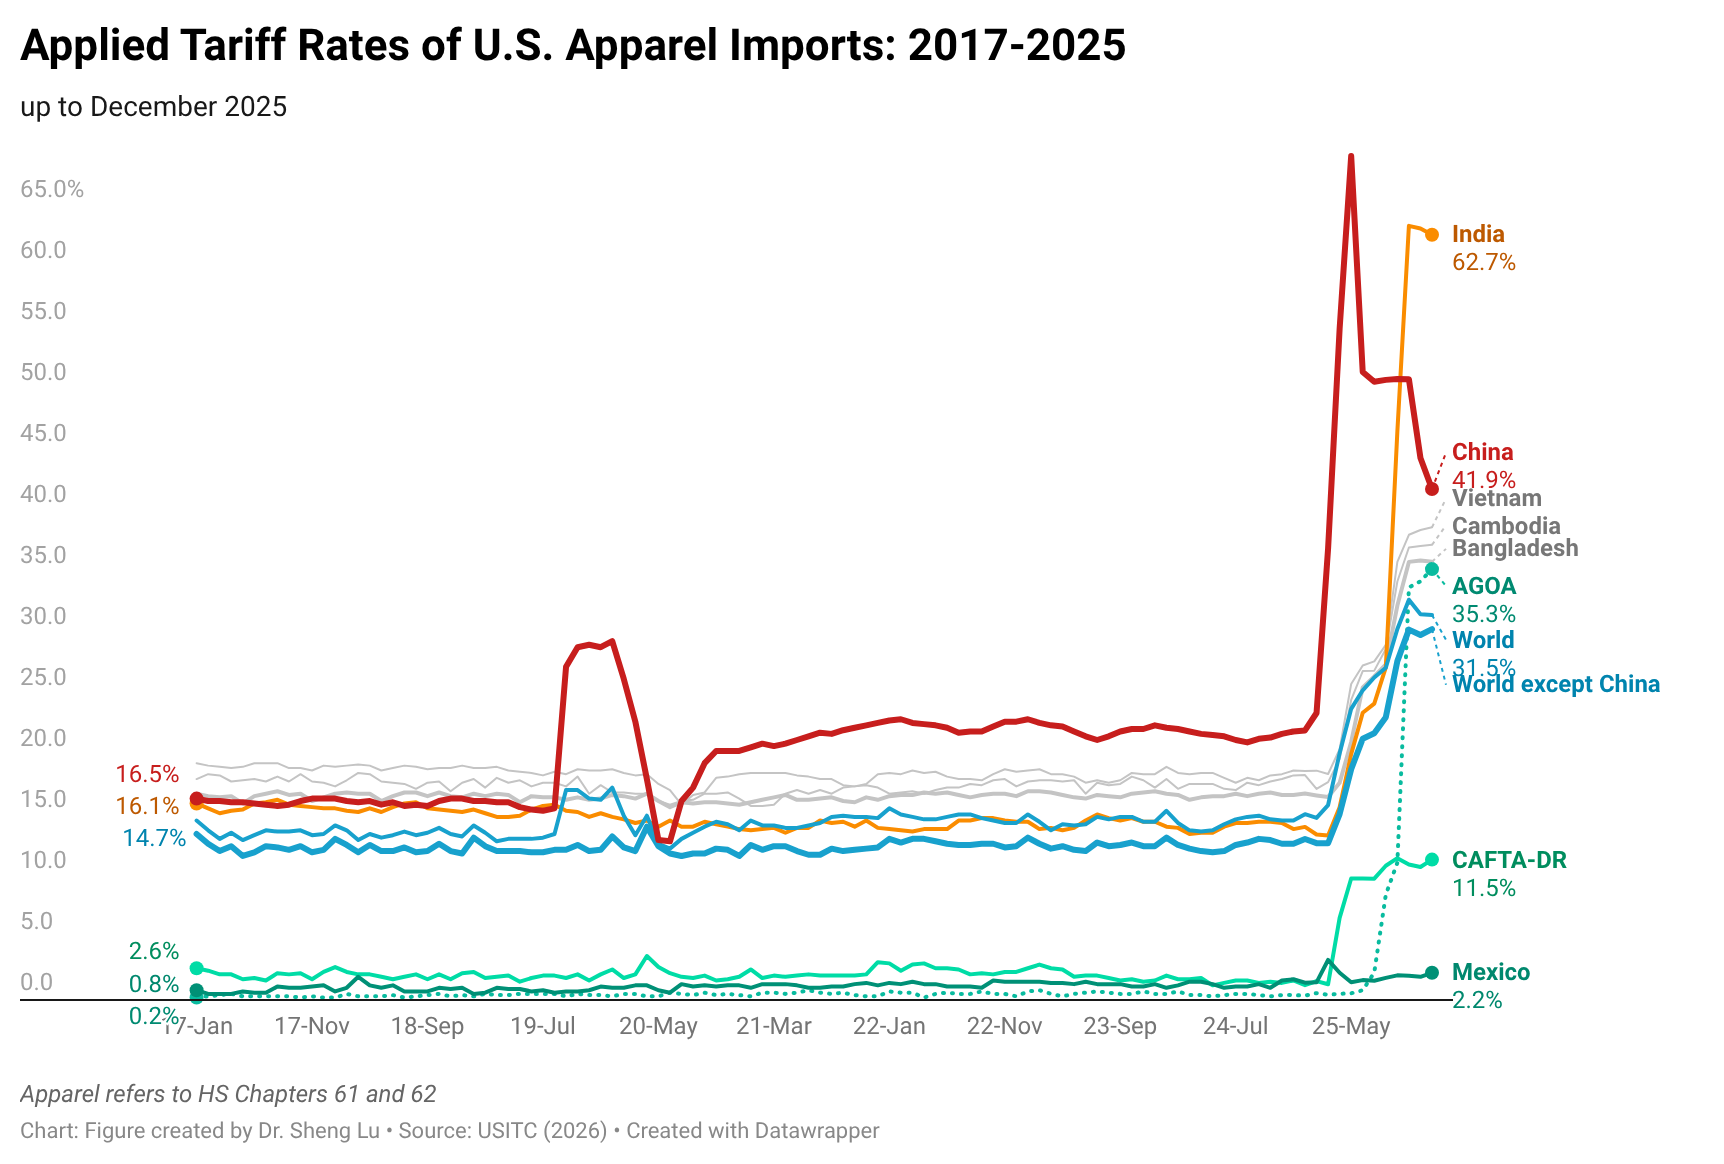
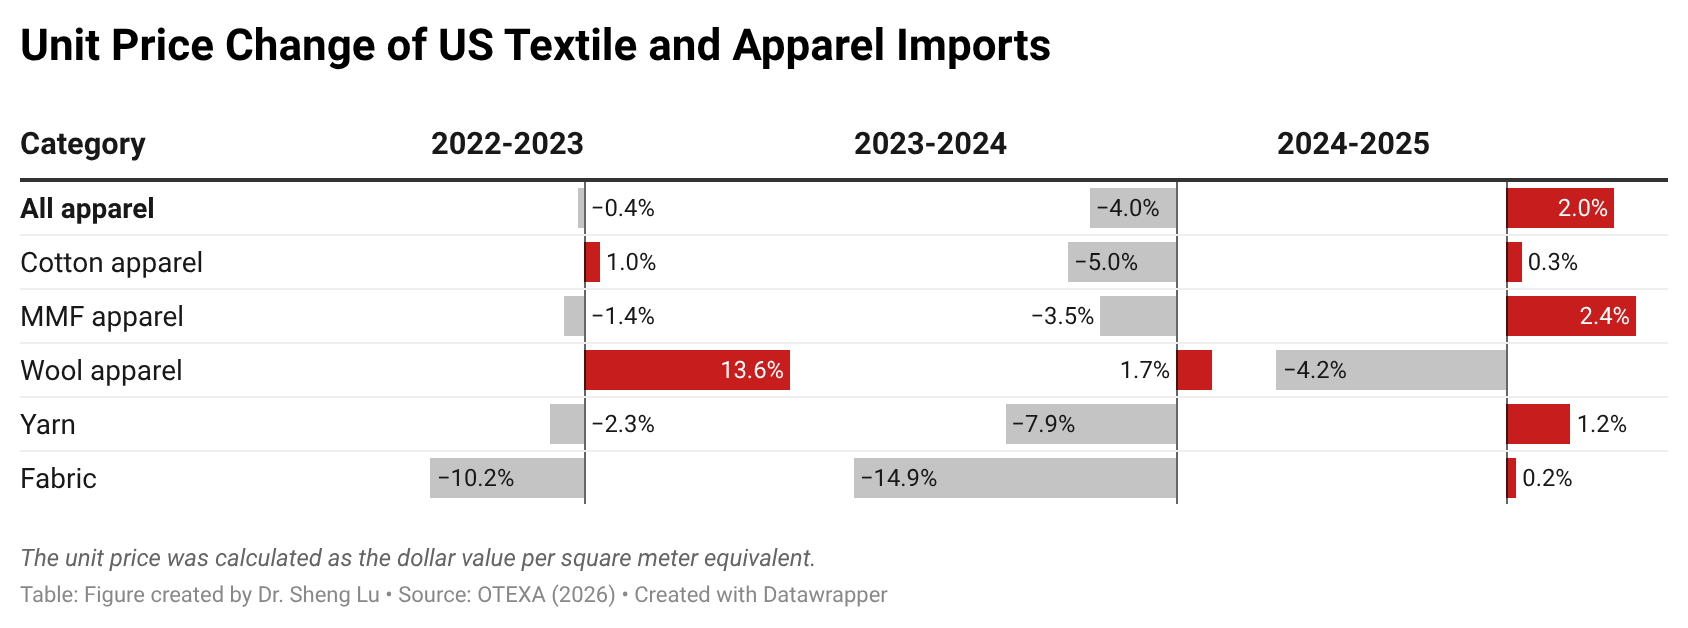
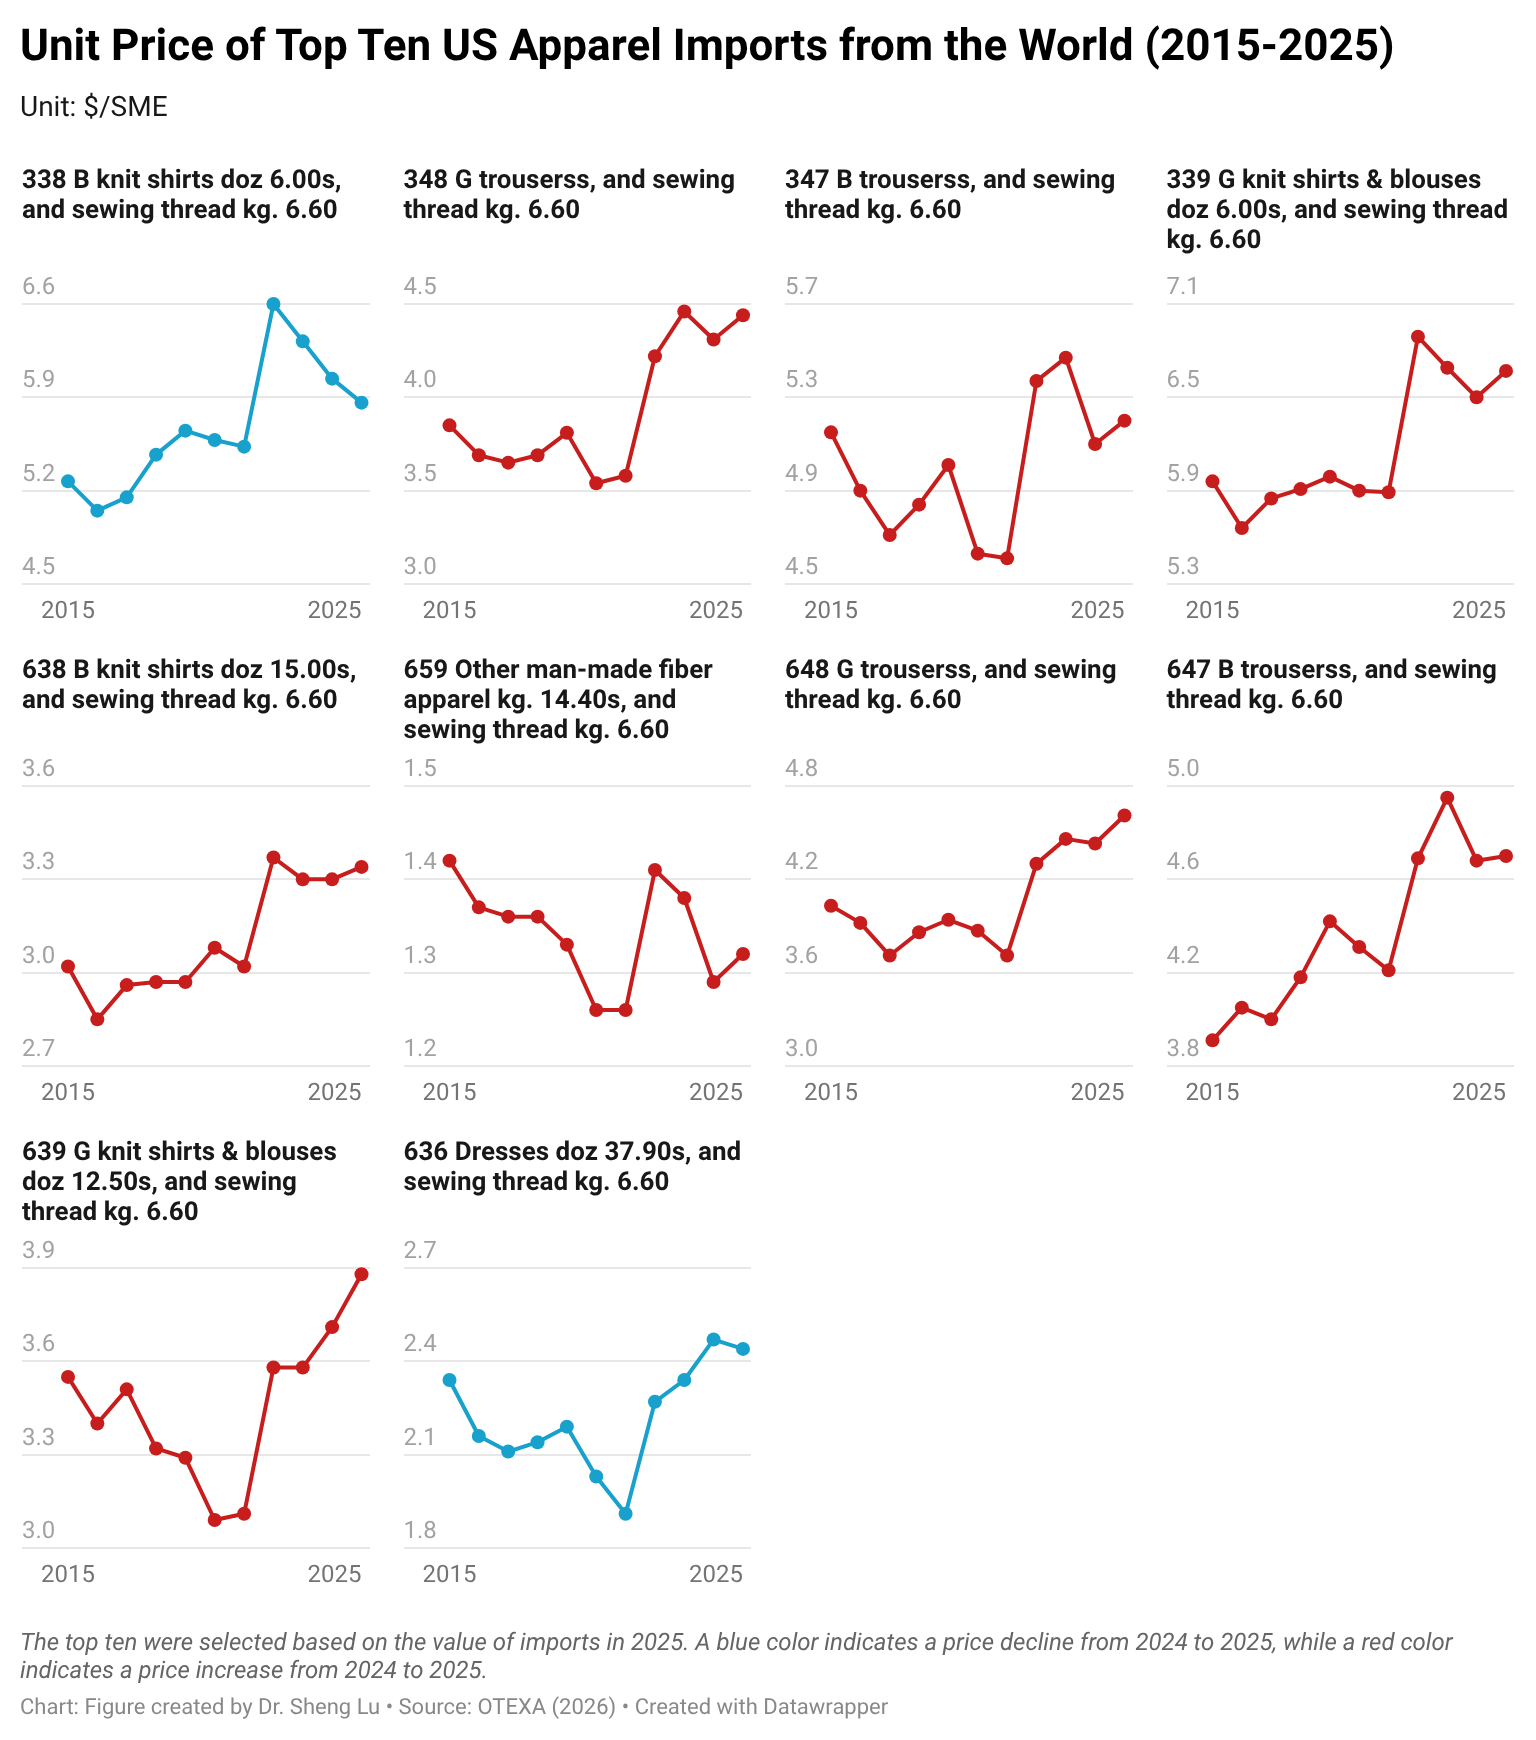
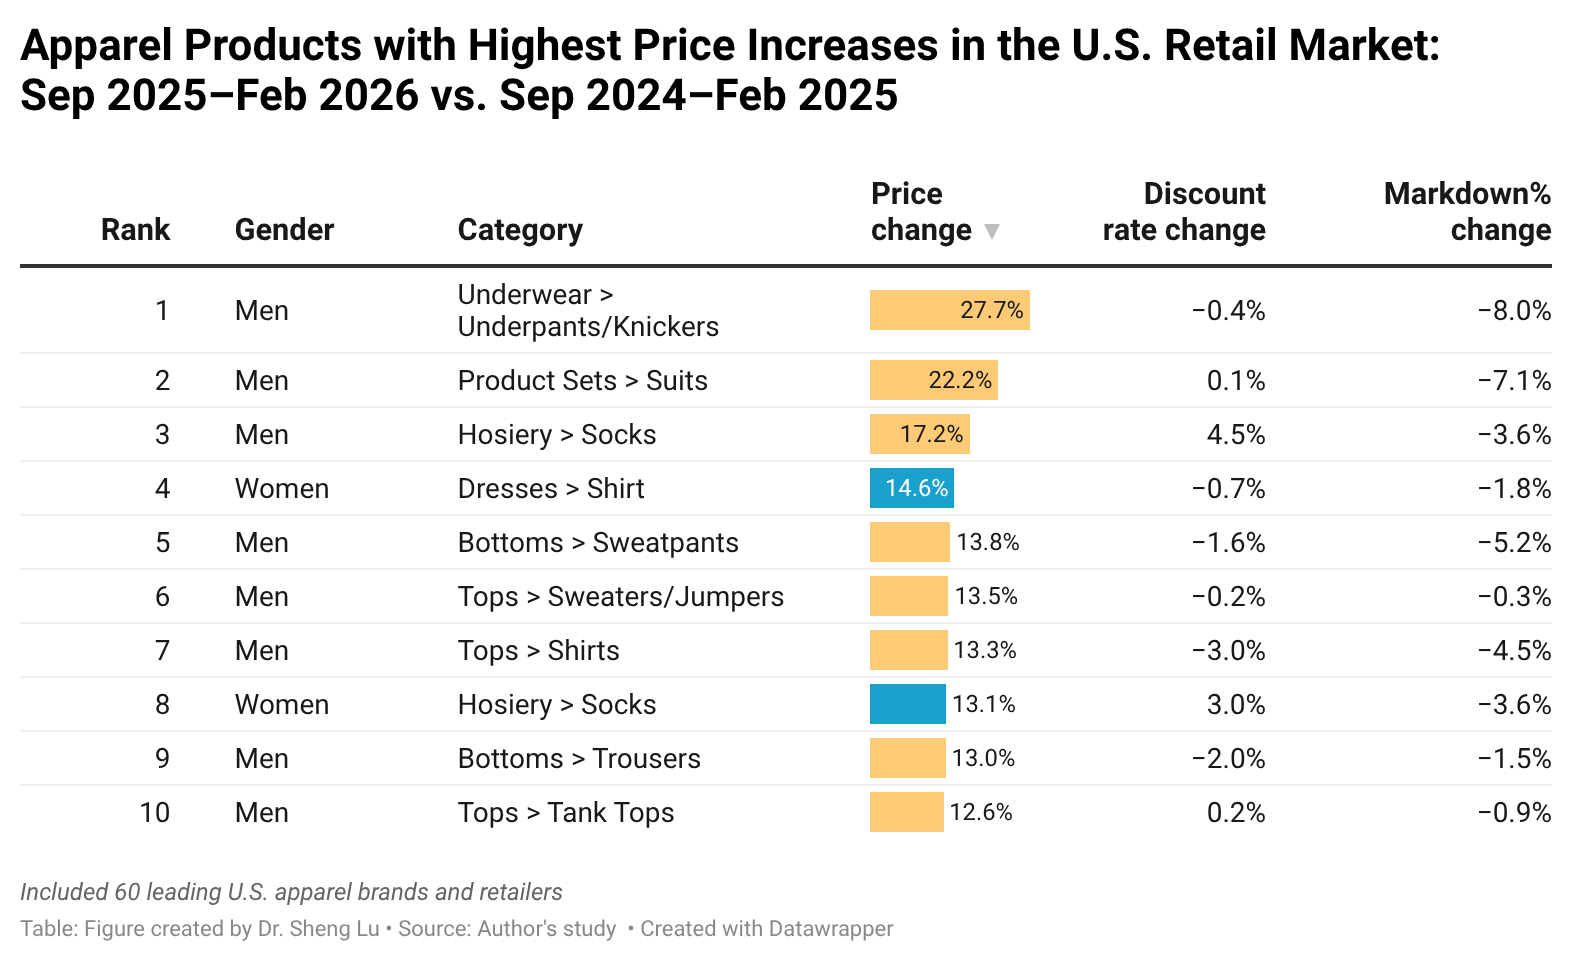
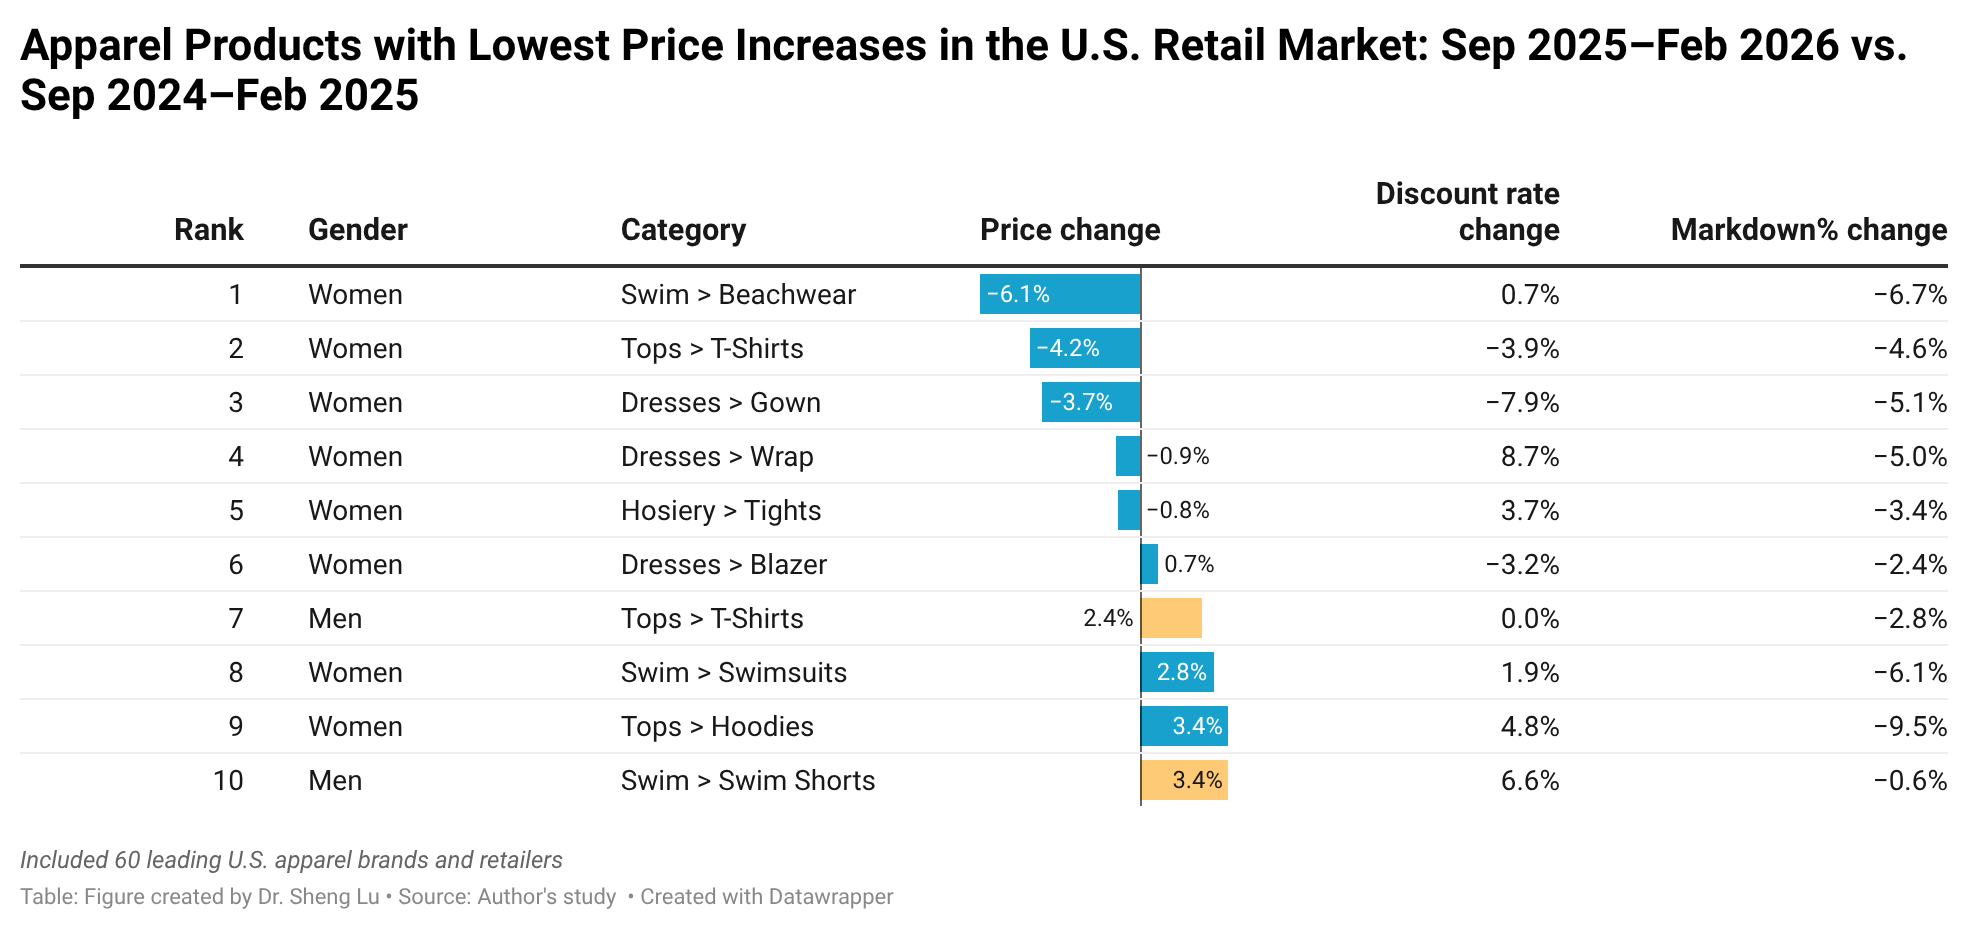
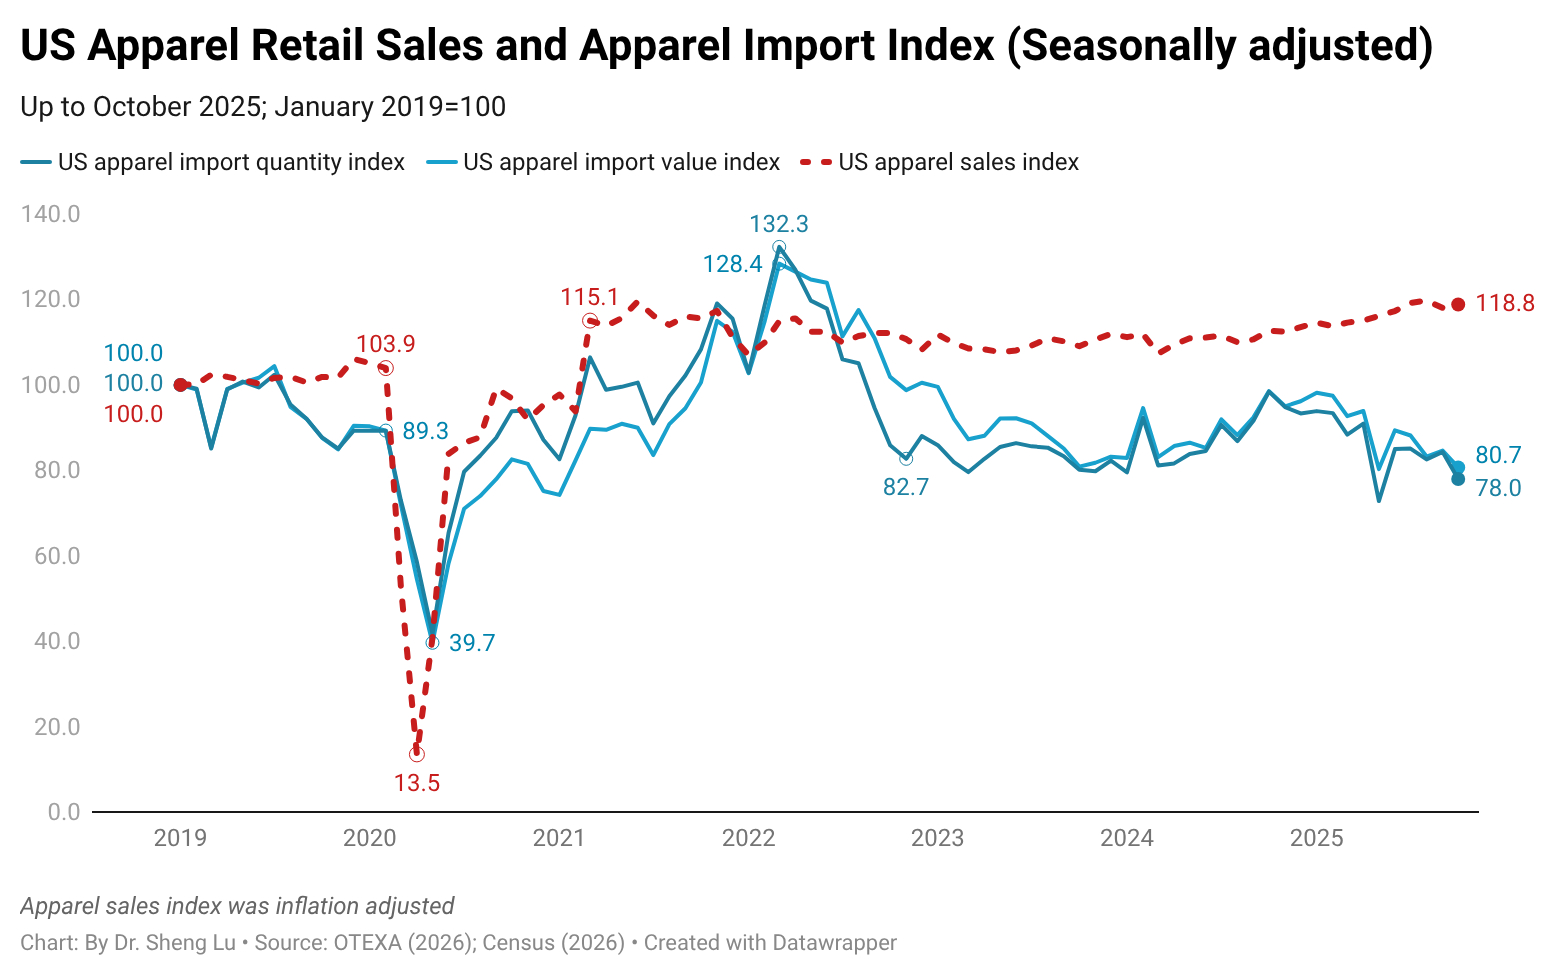
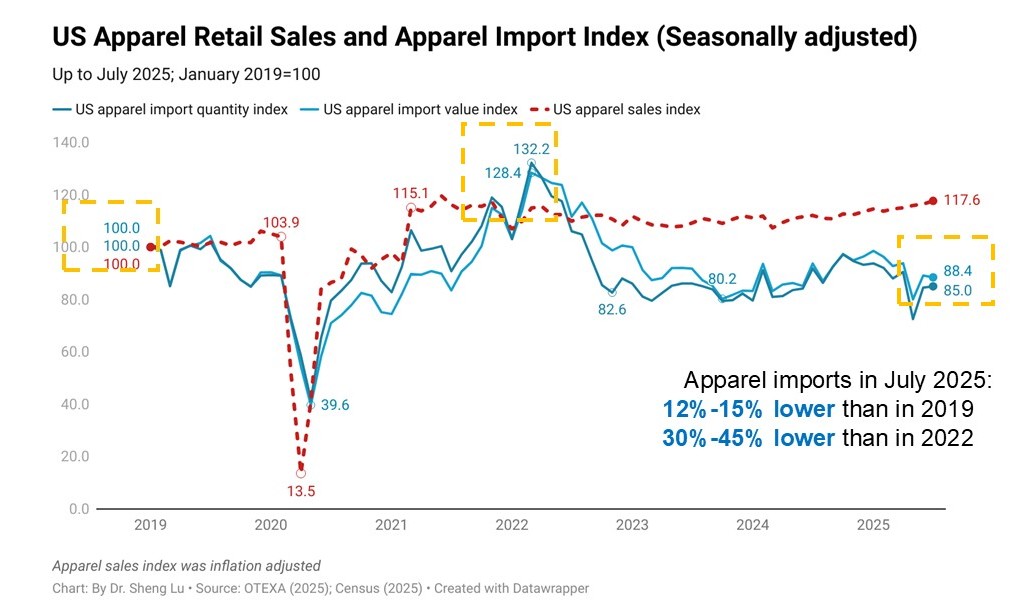
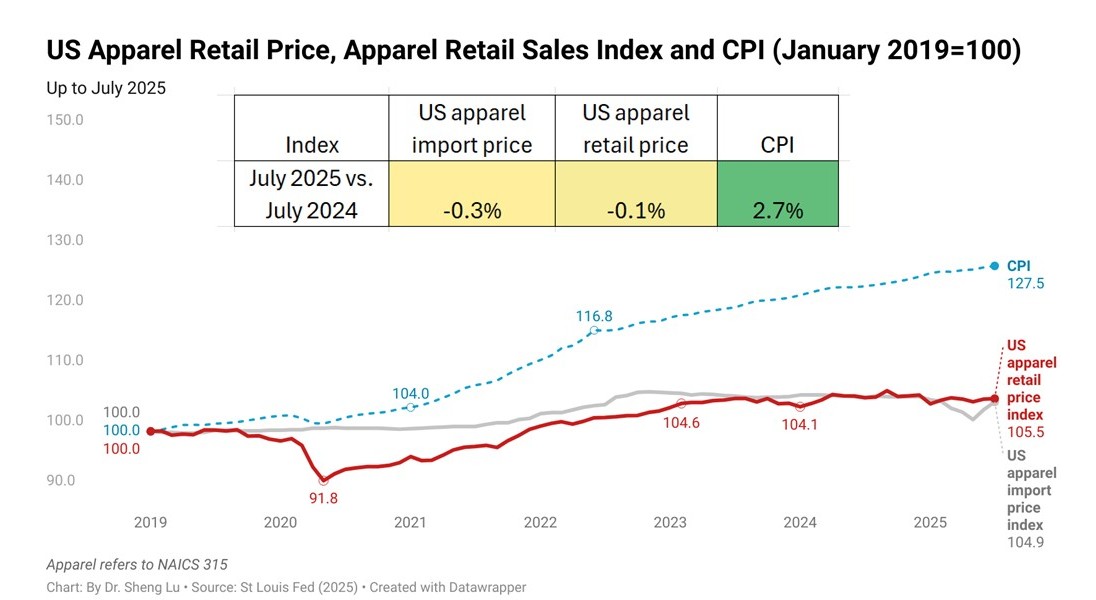
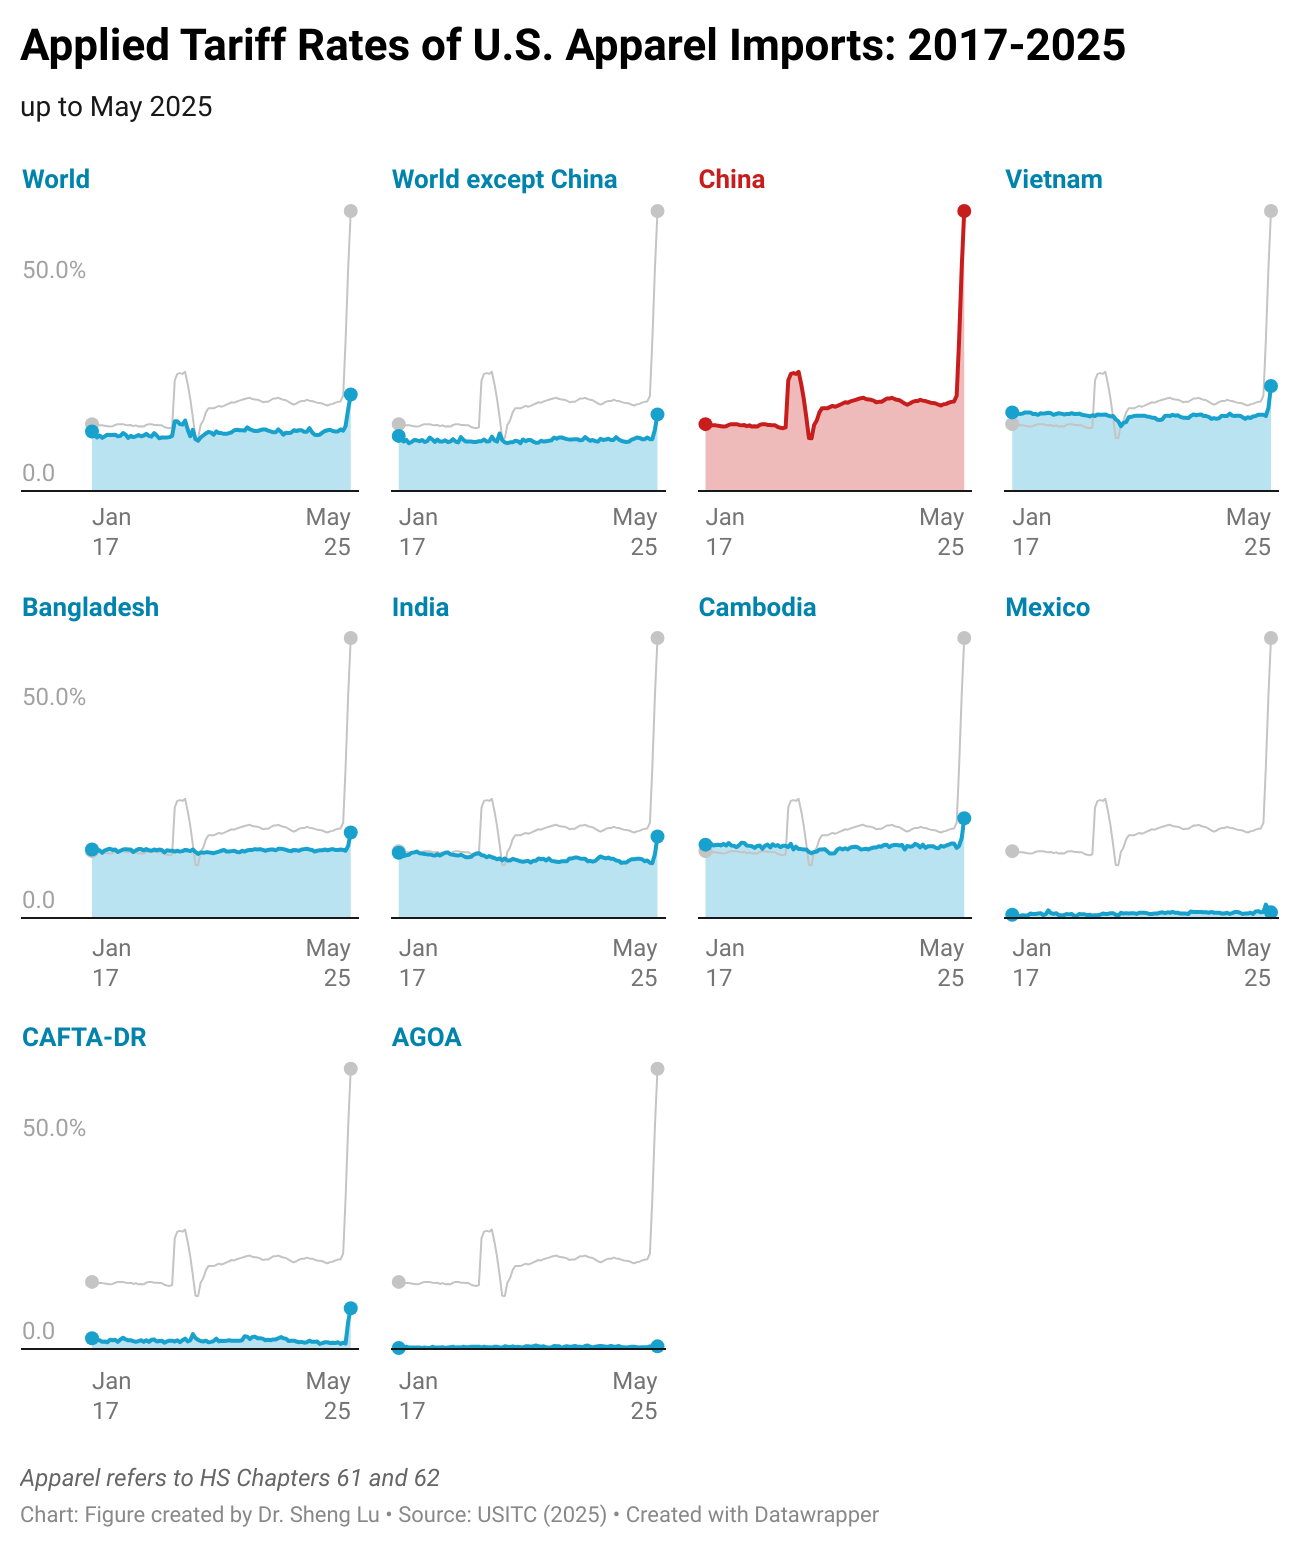
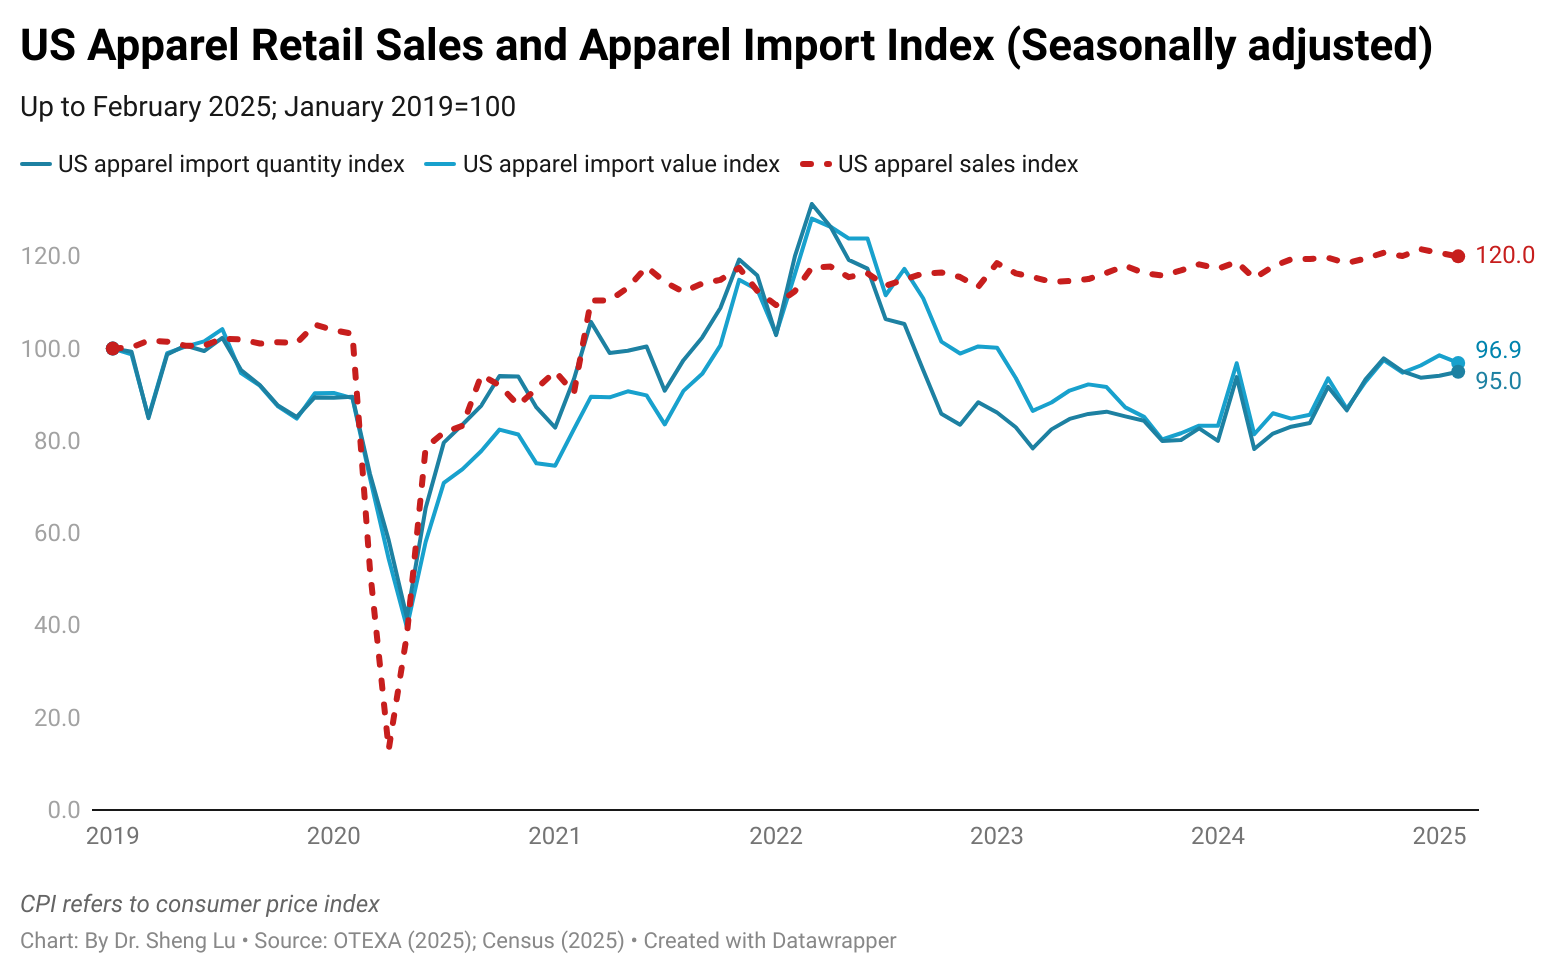
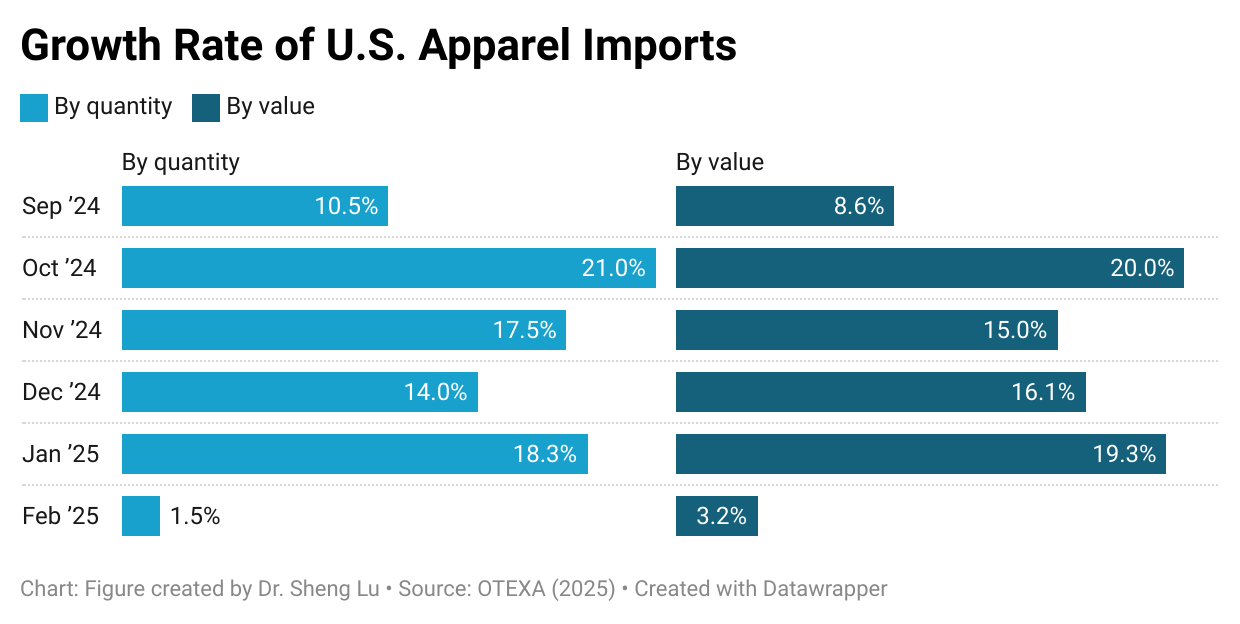
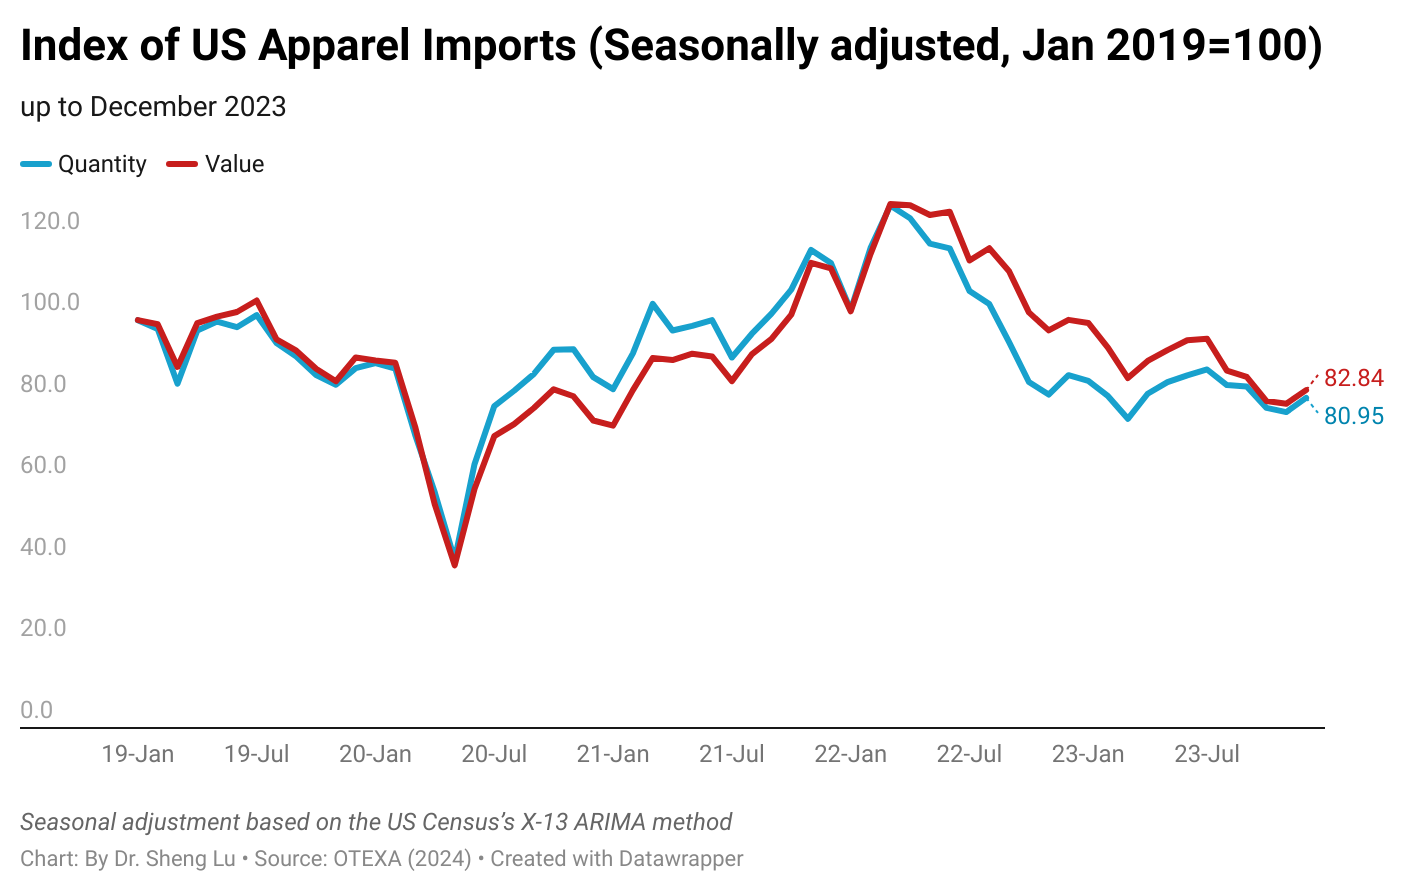
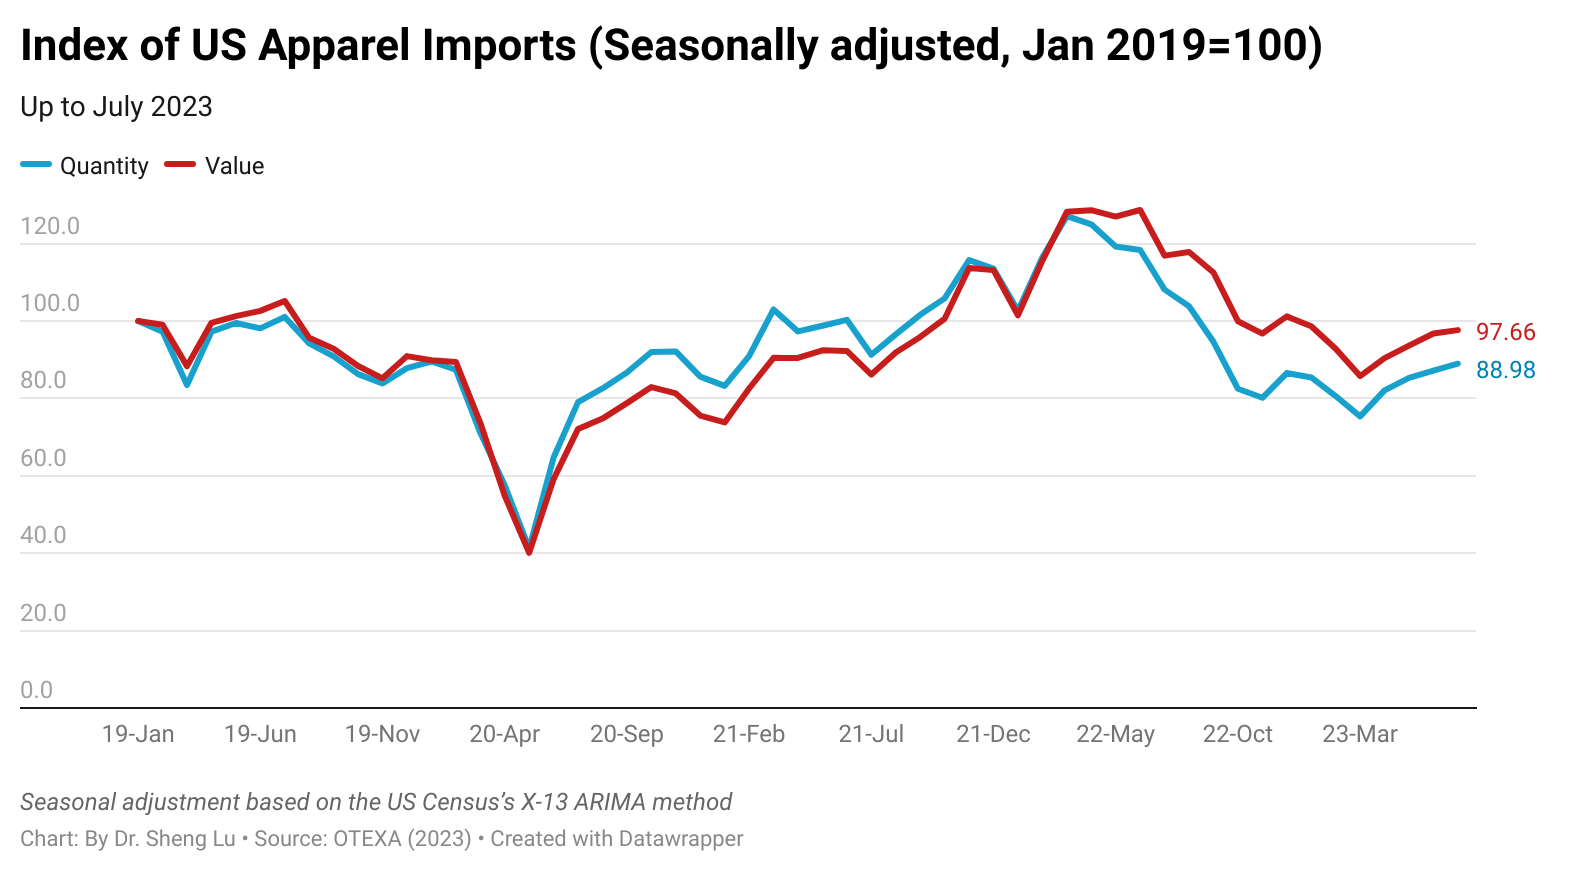
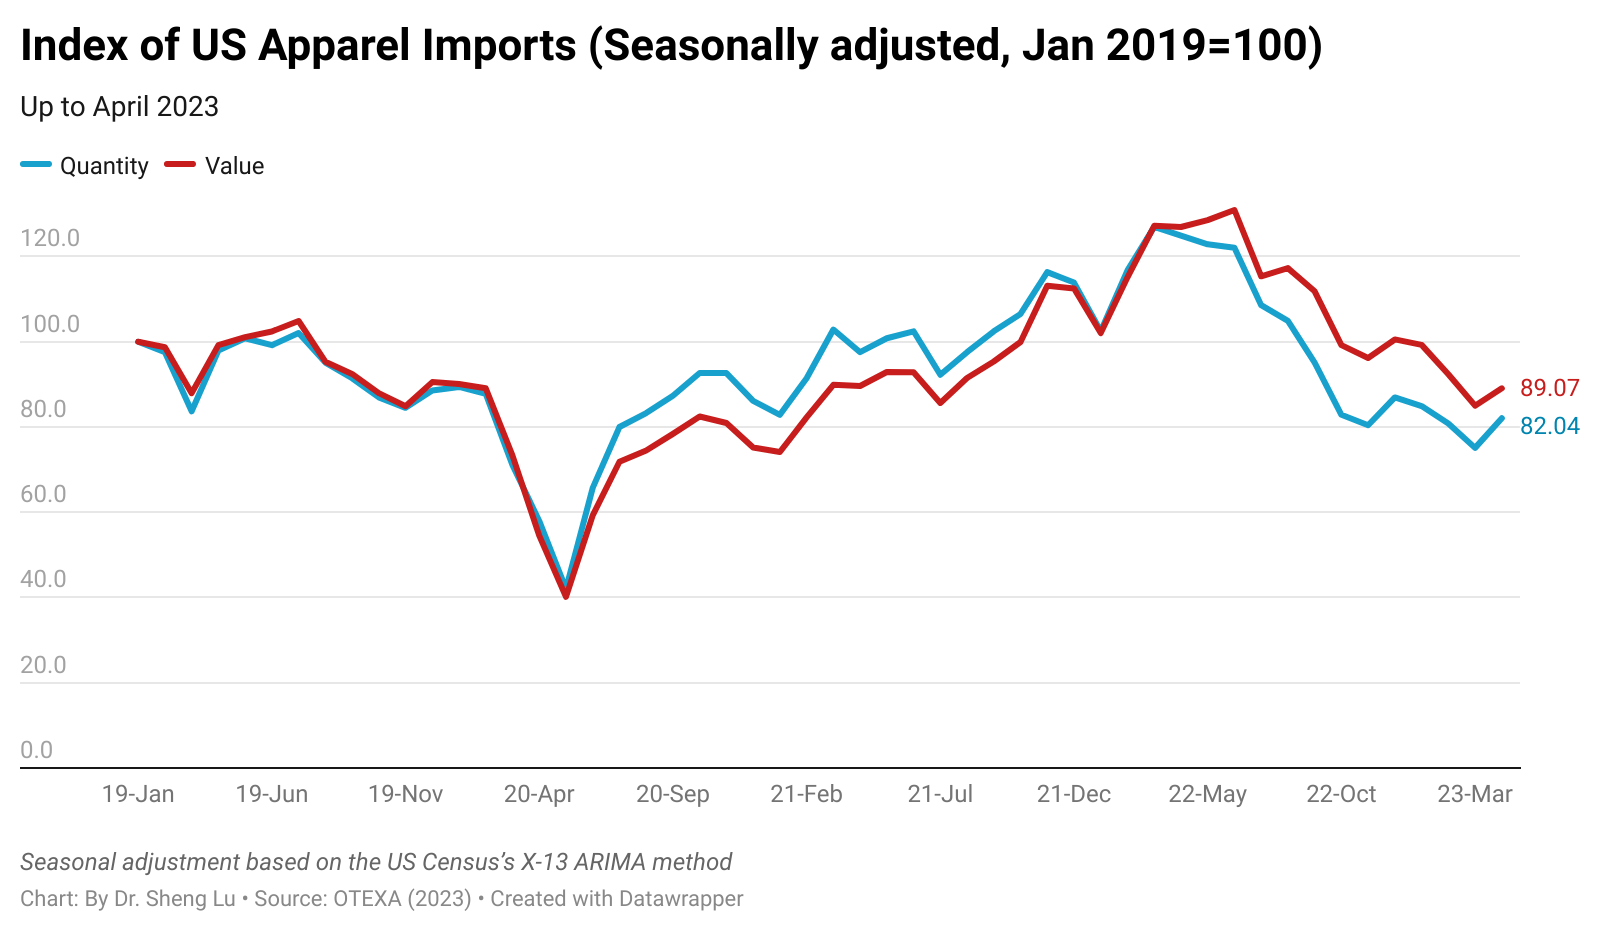
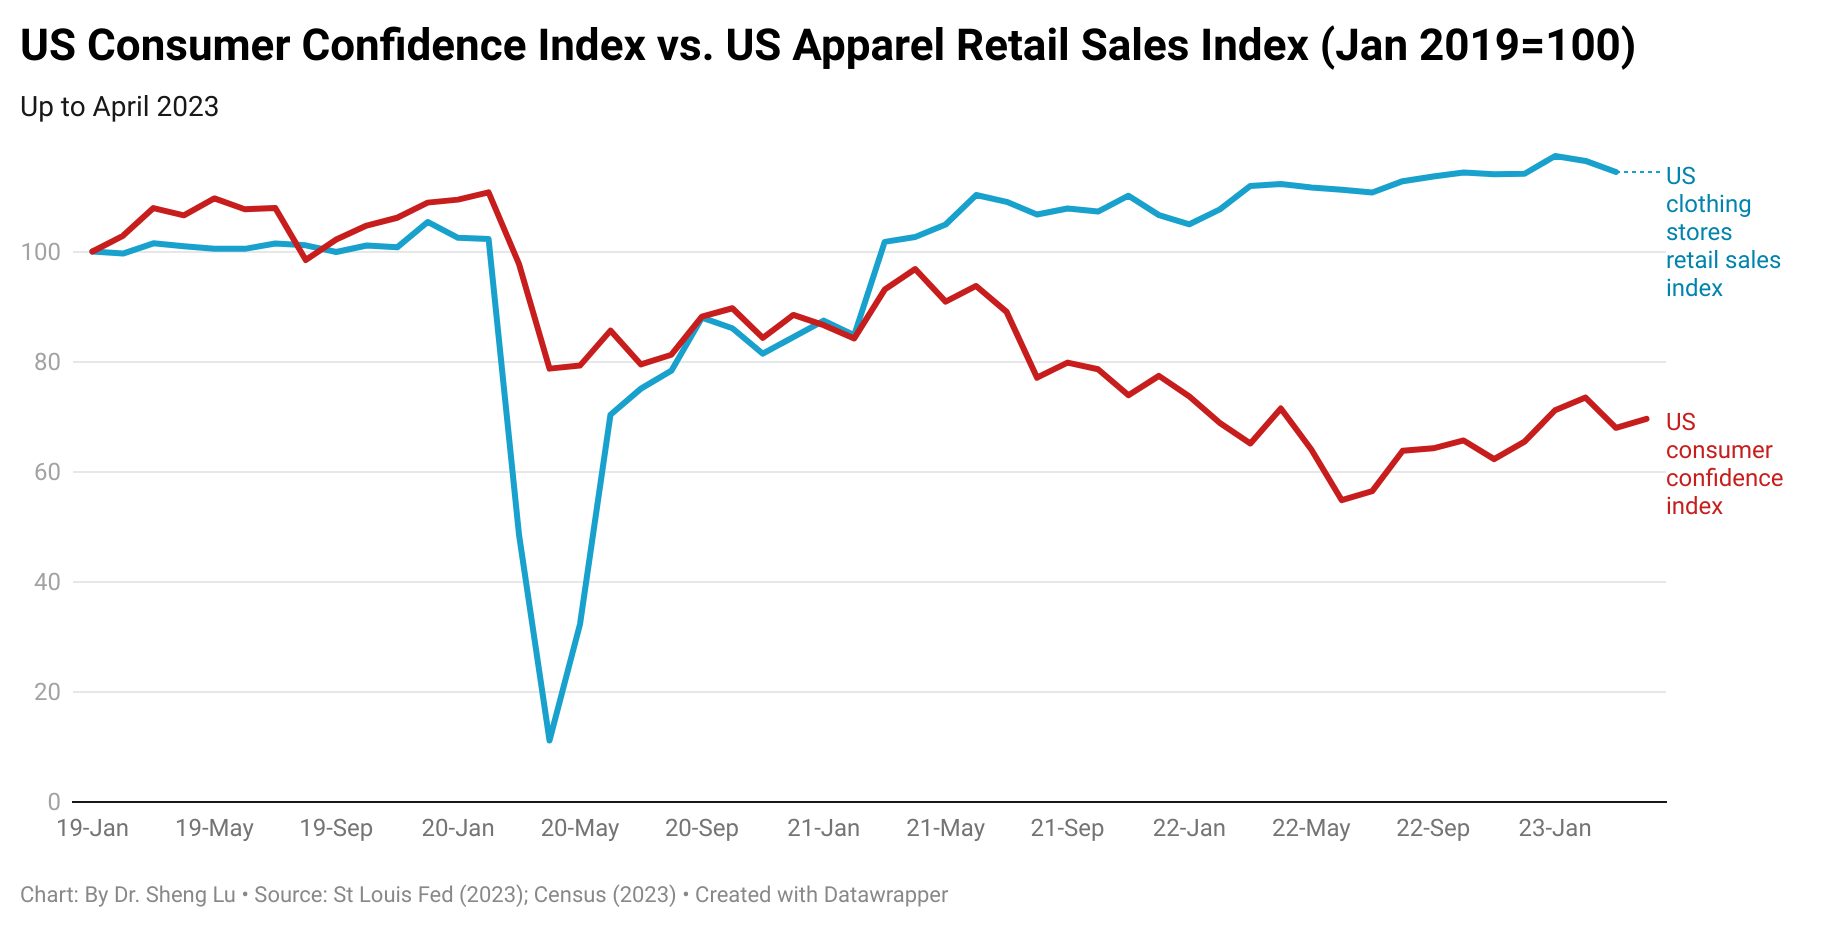
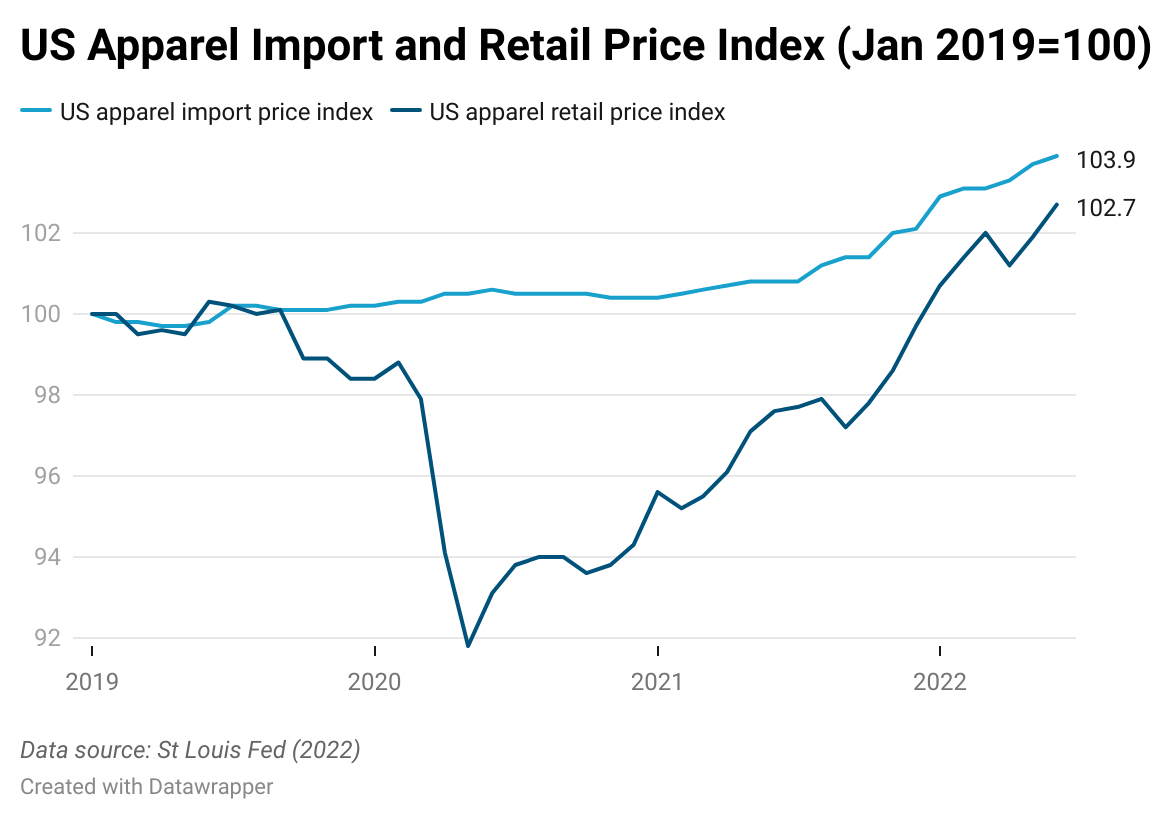
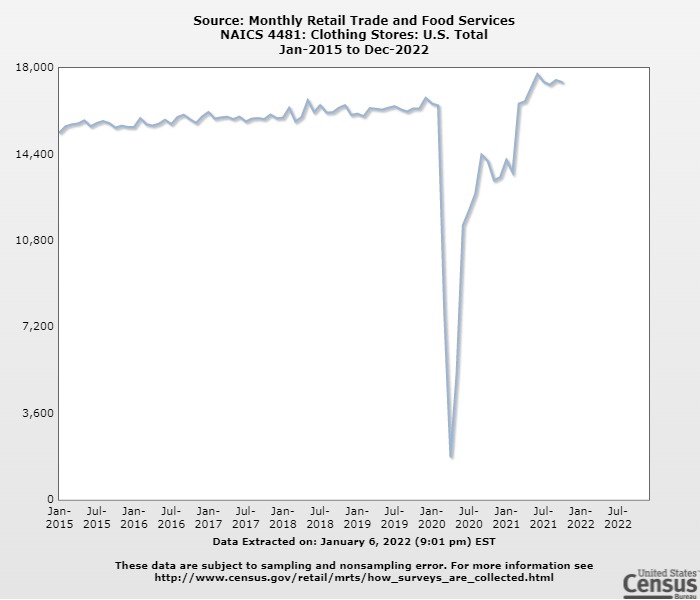
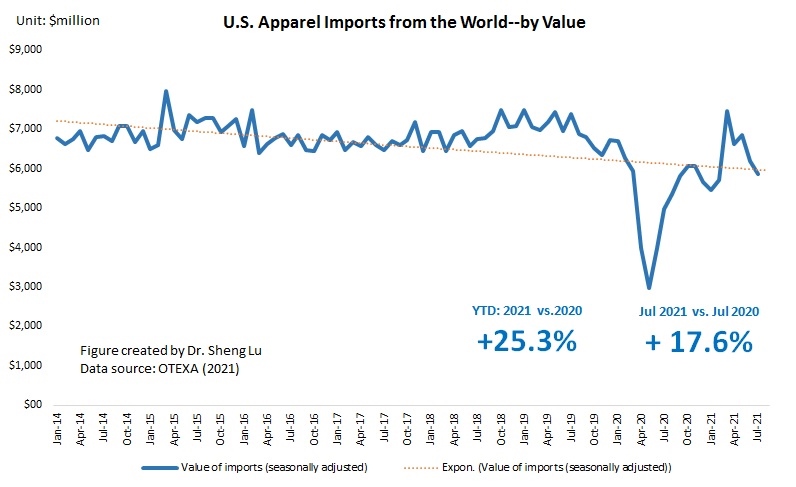
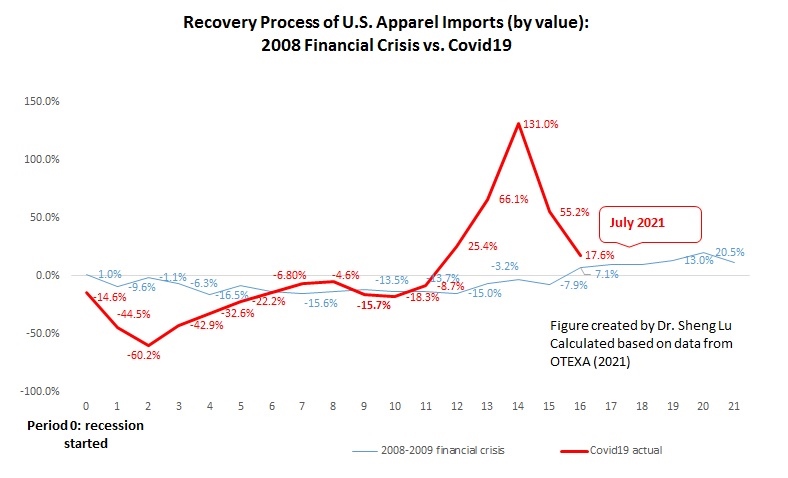
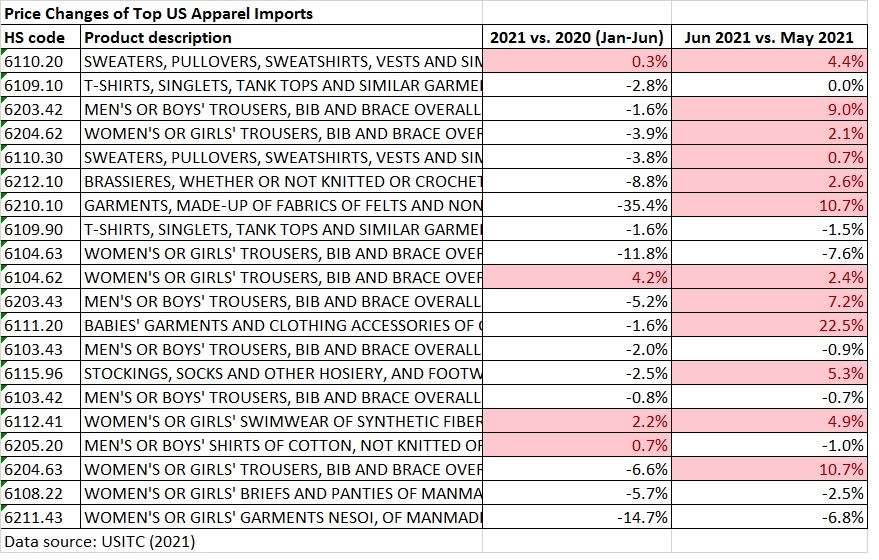
On the other hand, claims of structural overcapacity in the textile and apparel sector are not well supported by evidence. In industries characterized by persistent excess capacity, such as steel or solar panels, the imbalance between supply and demand typically results in sustained price depression and large volumes of unsold industrial output. However, the global apparel markets have not experienced such systematic price collapses, and US apparel imports have become even more expensive, especially in 2025.
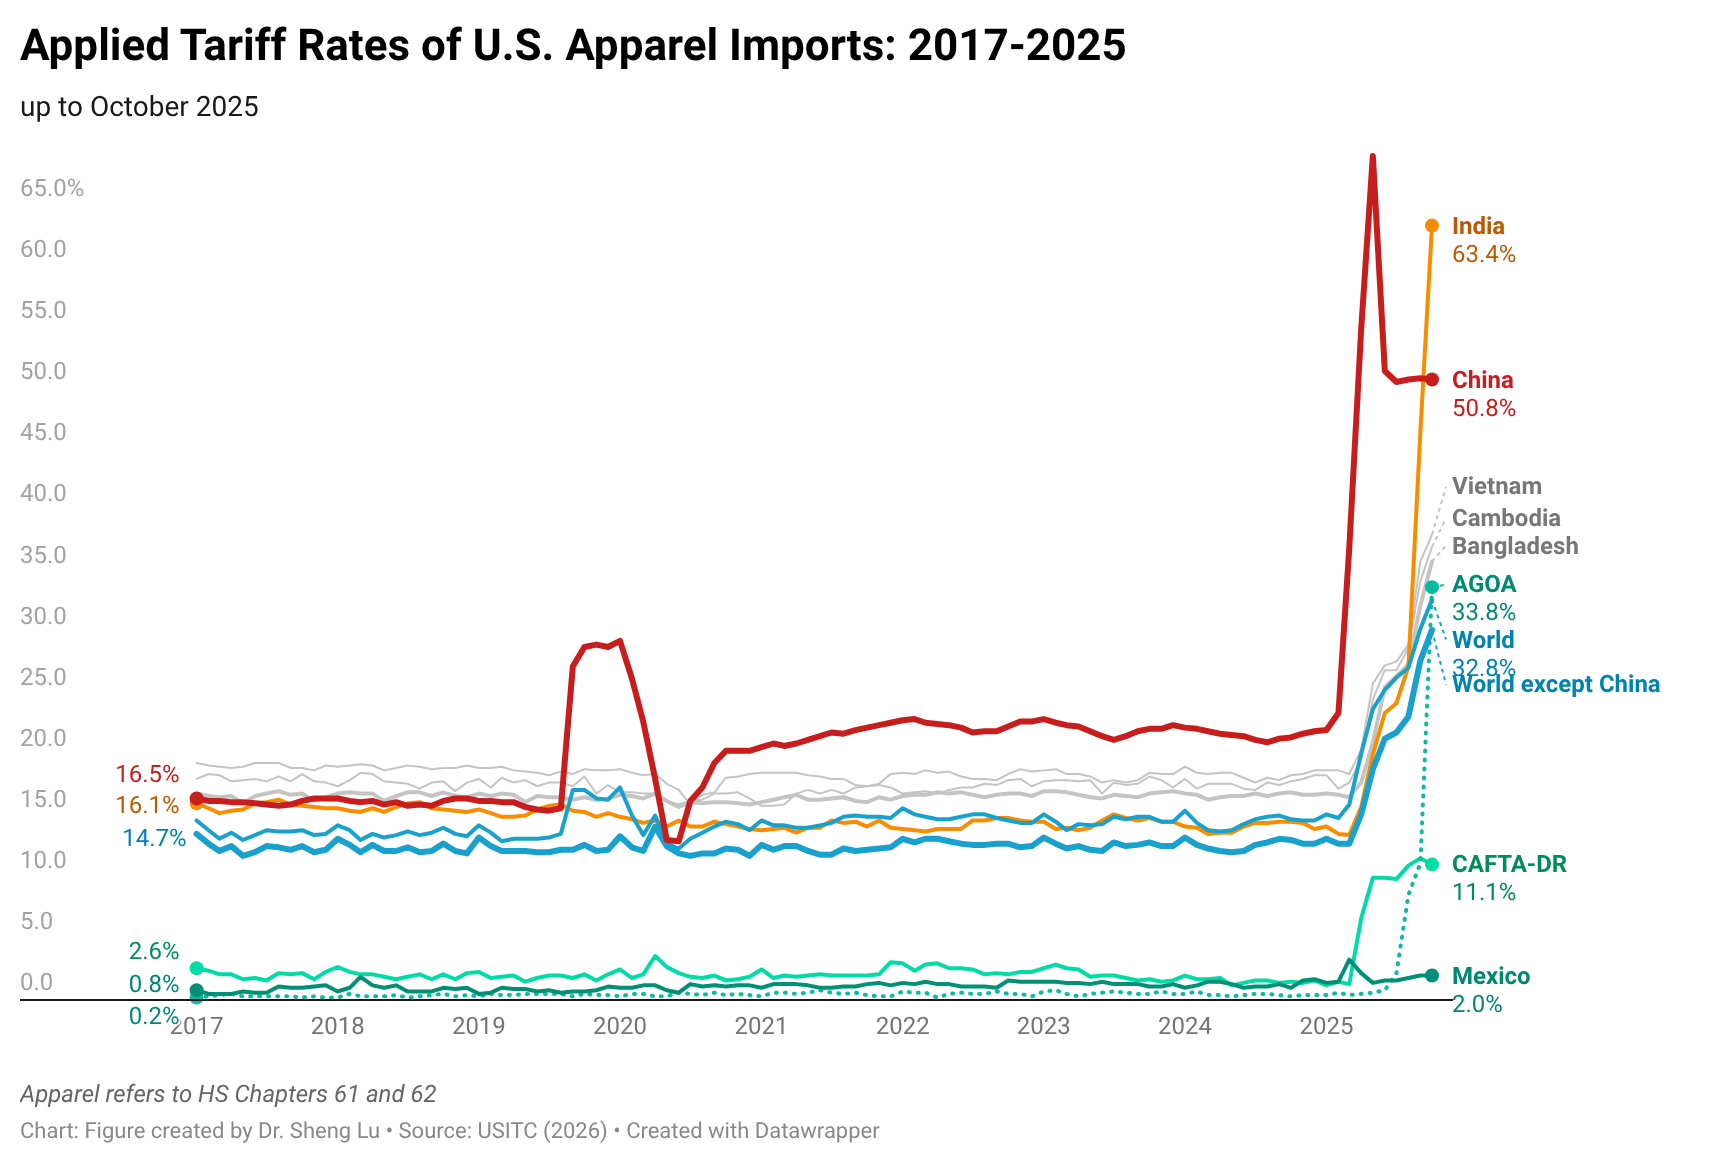
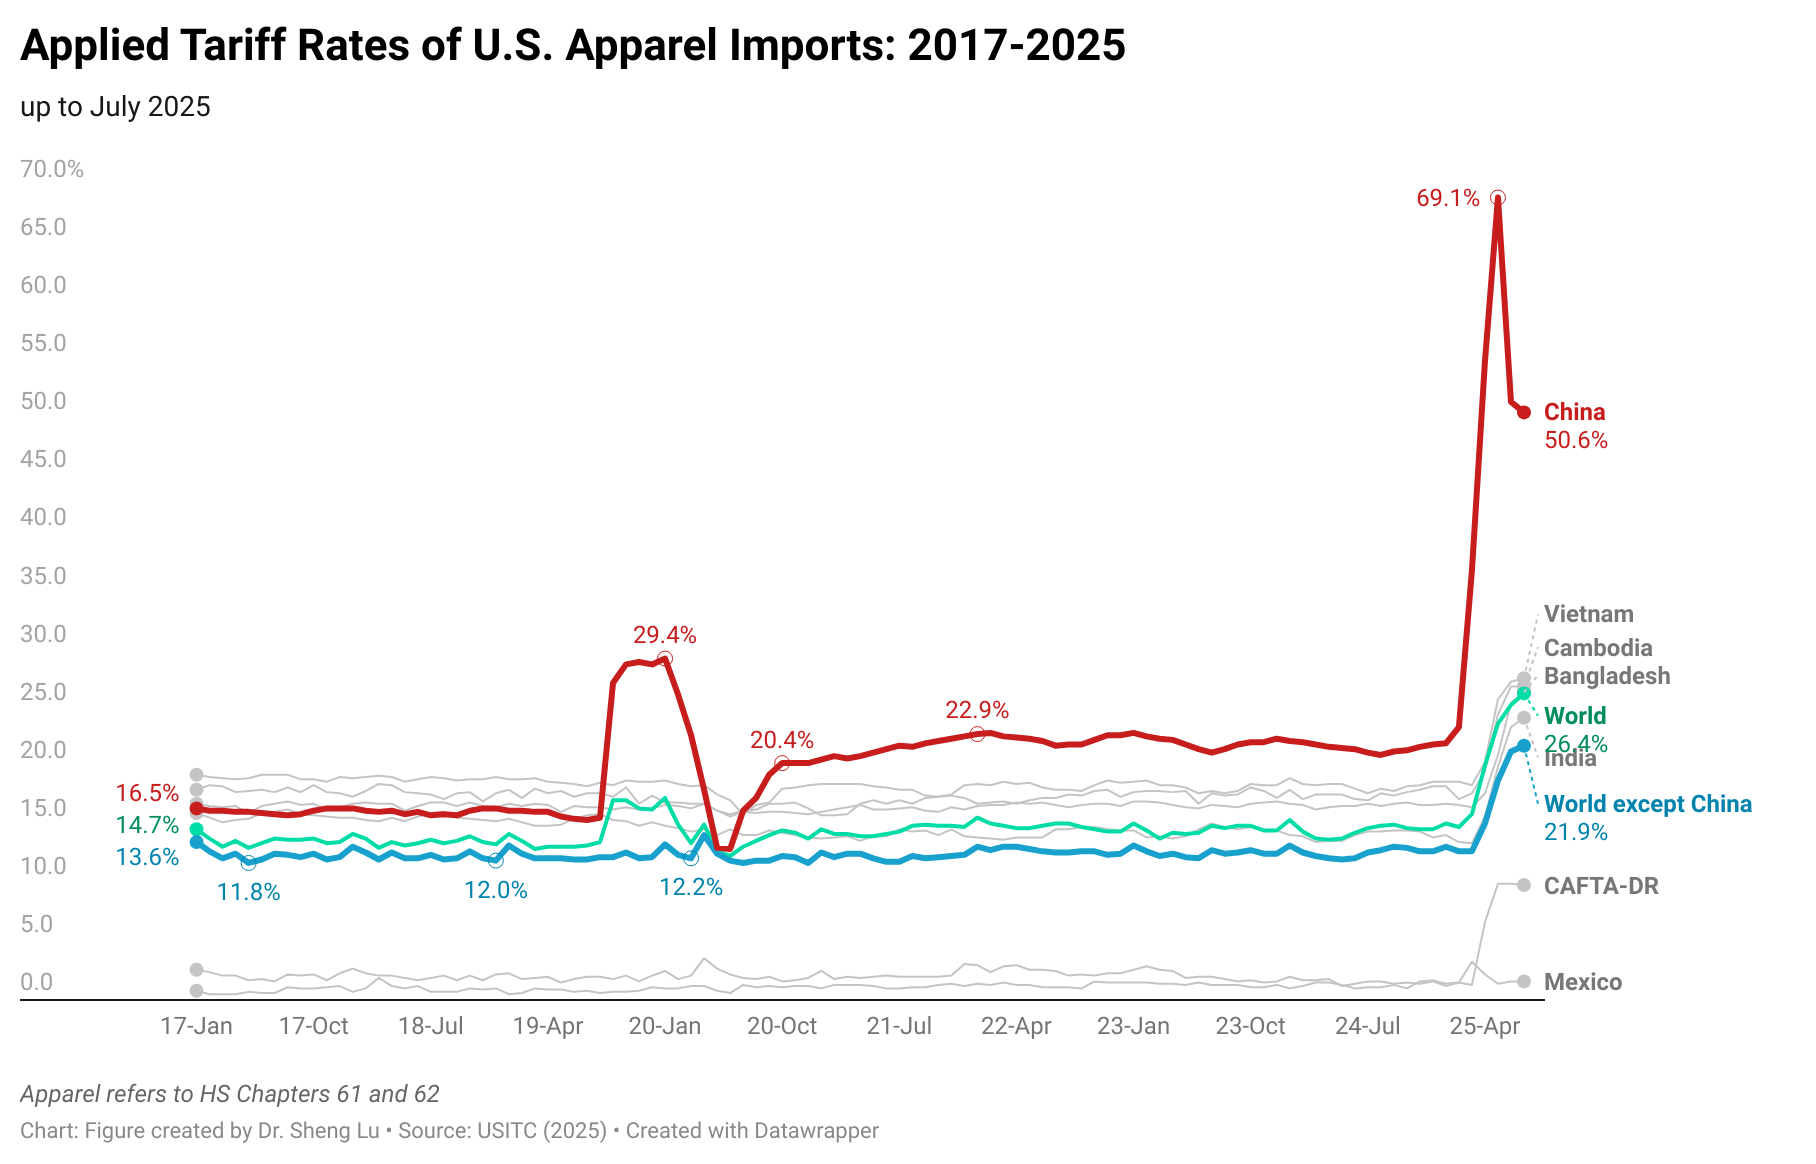
Additionally, higher U.S. tariffs on apparel imports are most likely to shift production rather than reduce it. For example, U.S. fashion companies may redirect sourcing to countries or regions with lower tariff rates. At the same time, exporting countries may divert shipments from the U.S. to alternative markets such as the EU, leaving global production capacity largely unchanged. Ironically, higher U.S. market prices driven by tariffs may “encourage” greater global production, as suppliers, including those in the U.S., expand output to capture a higher margin, thereby worsening the “excess capacity” problem.
by Sheng Lu