FASH455 Video Discussion: The State of Textiles and Apparel “Made in Asia” (Updated February 2024)

Video 1: Asian factories struggling to keep young workers, U.S. prices may rise as a result

Video 2: Taiwan’s textile machinery industry

Video 3: How Millions Of Jeans Get Recycled Into New Pairs in Pakistan
Video 4: Vietnam Sustainable Garment Manufacturer

Discussion questions:

#1 How are textiles and apparel “Made in Asia” changing their faces? What are the driving forces of these changes?

#2 Should US fashion brands and retailers de-couple with China or prepare to do so? What is your valuation?

#3 How would you assess Asia’s competitiveness as a hub for textile and apparel production and sourcing in the next five years? Why? What relevant factors could come into play?

#4  Is there anything else in the videos that you find interesting, intriguing, thought-provoking, or debatable? Why?

(Note: Anyone is welcome to join the discussion. For students in FASH455, please address at least two questions. Please mention the question number in your response, but there is no need to repeat the question).

Hinrich Foundation Study: Impact of US anti-forced labor laws on Vietnam’s textile industry

A new study released by the Hinrich Foundation in July 2023 evaluated the impact of the implementation of the Uyghur Forced Labor Prevention Act (UFLPA) on Vietnam’s textile and apparel industry.

The study’s findings were based on interviews with “senior leaders and owners of Vietnam’s garment and textile small and medium-sized enterprises (SMEs).” (Note: However, the study didn’t specify when and how many interviews were conducted.) Below are the summarized key findings:

#1: Vietnam’s textile and apparel industry heavily uses cotton imported from China. As noted in the study, in 2021, China accounted for nearly 30% of Vietnam’s cotton imports (ranked #1, $1.48 billion out of total $4.99 billion imports), surpassing the US ($1.05 billion).

#2: Vietnam’s garment exports may contain Xinjiang cotton. According to the study, “Once the cotton arrives in Vietnam, international intermediary manufacturers create finished garments from semi-finished products to export globally, often using the same materials from banned Chinese suppliers. This results in the ‘laundering’ of Xinjiang cotton.”

#3: Vietnam textile and apparel SMEs report challenges in proving the origin of cotton in fabrics. For example, one respondent says, “Differentiating between cotton products coming from different sources is challenging as they might have been blended while being transported by sea. Suppliers from China, Vietnam, Bangladesh, India, and Pakistan may engage in this practice to falsely label Xinjiang cotton as coming from other locations to circumvent this act.”

#4: Vietnam’s textile and apparel SMEs say the UFLPA implementation has negatively affected their exports to the United States.

  • CBP’s statistics show that (current as of July 1, 2023), since UFLPA’s implementation in June 2022, a more significant amount of Vietnam’s textiles, apparel, and footwear were affected by law enforcement than those from China (e.g., $20 million vs.$16.2 million investigated and $3.53 million vs.$1.04 million denied access).
  • US fashion companies are sourcing LESS from Vietnam due to forced labor concerns. According to one respondent, “My company is producing apparel products for several US-based fashion brands and uses materials from China and exports to the US. Since UFLPA was in place in June 2022, they have ordered less from us. It seems that our partners feel pressure from the regulators, so they are looking for alternative risk-free suppliers.
  • The surveyed SMEs also expect MORE of Vietnam’s textile and apparel exports to be investigated under the UFLPA enforcement down the road. Some SMEs commented that “it would be hard for US firms to rapidly find alternative suppliers in a short time, therefore more checks on Vietnamese cargoes are to be expected.
  • The study acknowledges that “In the worst-case scenario, Vietnamese SMEs may lose market access if their American importers are unable to verify that the supply chain is free from inputs produced via forced labor.”

#5: UFLPA also increased the trade compliance costs of “Made in Vietnam,” a significant challenge to many SMEs. One respondent commented, “Compliance with the UFLPA may pose a challenge for SMEs due to the higher costs associated with providing the necessary documentation of their supply chains. This could be due to the need to conduct additional audits, hire external consultants, or implement new tracking systems.”

Additionally, the report called for Vietnam’s textile and apparel SMEs to 1) diversify the supply chain, especially using more cotton imports from the US, India, Australia, and Brazil. 2) enhance supply chain traceability (note: how to make it happen remains a big question mark); 3) engage in dialogue with US authorities.

Inside Garment Factories in Vietnam, Cambodia, and Sri Lanka (updated April 2023)

Garment factories in Vietnam
Garment factories in Cambodia
Garment factories in Sri Lanka

Discussion questions (proposed by students in FASH455, spring 2023)

  • Based on the videos, does the flying geese concept still work today? Why?
  • Do you think Western fashion brands and retailers’ increasing emphasis on sustainability and social responsibility in apparel sourcing reduces Asian suppliers’ competitive disadvantage? Why or why not?
  • With Asian countries increasingly leveraging their labor advantages alongside advanced technologies, is the prospect of expanding nearshoring even less likely? What is your assessment?
  • What is your vision for the recycled clothing supply chain? Why or why not do you think Asian countries will continue to dominate?

2022 USFIA Fashion Industry Benchmarking Study Released

[The 2023 USFIA Benchmarking Study is now available]

Report release webinar (July 18, 2022)

The full report is available HERE

Key findings of this year’s report:

U.S. fashion companies report significant challenges coming from the macro-economy in 2022, particularly inflation and rising cost pressures. However, most respondents still feel optimistic about the next five years.

  • Respondents rated “increasing production or sourcing costs” and “inflation and outlook of the U.S. economy” as their 1st and 3rd top business challenges in 2022.
  • As a new record, 100 percent of respondents expect their sourcing costs to increase in 2022, including nearly 40 percent expecting a substantial cost increase from a year ago. Further, almost everything has become more expensive this year, from textile raw materials, shipping, and labor to the costs associated with compliance with trade regulations.
  • Over 90 percent of respondents expect their sourcing value or volume to grow in 2022, but more modest than last year.
  • Despite the short-term challenges, most respondents (77 percent) feel optimistic or somewhat optimistic about the next five years. Reflecting companies’ confidence in their businesses, nearly ALL respondents (97 percent) plan to increase hiring over the next five years.

U.S. fashion companies adopt a more diverse sourcing base in response to supply chain disruptions and the need to mitigate growing sourcing risks.

  • Asia remains the dominant sourcing base for U.S. fashion companies—eight of the top ten most utilized sourcing destinations are Asia-based, led by China, Vietnam, Bangladesh, and India.
  • More than half of respondents (53 percent) report sourcing apparel from over ten countries in 2022, compared with only 37 percent in 2021.
  • Reducing “China exposure” is one crucial driver of U.S. fashion companies’ sourcing diversification strategy. One-third of respondents report sourcing less than 10% of their apparel products from China this year. In addition, a new record of 50 percent of respondents sources MORE from Vietnam than China in 2022.
  • Nearly 40 percent of respondents plan to “source from more countries and work with more suppliers” over the next two years, up from only 17 percent last year.

Managing the risk of forced labor in the supply chain is a top priority for U.S. fashion companies in 2022, especially with the new implementation of the Uyghur Forced Labor Prevention Act (UFLPA).

  • Over 95 percent of respondents expect UFLPA’s implementation to affect their company’s sourcing. Notably, more than 85 percent of respondents plan to cut their cotton-apparel imports from China, and another 45 percent to further reduce non-cotton apparel imports from the country.
  • Most respondents (over 92 percent) do NOT plan to reduce apparel sourcing from Asian countries other than China. However, nearly 60 percent of respondents also would “explore new sourcing destinations outside Asia” in response to UFLPA.
  • Mapping and understanding the supply chain is a critical strategy adopted by U.S. fashion companies to address the forced labor risks in the supply chain. Almost all respondents currently track Tier 1 and 2 suppliers. With the help of new traceability technologies, 53 percent of respondents have started tracking Tier 3 suppliers this year (i.e., those manufacturing yarn, threads, and trimmings), a substantial increase from 25-36 percent in the past.

There is considerable new excitement about increasing apparel sourcing from members of the Dominican Republic-Central America Free Trade Agreement (CAFTA-DR). Respondents also call for more textile raw sourcing flexibility to encourage apparel sourcing from the CAFTA-DR region.

  • CAFTA-DR plays a more significant role as a sourcing base. About 20 percent of respondents place more than 10% of their sourcing orders from the region, doubling from 2021. 
  • Over the next two years, more than 60 percent of respondents plan to increase apparel sourcing from CAFTA-DR members as part of their sourcing diversification strategy.
  • CAFTA-DR is critical in promoting U.S. apparel sourcing from the region. Around 80 percent of respondents took advantage of the agreement’s duty-free benefits when sourcing apparel from the region this year, up from 50—60 percent in the past.
  • Respondents say the exceptions to the “yarn-forward” rules of origin, such as the “short supply” and “cumulation” mechanisms, provide essential flexibility that encourages more apparel sourcing from CAFTA-DR members.
  • Respondents say improving textile raw material supply is critical to encouraging more U.S. apparel sourcing from CAFTA-DR members. Particularly, “allowing more flexibility in souring fabrics from outside CAFTA-DR” and “improving yarn production capacity and variety within CAFTA-DR” are the top two priorities.

U.S. fashion companies strongly support another ten-year renewal of the African Growth and Opportunity Act (AGOA). Meanwhile, Ethiopia’s loss of AGOA eligibility discourages U.S. apparel sourcing from the ENTIRE AGOA region.

  • As much as 75 percent of respondents say another ten-year AGOA renewal will encourage more apparel sourcing from the region and making investment commitments.
  • However, despite the tariff benefits and the liberal rules of origin, respondents express explicit concerns about the region’s lack of competitiveness in speed to market, political instability, and having an integrated regional supply chain.
  • Ethiopia’s loss of AGOA benefits had a notable negative impact on sourcing from the country AND the entire AGOA region. Notably, no respondent plans to move sourcing orders from Ethiopia to other AGOA beneficiaries.

Which Apparel Sourcing Factors Matter?

Abstract

Today, fashion companies consider a long list of factors when deciding where to source their apparel products, ranging from cost, speed to market, flexibility to the risk of social and environmental compliance. While existing studies have identified these major sourcing factors, whether they are treated equally in companies’ apparel sourcing decisions remains mostly unknown. Neither is it clear how fashion companies make a trade-off among these sourcing factors, given no sourcing destination is perfect.

This study aims to quantitatively evaluate the influence of primary sourcing factors on fashion companies’ determination of apparel sourcing destinations. For the study, we collected a detailed evaluation of the world’s 27 largest sourcing destinations in 2019 against 15 specific performance indicators from GlobalData, one of the most popular sourcing analytics tools. The evaluation uses a 5-point rating scale for each performance indicator.

Because some of these 15 performance indicators measure similar items, we first conducted an exploratory factor analysis, which reduced these indicators to five principal sourcing factors based on their correlation matrix scores.  These five principal sourcing factors cover the following themes:

  • Capacity: It covers seven performance indicators that measure a sourcing destination’s capabilities (including flexibility and lead time) of providing apparel products and other value-added services.
  • Price & Tariff: It covers two performance indicators that measure the financial implications of sourcing from a particular destination, including eligibility for preferential import duties.
  • Stability: It covers two performance indicators that measure a sourcing destination’s macro-business environment, specifically sourcing-related political and economic climates.
  • Sustainability: It encompasses all social and environmental compliance issues related to apparel production and sourcing.
  • Quality: It covers two performance indicators that measure whether a sourcing destination obtains skilled workers and the overall quality of its products.

Next, we calculated the 27 apparel exporting countries’ average scores of these five principal sourcing factors. Based on the results, we further conducted a multiple regression analysis to evaluate the impact of the five principal sourcing factors on the value of these 27 countries’ apparel exports to the U.S., EU, and Asia in 2019, respectively. These three regions combined accounted for more than 80% of world apparel imports that year; however, fashion companies in each area are suggested to have unique sourcing preferences.

First, the result suggests that improving the performance in Stability and Quality can help a country enhance its attractiveness as an apparel sourcing base in the U.S. and Asia markets, but not so much in the EU market.

Second, a higher score for the factor Sustainability does not result in more sourcing orders at the country level in all three markets examined. It seems fashion companies’ current sourcing model does not provide substantial financial rewards encouraging better performance in sustainability. It is also likely that sustainability and compliance are treated more as pre-requisite criteria instead of determining the volume of the sourcing orders.

Third, the impact of Price & Tariff and Capacity on the value of apparel imports is not statistically significant in any of the three markets examined. This result does NOT necessarily mean price and production capacity is irrelevant. Instead, the result implies that fashion companies’ sourcing decision today is not merely about “chasing the lowest price.” Meanwhile, due to concerns about supply chain risks, even the most “economically competitive” sourcing destination won’t receive all the sourcing orders.

The findings of the study suggest that fashion companies’ sourcing decisions today appear to be more complicated and subtle than what is revealed by the existing literature and the public perception. Notably, the findings present different views from previous studies regarding how sourcing cost and sustainability affect fashion companies’ selection of sourcing destinations.

The findings also call our attention to the significant impact of non-economic factors on companies’ sourcing decisions, particularly the perceived political risks. This result explained why fashion companies had quickly reacted to the recent forced labor concerns in Xinjiang, China, and the military coup in Myanmar and halted sourcing from the regions.

By Dr. Sheng Lu and Emma Davis

The study was presented at the 2021 International Textile and Apparel Association (ITAA) annual conference.

China’s Membership in CPTPP and the US Textile Industry

As one breaking news, on 16 September 2021, China officially presented its application to join the 11-member Comprehensive and Progressive Agreement for Trans-Pacific Partnership (CPTPP). While the approval of China’s membership in CPTPP remains a long shot and won’t happen anytime soon, the debate on the potential impact of China’s accession to the trade agreement already starts to heat up.

Like many other sectors, textile and apparel companies are on the alert. Notably, China plus current CPTPP members accounted for nearly half of the world’s textile and apparel exports in 2020. Many non-CPTPP countries are also critical stakeholders of China’s membership in the agreement. In particular, the Western Hemisphere textile and apparel supply chain, which involves the US textile industry, could face unrepresented challenges once China joins CPTPP. 

First, once China joins CPTPP, the tariff cut could provide strong financial incentives for Mexico and Canada to use more Chinese textiles. China is already a leading textile supplier for many CPTPP members. In 2019, as much as 47.7% of CPTPP countries’ textile imports (i.e., yarns, fabrics, and accessories) came from China, far more than the United States (12.1%), the other leading textile exporter in the region. 

Notably, thanks to the Western Hemisphere supply chain and the US-Mexico-Canada Trade Agreement (USMCA, previously NAFTA), the United States remains the largest textile supplier for Mexico (48.2%) and Canada (37.2%). Mexico and Canada also serve as the largest export market for US textile producers, accounting for as many as 46.4% of total US yarn and fabric exports in 2020.

However, US textile exporters face growing competition from China, offering more choices of textile products at a more competitive price (e.g., knitted fabrics and man-made fiber woven fabrics). From 2005 to 2019, US textile suppliers lost nearly 20 percentage points of market shares in Mexico and Canada, equivalent to what China gained in these two markets over the same period.

Further, China’s membership in CPTPP means its textile exports to Mexico and Canada could eventually enjoy duty-free market access. The significant tariff cut (e.g., from 9.8% to zero in Mexico) could make Chinese textiles even more price-competitive and less so for US products. This also means the US textile industry could lose its most critical export market in Mexico and Canada even if the Biden administration stays away from the agreement.

Second, if both China and the US become CPTPP members, the situation would be even worse for the US textile industry. In such a case, even the most restrictive rules of origin would NOT prevent Mexico and Canada from using more textiles from China and then export the finished garments to the US duty-free. Considering its heavy reliance on exporting to Mexico and Canada, this will be a devastating scenario for the US textile industry.

Even worse, the US textile exports to CAFTA-DR members, another critical export market, would drop significantly when China and the US became CPTPP members. Under the so-called Western-Hemisphere textile and apparel supply chain, how much textiles (i.e., yarns and fabrics) US exports to CAFTA-DR countries depends on how much garments CAFTA-DR members can export to the US. In comparison, US apparel imports from Asia mostly use Asian-made textiles. For example, as a developing country, Vietnam relies on imported yarns and fabrics for its apparel production. However, over 97% of Vietnam’s textile imports come from Asian countries, led by China (57.1%), South Korea, Taiwan, and Japan (about 25%), as opposed to less than 1% from the United States.

The US textile industry also deeply worries about Vietnam becoming a more competitive apparel exporter with the help of China under CPTPP. Notably, among the CPTPP members, Vietnam is already the second-largest apparel exporter to the United States, next only to China. Despite the high tariff rate, the value of US apparel imports from Vietnam increased by 131% between 2010 and 2020, much higher than 17% of the world average. Vietnam’s US apparel import market shares quickly increased from only 7.6% in 2010 to 16.6% in 2020 (and reached 19.3% in the first half of 2021). The lowered non-tariff and investment barriers provided by CPTPP could encourage more Chinese investments to come to Vietnam and further strengthen Vietnam’s competitiveness in apparel exports.  

Understandably, when apparel exports from China and Vietnam became more price-competitive thanks to their CPTPP memberships, more sourcing orders could be moved away from CAFTA-DR countries, resulting in their declined demand for US textiles. Notably, a substantial portion of US apparel imports from CAFTA-DR countries focuses on relatively simple products like T-shirts, polo shirts, and trousers, which primarily compete on price. Losing both the USMCA and CAFTA-DR export markets, which currently account for nearly 70% of total US yarns and fabrics exports, could directly threaten the survival of the US textile industry.

by Sheng Lu

Related readings:

COVID-19 and US Apparel Imports: Key Trends (Updated: September 2021)

First, the shipping crisis and new wave of COVID cases start to affect US apparel imports negatively. While US consumers’ demand for clothing overall remains strong, for the second month in a row, the value of US apparel imports (seasonally adjusted) in July 2021 decreased by 5.5% from a month ago and down 9.7% from May to June. The absolute value of US apparel imports year to date (YTD) in 2021 (January—July) was 25.3% higher than in 2020 and around 87% of the pre-COVID level (benchmark: January-July, 2019). However, the year-over-year growth in July 2021 was only 15.4%, compared with 60.0% in May 2021 and 29.1% in June 2021. Overall, the results remind us that the market environment is far from stable yet as the COVID situation in the US and other parts of the world continues to evolve.

Second, Asian countries lost market shares as some leading apparel supplying countries, including Vietnam and Bangladesh, struggled with new COVID lockdowns. While Asia as a whole remains the single largest apparel sourcing base for US companies, Asian countries’ market shares fell from 74.2% in 2020 to 71.3% in July 2021, the lowest since 2010.  The new COVID lockdowns in Vietnam and Bangladesh, the No. 2 and No. 3 top suppliers for the US market, post significant challenges to US fashion companies trying to build inventory for the upcoming holiday season. Notably, US companies source many high-volume products from these two countries, and there is a lack of alternative sourcing destinations in the short run.

Third, US companies continue to treat China as an essential sourcing base during the current challenging time. However, there is no clear sign that companies are reversing their long-term strategy of reducing “China exposure.”  China stays the largest supplier for the US market in July 2021, accounting for 41.3% of total US apparel imports in quantity and 26.0% in value. The export product diversification index also suggests that China supplied the most variety of products to the US market. US apparel imports from Bangladesh, Mexico, and CAFTA-DR members are more concentrated on specific product categories. In other words, should China were under lockdowns, the negative impacts on US companies’ inventory management could be even worse.

Nevertheless, the HHI index and market concentration ratios (CR3 and CR5) calculated based on the latest data suggest that US fashion companies continue to move their apparel sourcing orders from China to other Asian countries overall.  For example, only 14.7% of US cotton apparel imports came from China in 2021 (January—July), a new record low in the past ten years. Further, as US apparel imports from China typically peak from June to September because of seasonal factors, China’s market shares are likely to drop in the next few months. Additionally, the fundamental concerns about sourcing from China are NOT gone. On the contrary, new US actions against alleged forced labor in Xinjiang are likely in the coming months and affect imports from China beyond cotton products.

Fourth, US apparel sourcing from the Western Hemisphere, especially CAFTA-DR members, gains new momentum. Specifically, 18.1% of US apparel imports came from the Western Hemisphere YTD in 2021 (January-July), higher than 16.1% in 2020 and 17.1% before the pandemic. Notably, CAFTA-DR members’ market shares increased to 11.2% in 2021 (January to July) from 9.6% in 2020. The value of US apparel imports from CAFTA-DR also enjoyed a 58.4% growth in 2021 (January—July) from a year ago, one of the highest among all sourcing destinations. The imports from El Salvador (up 75.2%), Honduras (up 74.6%), Dominican Republic (45.1%), and Guatemala (40.6%) had grown particularly fast so far in 2021.

Meanwhile, US apparel imports from USMCA members stayed stable (i.e., no significant change in market shares). CAFTA-DR and USMCA members currently account for around 60% and 25% of US apparel imports from the Western Hemisphere. They are also the single largest export market for US textile products (about 70%).

Fifth, US apparel imports start to see a notable price increase. While an across-the-board price increase was not a big concern at the beginning of 2021, the increase has become more noticeable since June 2021. For example, of the top 20 US apparel imports (HS chapters 61-62) at the 6-digit HS code level based on import value, the price of thirteen products increased from May to June 2021. The price increase at the country level is even more significant. From May to July 2021, the average unit price of US apparel imports from leading sources all went up substantially, including China (7%), Vietnam (13%), Bangladesh (13.9%), and India (15.6%).

As almost everything is becoming more expensive, from raw material, shipping to labor, the August and September trade data (to be released in October and November) could suggest an even more significant price increase.

by Sheng Lu

What Does Vietnam’s Lockdown Mean for US Footwear Sourcing?

According to the media, US footwear retailers face a new round of supply chain disruptions as Vietnam, one of the leading supplying countries, is under COVID lockdown. Industry sources say the country-wide lockdown measures in Vietnam could last until mid-September. So, what does Vietnam’s lockdown mean for US footwear sourcing?

First, footwear sourcing is much less diversified than apparel. As manufacturing footwear both requires specialized machines and can be labor-intensive, over 80% of US footwear imports came from three countries only, namely China, Vietnam, and Indonesia. This sourcing pattern is very different from apparel products, for which US companies have far more choices. Other than the top three, US also imports some high-end footwear products from Italy.

Second, while China remains No.1, Vietnam has quickly become the second-largest footwear supplier for the US market. Vietnam’s market shares (by value) reached a new record high of 32.9% in the first six months of 2021, up from 20% in 2017. Especially since the US Section 301 action began to affect footwear imports from China, US retailers have increasingly moved sourcing orders from China to Vietnam to mitigate trade war’s negative impacts [Note: most footwear products are covered by Tranche 4A].

As of June 2021, top US retailers that carry footwear “Made in Vietnam” include Puma, Nike, UGG, Vans, and New Balance.

Nike, “Made in Vietnam”, retail price =$100
Nike, “Made in China”, retail price =$150

Third, US retailers source from Vietnam primarily for volume items targeting the mass market. Industry sources show that from Aug 2020 to Aug 2021, sneakers/trainer shoes “Made in Vietnam” on average were priced 30%+ cheaper than those “Made in China” in the US retail market.

Meanwhile, Vietnam still lags far behind China in terms of the variety of products it makes. For example, industry sources show that from Aug 2020 to Aug 2021, US retailers imported around 110K different types of footwear (at the SKU level) from China, but only 13K from Vietnam.

Overall, Vietnam’s COVID lockdown will primarily affect medium to lower-priced volume products carried by US footwear retailers. However, the lockdown’s impacts on retailers’ sourcing portfolio and product availability in the market could be modest. In other words, US consumers may still find many footwear products to choose from in the store but with a higher price tag. Notably, from June 2020 to July 2021, the US retail price for footwear went up by over 7.4% already.

Related reading: Delta Variant Outbreaks in Sparsely Vaccinated Asian Countries Disrupt Production (WSJ)

How Has COVID-19 Affected Apparel Exports from China, Vietnam, and Bangladesh?

Key findings:

compiled by Victoria Langro and Sheng Lu (2021)

During the pandemic, three factors are most relevant to a country’s apparel export performance: government lockdown measures, textile raw material access, and comprehensive export competitiveness. Against these three factors, apparel producers and exporters in China, Vietnam, and Bangladesh face common but differentiated business challenges and opportunities during the pandemic (see the table above).

China, Vietnam, and Bangladesh all suffered an unprecedented (nearly 30% year over year) drop in their apparel exports to the world in 2020 (Q1-Q3) due to COVID-19. This result mirrored the reduced import demand in the world’s major apparel consumer markets, where the local economies were also hit hard by the pandemic, including the US (down 2.3%), the EU (down 4.3%), and Japan (down 4.8%).

However, the three countries’ export performance is most different in the US market—China’s apparel exports dropped by 31.6%, much steeper than Vietnam (down 6.9%) and Bangladesh (down 12.6%). It seems that even though COVID-19 may favor China as an apparel sourcing base from an economic perspective, US fashion companies have given more weight to non-economic factors, such as the outlook of the trade war, in their sourcing decisions involving China.

COVID-19 had disrupted apparel exporters’ regular production and export schedule in 2020. The lockdown measures in these three countries seem to affect their export seasonal pattern most significantly. For example, as the first country hit by COVID-19, China’s apparel exports were at the bottom from February to April 2020; however, China’s apparel exports recovered quickly since May 2020 when factories resumed production. In comparison, apparel exports from Vietnam and Bangladesh were at their lowest level from April to May and May to June 2020, respectively, when their factories had to close.

Additionally, Bangladesh’s apparel export seasonality had experienced a more dramatic change in 2020 than in China and Vietnam. A possible reason behind the phenomenon is the export product structure. Notably, China and Vietnam export a more diverse range of products, whereas apparel exports from Bangladesh concentrate on basic fashion items.

Industry sources also indicate that between February 2020 and February 2021, US apparel imports from China and Vietnam see a significant structural change—they include more COVID-popular items such as sweaters, smock dresses, and sweatpants, and fewer dresses, shirts, and suits. However, over the same period, the product structure of US apparel imports from Bangladesh barely changed, and they also included few COVID-popular categories mentioned above. In other words, despite order cancellations, garment factories in China and Vietnam seem more likely to receive new sourcing orders than their counterparts in Bangladesh because of advantages in production flexibility and agility.

Further, China, Vietnam, and Bangladesh all turned less diversified in their apparel export market during the pandemic. Notably, the US, EU, and Japan have become more critical export markets ever. Compared with fashion companies’ efforts in sourcing diversification, it could be more challenging for garment-producing countries to diversify their export market during the pandemic.

Further reading: Victoria Langro and Sheng Lu (2021). Sourcing’s new order – Covid’s impact on world’s top three apparel exporters. Just-Style.

[for FASH455 in spring 2022: If you comment on this blog post, please respond to this question: as we are 2 years into the pandemic, why or why not do you think the study’s findings are still valid?]

COVID-19 and U.S. Apparel Imports: Key Trends (Updated: November 2020)

First, U.S. apparel imports continue to rebound thanks to consumers’ robust demand. The value of U.S. apparel imports in September 2020 went up by 8.8% from August 2020 (seasonally adjusted), a new record high since March 2020 when COVID-19 broke out in the States. As of September 2020, the volume of U.S. apparel imports has recovered to around 84-85% of the pre-coronavirus level.  This result echoes the trend of U.S. apparel retail sales (NAICS 4481), which also indicates a “V-shape” rebound since May 2020. As fashion brands and retailers typically build their inventory for holiday sales (such as back to school, Thanksgiving, and Christmas) from July to October, the upward trend of U.S. apparel imports hopefully will last for another 1-2 months.

Data also shows that compared with the 2008 world financial crisis, Covid-19 has caused a more significant drop in the value of U.S. apparel imports. However, it seems the post-Covid recovery process has been more robust than the 2008 financial crisis. Notably, the Auto Regressive Integrated Moving Average (ARIMA) model forecasts that at the current speed of recovery, the value of U.S. apparel imports (seasonally adjusted) could start to enjoy a positive year over year (YoY) growth by February 2021 (or around 11 months after the outbreak of Covid-19 in March 2020). In comparison, when recovering from the 2008 world financial crisis, it took almost 15 months to turn the YoY growth rate from negative to positive.

Second, still, no evidence suggests that U.S. fashion companies are giving up China as one of their essential apparel-sourcing bases. Notably, since May 2020, China had quickly regained its position as the top apparel supplier to the U.S. market. From June to September 2020, China’s market shares have stably stayed at around 27-28% in value and 40-42% in quantity.

According to the media, some sourcing orders are returning to China as China’s competitors in Asia are struggling with more limited production capacity, shortage of raw material and supply chain disruption caused by Covid-19.

CR5 (exclude China) includes Vietnam, Bangladesh, Indonesia, India and Cambodia

That being said, trade data suggests that U.S. fashion companies continue to reduce their “China exposure” overall. For example, both the HHI index and the market concentration ratios (CR3–total market shares of top 3 suppliers and CR5–total market shares of top 5 suppliers) indicate that apparel sourcing orders are gradually moving from China to other Asian countries–it is interesting to see HHI, CR3 and CR5 all suggest a more diversified apparel sourcing base in 2020 (Jan-Sep) than in 2018 and 2019; however, the value of CR5 (exclude China) reached a new record high in 2020 (Jan-Sep).

Third, related to the point above, despite Covid-19, Asia as a whole remains the single largest source of apparel for the U.S. market. Other than China, Vietnam (20.0% YTD in 2020 vs. 16.2% in 2019), ASEAN (33.1% YTD in 2020 and vs. 27.4% in 2019), Bangladesh (8.4% YTD in 2020 vs.7.1% in 2019), and Cambodia (4.4% YTD in 2020 vs. 3.2% in 2019) all gain additional market shares in 2020 from a year ago.

Fourth, still, no clear evidence suggests that U.S. fashion brands and retailers have been giving more apparel sourcing orders to suppliers from the Western Hemisphere because of COVID-19 and the trade war. In the first nine months of 2020, only 9.1% of U.S. apparel imports came from CAFTA-DR members (down from 10.3% in 2019) and 4.4% from USMCA members (down from 4.5% in 2019). Confirming the trend, in the first nine months of 2020, the value of U.S. yarns and fabrics exports to USMCA and CAFTA-DR members also suffered a 26% decline from a year ago. The heavy reliance on textile supply from the U.S. (implying more vulnerability to the Covid-19 supply chain disruptions) and the price disadvantage could be among the major contributing factors.

Just an anecdote–according to some industry insiders, the booming of E-commerce during the pandemic may also possibly explain why “near sourcing” is not reflected in trade data despite its reported growing popularity. Specifically, US fashion retailers would:1) import products from Asia and stock them in the bonded warehouses in Mexico (note: bonded warehouse means dutiable goods may be stored, manipulated, or undergo manufacturing operations without payment of duty). 2) When US consumers place orders, the retailer will ship products directly from these bonded warehouses in Mexico to the final destination. Most importantly, retailers could take advantage of the US de minimis rule (i.e., goods valued at $800 or less could enter the U.S. duty-free one person one day) and avoid paying tariffs– even though these products are counted as imports from Asian countries that do not have a free trade agreement with the United States. In other words, these products are not officially treated as imports from Mexico even though they are shipped from bonded warehouse in Mexico.

by Sheng Lu

COVID-19 and U.S. Apparel Imports (Updated: July 2020)

The latest statistics from the Office of Textiles and Apparel (OTEXA) show that COVID-19 continued to enlarge its negative impact on U.S. apparel imports in May 2020, and the path to recovery will NOT be straightforward and quick. Specifically:

The value of U.S. apparel imports decreased by more than 60% in May 2020 from a year ago, setting a new record of single-month loss in trade volumes. Between January and May 2020, the value of U.S. apparel imports decreased by 27.8% year over year, which has been much worse than the performance during the 2008-2009 global financial crisis (down 11.8%).

As the first country hit by Covid-19, China’s apparel exports to the U.S. dropped by 60.2% in May 2020 from a year ago, close to its performance in April 2020 (down 59% YoY). While the figure itself is far from exciting, it suggests the sinking of China’s apparel exports could have hit bottom. As an important sign, China regained its position as the largest apparel supplier to the U.S. in May 2020, with 27.2% market shares in value and 41.4% market shares in quantity. Notably, this is a significant rebound from only 11% market shares back in February 2020. Overall, it seems U.S. fashion brands and retailers continue to treat China as an essential and probably indispensable apparel sourcing base, despite a new low of U.S.-China relations and companies’ sourcing diversification strategy. Meanwhile, the official Chinese statistics report a 20.3% drop in China’s apparel exports in the first five months of 2020.

Despite Covid-19, Asia as a whole remains the single largest source of apparel for the U.S. market. Other than China, Vietnam (20.1% YTD in 2020 vs. 16.2% in 2019), ASEAN (34.6% YTD in 2020 and vs. 27.4% in 2019) and Bangladesh (9.4% YTD in 2020 vs.7.1% in 2019) all gain additional market shares in 2020 from a year ago.

However, no clear evidence has suggested that U.S. fashion brands and retailers are giving more apparel sourcing orders to suppliers from the Western Hemisphere. In the first five months of 2020, still, only 9.1% of U.S. apparel imports came from CAFTA-DR members (down from 10.3% in 2019) and 4.0% from NAFTA members (down from 4.5% in 2019). Two factors might explain the pattern: 1) Due to factory lock-down, the production capacity in the Western Hemisphere is affected negatively; 2) With an unrepresented high level of unemployment, U.S. consumers are becoming ever more price sensitive.  However, apparel produced in the Western Hemisphere, in general, are less price competitive than those made in Asia.

As a reflection of weak demand, the unit price of U.S. apparel imports was lower in the first five months of 2020 (price index =101.5) compared with 2019 (price index =104.7).  Imports from China have seen the most notable price decrease so far (price index =71.0 YTD in 2020 vs. 83.5 in 2019).

by Sheng Lu

EU-Vietnam Free Trade Agreement and Outlook of Vietnam’s Apparel Export

Vietnam’s National Assembly officially approved the EU-Vietnam Free Trade Agreement (EVFTA) on 8 June 2020, which is expected to take into effect as early as in August 2020.

EVFTA will eliminate nearly all tariffs (over 99%) between the EU and Vietnam. However, textile and apparel (T&A) are among a few exceptions that will not be able to enjoy duty-free treatment on day one. Specifically:

Created by Dr. Sheng Lu based on the EVFTA text
  • The EU will eliminate duties with more extended staging periods (up to 7 years) for some sensitive products in the textile apparel and footwear sectors (see the graphs above).
  • By adopting the fabric-forward rules of origin (or the so-called “double transformation”) for apparel items, EVFTA intends to prevent products from a third party (such as China) from flooding the EU market. Specifically, to benefit from preferential access, garments will need to use fabrics produced in Vietnam or the EU. However, through the EVFTA cumulation provision, fabrics originating in South Korea or other ASEAN countries with which the EU has a free trade agreement in force will be considered as originating in Vietnam. (Note: South Korea is a free trade agreement partner of the EU).  While China remains the top textile supplier for Vietnam, the EVFTA apparel-specific rules of origin will provide more incentives for Vietnam to reduce its China dependence and restructure its textile and apparel supply chain. On the other hand, the totality of EU textile fabric exports to Vietnam will be liberalized immediately when the agreement enters into force.
  • Statistics show that Vietnam was EU’s sixth-largest extra-region apparel supplier in 2019 (after China, Bangladesh, Turkey, India, and Cambodia), accounting for 4.3% in value (or US$4.3 billion). Many of Vietnam’s primary competitors already enjoyed duty-free market access to the EU, such as Turkey (through the Customs Union), Bangladesh, and Cambodia (through the EU Everything But Arms program). EVFTA will provide a level playing field for Vietnam, which is expected to see a continuous robust growth of its apparel exports to the EU and gain additional market shares in the years to come. Meanwhile, not eligible for any EU preferential duty benefit, apparel exports from China are likely to face intensified competition in the EU market after the implementation of EVFTA.

COVID-19 and U.S. Apparel Imports (Updated: June 2020)

The latest statistics from the Office of Textiles and Apparel (OTEXA) show that the negative impact of COVID-19 on U.S. apparel imports deepened further in April 2020. Specifically:

  1. Unusually but not surprisingly, the value of U.S. apparel imports sharply decreased by 44.5% in April 2020 from a year ago. Between January and April 2020, the value of U.S. apparel imports decreased by 19.6% year over year, which has been much worse than the performance during the 2008-2009 global financial crisis (down 11.8%).

2. As the first country took a hit by COVID-19, China’s apparel exports to the United States continue to deteriorate—its value decreased by a new record of 59.0% in April 2020 compared with a year ago (and -46.4% drop year to date). This result is also worse than the official Chinese statistics, which reported an overall 22% drop in China’s apparel exports in the first four months of 2020).

3. For the second month in a row, Vietnam surpassed China and ranked the top apparel supplier to the U.S. market in April 2020. China’s market shares in the U.S. apparel import market remained as low as 18.2% in April 2020 (was 30% in 2019), although it slightly recovered from only 11% in March 2020. With U.S.-China relations at a new low, there have been more intensified discussions on how to move the entire textile and apparel supply chain out of China and diversify apparel sourcing from the Asia region as a whole. However, as China itself has grown into one of the world’s largest apparel consumption markets, there is little doubt that China will remain a critical player for apparel sourcing, especially for the “China for China” business model.

4. Continuing the trend emerged in recent years, China’s lost market shares have been picked up mostly by other Asian suppliers, particularly Vietnam (19.7% YTD in 2020 vs. 16.2% in 2019) and Bangladesh (9.8% YTD in 2020 vs.7.1% in 2019). However, no clear evidence has suggested that U.S. fashion brands and retailers are giving more apparel sourcing orders to suppliers from the Western Hemisphere. In the first four months of 2020, still only 9.4% of U.S. apparel imports came from CAFTA-DR members (down from 10.3% in 2019) and 4.1% from NAFTA members (down from 4.5% in 2019).

5. As a reflection of weak demand, the unit price of U.S. apparel imports was lower in the first four months of 2020 (price index =102.1) compared with 2019 (price index =104.7).  Imports from China have seen the most notable price decrease so far (price index =71.5 YTD in 2020 vs. 83.5 in 2019).

by Dr. Sheng Lu

COVID-19 and U.S. Apparel Imports (Updated: May 2020)

3

2

The latest statistics from the Office of Textiles and Apparel (OTEXA) show that the negative impact of COVID-19 on U.S. apparel imports deepened in March 2020. Specifically:

  • The value of U.S. apparel imports sharply decreased by 14.8% in March 2020 from a year ago. Between January and March 2020, the value of U.S. apparel imports decreased by 12.1% year over year, which has been worse than the performance during the 2008-2009 global financial crisis (down 11.8%).
  • As the first country took a hit by COVID-19, China’s apparel exports to the United States continue to deteriorate—its value decreased by as much as 52.4% in March 2020 compared with a year ago (and -43.1% drop year to date in 2020). This result is also worse than the official Chinese statistics, which reported an overall 20.6% drop in China’s apparel exports in the first quarter of 2020.

Marh1

  • For the first time in history, Vietnam surpassed China and became the top apparel supplier to the U.S. market in March 2020. Notably, China’s market shares in the U.S. apparel import market dropped to only 11% in March 2020 (and 18.3% year to date in 2020), a new record low in history (was 30% in 2019). However, it should be noted that long before COVID-19, U.S. fashion brands and retailers have begun to reduce their exposure to sourcing from China, especially since October 2019 due to concerns about the US-China tariff war.

7

  • China’s lost market shares have been picked up mostly by other Asian suppliers, particularly Vietnam (18.9% YTD in 2020 vs. 16.2% in 2019) and Bangladesh (9.4% YTD in 2020 vs.7.1% in 2019). However, no clear evidence has suggested that U.S. fashion brands and retailers are giving more apparel sourcing orders to suppliers from the Western Hemisphere. In the first three months of 2020, still, only 10.3% of U.S. apparel imports came from CAFTA-DR members (no change from 2019) and 4.4% from NAFTA members (down from 4.5% in 2019).

8

  • The unit price of U.S. apparel imports remains relatively stable. The price index (2010=100) in the first three months of 2020 was 103 compared with 104.7 in 2019. However, as a reflection of weak demand, the price index of U.S. apparel imports from China substantially dropped to 72.2 Year to Date in 2020 compared with 83.5 in 2019.

The discussion is closed for this post.

The Changing Face of Textile and Apparel “Made in Asia”

Video 1: How one Chinese shirt-maker uses automation to safeguard its future

Video 2: Chinese investors move clothing factory to Bangladesh

Video 3: Can Vietnam become the next China?

Discussion questions (for FASH455: Please finish watching ALL the three short videos above before sharing your viewpoints)

  1. How are textile and apparel “Made in Asia” changing its face? What are the driving forces of these changes?
  2. What are the examples of the “flying geese model” from the videos? Overall, why or why not do you think this model is still valid today?
  3. Why or why not do you think the U.S.-China tariff war has fundamentally changed the patterns of textile and apparel production and trade in Asia?

U.S. Apparel Retailers’ Shifting Sourcing Strategy for “Made in China” under the Shadow of the Tariff War

The full article is available HERE

Key findings:

First, U.S. fashion brands and retailers are sourcing less from China, particularly in quantity. Notably, the number of “Made in China” apparel newly launched to the market had significantly dropped from 26,758 SKUs in the first quarter of 2018 to only 8,352 SKUs in the first quarter of 2019 . Nevertheless, consistent with the macro-level trade statistics, China remains the single largest apparel supplier to the U.S. retail market.

Second, apparel “Made in China” are becoming more expensive in the U.S. retail market, yet remain price-competitive overall. Notably, apparel “Made in Vietnam” is becoming more expensive in the U.S. retail market too—an indication that as more production is moving from China to Vietnam, apparel producers and exporters in Vietnam are facing growing cost pressures.

Third, U.S. fashion retailers are shifting what apparel products they source from China. U.S. apparel retailers have been sourcing less lower value-added basic fashion items (such as tops, and underwear), but more sophisticated and higher value-added apparel categories (such as dresses and outerwear) from China since 2018. The shifting product structure could also be a factor that contributed to the rising average retail price of “Made in China” in the U.S. market.

On the other hand, U.S. retailers adopt a very different product assortment strategy for apparel sourced from China versus other regions of the world. There seems to be much fewer alternative sourcing destinations for more sophisticated product categories, such as accessories and outerwear. Somehow ironically, moving to source more sophisticated and higher value-added products from China could make U.S. fashion brands and retailers even MORE vulnerable to the tariff war because of fewer alternative sourcing destinations.

In conclusion, the results imply that China will remain a critical sourcing destination for U.S. fashion brands and retailers in the near future, regardless of the scenario of the U.S.-China tariff war. Meanwhile, we should expect U.S. fashion companies continue to adjust their sourcing strategy for apparel “Made in China” in response to the escalation of the tariff war.

Related reading: Trade war to hit high-end US fashion brands dependent on specialized Chinese manufacturing

Competition in the U.S. Apparel Import Market (Updated March 2018)

market shares in the US (2017)_Page_2market shares in the US (2017)_Page_3CAFTA-DRNAFTA

Outlook of Sourcing from Vietnam (Updated: August 2017)

State of Vietnam’s Textile and Clothing Industry

v1

Vietnam has a substantial textile and clothing industry comprising around 4,000 enterprises, of which the majority were located in the country’s two principal population centers—Ho Chi Minh City and Hanoi. Around 70% of these enterprises were involved in the manufacture of clothing. A further 17% were involved in the fabric sector, 6% in the yarn sector, 4% in the dyeing sector and 3% in the accessories sector.

It is estimated that around 70% of Vietnam’s textile and clothing production is dependent on the cut and trims operations, using imported textiles and other inputs predominantly from China. This problem is not limited to a single category as the country needs to import man-made fibers, yarns, fabrics, and accessories as well as raw cotton.

The dyeing and finishing segments of the supply chain remain fairly underdeveloped. In the past, the Vietnamese government has issued tightly controlled permits for these operations. Also, there has been a deficiency of investment in these segments because of unclear regulations, and this has resulted in a bottleneck in the supply chain.

Similarly, high added-value design and “downstream” activities rely on the input of foreign companies are also underdeveloped. Consequently, in carrying out these activities, the industry relies heavily on the help or participation of foreign companies.

State of Vietnam’s Textile and Apparel Export

v2

Vietnamese textile and clothing exports began to gain momentum in 2001 when trading relationships were established with Western countries (e.g., the US-Vietnam Textile Agreement). The industry’s exports received a further boost after Vietnam joined the World Trade Organization (WTO) at the start of 2007, and the quotas which had been restricting imports of Vietnamese goods in the US market were eliminated.

In 2016, Vietnam’s textile and clothing exports totaled $28 billion (84% were clothing), which represented 16.0% of Vietnam’s total merchandise exports. Globally, Vietnam was the world’s third largest apparel exporter in 2015, after China and Bangladesh (WTO, 2016).

The Vietnam Textile & Apparel Association (VITAS) expects Vietnam’s textile and clothing exports to enjoy an average 15% annual growth in the next four years and exceed $50 billion USD by 2020.

v3

Vietnam’s textile and clothing exports went to around 180 countries. The United States is Vietnam’s top export market (around 40%), followed by the EU (around 12.5%), Japan (10.3%) and South Korea (8.1%).

Outlook of Sourcing from Vietnam by US Fashion Companies

v4

According to the 2017 US Fashion Industry Benchmarking Study, Vietnam is the 2nd most used sourcing destination by respondents. Particularly, the most commonly adopted sourcing model is shifting from “China Plus Many” to “China Plus Vietnam Plus Many”:

  • China typically accounts for 30-50 percent of respondents’ total sourcing value or volume. 
  • Vietnam typically accounts for 11-30 percent of companies’ total sourcing value or volume. 
  • For the “many” part, each additional country (such as US, NAFTA members and CAFTA members, EU countries and members of AGOA) typically accounts for less than 10 percent of respondents’ total sourcing value or volume.

v5

Respondents also see Vietnam overall a balanced sourcing destination, regarding “speed to market”, “sourcing cost” and “compliance risk”.

v6

Additionally, U.S. fashion companies intend to source more from Vietnam through 2019, but imports may grow at a relatively slow pace, possibly due to the United States’ withdrawal from the Trans-Pacific Partnership (TPP) and the increasing labor costs in the country.

References:Textile Outlook International (2017); WTO (2017); UN Comtrade (2017)

2017 U.S. Fashion Industry Benchmarking Study Released

The 2018 U.S. Fashion Industry Benchmarking Study is now availablecover

The report can be downloaded from HERE

Key findings of the study:

While the majority of respondents remain confident about the five-year outlook for the U.S. fashion industry, the percentage of those who are “optimistic” or “somewhat optimistic” dropped to a record low since we began conducting this study in 2014. This change could be due to concerns about the “protectionist trade policy agenda in the United States” and “market competition in the United States from e-commerce,” the top two concerns this year.

  • The percentage of those who are “optimistic” or “somewhat optimistic” fell from 92.3 percent in 2016 to 71.0 percent in 2017, a record low since we began conducting this study in 2014. As many as 12.9 percent of respondents are “somewhat pessimistic” about the next five years, mostly large-scale retailers with more than 3,000 employees.
  • Despite the challenges, demand for human talent in the industry overall remains robust. This year, around 80 percent of respondents plan to hire more employees in the next five years, especially supply chain specialists, data scientists, sourcing specialists, and marketing analysts.
  • Cost is no longer one of the top concerns; respondents are less stressed about “increasing production or sourcing cost,” which slipped from #2 challenge in 2016 to #7 challenge in 2017. Only 34 percent rate the issue among their top five challenges this year, significantly lower than 50 percent in 2016 and 76 percent in 2015. Labor cost remains the top factor driving up sourcing cost in 2017.

Although U.S. fashion companies continue to seek alternatives to “Made in China,” China’s position as the top sourcing destination remains unshakable. Meanwhile, sourcing from Vietnam and Bangladesh may continue to grow over the next two years, but at a relatively slow pace.

  • 91 percent of respondents source from China; while 100 percent sourced from China in our past three studies, China is still the top-ranked sourcing destination this year, and the percentage of those expecting to decrease sourcing from the country fell from 60 percent in 2016 to 46 percent this year—and many more expect to maintain their current sourcing value or volume from the country in the next two years.
  • Likely reflecting the United States’ withdrawal from the Trans-Pacific Partnership (TPP) and the expectation of increasing labor costs, only 36 percent of respondents expect to increase sourcing from Vietnam in the next two years, much lower than 53 percent who said the same in 2016.
  • Respondents are cautious about expanding sourcing from Bangladesh in the next two years, with only 32 percent expecting to somewhat increase sourcing While “Made in Bangladesh” enjoys a prominent price advantage over many other Asian suppliers, respondents view Bangladesh as the having the highest risk for compliance.

U.S. fashion companies continue to maintain truly global supply chains.

  • Respondents source from 51 countries or regions in 2017, close to the 56 in last year’s study.
  • 57.6 percent source from 10+ different countries or regions in 2017, up from 51.8 percent in last year’s survey. In general, larger companies have a more diversified sourcing base than smaller companies. Additionally, retailers maintain a more diversified sourcing base than brands, importers/wholesalers, and manufacturers.
  • Around 54 percent expect their sourcing base will become more diversified in the next two years, up from 44 percent in 2016; among these respondents, over 60 percent currently source from more than 10 different countries or regions.
  • The most common sourcing model is shifting from “China Plus Many” to “China Plus Vietnam Plus Many.” The typical sourcing portfolio today is 30-50 percent from China, 11-30 percent from Vietnam, and the rest from other countries.
  • While Asia as a whole remains the dominant sourcing region for U.S. fashion companies, the Western Hemisphere is growing in popularity. This year, we see a noticeable increase in sourcing from the United States (70 percent, up from 52 percent in 2016) and countries in North, South, and Central Americas, which offer a shorter lead time and relatively lower risk of compliance.

Today, ethical sourcing and sustainability are given more weight in U.S. fashion companies’ sourcing decisions. Respondents also see unmet compliance (factory, social and/or environmental) standards as the top supply chain risk.

  • 5 percent of respondents say ethical sourcing and sustainability have become more important in their company’s sourcing decisions in 2017 compared to five years ago.
  • 100 percent of respondents currently audit their suppliers, including how suppliers treat their workers, suppliers’ fire safety, and suppliers’ building safety. The majority (93 percent) use third-party certification programs to audit, with a mix of announced and unannounced audits.
  • As many as 90 percent of respondents map their supply chains, i.e., keep records of name, location, and function of suppliers. More than half track not only Tier 1 suppliers, suppliers they contract with directly, but also Tier 2 suppliers, i.e. supplier’s suppliers. It is less common for U.S. fashion companies to map Tier 3 and Tier 4 suppliers though, which could be because of the difficulty of getting access to related information with such a globalized and highly fragmented supply chain.

Free trade agreements (FTAs) and trade preference programs remain underutilized, and several FTAs, including CAFTA-DR, are utilized even less this year than in previous years.

  •  Of the 19 FTAs/preference programs we examined this year, only NAFTA is used by more than 50 percent of respondents for import purposes.
  • Even more concerning, some U.S. fashion companies source from countries/regions with FTAs/preference programs but, for whatever reason, do not claim the benefits. For example, as many as 38 percent and 6 percent of respondents, respectively, do not use CAFTA-DR and NAFTA when they source from these two regions.

Respondents unanimously oppose the U.S. border adjustment tax (BAT) proposal and call for the further removal of trade barriers, including restrictive rules of origin and high tariffs.

  • 100 percent of respondents oppose a border adjustment tax; 84 percent “strongly oppose” it.
  • Respondents support initiatives to eliminate trade barriers of all kinds, from high tariffs to overcomplicated documentation requirements, to the restrictive yarn-forward rules of origin in NAFTA and future free trade agreements.
  • Respondents say the “complex standards on labeling and testing”, “complex rules for the valuation of goods at customs” and “administrative and bureaucratic delays at the border” are the top non-tariff barriers they face when sourcing today.

The benchmarking studies from 2014 to 2016 can be downloaded from https://www.usfashionindustry.com/resources/industry-benchmarking-study 

Are Textile and Apparel “Made in China” Losing Competitiveness in the U.S. Market?

The updated version is available HERE

The following analysis is from the latest Just-Style Op-ed Is China Losing Its Edge as a US Apparel Supplier.

A fact-checking review of trade statistics in 2016 of a total 167 categories of T&A products categorized by the Office of Textiles and Apparel (OTEXA) suggests that textile and apparel (T&A) “Made in China” have no near competitors in the U.S. import market. Specifically, in 2016:

2

  • Of the total 11 categories of yarn, China was the top supplier for 2 categories (or 18%);
  • Of the total 34 categories of fabric, China was the top supplier for 25 categories (or 74%);
  • Of the total 106 categories of apparel, China was the top supplier for 88 categories (or 83%);
  • Of the total 16 categories of made-up textiles, China was the top supplier for 12 categories (or 68%);

In comparison, for those Asian T&A suppliers regarded as China’s top competitors:

  • Vietnam was the top supplier for only 5 categories of apparel (less than 5% of the total);
  • Bangladesh was the top supplier for only 2 categories of apparel (less than 2% of the total)
  • India was the top supplier for 2 categories of fabric (9% of the total), one category of apparel (1% of the total) and 5 categories of made-up textiles (41.7% of the total)

part II

Notably, China not only was the top supplier for many T&A products but also held a lion’s market shares. For example, in 2016:

  • For the 34 categories of fabric that China was the top supplier, China’s average market shares reached 41%, 23 percentage points higher than the 2nd top suppliers for these categories
  • For the 88 categories of apparel that China was the top supplier, China’s average market shares reached 53%, 38 percentage points higher than the 2nd top suppliers for these categories.
  • For the 16 categories of made-up textiles that China was the top supplier, China’s average market shares reached 57%, 40 percentage points higher than the 2nd top suppliers for these categories.

It is also interesting to see that despite the reported rising labor cost, T&A “Made in China” are NOT becoming more expensive. On the contrary, the unit price of U.S. T&A imports from China in 2016 was 6.8% lower than a year earlier, whereas over the same period the unit price for U.S. T&A imports from rest of the world only declined by 2.9%.

3

Furthermore, T&A “Made in China” are demonstrating even bigger price competitiveness compared with other suppliers to the U.S. market. For example, in 2016, the unit price of “Made China” was only 78% of the price of “Made in Vietnam” (in 2012 was 89%), 88% of “Made in Bangladesh” (in 2012 was 100%), 86% of “Made in Mexico” (in 2012 was 103%) and 72% of “Made in India” (in 2012 was 81%).

Are the results surprising? How to explain China’s demonstrated price competitiveness despite its reported rising labor cost? What’s your outlook for the future of China as a sourcing destination for U.S. fashion brands and retailers? Please feel free to share your views.

Vietnam’s Apparel Exports Slow in First Half of 2016

Growth rate of Vietnam

According to Thanh Nien News, Vietnam’s textile and apparel (T&A) exports only increased 5.1 percent to $10.7 billion in the first half of 2016. This was the lowest growth rate since 2010. Data from the General Statistics Office of Vietnam shows that Vietnam’s T&A exports totaled $22.63 million in 2015, up 8.2 percent from a year earlier.

In the U.S. market, apparel imports from Vietnam also see a much slower growth in the first five months of 2016: 4.1% by value (compared with 13.1% on average between 2010 and 2015) and 5.0% by quantity (compared with 11.8% on average between 2010 and 2015).

Vietnam

The new trade data echos the findings in the latest 2016 US Fashion Industry Benchmarking Study. Although Vietnam remains one of the top sourcing destinations, respondents seem to be more conservative about Vietnam’s growth potential in the next two years. Only 4 percent of respondents expect a strong increase of sourcing value or volume from the country, which is a substantial drop from 21.4 percent in the 2015 study.

China’s Position as the No.1 Textile and Apparel Sourcing Destination Remains Unshakable

china

China as the top textile and apparel sourcing destination for U.S. companies remains “unshakable”, according to product level data from the Office of Textiles and Apparel (OTEXA) under the U.S. Department of Commerce.  Specifically, based on the import value in 2015:

  • Of the total 11 categories of yarns, China was the top supplier for 3 categories (27.3%)
  • Of the total 34 categories of fabrics, China was the top supplier for 23 categories (67.6%)
  • Of the total 106 categories of apparel, China was the top supplier for 95 categories (89.6%)
  • Of the total 16 categories of made-up textiles, China was the top supplier for 12 categories (75.0%)

In comparison, Vietnam, the second largest textile and apparel supplier to the United States, was the top supplier for only four categories of apparel (3.8% of the total 106 categories).

china market share

For many textile and apparel products, China not only is the largest supplier, but also holds a lion’s market share. Specifically, for those textile and apparel product categories that China was the top supplier in 2015 (by value):

  • China’s average market share reached 20.7% for yarns, 2.3 percentage points higher than the 2nd top supplier
  • China’s average market share reached 42.0% for fabrics, 25 percentage points higher than the 2nd top supplier
  • China’s average market share reached 52.7% for apparel, 37.2 percentage points higher than the 2nd top supplier
  • China’s average market share reached 56.8% for made-up textiles, 42.7 percentage points higher than the 2nd top supplier

by Sheng Lu

FASH455 Exclusive Interview with Herb Cochran, Executive Director of Amcham Vietnam

1509c7e

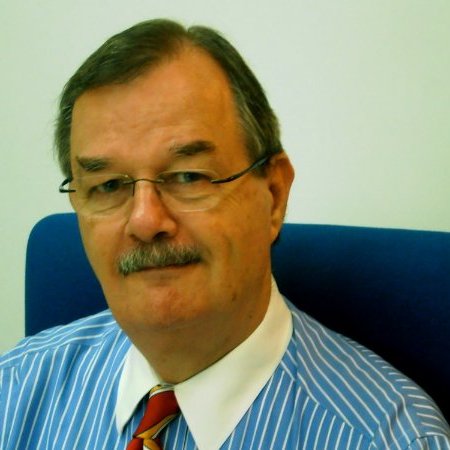
 (photo courtesy: Amcham Vietnam)

Herb Cochran is the Executive Director at the American Chambers of Commerce (AmCham) Vietnam. He has helped transform AmCham Vietnam into an influential organization that promotes trade and investment between Vietnam and the United States, with a focus on developing networking, information-sharing, and advocacy activities to improve the business environment.

Herb mobilized AmCham Vietnam members’ substantial efforts to conclude negotiations on the Vietnam-U.S. Bilateral Trade Agreement and Vietnam’s WTO Accession, and to have these two agreements approved by the U.S. Congress. As a result, trade between Vietnam and the U.S. increased from $1.2 billion in 2000 to about $36 billion in 2014. And Herb expects that total Vietnam-U.S. trade will reach $ 72 billion in 2020.

With Herb’s leadership and support, AmCham Vietnam’s committees and industry sector experts have helped improve mutual understanding on key issues in U.S.-Vietnam trade and investment, including implementation of trade agreements, preserving Vietnam-U.S. apparel trade, strengthening governance and anti-corruption efforts, improved industrial relations, Project 30 (simplification of Vietnam’s administrative procedures), work force development for modern manufacturing, promoting trade and investment between the U.S. and Vietnam’s Southern Key Economic Region, and the Asia Development Bank’s strategy for the economic and social development of Vietnam and the Greater Mekong Subregion.

Prior to joining AmCham, Herb was Commercial Attaché at the U.S. Embassy in Hanoi and Principal Commercial Officer at the U.S. Consulate General in Ho Chi Minh City. He helped establish the commercial office of the U.S. Embassy in Hanoi, hiring staff and establishing trade and finance programs, including the U.S. Export-Import Bank, Overseas Private Investment Corporation (OPIC), and U.S. Trade and Development Agency (USTDA). In 1998-99 he established the commercial office of the U.S. Consulate General in Ho Chi Minh City.

Herb also served as Regional Director, East Asia and Pacific, U.S. Commercial Service, based in Washington DC. His responsibilities included program, personnel, and budget support for the commercial departments of 15 United States Embassies in the Asia/Pacific region, from Tokyo, Seoul, and Beijing in Northeast Asia, to all the countries of Southeast Asia, and down to Australia and New Zealand. Other international working experiences of Herb include: Commercial Counselor at the U.S. Embassy in Bangkok, Thailand, Commercial Attaché at the U.S. Embassy in Tokyo, Japan, U.S. Consulate General in Osaka, Japan, and Action Officer at the State Department’s Office of Japanese Affairs.

Born in North Carolina, Herb earned a B.A. from the University of North Carolina at Chapel Hill (History), and a Certificat from the Institut d’Études Politiques (Sciences Po) in Paris. He is also a graduate of the Industrial College of the Armed Forces in Washington DC (National Defense Strategy).

Interview Part

Sheng Lu: Can you provide us an overview about the US-Vietnam business ties?

Herb Cochran: Vietnam has succeeded at attracting foreign direct investment (FDI) and increasing trade. U.S. – Vietnam trade in 2015 will likely reach over $45 billion, another annual increase of over 20%. Vietnam accounts for 25% of all U.S. imports of goods from the Association of Southeast Asian Nations (ASEAN). The numbers are likely to reach $80 billion and a 33% market share by 2020.

More details can be found from a few recent AmCham statements to government officials and to press inquiries:

Note: Vietnam Business Forum a “structured dialogue” of about three hours 2 times a year, in June and in December, where the business associations present their views of the business ties and business environment and suggest areas for improvement.

Sheng Lu: What are the main reasons that U.S. companies come to invest in Vietnam? Are most U.S. business operations in Vietnam profitable?

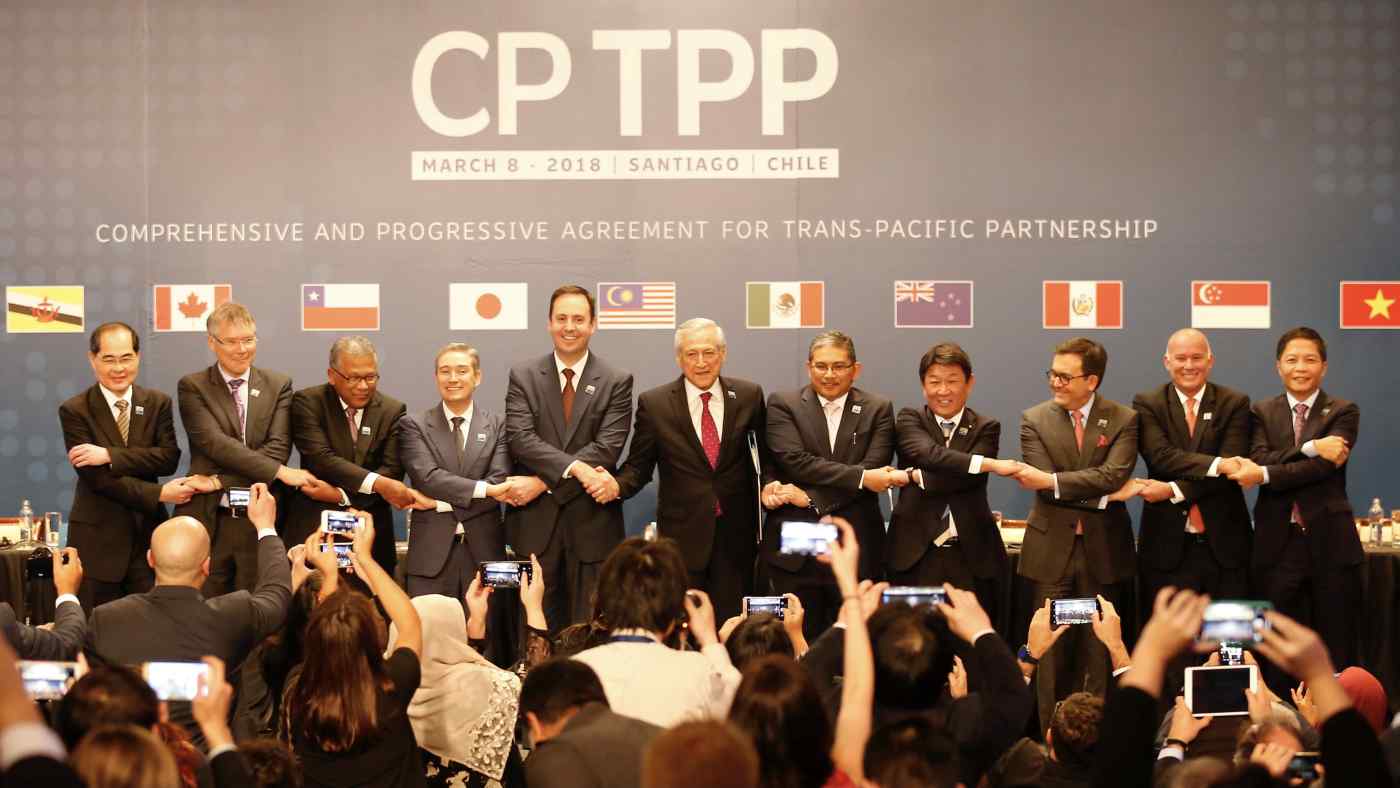
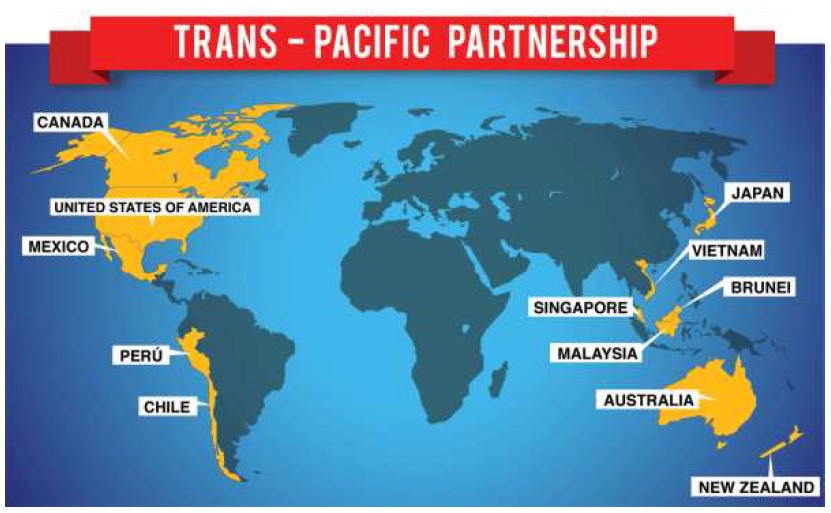
Herb Cochran: Foreign Direct Investment into Vietnam has been increasing recently, as companies prepare for ASEAN integration, for the Trans-Pacific Partnership (TPP), and for the expectation that 59% of global middle class consumer spending will be in the Asia – Pacific region by 2030, up from 23% in 2009. For example:

These are all world-class factories, by global companies, for export to ASEAN, TPP, and Asia-Pacific markets. Not to mention the high-tech investments by Intel, Samsung, Apple, and others in the microelectronics and consumer electronics sector.

Main reasons that U.S. companies come to invest in Vietnam include:

  • Availability of low cost labor
  • Availability of trained personnel
  • Stable government and political system

Regarding Vietnam’s business and investment environment, please also see the summary below from ASEAN AmChams’ Business Outlook Survey 2016.

ASEAN survey

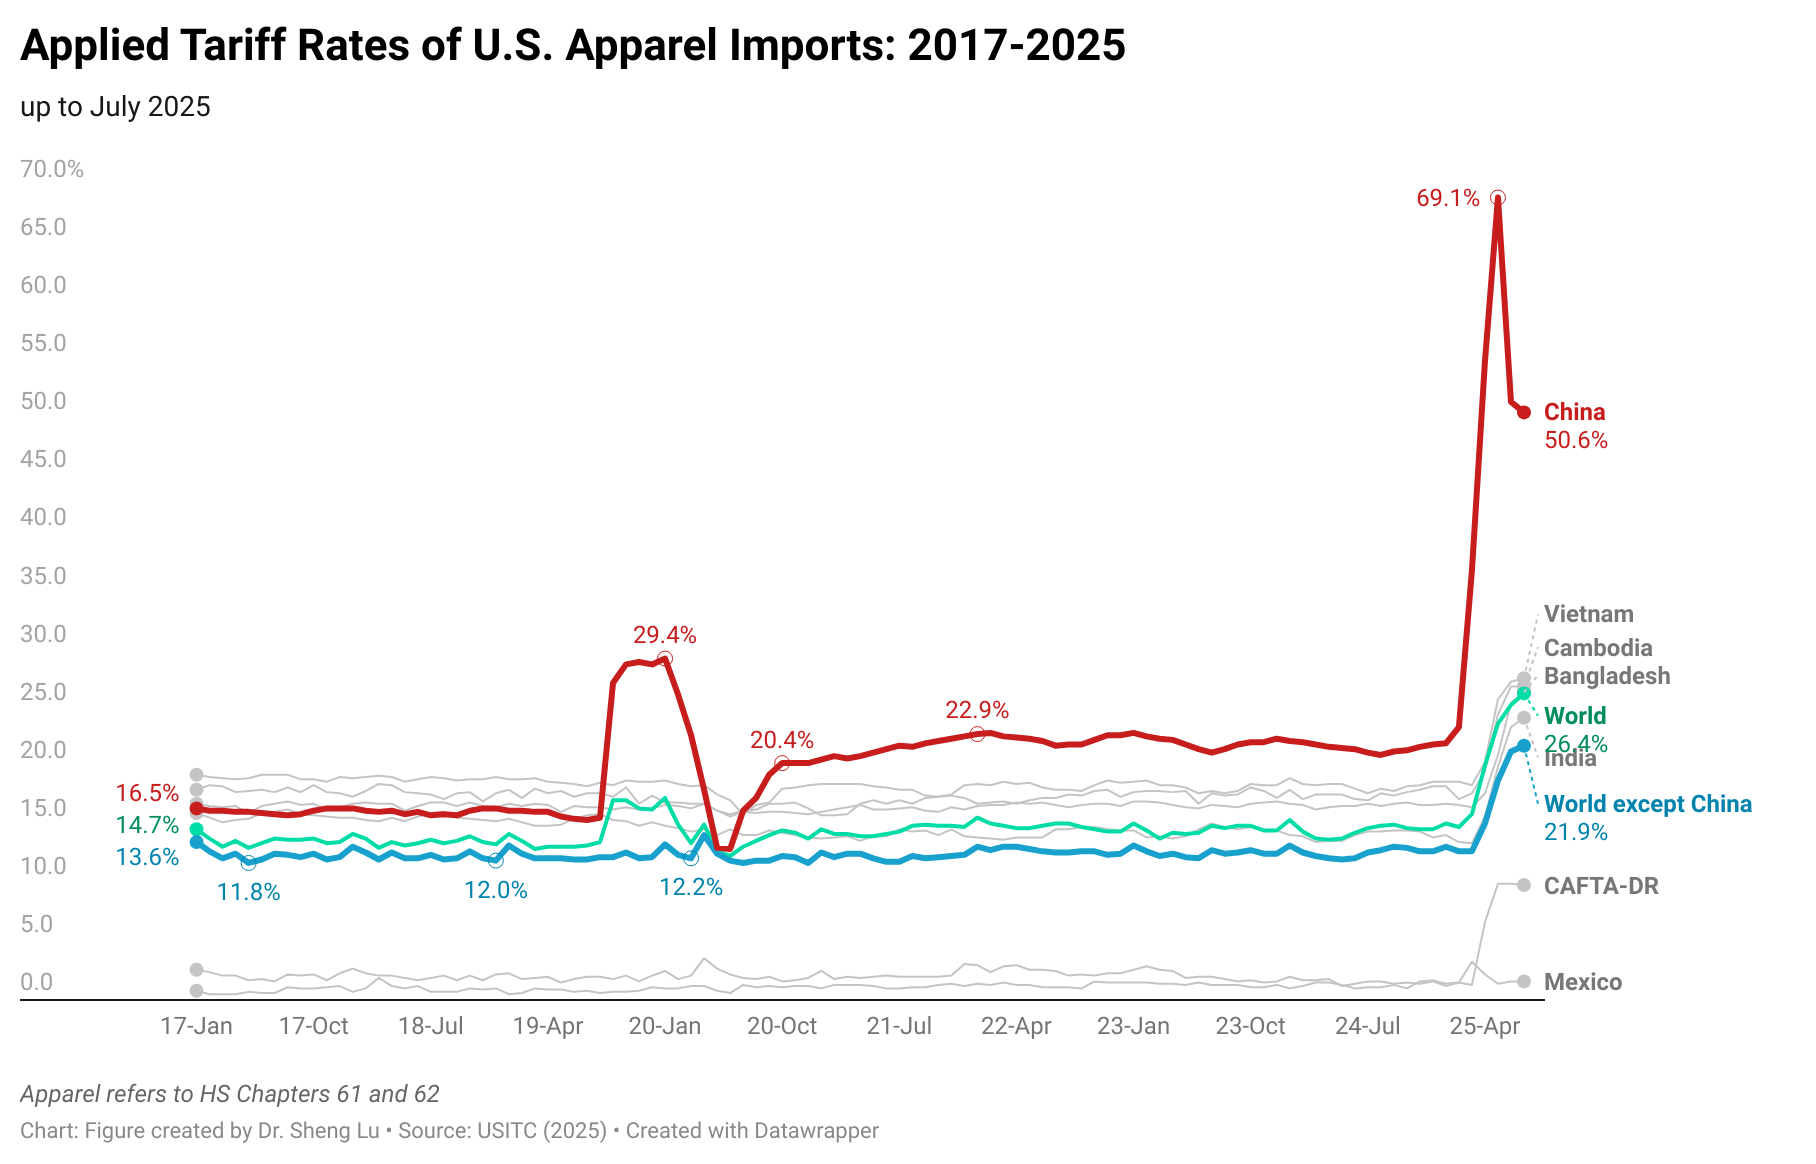
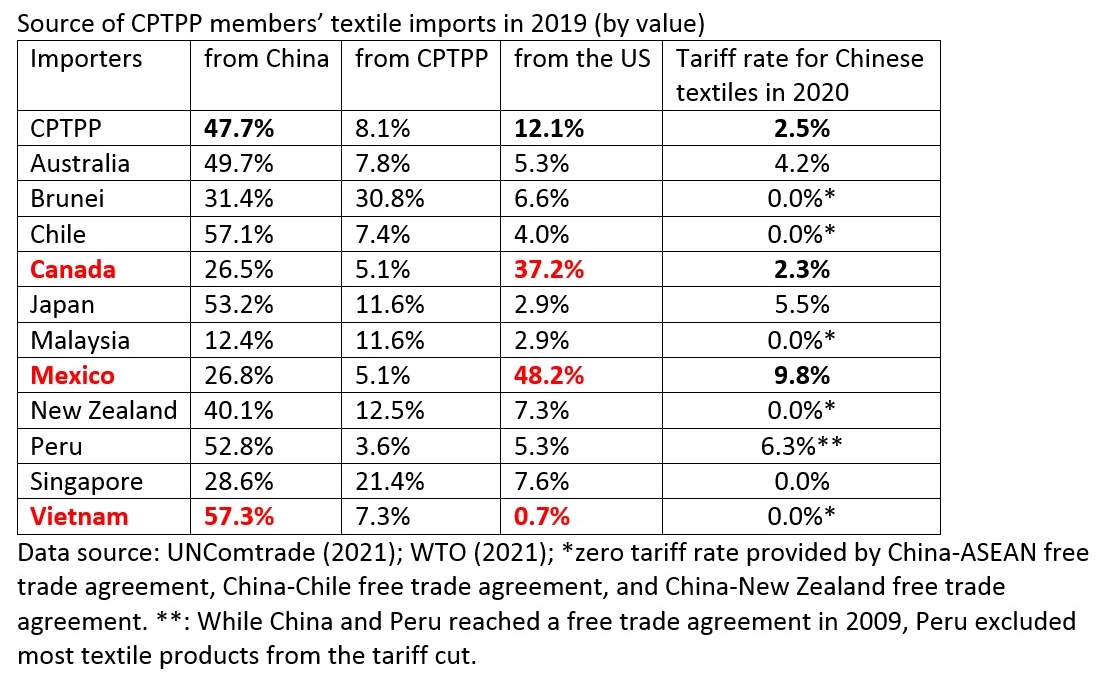
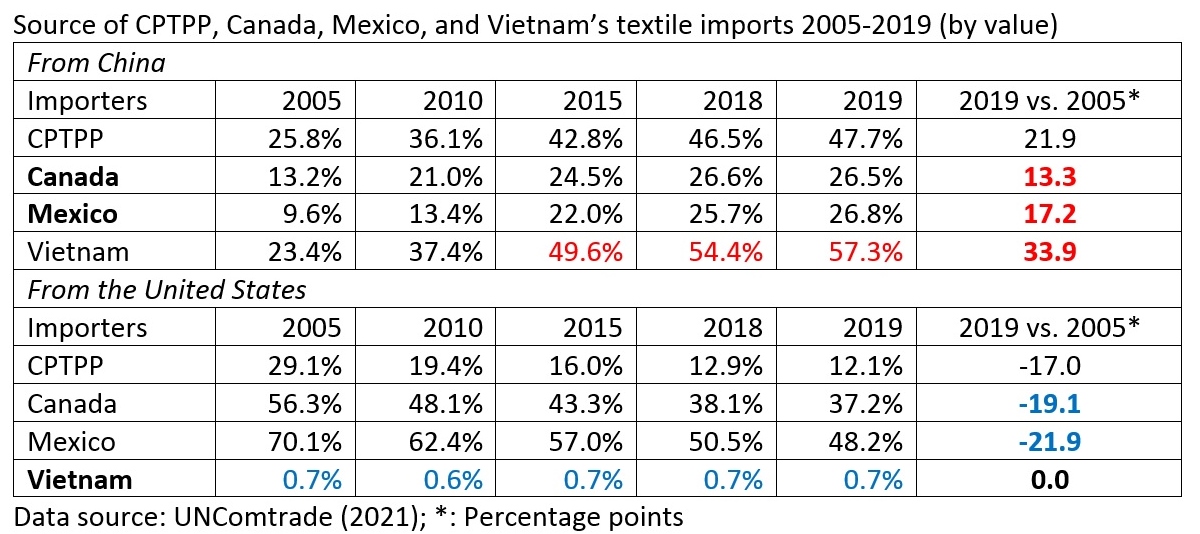
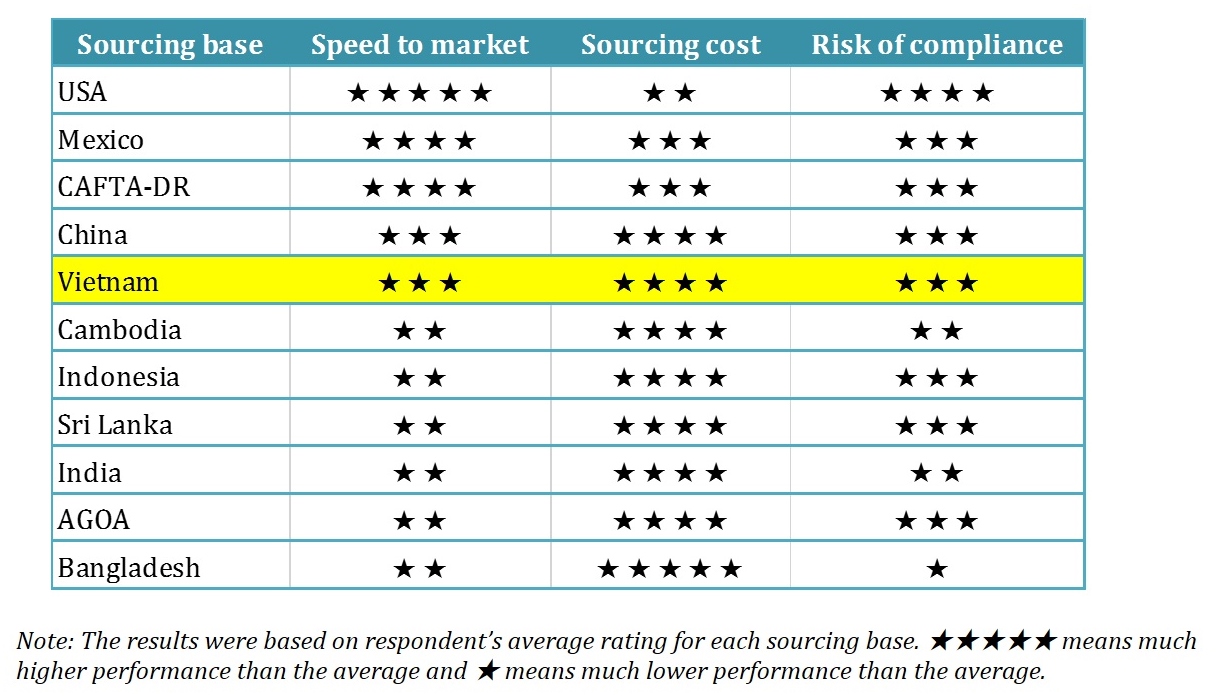
Sheng Lu: Given the increasing labor cost in China, many people see Vietnam as an alternative sourcing destination for labor-intensive products such as apparel and footwear. What’s your view on this trend?

Herb Cochran: I agree. In Aug 2013, we had a delegation visit AmCham HCMC from AmCham Hong Kong, Footwear and Apparel Committee. They said, “We represent 80% of the apparel and footwear sourcing in the world. We are in Hong Kong because most of our sourcing is in China. But we are leaving China, for various reasons. Vietnam’s participation in TPP is certainly an attraction, but we are leaving China with or without TPP. We want to know if Vietnam will welcome us.”

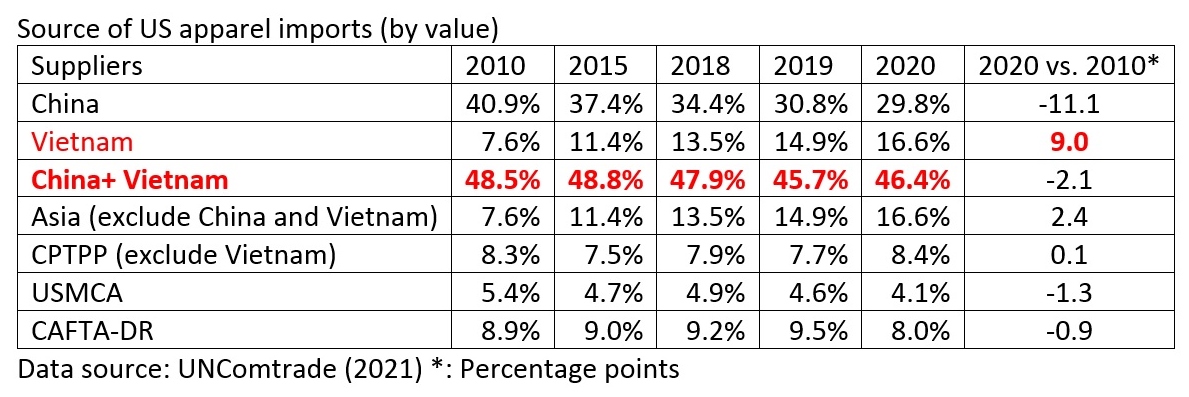
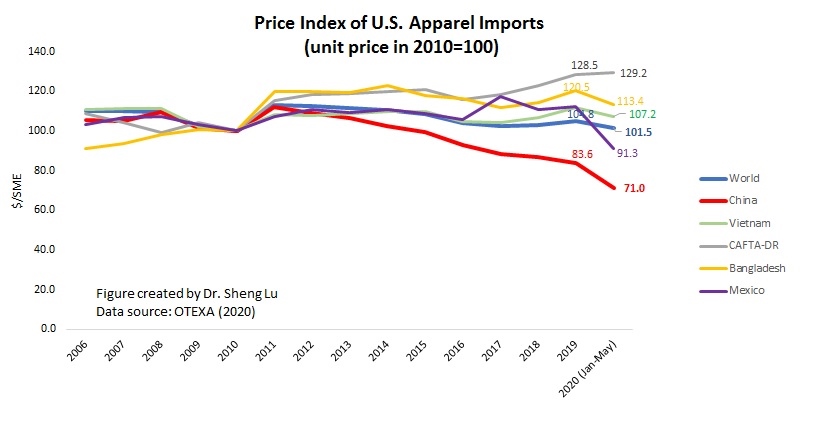
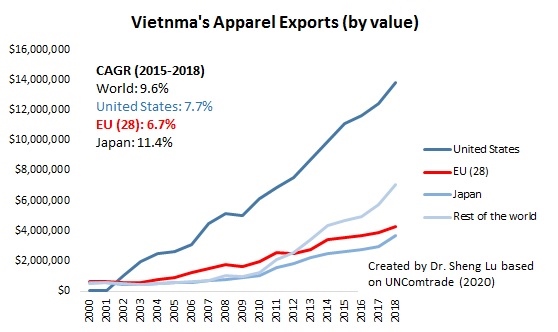
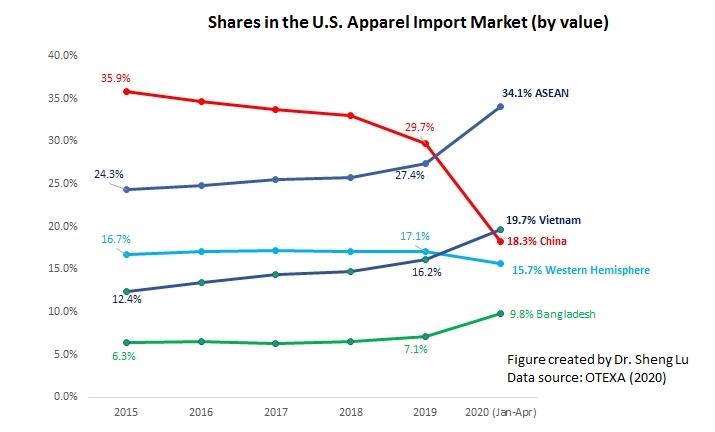
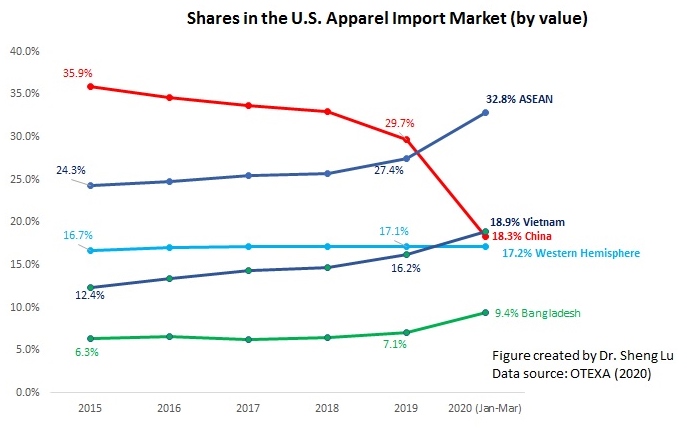
It should be particularly noted that between 2013 – 2015, about $3 billion was announced in FDI in textiles to meet the yarn-forward rules of origin requirements of TPP. One estimate projects Vietnam’s apparel exports to the U.S. under TPP “… would be as high as US$ 22 billion” by 2020. Another projects that Vietnam’s apparel and footwear exports would increase by 45.9% over the baseline by 2025. A third expert said she expects the TPP will “change the sourcing landscape drastically;” and Vietnam’s share of the U.S. apparel import market could go from 10% to 35% very quickly.” [Note: 35% of the U.S. apparel imports market is $35 billion. I think this is the most interesting estimate, a microeconomic estimate from an industry expert and not a “macroeconomic model estimate.”]  And Mr. Le Tien Truong, Deputy Director of VINATEX, expects that Vietnam’s exports of textiles and apparel could reach $50 billion by 2025. [I think this estimate is overoptimistic.]

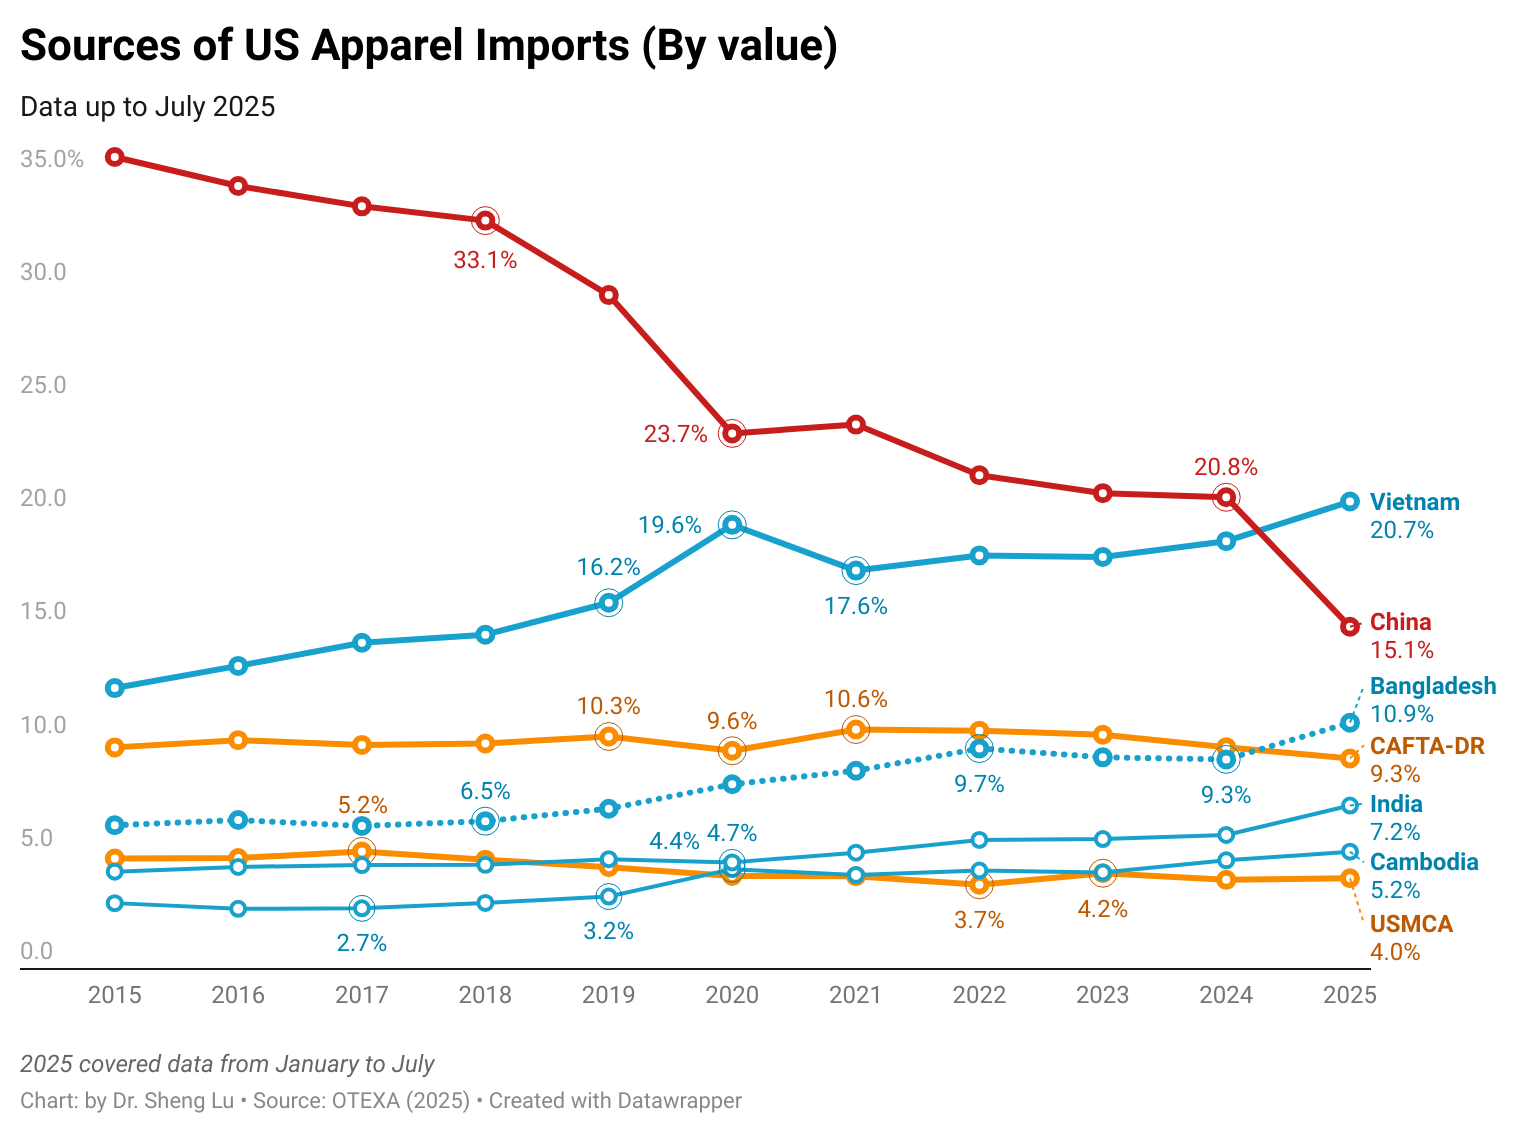
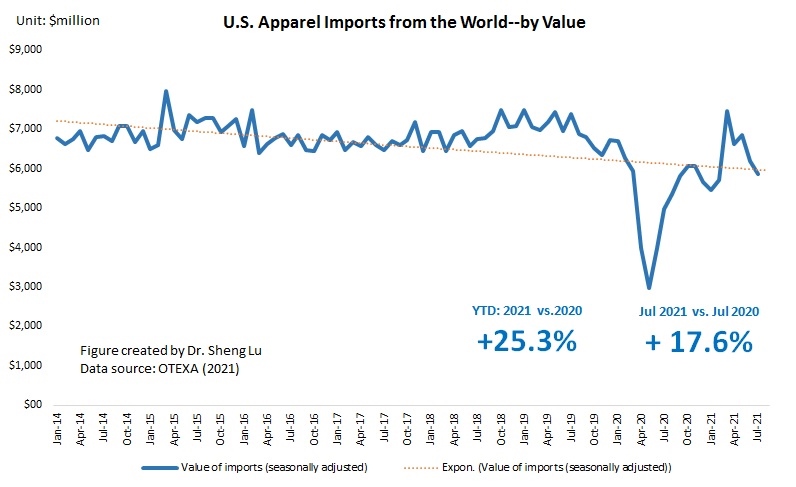
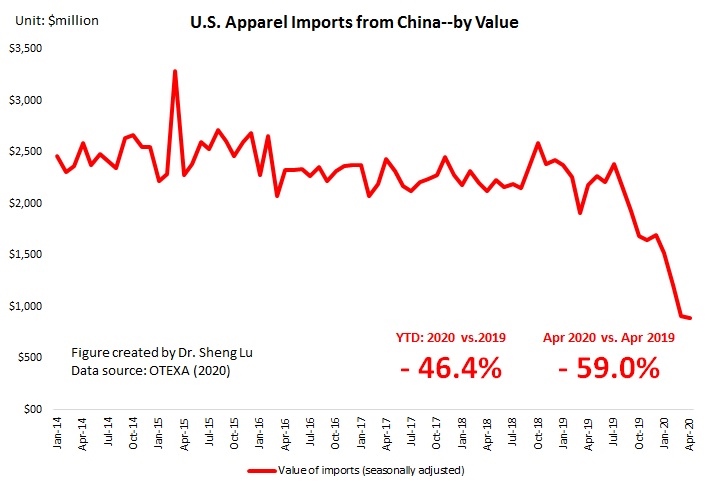
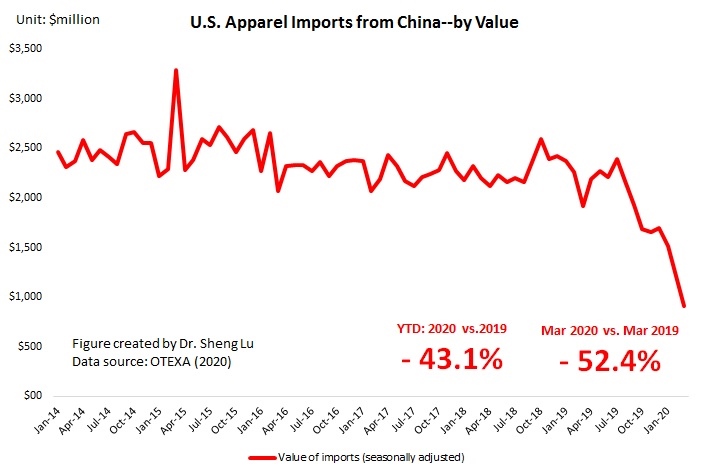
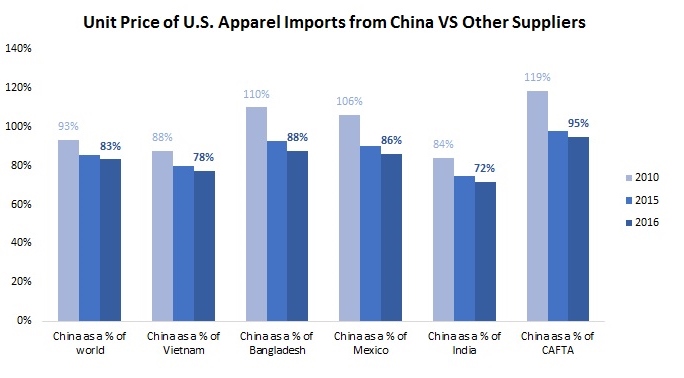
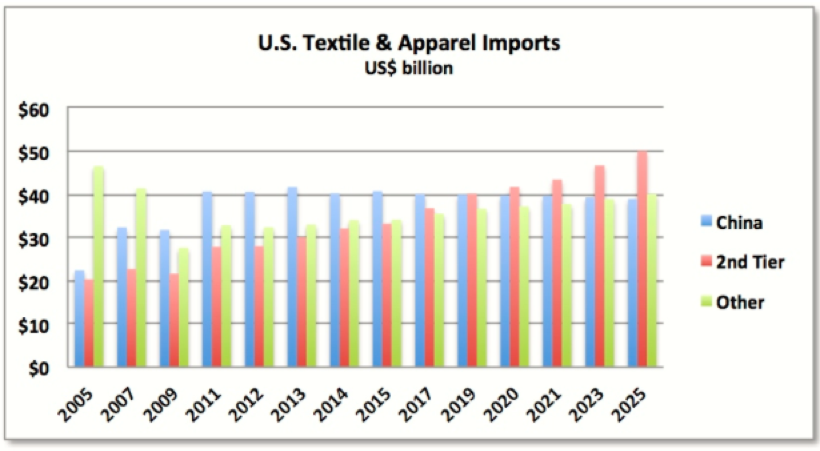
Below is a historical comparison of U.S. imports of apparel from China, “2nd Tier Countries,” and “Other.” from 2005 to 2025. The actual trade statistics from 2005 to 2015 show that U.S. Imports of Apparel from China doubled from 2005 (when quotas on WTO members were lifted) to 2010, but they have been “flat” since then. Value of imports from 2016 to 2025 are forecasted numbers.

unnamed

Sheng Lu: In your view, what commercial opportunities does the Trans-Pacific Partnership (TPP) present to U.S. companies in Vietnam, especially in the textile and apparel industry?

Herb Cochran: The most authoritative study was done by Professor Peter Petri of Brandeis University and the Peterson Institute. According to the findings:

The TPP would increase Vietnam’s exports from the expected “baseline” in 2025 without TPP of $239.0 billion (of which apparel and footwear exports would total $113 billion) by $67.9 billion to $307 billion (of which apparel and footwear exports would increase by $51.9 billion to $165 billion). In percentage terms, total exports would increase by 28.4% over the baseline, and apparel and footwear exports would increase by 45.9% over the baseline. Total Net Exports increase: 67.9 / 239.0 = 28.4%.

In addition, the expected Gross Domestic Product (GDP) growth benefits are substantial, Vietnam’s GDP in 2025 with TPP, would be 10.5% higher than the baseline estimate. This is particularly important now that Vietnam is in a “structural growth decline” period, according to the World Bank. Those are economic projections that give a general idea.

Sheng Lu: How is TPP discussed in Vietnam such as its local media?

Herb Cochran: Very positively. For example, see the below link: “89% of public in Vietnam thinks the TPP is “ … a good thing.” http://www.amchamvietnam.com/30448353/89-of-public-in-vietnam-supports-tpp-pew-research/

Part of the reason for this positive viewpoint is the series of seminars that we in AmCham HCMC organized in 2013 to explain about the TPP, create better understanding of and support for the TPP especially in the Vietnam business community.

Sheng Lu: What is the outlook for TPP ratification in Vietnam?

Herb Cochran: Very good. At the closing ceremony of the 14th Plenum of the 11th Party Central Committee, the Party General Secretary, Nguyen Phu Trong, said members of the Party Central Committee reached consensus on the signing and ratification of the Trans-pacific Partnership Agreement in conformity to laws on signing and joining international treaties. Mr. Trong said: “The TPP will bring great benefits but also opportunities and challenges to Vietnam. These challenges have been identified during Vietnam’s 30 years of renewal and international integration. With efforts, creativity, and determination of the Party, army, people, and the business community, we are confident that we will overcome all challenges and grasp opportunities created by the TPP to achieve rapid, sustainable growth.”

Sheng Lu: While living in Vietnam, have you encountered any culture shock? Can you share some stories with our students?

Herb Cochran: No culture shock. During my career as a U.S. Foreign Service Officer, I lived in Vietnam, Japan, and Thailand for about 22 years, so I am used to living abroad. And I have lived in Vietnam since Jan 1997. I guess rather than “culture shock,” you might say that I have “culture insights” from time to time. The most common insight here in Vietnam is how polite, warm and gracious most people are. It is still a traditional society, very family oriented. One cultural insight is how they celebrate “death anniversaries” for many years, with special celebrations on certain multi-year anniversaries, to keep family ancestors in their memories, called lễ giỗ.

Sheng Lu: Last but not least, for our students interested in working/interning in Vietnam, do you have any suggestions?

Herb Cochran: It’s very tough to get started. Click the below link for some comments that I have put together in response to many questions: http://www.amchamvietnam.com/faqs/faq-how-do-i-find-employment-opportunities-with-amcham-member-companies/. A short commentary is that I think it is probably better to start in the U.S. with a large organization that has global operations, e.g. Walmart, Nike, etc., and learn about that organization’s international operations and get started that way. Especially when your students are younger, maybe not yet married, no children, etc. One real problem for American citizens is that they are taxed in the U.S. and in the country of employment, so that they are generally 25% to 50% more expensive than U.S. non-citizens.

–The End–

USTR Michael Froman Comments on the Textile and Apparel Chapter under TPP

Trans-Pacific-Partnership-1

In an event hosted by the Council on Foreign Relations on October 15, 2015, U.S. Trade Reprehensive Michael Froman left a comment on the textile and apparel chapter (T&A) under TPP. He said that:”

“You know, we worked very hard to find solutions that could address the broad range of stakeholder interests here, even when we had conflicting interests here in the U.S. I’ll take textile as an example. You know, we have a domestic textiles industry that’s been investing in more production in the U.S., growing their employment in the U.S. And obviously we have a strong sector of our economy that brings in apparel from other countries, apparel importers and retailers. We worked very closely with both groups of stakeholders to come up with a solution, to come up with an outcome that we think both will be comfortable with and both will be supportive of. And that’s been very important to us to try and address the broad range of U.S. stakeholder interests, whether it’s labor, environment, importers, exporters, to make sure we’re covering everybody’s interests well.”

In the remarks, Forman also ruled out the possibility that TPP would be renegotiated. He said that:

“So this isn’t one of those agreements where, you know, you can, you know, reopen an issue or renegotiate a provision. This is one where, you know, every issue is tied to every other issue and every country’s outcome is balanced against every other country’s outcome. And so that’s the agreement that we’ll be putting forward under TPA for a vote by Congress.”

According to Inside U.S. Trade (October 9, 2015), the final TPP reflects some of the key priorities of the U.S. textile industry by allowing limited exceptions from the prevailing yarn-forward rules of origin and by including tariff phaseouts for “sensitive apparel items” of 10 to 12 years.

Besides the basket of goods that will become duty-free upon entry into force (which include cotton shirts and cotton sweaters), TPP sets up three other categories for tariff reductions on apparel:

TPP apparel

Major exceptions other than the “short supply list” mechanism under TPP include:

  • An “earned import allowance program for cotton pants made in Vietnam from third-country fabric by importing a specified amount of U.S. cotton pants fabric. This would allow cotton pants from Vietnam would enter the U.S. duty-free as soon as the agreement is implemented. It is said the ratio for the program is “close” to 1:1. However, for men’s cotton pants, there could be a 15 million square meter equivalents (SMEs) annual cap until year 10, after which it will increase to 20 million. There is no quantitative limit for the other types of cotton pants that can be shipped under the program, such as women’s, girls’ and boys’ pants.
  • A limited list of cut-and-sew items that Vietnam and other TPP countries can ship to the U.S. under the preferential TPP duty rate. These include synthetic baby clothes, travel goods including handbags, and bras.

Japan’s Textile Exports to Vietnam Keep Growing Fast

According to a recent report released by the Textile Outlook International, Japan’s textile and apparel (T&A) exports increased by 9.6% to a five-year high in 2013 (¥763,307 million or $8,571 million USD), added by a sharp depreciation in the value of the yen (Note: Yen or “¥” is Japan’s currency) against US dollar. Specifically, Japan’s textile exports increased by 9.8%, from ¥729,761 million in 2012 to ¥801,450 million in 2013. Japan’s apparel exports rose by 3.7%, from ¥33,546 million in 2012 to ¥34,792 million in 2013. Textiles account for a lion’s share of Japan’s total T&A exports– 95.8% in 2013 and 95.6% in 2012 in terms of value.

1

Statistics also show that Vietnam not only is Japan’s second largest T&A export market, but also is one of the fastest growing export markets for Japan. In 2013, 9.1% of Japan’s T&A exports went to Vietnam (mostly were textiles), increased from 8.5% in 2012. In terms of absolute value, Japans’ T&A exports to Vietnam has also kept growing fast in recent years: 17.1% increase in 2013, 9.7% in 2012 and 27.3% in 2011, much higher than the growth rate of Japan’s overall T&A exports over the same period. Additionally, about 26% of Japan’s textile exports to Vietnam in 2013 were man-made fiber fabrics (SITC 653), followed by special yarns and fabrics (SITC 657) which accounted for 21% in terms of value. This product structure well matches with Japan’s overall textile exports to the world.

2 3

On the other hand, Japans’ T&A exports to the US also grew by 8.1% in 2013, following a 3.2% rise in 2012. Fastest growing category of Japan’s T&A exports to the US in 2013 include blue denim fabric, non-textured filament yarn, wool knitted shirts and blouses and miscellaneous manufactured products made from man-made fibers.

However, the solid performance of Japan’s T&A exports in 2013 “failed to reinvigorate domestic production”. According to the report, Japan’s total T&A exports declined by 2.0% from 2012 to 2013, following a 2.3% fall a year earlier. However, production of miscellaneous textile products in Japan went up 0.6% in 2013.

Questions for discussion:

  • Will Japan further strengthen its ties with Vietnam in T&A production and trade because of TPP?
  • Should the US textile industry care about Japan in the TPP?

Welcome for any comments and suggestions.

Related reading
Lu, S. (2014). Does Japan’s accession to the Trans-Pacific Partnership an opportunity or a threat to the U.S. textile industry: A quantitative analysis. Journal of the Textile Institute. (ahead of print version) 

What does Vietnam’s Textile Factory Actually Look Like?

Vietnam attracts a lot of attention these days in the textile and apparel world. But what does Vietnam’s textile and apparel factory actually look like? 

This video features PPC (Phong Phu Corporation), one of the largest textile mills in Vietnam. It is said that PPC accounts for over 50% of Vietnam’s total textile exports.

  • Anything in the video interests you or surprises you?
  • How is PPC different from textile mills in the US?( You may think about the video we watched in class about the textile mills in NC. For example, are there any differences in working environment, the facility, what it is producing, required labor skills, efficiency and productivity?)
  • How should the US textile industry treat Vietnam? A competitor? A threat? A potential partner? or a great opportunity for investment?

Please feel free to share your thoughts.

[Please leave no more comment for this post unless you have NEW ideas to share]

Why does the US Textile Industry Want Yarn-forward Rule of Origin (RoO) in TPP?

textile

My personal understanding: the US textile industry insists yarn-forward RoO in TPP is not because they expect a substantial increase of textile exports to Vietnam as the case of NAFTA and CAFTA which help capture the export markets in Mexico and Central America. But rather it is because:

1) Without yarn-forward, situation will get even worse. Particularly, a less restrictive RoO will make Vietnam’s apparel exports which contain textiles made in China, Taiwan or South Korea qualified for duty free access to the US market. Definitely this will be a more imminent and bigger threat to the US textile industry than simply facing competition from Vietnam’s apparel which contains Japanese made textiles. And still many US textile companies don’t treat the Japanese textile industry very seriously, although I think they should. Remember, Japan currently is the fourth largest textile supplier to Vietnam and the NO.1 textile supplier to China.

1

2

2) With yarn-forward RoO in place, at least US textile companies can invest in Vietnam (remember, globalization is about movement of capital as well. Many apparel companies in Mexico and Central America actually are invested by US companies). Without yarn-forward RoO however, Vietnam can simply rely on imported textiles as the case mentioned in (1) and there will be no incentive for US textile companies to move factories to Vietnam (meaning, capital holders will lose).  

So overall yarn-forward RoO may win a few more years for the US textile industry. But in the long run, it is my view that the US textile production and its exports to the Western Hemisphere countries may still inevitably decline (especially those output to be used for apparel assembly purposes) after the implementation of TPP. In the 21st century, the nature of competition is supply chain v.s. supply chain. 

The future of the US textile industry is those high-end markets, particularly technical & industrial textiles.  

Sheng Lu 

Additional Reading: The potential impact of TPP on the US textile industry

Textile and Apparel Sector in the TPP Negotiation: An Update

TPP_map

USTR objectives
Officially, USTR has announced the following objectives in the TPP for textile and apparel:

  • Elimination of tariffs on textile and apparel exports to TPP countries;
  • A “yarn forward” rule of origin, which requires that textile and apparel products be made using U.S. or other TPP country yarns and fabrics to qualify for the benefits of the agreement, so as to ensure that non-qualifying textiles and apparel from non-TPP countries do not enjoy the benefits reserved for TPP countries;
  • A carefully crafted “short supply” list, which would allow fabrics, yarns, and fibers that are not commercially available in the United States or other TPP countries to be sourced from non-TPP countries and used in the production of apparel in the TPP region without losing duty preference;
  • Strict enforcement provisions and customs cooperation commitments that will provide for verification of claims of origin or preferential treatment, and denial of preferential treatment or entry for suspect goods if claims cannot be verified; and
  • A textile specific safeguard mechanism that will allow the United States and other TPP countries to re-impose tariffs on certain goods if a surge in imports causes or threatens to cause serious damage to domestic producers.

X-basket
According to the National Council of Textile Organizations, with regard to the market access offer to Vietnam, textile and apparel products are categories into different groups based on their “sensitivity” to the domestic industry producing the like products. Among the three major categories, the so called “X-basket” will include textile and apparel items that are deemed most sensitive to the United States. Specific items to be included in the X-basket however are unclear and details of the phrase-out formula are still under discussion. It is said that items in the “X-basket” may be subject to an initial tariff cut ranging from 35 to 50 percent.

Vietnam’s top apparel exports to the United States are basic apparel items like shirts, sweaters and pants.  Many of them are the same types of items that were subject to the U.S. safeguard measures against China back in 2005. The U.S. textile industry hopes that the longer phrase-out period for items in the “X-basket” would provide needed time for the industry to adjust. However, for the Vietnam side, if duties on most of its apparel exports to the United States stay in place after the implementation of the TPP, the value of participating in the agreement would substantially be compromised.

Short-supply list
The short-supply list is a roster of fabrics and other textile inputs that are determined to not be readily available in the TPP region in commercial quantities on a timely basis and can therefore be imported from third countries. Items on the short-supply list would be exempt from the general “yarn-forward” rule of origin that the U.S. has proposed in the textiles and apparel talks. USTR is pushing for a short-supply list that would have permanent items as well as temporary items that will be removed after three years. Previous U.S. free trade agreements, including CAFTA, have included a short supply process to add additional products to the list once the agreement enters into force. But the U.S. has rejected the notion that the short-supply list could be modified after the TPP enters into force.

Mexico has consistently sought to limit the scope of the short-supply list, arguing that it actually makes some of the products that the U.S. had originally proposed for inclusion in the short-supply list. Mexico was also pushing for roughly 70 items proposed for the short supply to be included only on a temporary basis, rather than a permanent one.

Other TPP members’ positions
According to the Inside US Trade, Malaysia’s textile and apparel industry is supporting U.S. calls for a “yarn-forward” rule of origin in TPP, but is also pushing for a range of exceptions such as cut-and-sew allowances and a short supply list that would be periodically reviewed. Among the items the Malaysian industry would like to see on the short supply list are shirting fabrics such as woven cotton fabric that weighs not more than 250 grams because this type of fabric is said not made in the U.S. nor Malaysia.

Related reading
Lu, S. (2014). Does Japan’s accession to the Trans-Pacific Partnership an opportunity or a threat to the U.S. textile industry: A quantitative analysis. Journal of the Textile Institute. (ahead of print version) 


2014 USFIA Benchmarking Study Released

UntitledKey Findings

  • China will remain the dominant supplier, though Vietnam and Asia as a whole are seen as having more growth potential.
  • Companies aren’t leaving Bangladesh, and are committed to compliance.
  • Companies continue to look for opportunities closer to home, including the United States, as they diversify their sourcing.
  • Companies are diversifying their sourcing and expect to continue to do so. However, current FTAs and preference programs remain under-utilized or don’t represent a major component of respondents’ sourcing.
  • Respondents welcome the passage or renewal of all future trade agreements that intend to remove trade barriers and facilitate international trade in the industry.

About the Benchmarking Study
The 2014 USFIA benchmarking study is conducted based on a survey of 29 executives at 29 leading U.S. fashion companies from March to April 2014. The study incorporates a balanced mix of respondents representing various business types in the U.S. fashion industry, including retailers, importers, wholesalers, and manufacturers. The survey asked respondents about the business outlook, sourcing practices, utilization of Free Trade Agreements and preference programs, and views on trade policy.

The full study can be downloaded from HERE.

Vietnam Announces Ambitious Plan to Develop its Textile Industry

Reported by the Sourcing Journal, Vietnam’s Ministry of Industry and Trade recently approved its textile and garment sector development plan up to year 2030. Under the new plan, Vietnam sets an ambitious goal to achieve a 55% local content ratio for exported apparel by 2015 and will further increase the ratio to around 70% by 2030. As estimated, the plan will bring about an annual textile production growth rate of 12 to 13 percent between 2013 and 2030 in Vietnam.

Numerous studies have suggested that Vietnam could substantially expand its apparel exports to the world after the implementation of the Trans-Pacific Partnership (TPP), a free trade agreement under negotiation by twelve countries in the Asia-Pacific region, including the United States and Vietnam. However, restrained by its stage of development, about 70—80% of Vietnam’s demand for textile inputs currently is imported (Lopez-Acevedo & Robertson, 2012). Based on 23 interviews, Goto (2007) further finds that apparel suppliers in Vietnam on average produced 67% CMT and 33% FOB based on value and 95% CMT and 5% FOB based on quantity.

But with the help of foreign investment from South Korea, Taiwan and Japan, Vietnam is quickly building up its textile manufacturing capacity (note: this is very different from the case in Mexico). According to the General Statistics Office of Vietnam, the number of textile firms in Vietnam had quickly increased from 408 in 2000 to 1,577 in 2008. Lopez-Acevdeo & Robertson (2012) further suggest that Vietnam’s annual production of cotton fiber has reached 10,000 tons; 50,000 tons of man-made fiber; 260,000 tons of short-staple fiber and yarn; 15,000 tons of knitted fabric; and 680 million meters of woven fabric. Around 38% of Vietnam’s textile output came from foreign invested companies in 2009.

Vietnam’s ambition to expand its domestic textile manufacturing capacity will have huge implications for the US-based textile industry. Although Vietnam seldom uses US-made textile inputs, Vietnam’s apparel exports to the United States directly compete with those exported from Mexico and countries in the Caribbean Basin regions which is the largest export market for U.S. made textiles (Lu & Dickerson, 2012).  An expanded local textile manufacturing capacity will not only reduce Vietnam’s demand for imported textile inputs, but also will help improve the price competitiveness of Vietnam’s apparel exports in the global marketplace. If China increasingly moves its textile factories to Vietnam (unless the conflict between Vietnam and China over the South China Sea complicates the situation), Vietnam may further becomes a net textile exporter in the long run.

1

2


Untitled


3

4