Global Textile and Apparel Exports by Income Groups (2000-2015)

textile-2

textile-1

As of 2015, over 40% of textile exports still come from high income countries. Meanwhile, upper middle income countries are quickly expanding exports and gaining more market shares from 2000 to 2015. However, textile exports from low income countries remain minimal.

apparel-2

apparel-1

From 2000 to 2015, shares of apparel exports from high income countries dropped from 50% to 31%. Meanwhile, market shares of upper middle income countries increased from 32% to 46%. However, low income countries are becoming even more marginalized in apparel exports: their market shares slipped from 0.3% in 2000 to only 0.1% in 2015.

share-1  share-2

Additionally, textile and apparel exports in general are economically more important for lower income countries than higher income countries. However, the percentage of textile and apparel in a country’s total merchandise exports seem to be declining across all income groups except for low-income countries.  Meanwhile, for a good number of low-income and lower-middle income countries such as Bangladesh, Gambia, Pakistan and Cambodia, textile and apparel remain one of their very few exporting opportunities.

Data source: World Trade Organization (2017), World Bank (2017); Country list (by income groups) can be found HERE

Acknowledgement: Thanks to Sheiron Crawford for assisting the data collection.

Trade Adjustment Assistance (TAA) Program: An Overview

In the class, we briefly introduced the Trade Adjustment Assistance (TAA) program, which has played a critical role in the past decades both financially helping trade-displaced workers and tactically facilitating trade liberalization agendas in U.S. trade policy.

Rationale and purpose of TAA

It is widely acknowledged that trade liberalization can benefit consumers and create new market-access opportunities for export-oriented firms. However, expanded trade may also exert negative and often concentrated effects on domestic industries and workers that face increased import competition. Freer trade is not entirely free, but bears the cost of economic adjustment. TAA program therefore is designed to provide readjustment assistance to firms and workers that suffer dislocation (job loss) due to foreign competition or offshoring. To be noted, TAA has been a significant tool to assist workers in the U.S. textile and apparel industry.

taa3

According to official statistics, since 1974, 2.2 million American workers have benefited from the TAA program, which provides workers with opportunities to obtain the skills, credentials, resources, and support they need to obtain good jobs in an in-demand occupation — and keep them. TAA was last authorized in June 2015 to continue through June 30, 2021.

Eligibility for TAA

To be eligible for TAA, petitioning workers must establish that foreign trade contributed importantly to their loss of employment. The role of foreign trade can be established in one of several ways:

  •  An increase in competitive imports: The sales or production of the petitioning firm have decreased absolutely and imports of articles or services like or directly competitive with those produced by the petitioning firm have increased.
  • A shift in production to a foreign country: The workers’ firm has moved production of the articles or services that the petitioning workers produced to a foreign country or the firm has acquired, from a foreign provider, articles or services that are directly competitive with those produced by the workers.
  • Adversely affected secondary workers: The petitioning firm is a supplier or a downstream producer to a TAA-certified firm and either (1) the sales or production for the TAA-certified firm accounted for at least 20% of the sales or production of the petitioning firm or (2) a loss of business with a TAA-certified firm contributed importantly to the workers’ job losses.

Additionally, workers who lost jobs from firms that have been publicly identified by the United States International Trade Commission (USITC) as injured by a market disruption (for example, in anti-dumping, countervailing duty or safeguard cases) or other qualified action can also submit TAA petition.

Workers’ Benefits under TAA

TAA benefits for individual workers include:

  • Training and reemployment services and income support for workers who have exhausted their unemployment compensation benefits and are enrolled in training.
  • Workers age 50 and over may participate in the Reemployment Trade Adjustment Assistance (RTAA) wage insurance program.
  • Certified workers may also be eligible for a tax credit for a portion of the premium costs for qualified health insurance.

Financial Cost of TAA

TAA is financially covered by the federal government (i.e. taxpayers’ money) through annual appropriations. Appropriations for the program in FY2016 were $861 million, of which $450 million was for training and reemployment services and the remaining $411 million was for income support and other activities.

Role of TAA in U.S. trade policy

TAA is “presented as an alternative to policies that would restrict imports, and so provides assistance while bolstering freer trade and diminishing prospects for potentially costly tension (retaliation) among trade partners.”(Hornbeck, 2013)

Back in 1992, newly elected President Clinton oversaw the implementation of the North America Free Trade Agreement (NAFTA), but did so only after a number of conditions were attached, including TAA. In 2002, President Bush and the Republicans pushed hard to renew the long-expired trade promotion authority (TPA), but Democrats were unwilling to provide it unless TAA was reauthorized. TAA was also directly linked to the passage of three free trade agreements (FTAs) by US Congress in 2011, including US-Korea, US-Columbia and US-Panama FTAs.

 taa

taa2

Concerns about TAA

Critics strongly debate the merits of TAA on equity, efficiency, and budgetary grounds:

  • Economic efficiency: some critics argue that economic efficiency was far from guaranteed given that subsidies can operate to reduce worker and firm incentives to relocate, take lower-paying jobs and in other ways to carryout necessary reform.
  • Equity: some critics argue that because many economic groups hurt by changing economic circumstances caused by other than trade policies were not afforded similar economic assistance (for example, domestic competition and technology advancement). For the sake of fairness, if society has a responsibility to help all those dislocated by economic change, then policies should not be narrowly restricted to trade-related harm only.
  • Administrative cost: it is argued by some economists that defining and measuring injury from tariff reduction would be inexact, if not arbitrary. Some studies also suggest that many firms, even smaller ones, could adjust on their own, and that workers could just as well rely on more broadly available unemployment and retraining programs. In addition, the high costs of TAA would dilute political support for the program.

Reference:

Collins, B. (2016). Trade Adjustment Assistance for Workers and the TAA Reauthorization Act of 2015, Congressional Research Service, R44153

Hornbeck, J.F. (2013).Trade Adjustment Assistance (TAA) and Its Role in U.S. Trade Policy, Congressional Research Service, R41922

CRS Releases Updated Study on the U.S. Textile Industry and the Trans-Pacific Partnership (TPP)

crs-reportOn September 1, the Congressional Research Service (CRS) released its updated study on the U.S. textile industry and the Trans-Pacific Partnership (TPP). According to the report:

First, TPP is suggested to have a limited impact on U.S. domestic textile and apparel manufacturing, because:

1) Automation rather than imports is found to be the top factor causing job losses in the U.S. textile industry in the past decade;

2) U.S. is one of the very few TPP members whose textile output mostly went into home textiles, floor coverings and other technical textile products rather than apparel.

3) More than 90% of apparel sold in the United States is already imported. Some companies maintain U.S. manufacturing of high-value products or products requiring quick delivery, which are not likely to be supplied by other TPP members.

4) A quantitative assessment conducted by the U.S. International Trade Commission (USITC) in May also suggests that U.S. imports of textiles will only climb 1.6% by 2032 if TPP enters into force in 2017. Over the same 15-year period, both output and employment in the U.S. textile industry could slightly shrink by 0.4% as a result of the implementation of TPP.

Second, TPP could challenge the Western-Hemisphere supply chain and negatively affect U.S. textile exports to the region:

1) TPP will make apparel manufacturers located in Mexico and Central America lose one important advantage—duty free access to the U.S. market, when competing with Asian TPP members such as Vietnam and Malaysia.  The Central American-Dominican Republic Apparel and Textile Council also estimates the CAFTA-DR region could see a contraction of 15%-18% in industrial employment resulting from lost production orders in the first year after the TPP agreement is implemented.

2) The major products sourced by U.S. apparel companies from the Western Hemisphere region include basic, low-value knitwear garments such as shirts, pants, underwear, and nightwear, with a focus on men’s and boys’ wear. However, these products are with low time sensitivity but high price sensitivity, meaning Asian TPP members can easily offer a more competitive price and take away sourcing orders after the implementation of TPP.  

3) Because of physical distance and abundance of local supply, leading Asian TPP apparel exporters such as Vietnam seldom use US-made yarns and fabrics. Supported by foreign investments, Vietnam is also quickly building up its own textile manufacturing capacity, which is expected to reach 2 million metric tons for fabrics and 650,000 metric tons for fibers by 2020. This implies that TPP may help little creating new export markets for US textile products, despite the restrictive yarn forward rules of origin.

Additionally, TPP could result in intensified competition in the technical textile area, which is of strategic importance to the future of the U.S. textile industry:

1) If the proposed agreement is implemented, those segments of the U.S. textile industry that supply industrial textiles are likely to face greater competition from rising imports from Japan.

2) TPP will allow Japanese industrial textiles to newly get duty free access to Mexico and Canada, which are the largest export markets for U.S. industrial fabrics in 2015. However, TPP won’t help US companies get more favorable access to China, which is the top export market for Japanese industrial fabrics.

2016 August Sourcing at Magic Debriefing

FullSizeRender.jpg

New landscape of sourcing

  • Sourcing is turning from regional to global. In the past, U.S. apparel companies/fashion brands set up regional offices to handle sourcing. Nowadays, companies are building a global infrastructure to develop, source and market their products around world. Global rather than regional sourcing also allows companies to improve sourcing efficiency and reduce total product and distribution cost while maintaining quality of their product and services.
  • U.S. apparel companies/fashion brands are going with fewer but more capable vendors (“super vendors”). For example, executive from a leading U.S. apparel brand said their company has shrunk their sourcing base by 40% in the past few years. At the same time, they now expect their vendors to be able to supply on a global scale, including having multiple manufacturing facilities around the world and being able to provide value added services such as design and product development.
  • Related, sourcing is shifting from cut-make-and trim (CMT) to full package. This is consistent with our findings in the latest USFIA benchmarking study which suggests that vendors are highly expected to have the capacity of supplying raw material.
  • U.S. apparel companies/fashion brands are also investing to build a more partnership-based relationship with vendors— help vendors reduce cost, become more innovative and have the same vision looking at the whole picture of the supply chain. At the same time, U.S. apparel companies/fashion brands see vendors as their “ambassadors” and want to know more about them—what they believe, what they can bring to the table and how they treat their workers.
  • Companies are redefining the role of sourcing in their businesses. Sourcing is no longer treated as a technical function, but an integral part of a company’s overall business strategy.  

 IMG_2041

Made in USA

  • There is a noticeable interest in sourcing textiles and apparel “Made in USA” at Magic. A dozen U.S.-based apparel companies attended the Magic show and their booths attracted a heavy traffic. According to representatives from these companies, U.S. consumers’ increased demand for apparel “Made in USA” has been a strong support for their business growth in recent years.
  • Nevertheless, apparel “Made in USA” often contain imported inputs today. I specifically asked a few vendors where their fabrics come from. All but one company said fabrics were imported because it was so hard to find domestic suppliers, especially for woven fabrics. Interesting enough, some companies feel OK to label their apparel “Made in USA” even though they use imported fabrics. According to them, apparel can be labeled “Made in USA” as long as “domestic content exceeds 60% of the value of the finished product.”
  • At a seminar, some entrepreneurs which make and sell “Made in USA” apparel and accessories said price and production cost remain one of their top business challenges. I asked the panel whether going high-end is the only option for the future of apparel “Made in USA” given the high labor cost in the country. They disagreed—saying technology advancement and design innovation could help reduce production cost. However, all panelists admit they carry some luxury product lines. Additionally, some companies choose to emphasize concepts other than “Made in USA”, such as “hand-made” and “Pride in Seattle”, in order to make their products look more personal to consumers and allow more flexibility in sourcing raw material.

12751249_584173535074689_533837109_n

Updates of sourcing destinations

  • Ethiopia: as I observe, Ethiopia is THE star at this year’s Sourcing at Magic. The country was repeatedly mentioned by panelists at various seminars as a promising and emerging sourcing destination. Several events at the show were also exclusively dedicated to promoting apparel and footwear “Made in Ethiopia”. A couple of reasons why Ethiopia is so “hot”: 1) the ten year extension of AGOA creates a stable market environment encouraging sourcing from Africa and investing in the region (and for sure the duty free access both to the US and EU market).  2) Located in the middle of Africa, Ethiopia is regarded as a hub that has the potential to take a leadership role in integrating the apparel supply chain in the region. 3) It is said that Ethiopian government is very supportive to the development of the local textile industry.  4) Many U.S. fashion companies feel sourcing from Ethiopia involves less risks of trade compliance than sourcing from some Asian countries such as Bangladesh.  
  • China: China unarguably remains the No.1 textile and apparel supplier to the U.S. market—in terms of numbers, around 60% vendors at the Magic show came from China. But I notice that booths of Chinese vendors didn’t have much traffic this time, an interesting signal for sourcing trend in the upcoming season. Nevertheless, while U.S. apparel companies/fashion brands are placing more emphasis on supply chain efficiency, quality of products, speed to market and added value in sourcing, “Made in China” will continue to enjoy many unique advantages over other suppliers. Plus, Chinse factories are actively investing overseas, from Southeast Asian countries to Africa. This makes Chinese factories likely to grow into “super vendors” that western fashion brands/retailers are looking for. To certain extent, macro trade statistics alone may not be able to fully reveal what is going on in apparel sourcing and trade.   
  • Vietnam: Regarding the future of Vietnam as a sourcing destination for U.S. apparel companies/fashion brands, somehow I hear more concerns than excitements at Magic. The uncertainty surrounding the ratification of TPP by the U.S. Congress definitely has made some companies hold back their investment and sourcing plan in Vietnam. Another big concern is Vietnam’s labor shortage and limited manufacturing capacity: apparel factories in Vietnam are already competing with electronic industry for young skilled workers. US companies also have to compete with their EU counterparts for orders in Vietnam. The newly reached EU-Vietnam Free Trade Agreement (EVFTA), which is very likely to be implemented earlier than TPP, provides Vietnam duty free access also to the EU market. And EVFTA adopts a much more flexible rule of origin than TPP, making it easier for Vietnam factories to actually use the agreement.

Sustainability

The awareness of social responsibility and sustainability has much improved: everyone in the industry is talking about them and have a view on them. On a voluntary basis, some companies are making efforts to improve traceability of their products, i.e. to help consumers know exactly where their clothing comes from and what is happening at the upstream of the supply chain. Yet, how to encourage factories to share their information and control tier 2 and tier 3 suppliers remain a challenge. 

by Sheng Lu

Note: Sourcing at Magic is one of the largest and most influential annual textile and apparel sourcing events hosted in the United States. Special thanks to the Center for Global and Areas Studies at the University of Delaware for funding the trip.

WTO Reports World Textile and Apparel Trade in 2015

The World Textile and Apparel Trade in 2016 is now available

textile

clothing

According to the newly released World Trade Statistical Review 2016 by the World Trade Organization (WTO), the current dollar value of world textiles (SITC 65) and apparel (SITC 84) exports totaled $291 billion and $445 billion respectively in 2015, but decreased by 7.2 percent and 8.0 percent from a year earlier. This is the first time since the 2009 financial crisis that the value of world textiles and apparel exports grew negatively.

However, textiles and apparel are not alone. The current dollar value of world merchandise exports also declined by 13 percent in 2015,to $16.0 trillion, as export prices fell by 15 percent. In comparison, the volume of world trade grew slowly at a rate of 2.7 percent, which was roughly in line with world GDP growth of 2.4 percent. WTO says that falling prices for oil and other primary commodities, economic slowdown in China, a severe recession in Brazil, strong fluctuations in exchange rates, and financial volatility driven by divergent monetary policies in developed countries are among the major factors that contributed to the weak performance in world trade.

Textile and apparel exports

China, the European Union and India remained the top three exporters of textiles in 2015. Altogether, they accounted for 66.4 percent of world exports. The United States remained the fourth top textile exporter in 2015. The top ten exporters all experienced a decline in the value of their exports in 2015, with the highest declines seen in the European Union (-14 percent) and Turkey (-13 percent). The smallest decline was recorded in China (-2 percent).

Top three exporters of apparel include China, the European Union and Bangladesh. Altogether, they accounted for 70.3 percent of world exports. Among the top ten exporters of apparel, increases in export values were recorded by Vietnam (+10 percent), Cambodia(+8 percent), Bangladesh (+6 percent) and India (+2 percent). The other major exporters saw stagnation in their export values (United States) or recorded a decline (all other top ten economies).

china's market share

Additionally, despite reported rising production cost, China’s market shares in world textile and apparel exports continued to rise in 2015 (see the figure above).

Textile and apparel imports

The European Union, China and the United States were the top three importers of textiles in 2015. However, altogether they accounted for only 37 percent of world imports, down from 52.8 percent in 2000. Because a good proportion of textiles made by developed countries (such as the United States) are exported to developing countries for apparel manufacturing purposes, the pattern reflects the changing dynamics of world apparel manufacturing and exports in recent years.

Because of consumers’ purchasing power (often measured by GDP per capita) and size of the population, the European Union, the United States and Japan remained the top three importers of apparel in 2015. Altogether, they accounted for 59 percent of world imports, but down from 78 percent in 2000. This indicates that import demand from other economies, especially some emerging markets, have been growing faster over the past decade.

world trade 2016

Turning Africa into a Global Textile and Apparel Hub

Before the 2016 Source Africa Trade event in June 2016, CNBC interviewed Tim Armstrong, Investment Promotion Director for the Textile Development Unit at the Ministry of Industry and Trade in Tanzania. Three questions were discussed during the interview:

  • Are free trade agreements/trade preference programs such as the African Growth and Opportunity Act (AGOA) translating into tangible results we can see that help African clothing exporters?
  • What has AGOA extension done to the textile and apparel industry in Africa, particularly in the context of Tanzania? What are the impacts of rules of origin on investment in the region?
  • Can apparel “Made in Africa” compete in the global marketplace when raw material such as yarns and fabrics has to be sourced from elsewhere?

What is your view on these issues?

USITC Studies the Impact of Trade on Manufacturing Jobs in the U.S. Textile and Apparel Industry

job impact of trade

employment in the US T&A industry

In its newly released Economic Impact of Trade Agreement Implemented under Trade Authorities Procedures, 2016 Report, the U.S. International Trade Commission (USITC) provides a quantitative assessment on the impact of trade on manufacturing jobs in the U.S. textile and apparel industry. According to the report:

  • Manufacturing jobs in the U.S. textile and apparel industry have been declining steadily over the past two decades. Between 1998 and 2014, employment in the NAICS 313 (textile mills), NAICS314 (textile product mills) and NAICS 315 (apparel manufacturing) sectors on average decreased annually by 7.6 percent, 4.3 percent and 11.2 percent, respectively.
  • Rising import is found NOT a major factor leading to the decline in employment in the U.S. textile industry (NAICS 313)–as estimated, imports only contributed 0.4 percent of the total 7.6 percent annual employment decline in the U.S. textile industry. Instead, more job losses in the sector are found caused by improved productivity as a result of capitalization & automation (around 4.6 percent annually) and the shrinkage of domestic demand for U.S. made textiles (around 3.5 percent annually) between 1998 and 2014.
  • Rising imports is the top factor contributing to job losses in apparel manufacturing (NAICS 315), however. As estimated by USITC, of the total 11.2 percent annual employment decline in apparel manufacturing, almost all of them is affected by imports (10.8 percent). On the other hand, increased domestic demand for apparel (such as from U.S. consumers) is found positively adding manufacturing jobs by 2 percent annually in the United States from 1998 to 2014.
  • To be noted, USITC did not estimate the impact of trade on employment changes in the retail aspect of the industry. According to the U.S. Bureau of Labor Statistics, approximately 80 percent of jobs in the U.S. textile and apparel industry came from retailers in 2015. These retail-related jobs are typically “non-manufacturing” in nature, such as: fashion designers, merchandisers, buyers, sourcing specialists, supply chain management specialists and marketing analysts.

2016 U.S. Fashion Industry Benchmarking Study Released

The 2018 U.S. Fashion Industry Benchmarking Study is now available
usfia 2016 cover_Page_1

The report can be downloaded from HERE

Key Findings of the study:

I. Business environment and outlook in the U.S. Fashion Industry

  • Overall, respondents remain optimistic about the five-year outlook for the U.S. fashion industry. “Market competition in the United States” is ranked the top business challenge this year, which, for the first time since 2014, exceeds the concerns about “increasing production or sourcing cost.”

II. Sourcing practices in the U.S. fashion industry

  • U.S. fashion companies are more actively seeking alternatives to “Made in China” in 2016, but China’s position as the No.1 sourcing destination seems unlikely to change anytime soon. Meanwhile, sourcing from Vietnam and Bangladesh may continue to grow over the next two years, but at a slower pace.
  • U.S. fashion companies continue to expand their global reach and maintain truly global supply chains. Respondents’ sourcing bases continue to expand, and more countries are considered potential sourcing destinations. However, some companies plan to consolidate their sourcing bases in the next two years to strengthen key supplier relationships and improve efficiency.
  • Today, ethical sourcing and sustainability are given more weight in U.S. fashion companies’ sourcing decisions. Respondents also see unmet compliance (factory, social and/or environmental) standards as the top supply chain risk.

III. Trade policy and the U.S. fashion industry

  • Overall, U.S. fashion companies are very excited about the conclusion of the Trans-Pacific Partnership (TPP) negotiations and they look forward to exploring the benefits after TPP’s implementation.
  • Thanks to the 10-year extension of the African Growth and Opportunity Act (AGOA), U.S. fashion companies have shown more interest in sourcing from the region. In particular, most respondents see the “third-country fabric” provision a critical necessity for their company to source in the AGOA region.
  • Free trade agreements (FTAs) and trade preference programs remain underutilized in 2016 and several FTAs, including NAFTA and CAFTA-DR, are utilized even less than in previous years. U.S. fashion companies also call for further removal of trade barriers, including restrictive rules of origin and remaining high tariffs.

The benchmarking study was conducted between March 2016 and April 2016 based on a survey of 30 executives from leading U.S. fashion and apparel brands, retailers, importers, and wholesalers. In terms of business size, 92 percent of respondents report having more than 500 employees in their companies, while 84 percent of respondents report having more than 1,000 employees, suggesting that the findings well reflect the views of the most influential players in the U.S. fashion industry.

For the benchmarking studies in 2014 and 2015, please visit: https://www.usfashionindustry.com/resources/industry-benchmarking-study

China’s Position as the No.1 Textile and Apparel Sourcing Destination Remains Unshakable

china

China as the top textile and apparel sourcing destination for U.S. companies remains “unshakable”, according to product level data from the Office of Textiles and Apparel (OTEXA) under the U.S. Department of Commerce.  Specifically, based on the import value in 2015:

  • Of the total 11 categories of yarns, China was the top supplier for 3 categories (27.3%)
  • Of the total 34 categories of fabrics, China was the top supplier for 23 categories (67.6%)
  • Of the total 106 categories of apparel, China was the top supplier for 95 categories (89.6%)
  • Of the total 16 categories of made-up textiles, China was the top supplier for 12 categories (75.0%)

In comparison, Vietnam, the second largest textile and apparel supplier to the United States, was the top supplier for only four categories of apparel (3.8% of the total 106 categories).

china market share

For many textile and apparel products, China not only is the largest supplier, but also holds a lion’s market share. Specifically, for those textile and apparel product categories that China was the top supplier in 2015 (by value):

  • China’s average market share reached 20.7% for yarns, 2.3 percentage points higher than the 2nd top supplier
  • China’s average market share reached 42.0% for fabrics, 25 percentage points higher than the 2nd top supplier
  • China’s average market share reached 52.7% for apparel, 37.2 percentage points higher than the 2nd top supplier
  • China’s average market share reached 56.8% for made-up textiles, 42.7 percentage points higher than the 2nd top supplier

by Sheng Lu

International Trade Supports Textile and Apparel “Made in USA”

International trade plays a critical role supporting textile and apparel (T&A) “Made in USA”, according to latest firm-level data from the Office of Textiles and Apparel (OTEXA) under the U.S. Department of Commerce.

imported input

First and formost, textile and apparel “Made in USA” today contain imported components. Data collected from the OTEXA “Made in USA” Sourcing database shows that using imported inputs such as cut parts, fabrics, accessories and trims is a very common practice among the total 122 companies which claim making either yarn, fabric, home textiles, technical textiles or apparel in the United States. Particularly, more than 76% of companies which make apparel in the United States say they use imported inputs, followed by companies which make technical textiles (52%) and fabrics (46%). Moreover, the lack of sufficient supply of locally made fabrics is the top reason why U.S. T&A companies use imports as alternatives.

The supportive role played by imports to T&A “Made in USA” also explains why the U.S. T&A industry is in favor of the passage of the American Manufacturing Competitiveness Act 2016 (Miscellaneous Tariff Bill, MTB). The Bill, which passed by the U.S. Congress in May, will eliminate or reduce hundreds of import duties on textile raw materials and intermediate products that are not produced or available domestically in the United States.

us companies export

On the other hand, export promotes “Made in USA” textiles and apparel as well. Data from the OTEXA “Made in USA” sourcing database shows that as many as 88.9% of U.S.-based yarn manufacturers, 82.9% of technical textile manufacturers, 75% of fabrics manufacturers and 76% of home textile manufacturers currently export and sell their products overseas.

For more detailed data and analysis, please stay tuned…

Sheng Lu

FASH455 Exclusive Interview with Julia K. Hughes, President of the United States Fashion Industry Association

logo-1138967853headshot_USFIA-hughes_300x300px

Julia K. Hughes is President of the United States Fashion Industry Association (USFIA), which represents textile and apparel brands, retailers, importers, and wholesalers based in the United States and doing business globally. Founded in 1989 as the United States Association of Importers of Textiles & Apparel with the goal of eliminating the global apparel quota system, USFIA now works to eliminate tariff and non-tariff barriers that impede the industry’s ability to trade freely and create economic opportunities in the United States and abroad. Ms. Hughes represents the fashion industry in front of the U.S. government and international governments and stakeholders.

Ms. Hughes has testified before Congress and the Executive Branch on textile trade issues. She is recognized as an expert in textile and apparel issues and frequently speaks at international conferences including the Apparel Sourcing Show, MAGIC, Foreign Service Institute, National Association of Manufacturers, Cotton Sourcing Summit, International Textiles and Clothing Bureau, Young Presidents’ Organization, World Trade Organization Beijing International Forum, and others.

Ms. Hughes served as the first President of the Organization of Women in International Trade (OWIT) and is one of the founders of the Washington Chapter of Women in International Trade (WIIT) and WIIT Charitable Trust. In 1992, she received the Outstanding Woman in International Trade award and in 2008, the WIIT Lifetime Achievement Award.

Ms. Hughes has an M.A. in International Studies from the Johns Hopkins School of Advanced International Studies and a B.S. in Foreign Service from Georgetown University.

Special thanks to Samantha Sault, Vice President of Communication for the U.S. Fashion Industry Association for facilitating and supporting this exclusive interview. Ms. Sault is responsible for the development and execution of the association’s communications strategy, including public relations, policy research and messaging, and social media. Prior to joining the association, Ms. Sault honed her communications expertise at DCI Group, a global public affairs communications firm headquartered in Washington, D.C. Previously, she worked in media as a web editor and fact checker at The Weekly Standard and an editorial assistant at Policy Review, the journal of the Hoover Institution. She began her career in the apparel industry at 17 at abercrombie kids in Bethesda, Maryland.

Interview Part

Sheng Lu: Our students are interested in knowing who the members of the U.S. Fashion Industry Association (USFIA) are. Can you name a few of your member companies?

Julia Hughes: Our members range from major global brands and fast-fashion retailers, to small importers and wholesalers. While all of our members must be doing business in the United States, our membership roster also includes some international companies with a retail presence in the United States. Some of our most actively engaged members include iconic brands and retailers like Ralph Lauren, Macy’s, Levi Strauss & Co., JCPenney, Urban Outfitters, PVH Corp., and American Eagle Outfitters. We also represent small and medium-size importers, wholesalers, and manufacturers that you might not know by name, but supply to many of your favorite brands and retailers—companies like Michar, MGF Sourcing, and Golden Touch Imports, to name a few.

Sheng Lu: The USFIA is an advocate for trade liberalization and removal of trade barriers. Can you talk with us about the benefits of free trade, especially for the fashion industry both in the United States and globally?

Julia Hughes: As you know, USFIA was originally founded in 1989 (then known as the United States Association of Importers of Textiles and Apparel) with the mission to eliminate the global quota system. We were successful! But of course, as you also know, that work is not over. The quotas may have gone away, but there still are import barriers that are unique to the apparel industry. USFIA member companies continue to face some of the United States’ highest tariffs. Textiles and apparel, combined with footwear, still account for some of the highest peaks in the U.S. tariff schedule, with many double-digit tariffs and a high of 32 percent.

Not only are these tariffs higher than on other products, but these tariffs also are a regressive tax. We believe it is simply wrong for a single mom to pay a 32 percent import tax for her baby’s onesies and a 16 percent tariff for her baby’s booties, while the wealthy pay a 1.2 percent tariff for their silk scarves. In total, apparel tariffs take more than $10 billion out of the pockets of hard-working Americans annually. So eliminating these tariffs would be an immediate benefit to American consumers and to American families.

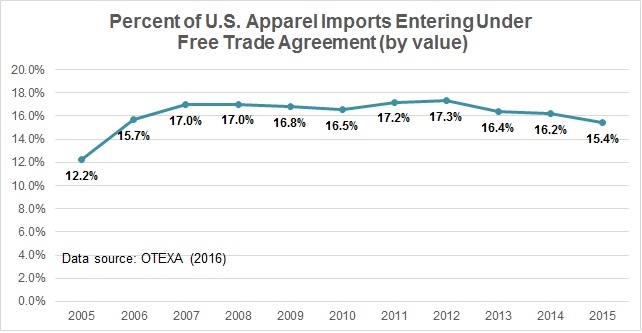
But even removing these tariffs would not mean that there is “free trade.” For example, the fact that the United States maintains these peak textile and apparel tariffs creates problems for new policy initiatives to expand export markets for U.S. products. Market access for American brands and exports is hindered by prohibitively high tariffs in attractive third country markets such as India and Brazil. Our own peak tariffs only encourage other governments to maintain their own high apparel and textile tariffs to “protect” their domestic industries. American brands such as Levi’s and Polo are among the most recognized brands in the world. American yarn spinners and fabric makers operate highly efficient operations that make them among the world’s most competitive producers. For all of these companies, we need every opportunity to remove barriers to trade.

There is a great opportunity to create high-paying jobs here in the United States, too. Fashion brands and retailers offer quality design, product development, logistics, sourcing, and service jobs in the United States, along with manufacturing jobs. These jobs are supported by global value chains, and will be on track to grow IF free trade agreements contain rules of origin and market access provisions that will decrease the cost of those fashion products. This would not only help the brands and retailers grow and create more jobs, but also help consumers by providing access to affordable, high quality apparel.

Finally, free trade isn’t just about tariffs – but also non-tariff barriers like regulations, certifications, and testing requirements all represent non-tariff barriers to trade. And since today’s global brands are selling everywhere from the United States to the UK to Japan to Dubai, we are working to eliminate these barriers, too.

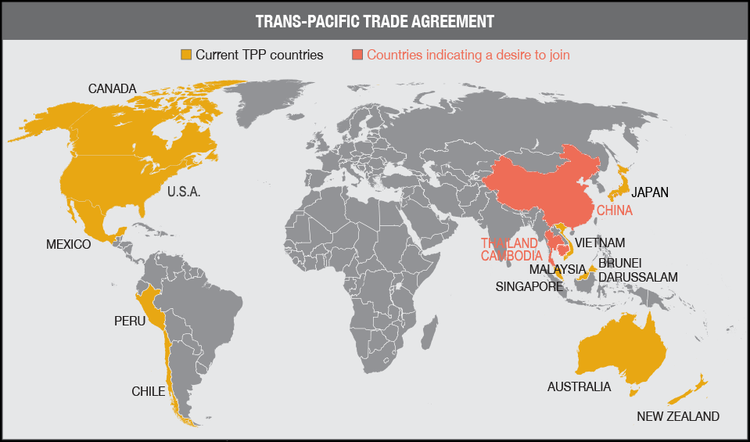
Sheng Lu: The Trans-Pacific Partnership (TPP) is a buzzword for the fashion industry, with Vietnam and China at the core of the discussion. Many people see Vietnam as an alternative sourcing destination to China for labor-intensive apparel and footwear products. You’ve visited both Vietnam and China recently. What’s your first-hand observation? How competitive is “Made in Vietnam” compared with “Made in China”?

Julia Hughes: The TPP is a top priority for USFIA and for our member companies. But unlike some, we do not see the TPP as creating an either/or scenario for sourcing apparel and footwear. China remains the top supplier to the U.S. market, and we do not see that changing any time soon. The breadth of manufacturing operations in China, combined with the state-of-the-art infrastructure and logistics operations, mean that sourcing executives are comfortable with placing orders and knowing that they will get the quality product that they want delivered on time.

However, you are correct that Vietnam is seen as an alternative sourcing destination.—not just by U.S. sourcing executives, but also for Chinese companies. Both the TPP and the EU-Vietnam Free Trade Agreement make Vietnam an especially attractive destination for making apparel and for investments in manufacturing yarns and fabrics. But Vietnam is not necessarily the destination for companies searching for lower prices.

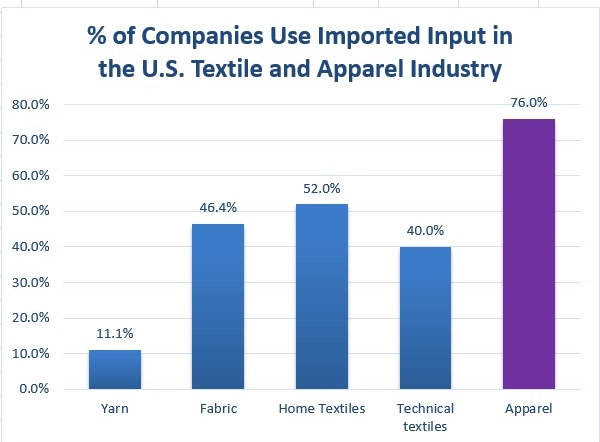
Sheng Lu: In the 2015 USFIA Benchmarking Study, around one-third of respondents report sourcing from 6-10 different countries and another one-third report sourcing from 11-20 different countries. What are some of the reasons that U.S. fashion companies today would choose to have such a diversified sourcing base?

Julia Hughes: There are a couple reasons why companies have such diversified sourcing bases. First, it is a holdover from the quota era, because companies were pretty much forced to diversify their sourcing since they couldn’t import everything from China. Following the elimination of the quotas in 2005, companies had cultivated trusted suppliers all over the world in countries as diverse as Vietnam, Sri Lanka, Mexico, and Colombia, so there was no reason to leave these good suppliers after they had spent the time and resources developing their supply chain. Second, diversification is a method of risk management. There are lots of risks that could impact your supply chain—from natural disasters to labor strife to terrorist attacks. The last thing a company wants is to have all of their production in one place—because when disaster strikes, you won’t be able to get your product to your customers. By keeping a diverse supply chain, you can ensure that you’ll always have products moving to the shelves. Finally, different countries have different specialties—and truthfully, no one country can do it all. Companies don’t necessarily prefer to source fabric, yarn, zippers, and buttons from four different countries and ship to a fifth for cutting and sewing, but sometimes, that’s the way it must be done in order to produce the best product at the best price for your target customer.

Sheng Lu: We know that the African Growth and Opportunity Act (AGOA) has been extended for another 10 years. How has the U.S. fashion industry reacted to the AGOA extension? Are U.S. consumers going to see more “Made in Africa” apparel in the retail stores?

Julia Hughes: USFIA member companies are definitely looking at sourcing opportunities in Africa after the extension of AGOA. Today a little more than 1 percent of U.S. apparel imports come from Sub-Saharan Africa—and there are only a few countries that ship apparel to the U.S. market. Kenya, Lesotho, Mauritius, and Madagascar are the major producers of apparel today – representing 87% of the U.S. imports. The ten-year extension of AGOA is allowing companies to take a fresh look at what is available to source in Africa today, as well as to plan to long-term growth. Both PVH and VF, for example, have been very public about their commitment to develop a vertically integrated industry in Ethiopia.

What is exciting is that new sourcing supply chains are opening up in Africa. While the level of U.S. imports remains low there are some growing suppliers. For example, during March 2016–a month when the overall U.S. apparel imports plunged by -21 percent compared to March 2015—there were a few Sub-Saharan African suppliers that bucked the trend. U.S. imports from Madagascar jumped by 160 percent, from Ethiopia by 83 percent, and from Ghana by 371 percent!

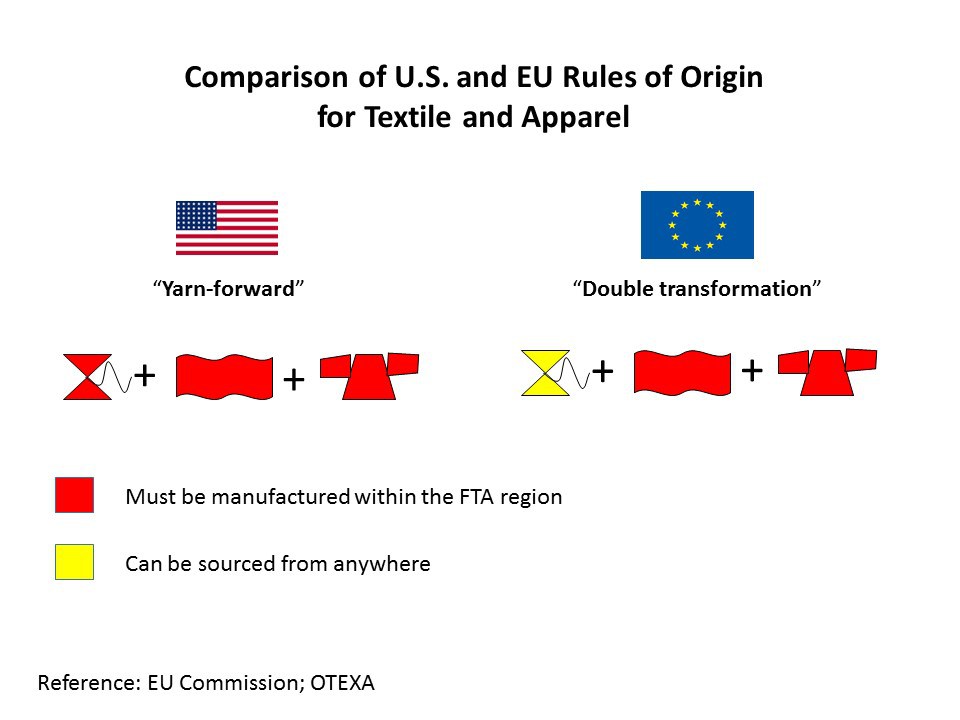
Sheng Lu: Textile and apparel trade policy is always one of the most challenging topics for students in FASH455. Many students wonder why the rules governing the global textile and apparel trade are always far more complicated than most other sectors. For example, in the past, students had to learn about the quota system, from the Short-term Arrangement (STA) to the Multi-Fiber Arrangement (MFA). The quota system is gone, but it seems students now have to know even more “terms”: the yarn-forward rules of origin, short supply list, third country fabric provision, trade preference level (TPL) and earned import allowance… What makes the textile and apparel trade so unique in terms of trade regulations?

Julia Hughes: This is a great question–and one that does not have an easy answer. Absolutely, when I first started working with the industry, it was a revelation to understand about quotas and labeling requirements classification issues. Today, the industry is even more complicated. I think that a lot of the complexity today is due to protectionism. Negotiators looked for ways to limit the market opening impact of trade agreements, and to try to protect their domestic industry. This isn’t just an issue for the United States.  Starting with NAFTA in the 1990’s, the rules are more complicated in every free trade agreement—and none of the free trade agreements exactly matches the others. But the complexity isn’t just for FTAs, of course. Today, we also face more regulations, different labeling requirements for different countries (and unfortunately sometimes even different labels are required in different states!), and more testing and certification requirements.

Sheng Lu: Looking ahead in 2016, what important sourcing trends and trade patterns shall we expect in the U.S. fashion industry? What are the policy priorities for the USFIA this year?

Julia Hughes: The implementation of the Trans-Pacific Partnership (TPP) remains at the top of our list of policy priorities. But implementation is still a long way off, especially since the U.S. Congress is unlikely to vote on the agreement before the November elections. We don’t expect to see a huge shift to sourcing in Vietnam, Malaysia, and the other TPP partners in 2016-2017, since duty-free treatment is a long way off, but we do expect to see companies taking a closer look at opportunities there—and it helps that Vietnam is already the #2 supplier to the United States, so many companies are already sourcing there. We’re also prioritizing completion of the Transatlantic Trade & Investment Partnership (T-TIP) between the United States and European Union. The EU is a great source for luxury brands and companies manufacturing leather goods, but this agreement has an even greater potential in terms of regulatory harmonization, making it easier for many of our members to break into the retail markets in Europe. We’re also focused on enhancing the African Growth & Opportunity Act (AGOA), cumulation of free trade agreements, and customs and ethical sourcing issues, too. As far as future trends, we’re looking forward to seeing the results of our third-annual Fashion Industry Benchmarking Study, which will give us a lot of insight into what brands are thinking about sourcing and expansion!

Sheng Lu: Last but not least, our students wonder what makes you and your staff personally interested in the fashion industry. Particularly, through your daily work, how do you see the impact of the fashion industry in the 21st century global economy?

Julia Hughes: My path to the world of fashion is from the policy side. I was always interested in international policy and after graduating from Georgetown University and SAIS, I was fortunate to hear about an opportunity to be the Washington Representative for Associated Merchandising Corporation (AMC). It was a terrific opportunity to be engaged in policy discussions, but also to spend time with the buyers, with the sourcing teams, and also with the overseas offices and vendors to understand the impact on trade policy on the clothes we wear. Let’s face it, it is a shock to realize the way that Congressional actions, and negotiations, can determine whether a jacket is made with down, or synthetic fibers, or cotton–or maybe it is manufactured to qualify as a shirt instead of a jacket. It also is inspiring to work with industry executives who are committed to fashion as well as doing good for the global economy. Textiles and apparel has always been an industry that can be a gateway for economic development–and I have seen the positive impact by creating jobs where there were none before–as well as expanding U.S. jobs in design, product development and compliance.

Samantha Sault: I have always loved fashion—in fact, my very first job in high school was folding clothes and working the register at abercrombie kids at the mall in my hometown!—but I never thought about fashion as a career until I had been working for a few years after college. I started my career in political media in D.C., and eventually started covering the intersection of fashion and politics for various publications, including exciting events like New York Fashion Week and President Obama’s first inauguration (and the First Lady’s fabulous dresses). After five years in media and public affairs, I found my way to USFIA and the business and policy side of the fashion industry. The most inspiring part about working in fashion has been getting to know our contacts at our member companies, and seeing how committed they are not only to their brands, but also to ethical sourcing and compliance. These are not just buzzwords—I’ve learned firsthand that many of the individuals at our member companies are deeply committed to ensuring that they are doing the right thing in their supply chains from the factory floor (especially for women) to the retail store, and it has made me appreciate these brands even more than I already did.

–The End–

Why NCTO and Euratex Disagree on the Textile and Apparel Rules of Origin in T-TIP?

eu-and-us-ta-rules-of-origin1

In an April 13 press briefing, the National Council of Textile Organizations (NCTO) which represents the U.S. textile industry, insists the Trans-Atlantic Trade and Investment Partnership (T-TIP) shall adopt the so called “yarn-forward” Rules of origin (RoO). Yarn-forward (or “triple transformation”) in T-TIP means, in order to receive preferential duty treatment provided under the trade agreement, yarns used in textile production in general need to be sourced either from the US or EU.  All 14 existing free trade agreements (FTA) in the United States adopt the yarn-forward RoO.

In comparison, in its position paper released in June 2015, the European Apparel and Textile Confederation (Euratex), which represents the EU textile and apparel industry, favors a so called “fabric forward” RoO in T-TIP instead of “yarn-forward”. Fabric-forward (or “double transformation”) in T-TIP means in order to receive preferential duty treatment provided under the trade agreement, fabrics used in apparel production in general need to be sourced either from the US or EU, but yarns used in textile production can be sourced from anywhere in the world.

US

Exploring data at the 4-digit NAICS code level can find that the United States remains a leading yarn producer. Value of U.S. yarn production (NAICS 3131) even exceeded fabric production (NAICS 3132) in 2014. This means: 1) U.S. has sufficient capacity of yarn production; 2) it will be in the financial interests of the U.S. textile industry to encourage more use of U.S.-made yarns in textile production in the T-TIP region (i.e. pushing the “yarn-forward” RoO).

eu textile production
EU yarn import

However, data at the 4-digit NACE R.2 code level suggests that EU(28) was short of €5,643 million local supply of yarns (NACE C1310) for its manufacturing of fabrics (NACE C1320) in 2013 (latest statistics available). This figure well matched with the value of €4,514 million yarns that EU (28) imported from outside the region that year. Among these yarn imports (SITC 651), over half came from China (22%), Turkey (19%) and India (13%), whereas only 5% came from the United States. Should the “yarn-forward” RoO is adopted in T-TIP, EU textile and apparel manufacturers may face a shortage of yarn supply or see an increase of their sourcing & production cost at least in the short run.

Sheng Lu

TPP and the U.S. Textile and Apparel Industry: Questions from FASH455

tpp textileThe following discussion questions are proposed by students enrolled in FASH455 (Spring 2016). Please feel free to join our online discussion.

#1 Is TPP successful in terms of “creating new market access opportunities” for the U.S. textile and apparel industry? Why or why not?

#2 Should the U.S. textile industry be worried that Vietnam is quickly building its own textile industry because of TPP?

#3 Compared with the case of Vietnam in TPP, why was there little discussion on Mexico and Central American countries developing their local textile industry and becoming less reliant on textile imports from the United States in the context of NAFTA and CAFTA-DR?  

#4 If China joins the TPP, do you think they would support a “yarn-forward” rules of origin or a less restrictive one? Why?

#5 Given the grave concerns about the potential impact of TPP on the U.S. textile industry, what is the point of negotiating such a trade deal?

[Discussion is closed for this post]

Reference: TPP Chapter Summary: Textiles and Apparel

The Percent of U.S. Apparel Imports Entering under Free Trade Agreements Fell to a Record Low Level in 2015

FTA use 2015 1

Latest statistics from the Office of Textiles and Apparel (OTEXA) show that the share of U.S. apparel imports entering under free trade agreements (FTAs) fell to a record low level of only 15.4 percent in 2015. This figure was not only lower than 16.2 percent in 2014, but also was THE lowest one since 2006, despite the implementation of a few new FTAs during that period.  

FTA use 2015 2

Among the major FTAs reached by the United States, the U.S.-Bahrain has the highest utilization rate of 99.7 percent in 2015 (note: utilization rate =value of imports entering under FTA from a particular country/value of imports from a particular country), whereas a couple of FTAs whose utilization rate is below 80 percent, such as CAFTA-DR (75.8 percent), U.S.-Korea FTA (75.2 percent), U.S.-Israel FTA (65.5 percent), U.S.-Australia FTA (53.7 percent) and U.S.-Morocco FTA (34.6 percent). A low utilization rate implies that U.S. companies did not claim the preferential duty benefits while importing apparel from these FTA regions.

FTA use 2015 3   

On the other hand, CAFTA-DR and NAFTA altogether account for around 76 percent of U.S. apparel imports entering under FTAs in 2015. This result is consistent with the findings in the 2015 U.S. Fashion Industry Benchmarking Study which also finds that CAFTA-DR and NAFTA were the two most frequently utilized FTAs reported by the survey respondents.

As a result of the lower share of apparel imports entering under FTAs, the American Apparel and Footwear Association Apparelstat 2015 released this week found that the effective average U.S. apparel import duty reached 13.54 percent in 2014, which is even higher than 11.97 percent in 2001. In comparison, over the same period, the average U.S. import duty on ALL products dropped from 1.64 percent in 2001 to 1.40 percent in 2014.

by Sheng Lu

Extra-EU Trade for Textile & Apparel Went Up in 2015

EU export (2015)

EU import (2015)

According to statistics released by the European Apparel and Textile Confederation (Euratex), extra-EU trade for textile and apparel (T&A) achieved record high in 2015, suggesting a positive economic state of the industry.

Specifically, extra-EU T&A exports went up by 3.6 percent in 2015. Among the key export markets: thanks to the appreciation of U.S. dollar against Euro last year, EU’s textile and apparel exports to the United States respectively increased by 16 percent and 21 percent. Despite China’s slowed economic growth, EU’s export to China was also robust: 6 percent growth for textile and 19 percent growth for apparel. However, EU’s T&A exports to Russia (down 27 percent for textile and down 29 percent for apparel) and Ukraine (down 26 percent for apparel) sharped dropped, reflecting the substantial impact of political instability on trade.  

In terms of the import side, extra-EU T&A imports rose 9.6% in 2015. China remained the top external T&A supplier to the EU, however, other Asian countries with lower-production cost are quickly catching up. This is particularly the case for apparel: while EU’s apparel imports from China went up 6 percent in 2015, imports from Bangladesh (up 24 percent), Cambodia (up 33 percent), Vietnam (up 26 percent), Pakistan (up 25 percent) and Myanmar (up 79 percent) grew much faster, suggesting a relative decline of China’s market share in the EU market.

Made in USA: A New Reality?

Video 1: Panel discussion on “Made in USA”

Recording of a seminar on “Made in USA” hosted by the Texworld USA in January 2015. Panelists include:

  • Pete Bauman, Senior VP, Burlington Worldwide / ITG
  • Joann Kim, Director, Johnny’s Fashion Studio
  • Tricia Carey, Business Development Manager, Lenzing USA
  • Michael Penner, CEO, Peds Legwear
  • Moderator: Arthur Friedman, Senior Editor, Textiles and Trade, WWD

Video 2: Standing Still-The real story of the North Carolina textile industry

It may also be interesting to link this video with the article How a U.S. textile maker came to embrace free trade from page 3 to 9 in the reading packet.

Video 3: Panel discussion on apparel “Made in NYC”

The video is a recorded panel discussion hosted by the Texworld USA in July 2015 on the topic of apparel “Made in NYC”. Most panelists have years of experiences working in NYC as a fashion designer, including:

  • Eric Johnson, Director, Fashion & Arts Teams Center for Economic Transformation, NYC Economic Development Corporation
  • Erin Kent, Manager of Programs at The Council of Fashion Designers of America (CFDA)
  • Michelle Feinberg, NY Embroidery Studio
  • (The event was moderated by Arthur Friedman, Senior Editor, Textiles and Trade, WWD)

What’s your view on the future of textile and apparel “Made in USA”?

[Discussion is closed for this post]

Textile and Apparel Sector in the 2016 U.S. Trade Policy Agenda

2

In the recently released 2016 President’s Trade Agenda, the textile and apparel (T&A) sector was mentioned four times (up from only once in 2015*):

1.Trade enforcement

“THE OBAMA ADMINISTRATION has a record of trade enforcement victories that have helped to level the playing field for American workers, businesses, farmers, and ranchers. In 2016, we will continue to aggressively pursue a robust trade enforcement agenda, including by using new and stronger tools under the bipartisan Trade Enforcement Act of 2015 to hold our trading partners accountable.

Ongoing disputes include challenges to:

  • China’s far-reaching export subsidy program extending across sectors and dozens of sub-sectors, including textiles, industrial and agricultural products.”

2.Trade preference programs

“Haitian Hemispheric Opportunity through Partnership Encouragement Act (HOPE) pro­gram, which supports nearly $900 million in garment imports from Haiti, is an essen­tial support for Haiti’s long-term economic growth and industrial development. HOPE supports thousands of jobs in Haiti’s textile and gar­ment sectors, while providing important pro­tections to workers. Early extension of this program will provide the necessary stability and continuity for companies to continue in­vesting in Haiti’s future.”

3.Benefits of trade to the American people

“More recent trends are similar, with families steadily gaining purchasing power as the price of traded goods, such as smart phones, apparel, and toys, falls. While all households benefit, the gains from trade have predominantly benefited lower-income Americans, who spend a greater portion of their incomes on highly-traded staples like food, shoes, and clothing.”

4.Trade and labor

Our engagement has produced an Imple­mentation Plan Related to Working and Liv­ing Conditions of Workers that is helping to address concerns about workers’ rights and working conditions in Jordan’s garment sec­tor, particularly with respect to foreign work­ers. Jordan has issued new standards for dormitory inspections, submitted new labor legislation to its parliament and hired new labor inspectors. USTR and Department of Labor continue to work with Jordan on the issues under the Plan.

Overall, it seems:1) Reflecting the global nature of the sector, T&A is a topic that involves multiple trading parties for the United States; 2) Economic development and foreign aid are important elements in the U.S. trade policy for T&A. 3) Social responsibility and labor practices in the T&A sector remain a grave concern and need further improvement through international collaborations. 4) The T&A sector is involved in some topics with divisive public opinions, such as the impact of imports.

* Textile and apparel mentioned in the 2015 U.S. Trade Policy Agenda:

Our engagement has produced an Implementation Plan Related to Working and Living Conditions of Workers that is helping to address concerns about workers’ rights and working conditions in Jordan’s garment sector, particularly with respect to foreign workers. Jordan has issued new standards for dormitory inspections, submitted new labor legislation to its parliament and hired new labor inspectors.

[Discussion is closed for this post]

The Global Journey of a Marks and Spencer Wool Suit

english suit

global travel

An interesting BBC article describes the global journey of a Marks and Spencer (M&S) wool suit:

  1. The suit was designed by M&S in-house team in UK
  2. Wool that makes up the suit came from Australia
  3. Raw wool was shipped from Australia to China for topping.
  4. Wool top was shipped from China to Italy for dying
  5. Dyed wool was shipped from Italy to Romania to be spun into yarn
  6. Yarn was shipped to Yorkshire, UK to be woven into cloth
  7. Cloth was shipped from Yorkshire, UK to Cambodia to be made into finished suit
  8. Finished suit was shipped back to UK to be sold at M&S retail stores

As noted by the article, such a global-based production model for M&S’s suit is increasingly typical in UK. What makes the issue controversial, however is that, the suit is labeled as “100% British cloth”. As “defined” by M&S, “British cloth means it is woven, dyed and finished in the UK”.

Similar debates also exist in the United States. In the past, even if a garment was cut and sewn in California but made of imported items, the tag still had to say, “Made in USA of imported fabric, zippers, buttons and thread.” But a new law which takes into effect on January 1, 2016 allows California manufacturers to attach the “Made in USA” label as long as no more than 5 percent of the wholesale value of the garment is made of imported materials.

Discussion questions:

  1. What are the driving forces behind apparel companies’ global-based production model?
  2. Is the clothing label “Made in ___” outdated in the 21st century?
  3. Do you support the new law which allows apparel labeled “Made in USA” to contain certain value of imported material? Why? Do we need such a regulation at all? Why or why not?

Clothing Label Reveals the Global Nature of the Textile and Apparel Industry

Presentation1

While shopping in SoHo (NYC), Nicole Farese, a student from FASH455, found the label of a Splendid sweater reads “Made of Italian Yarn” and “Made in China”. Splendid is a casual wear store which is known for their high-quality clothing sold at a premium price.

幻灯片1幻灯片2.JPG幻灯片3.JPG

幻灯片4

Do you find any example of globalization from your clothing label or closet? Please feel free to leave your comment or send your pictures to shenglu@udel.edu (selected pictures will be shared through the blog).

Minimum Wage in the Apparel Industry Continues to Rise in Most Asian Countries in 2016

minimum wage

wageincrease.jpg

Apparel producers across Asia may face a more than 5% minimum wage increase in 2016, according to an industry source. India, Malaysia, Thailand and Pakistan may see the biggest increase of minimum wage (up more than 15%) among the leading Asian apparel producers, whereas minimum wage in Bangladesh and Philippine may remain roughly unchanged from last year.

As noted by the industry source, this year’s minimum wage increase comes from various reasons. In Cambodia, the increase is mostly pushed by local labor unions. Indonesian government raises the wage aiming to shorten the gap between minimum and living wage in under-developed regions. Additionally, countries such as India adjust their minimum wages more based on economic factors such as inflation rate, GDP growth rate and consumers’ price index.    

Data further shows that the gap in minimum wage between Asian apparel producers somehow is widening. For example, monthly minimum wage in some parts of China has reached $321 USD in 2016, which is $253 USD higher than in Bangladesh ($68 USD/month), up from $225 USD in 2015. A wide gap in minimum wage is also found within some Asian countries. For example, in Philippine, Indonesia and China, the highest minimum wage could be almost twice as high as the lowest minimum wage in the country.

Despite the increase, minimum wage in Asia remains a fraction of the level in the developed countries. For example, minimum wage in the United States was $7.5/hour in 2015, meaning a worker’s monthly minimum wage shall no less than $1,200 (assume working 40 hours/week, 4 weeks/month).

State of China’s Textile and Apparel (T&A) Industry (Updated in January 2016)

Textile-factory-in-China-007

How to deal with China as a sourcing destination remains a tough and controversial issue facing U.S. apparel retailers and fashion brands in 2016. Although companies are of grave concerns about China’s continuous rising production cost (especially labor cost), few other lower-wage countries can beat China in terms of industry integration, supply chain efficiency, and reliability.This blog post intends to add to the discussion by taking a look at the supply side, i.e. what is happening in the China textile and apparel (T&A) industry.

First, China’s production capacity remains unparalleled in the world. In 2014, the latest statistics available, textile fiber production in China exceeded 50 million tons, accounting for 54.36 percent of world share. By 2013, as much as 64.2 percent of the world’s chemical fibers, 64.1 percent of synthetic fibers and 26.2 percent of cotton were produced in China (see the table blew). On the other hand, apparel production in China reached 29.9 billion units in 2014, up 10.4 percent from 2013. Given China’s vast production capacity, very likely it will remain the top apparel sourcing destination for most EU and US fashion apparel companies for many years to come. For example, Vietnam’s apparel production in 2015 totaled 2.85 billion units, which was only around 10 percentage of China’s production scale in 2014.

1

Second, China’s T&A industry is growing slower. Specifically, output of China’s T&A industry (measured by value added) grew only 7.0 percent between 2013-2014, a significant drop from 10.3 percent between 2009-2010. Other major economic indicators in the industry, from sales revenue, net profit to investment, followed a similar pattern (see the figure below). Additionally, for the first time since the 2008 financial crisis, China’s T&A exports suffered a 3.9 percent decline in 2015 (-1.3% for textiles and -5.4% for apparel). Given the downward pressure on China’s economy and uncertainties in the world marketplace, such a slow-growth pattern is likely to continue in the years ahead.

2

investment

Third, China’s T&A industry is undergoing important structural adjustment. Within the total industry output, the ratio of apparel, home textiles and industrial textiles has turned from 51:29:20 in 2010 to 46.8: 28.6: 24.6 in 2014, reflecting China’s efforts to move towards making more value-added and technology-intensive textile products. This ratio is expected to become 40:27:33 by the end of 2020 (i.e. the end of China’s 13th five-year plan). In order to overcome the pressure of rising labor and production cost, China’s T&A manufacturing base is gradually moving from the east coast to the western and central part of the country (accounting for 22.5 percent of China’s T&A production in 2014, up from 16.8 percent in 2010; this share may further increase to 28 percent by 2020). Additionally, T&A companies in China are encouraged to increase spending on research and development (R&D), which on average had accounted for 0.47 percent of T&A companies’ sales revenue in 2013, up from 0.43 percent in 2011.

Fourth, T&A companies in China are actively seeking business opportunities in the domestic retail market. Apparel retail sales in China reached 893.6 billion yuan in 2014 (around $137.5 billion), among which 30.77 percent were sold online (up from 14.54 percent in 2011). Apparel retail price on average rose 2.6 percent between 2013-2014, compared with 2.0 percent increase of China’s overall CPI over that period. However, it shall be noted that apparel retail sales in China’s tier 1 and tier 2 cities achieved almost zero growth in 2014, partially reflecting the negative impact of retail price increase on consumers’ demand. In comparison, apparel retail sales in China’s tier 3 & 4 cities as well as rural areas remain robust and strong. Additionally, financial performance of T&A companies in China is becoming more polarized. Companies that follow the traditional business model of manufacturing and exporting are facing their most difficult time since the 2008 financial crisis. However, there are also many success stories of apparel companies that focus on function upgrading, i.e. moving from simply “manufacturing” products to “serving” the market needs.

Sheng Lu

Recommended reading: China’s 13th five-year plan for its textile and apparel industry: Key numbers

Top 10 Most Read FASH455 Blog Posts in 2015

top 10


1. Potential Impact of TPP on the Textile and Apparel Sector: A Summary of Recent Studies

2. 2014 World Textile Industry Labor Cost Comparison

3. Global Trade of Used Clothing (Updated: October 2015)

4. Market Size of the Global Textile and Apparel Industry: 2014 to 2018

5. When Will TPP Take Effect? Let’s look at the History

6. China to Become the World’s Largest Apparel Market in 2019

7. Are US Textile and Apparel Imports Using Free Trade Agreements?

8. 2015 US Fashion Industry Benchmarking Study Released

9. Exclusive Interview with Erin Ennis, Vice President, US-China Business Council

10. US Tariff Phaseout Schedule for Textile and Apparel in TPP by OTEXA Code

U.S. Department of Commerce Releases Factsheet on TPP and the U.S. Textile and Apparel Industry

textile_Page_1

According to the factsheet released by the U.S. Department of Commerce, the Trans-Pacific Partnership (TPP) will create exciting new export opportunities for the U.S. textile and apparel (T&A) industry. The report highlights Vietnam and Japan as two promising markets in TPP for certain T&A products “Made in USA”, including:

Vietnam:

  • Cotton fiber, yarn, and Cotton woven Fabric (U.S. exported $394 million in 2014 with 16% market share only after China; tariff will be cut from 12% to zero on day one)
  • Non-woven fabrics (U.S. exported $23million in 2014, up 951% from 2009; tariff will be cut from 12% to zero on day one)

Japan

  • Synthetic fiber, yarn, and fabric (U.S. exported $61 million in 2014, up 61% from 2009; tariff will be cut from 2.7%-10% to zero on day one)
  • Industrial and advanced textile fabrics (U.S. exported $91 million in 2014, the fourth largest supplier after China, Taiwan, South Korea; tariff will be cut from 8.2% to zero on day one)
  • Men’s and boy’s apparel (U.S. exported $32.6milion in 2014, up 30.9% from 2009; tariff will be cut from 9.8% to zero on day one)

The factsheet also argues that TPP is a “balanced” deal for the U.S. T&A industry: long U.S. tariff phaseout schedule, strict “yarn-forward” rules of origin and textile safeguard mechanism in TPP will serve the interests of those stakeholders that seek protection of U.S. domestic T&A manufacturing, whereas duty savings from import tariff cut and the short supply list will create greater market access opportunities for U.S. fashion brands and retailers.

According to the report, the United States is the fourth largest textile exporter in the world. 54% of total U.S. T&A exports went to TPP markets in 2014. The United States is also the single largest importer of T&A in the world. 372,300 T&A manufacturing jobs remained in the United States in 2014.

Potential Impact of the Trans-Atlantic Trade and Investment Partnership (T-TIP) on Related Textile and Apparel Trade Flows

The presentation was delivered at the 2015 International Textile and Apparel Association (ITAA) Conference in Santa Fe, New Mexico on November 13, 2015. Welcome for any suggestions and feedback.

USTR Michael Froman Comments on the Textile and Apparel Chapter under TPP

Trans-Pacific-Partnership-1

In an event hosted by the Council on Foreign Relations on October 15, 2015, U.S. Trade Reprehensive Michael Froman left a comment on the textile and apparel chapter (T&A) under TPP. He said that:”

“You know, we worked very hard to find solutions that could address the broad range of stakeholder interests here, even when we had conflicting interests here in the U.S. I’ll take textile as an example. You know, we have a domestic textiles industry that’s been investing in more production in the U.S., growing their employment in the U.S. And obviously we have a strong sector of our economy that brings in apparel from other countries, apparel importers and retailers. We worked very closely with both groups of stakeholders to come up with a solution, to come up with an outcome that we think both will be comfortable with and both will be supportive of. And that’s been very important to us to try and address the broad range of U.S. stakeholder interests, whether it’s labor, environment, importers, exporters, to make sure we’re covering everybody’s interests well.”

In the remarks, Forman also ruled out the possibility that TPP would be renegotiated. He said that:

“So this isn’t one of those agreements where, you know, you can, you know, reopen an issue or renegotiate a provision. This is one where, you know, every issue is tied to every other issue and every country’s outcome is balanced against every other country’s outcome. And so that’s the agreement that we’ll be putting forward under TPA for a vote by Congress.”

According to Inside U.S. Trade (October 9, 2015), the final TPP reflects some of the key priorities of the U.S. textile industry by allowing limited exceptions from the prevailing yarn-forward rules of origin and by including tariff phaseouts for “sensitive apparel items” of 10 to 12 years.

Besides the basket of goods that will become duty-free upon entry into force (which include cotton shirts and cotton sweaters), TPP sets up three other categories for tariff reductions on apparel:

TPP apparel

Major exceptions other than the “short supply list” mechanism under TPP include:

  • An “earned import allowance program for cotton pants made in Vietnam from third-country fabric by importing a specified amount of U.S. cotton pants fabric. This would allow cotton pants from Vietnam would enter the U.S. duty-free as soon as the agreement is implemented. It is said the ratio for the program is “close” to 1:1. However, for men’s cotton pants, there could be a 15 million square meter equivalents (SMEs) annual cap until year 10, after which it will increase to 20 million. There is no quantitative limit for the other types of cotton pants that can be shipped under the program, such as women’s, girls’ and boys’ pants.
  • A limited list of cut-and-sew items that Vietnam and other TPP countries can ship to the U.S. under the preferential TPP duty rate. These include synthetic baby clothes, travel goods including handbags, and bras.

Potential Impact of TPP on the Textile and Apparel Sector: A Summary of Recent Studies

Screenshot 2015-10-06 08.13.16

(Picture credit: Lu, S. (2015) Does Japan’s accession to the Trans-Pacific Partnership mean an opportunity or a threat to the U.S. textile industry? A quantitative evaluation, Journal of the Textile Institute, 106(5), 536-549.)

With the conclusion of the Trans-Pacific Partnership (TPP) negotiation on Oct 5, 2015, it is time to think about its potential impact. Specifically for the textile and apparel (T&A) industry, the followings studies may offer some hints (to read more, you can click each title):

Trade Statistics

Statistics show the 12 TPP partners altogether imported $65 billion worth of textiles and $154 billion worth of apparel in 2013, which accounted for a world import share of 20 percent and 32 percent, respectively (WTO, 2015). In 2014, around 55 percent of U.S. textile and apparel exports (or $13.3 billion) went to the other 11 TPP partners, and 17 percent of U.S. textile and apparel imports (or $17.8 billion) came from the TPP region (OTEXA, 2015).

Impact of TPP on U.S. Textile and Apparel Manufacturing: A Preliminary Estimation

TPP overall will have a negative impact on U.S. domestic textile and apparel manufacturing. In all simulated scenarios, the annual manufacturing output in the United States will decline by $846 million–$3,780 million for textile and $1,154 million–$1,828 million for apparel than otherwise.

2.The “yarn-forward” rule may not substantially benefit U.S. domestic textile and apparel manufacturing as some people had suggested, for two reasons: 1) results show that Vietnam is more likely to use Japanese textiles than U.S. textiles when yarn-forward rule is in place. 2) U.S. apparel imports from Vietnam directly compete with those imported from NAFTA and CAFTA regions, the largest export market for U.S.-made yarns and fabrics. When NAFTA and CAFTA’s market share in the U.S. apparel import market is taken away by Vietnam, U.S. textile exports to NAFTA and CAFTA will decline anyway, regardless of whether Vietnam uses U.S.-made textiles.

3.Results suggest that compared with the “yarn-forward” rule, development of Vietnam’s local textile industry will have an even larger impact on the future of U.S. domestic textile and apparel manufacturing. Particularly, when Vietnam becomes more capable of making textile inputs by its own, not only Vietnam’s overall demand for imported textiles will decline, but also Vietnam’s apparel exports will become even more price-competitive in the U.S. as well as the world marketplace.

“Import Sensitive” Clothing and the TPP X-basket : What might include

1

Based on examining three recent trade programs, including: U.S. International Trade Commission (USITC) monitoring program on T&A imports from China based on the U.S.-China Textile Memorandum of Understanding (MOU) (2008—present), Office of Textiles and Apparel (OTEXA) monitoring program on U.S. T&A imports from Vietnam (2007-2008) and U.S. textile safeguard measures against China (2003-2005), it seems “import sensitive” T&A in the United States mostly refer to cotton and man-made fiber apparel and fabrics. OTEXA product Code 338, 339, 340, 345, 347, 348, 352, 447, 638, 639, 640, 645, 646, 647, 648 and 652 are most likely to be included in the TPP X-basket.

Because Vietnam’s T&A exports to the United States heavily concentrate on these “import sensitive” T&A categories, the X-basket has the potential to substantially affect the actual trade liberalization that can be enjoyed by the T&A sector under TPP:

  • By the most conservative estimation, i.e. the X-basket only covers Category A “import sensitive” apparel products, it will affect about 41.6 percent of U.S. apparel imports from Vietnam (or 38.7 percent of total U.S. T&A imports from Vietnam) if trade pattern remains the same as in 2014.
  • In the worst case, i.e. the X-basket covers all “import sensitive” T&A products identified by this study, it will affect about 70.0 percent of total U.S. T&A imports from Vietnam, if trade patterns remains the same as in 2014.

2015 US Fashion Industry Benchmarking Study

3

The survey results show that TPP matters for the U.S. fashion industry, with as many as 79 percent of respondents saying implementation of the agreement will impact their business practices. Specifically:

  • 72 percent expect to source more textiles and apparel from TPP partners, suggesting the imminent impact of TPP for the U.S. fashion industry could be trade creation.
  • Fewer than 10 percent expect to source less from non-TPP members after the implementation of the agreement, suggesting the trade diversion effect of TPP could be limited.
  • 48 percent expect to strategically adjust or redesign their supply chain based on TPP, implying TPP could be a game changer and has the potential to shape new patterns of textile and apparel trade in the Asia-Pacific region in the long term.
  • However, as few as 7 percent expect to export more products to TPP partners, while only 10 percent expect to invest more in TPP partners (building factories, operating retail stores and e-commerce operations) after implementation of the agreement. It seems the U.S. fashion industry hasn’t focused much on TPP’s potential to promote exports and achieve greater market access.
  • Additionally, 45 percent say the TPP Short-Supply List should be expanded, and comments indicate the proposed “yarn-forward” Rule of Origin is a major hurdle to the industry realizing real benefits from the agreement. In fact, as many as 83 percent support or strongly support abandoning the strict “yarn-forward” Rule of Origin and adopting a more flexible one in future FTAs (Figure 21). This suggests that the benefit of TPP for the U.S. fashion industry and the utilization of the agreement will largely depend on the Rule of Origin. In particular, there is a strong call among U.S. fashion companies to make the textile and apparel Rule of Origin less restrictive and more flexible in TPP.

Why does the US Textile Industry Want Yan-forward Rule of Origin (RoO) in TPP?

The US textile industry insists yarn-forward RoO in TPP is not because they expect a substantial increase of textile exports to Vietnam as the case of NAFTA and CAFTA which help capture the export markets in Mexico and Central America. But rather it is because:

1) Without yarn-forward, situation will get even worse. Particularly, a less restrictive RoO will make Vietnam’s apparel exports which contain textiles made in China, Taiwan or South Korea qualified for duty free access to the US market. Definitely this will be a more imminent and bigger threat to the US textile industry than simply facing competition from Vietnam’s apparel which contains Japanese made textiles. And still many US textile companies don’t treat the Japanese textile industry very seriously, although I think they should. Remember, Japan currently is the fourth largest textile supplier to Vietnam and the NO.1 textile supplier to China.

2) With yarn-forward RoO in place, at least US textile companies can invest in Vietnam (remember, globalization is about movement of capital as well. Many apparel companies in Mexico and Central America actually are invested by US companies). Without yarn-forward RoO however, Vietnam can simply rely on imported textiles as the case mentioned in (1) and there will be no incentive for US textile companies to move factories to Vietnam (meaning, capital holders will lose).

So overall yarn-forward RoO may win a few more years for the US textile industry. But in the long run, it is my view that the US textile production and its exports to the Western Hemisphere countries may still inevitably decline (especially those output to be used for apparel assembly purposes) after the implementation of TPP. In the 21st century, the nature of competition is supply chain v.s. supply chain.

Regional Production-Trade Network Remains an Important Feature of Global Textile and Apparel Trade

Regional production-trade network (RPTN) refers to a vertical industry collaboration system between countries that are geographically close to each other. Within a RPTN, each country specialized in certain portions of supply chain activities based on its respective comparative advantages so as to maximize the efficiency of the whole supply chain.

There are three major textile and apparel (T&A) RPTNs in the world today:

  • Asia: more economically advanced countries/regions such as Japan, South Korea, Taiwan, Hong Kong and China supply textiles to the less economically developed countries such as Vietnam, Bangladesh and Sri Lanka for apparel manufacturing, where the wage level was much lower. On the other hand, Japan is a leading apparel importer and consumption market in Asia.
  • Europe: among EU members, textile inputs can be supplied by developed countries in Southern and Western Europe such as Italy and Germany. In terms of apparel manufacturing in the European Union, low and medium-priced products can be undertaken by developing countries in Southern and Eastern Europe such as Poland and Romania, whereas high-end luxury products can be produced by Southern and Western European countries such as Italy and France. Furthermore, finished apparel can be shipped to developed EU members such as UK, Germany, France and Italy.
  • America: within the region, the United States as a developed country supplies textile materials to developing countries in North, Central and South America (such as Mexico and countries in the Caribbean region), which assemble imported textiles into apparel by taking advantage of the local low labor cost. The finished apparel articles are eventually exported to the United States for consumption.

Latest data from the World Trade Organization (WTO) shows that RPTN in the above three regions remain an important feature of today’s global T&A trade as the graphs shown below:

123

4

(Note: Data comes from the World Trade Organization)

Particularly, three specific trade flows are worth watching:

One is Asian countries’ growing dependence on textile supply from within the region, which rose to 90.2% in 2014 from 87.7% in 2000. This is a reflection of a growing integrated T&A supply-chain in Asia. As a result, apparel “Made in Asia” is becoming even more price-competitive in the world marketplace today and this has posted pressures on the operation of the T&A RPTNs in EU and America.

Second one is the stable intra-region trade pattern both for textile and apparel in EU. In 2014, 58.8% of EU’s (28 members) textile imports and 46.2% of apparel imports came from other EU members; at the same time, 68.8% of EU’s (28 members) textile exports and 74.7% of apparel exports also went to other EU members.

Additionally, developing countries in North, Central and South America still heavily rely on regional supply of textile inputs; at the same time, their finished apparel are also mostly consumed within the region. Data show that 80.3% of American countries’ textile imports still came from within the region in 2014; at the same time, 88.9% of American countries’ apparel exports were also shipped to the region, mostly the United States and Canada as the final consumption market.

Sheng Lu

Global Trade of Used Clothing (Updated: October 2015)

Please also check the updated study: Why is the used clothing trade such a hot-button issue?

2

3

GlobalMapUSedClothing

United States

  • Generates 1.4 million tons of used clothing annually
  • Exports 800,000 tons of used clothing annually
  • 20% of used clothing sold domestically in thrift stores
  • Non-wearable material of used clothing is reprocessed into fibers for upholstery, insulation, soundproofing, carpet padding, building and other materials.

 Central and South America

  • Very large used clothing market in most countries
  • Imports of used clothing mostly come from the United States
  • Cotton wipers made from used clothing are exported back to the United States

Europe

  • Generates 1.5-2 million tons of used clothing annually
  • Large used clothing sorting centers located in Western and Eastern Europe
  • 10-12% used clothing (only those top quality) sold in local secondhand shops

Africa

  • One of the largest used clothing markets in the world
  • 80% of population wear secondhand clothes
  • Most used clothing imported from the United States, Europe, India and Pakistan

East Asia

  • Most used clothing is collected in Japan, South Korea and Taiwan
  • Countries in the region also import used clothing from the United States, Europe, India and Pakistan
  • Some large used clothing sorting centers are located in Malaysia and Philippines.

India and Pakistan

  • Residual used clothing are imported and sorted by grading companies
  • Wearable used clothing is extracted from “mixed rags” and sold locally or shipped to Africa
  • Recycled yarns are used to make new sweaters
  • Cotton wipers made from used clothing are exported to the United States

Australia

  • Used clothing is collected and sold through local shops and exported

Source: Planet Aid (http://www.planetaid.org); UNComtrade (2015)

2015 US Fashion Industry Benchmarking Study Released

[Note: The 2016 U.S. Fashion Industry Benchmarking Study has been released]

UntitledThe U.S. Fashion Industry Association (USFIA) released its 2015 benchmarking study today. The report examines the industry’s business environment and outlook, sourcing practices as well as U.S. fashion companies’ viewpoints on critical trade policy agendas. Among the key findings:

  • Overall, respondents remain optimistic about the five-year outlook for the U.S. fashion industry. Like last year, they are most concerned about increasing production or sourcing costs, but they expect increases to be more modest this year.
  • Consistent with our 2014 findings, U.S. fashion companies are NOT moving away from China, and Bangladesh remains a popular sourcing destination with high growth potential, though not quite as high as last year.
  • Companies continue to diversify their sourcing, though free trade agreements (FTAs) and preference programs remain underutilized.
  • The U.S. fashion industry is a critical Trans-Pacific Partnership (TPP) stakeholder, as close to 80 percent of respondents expect implementation will impact their business practices. However, the restrictive rules in the agreement limit the potential.
  • U.S. fashion companies continue to express interest in expanding sourcing in the United States in the next two years as they further diversify their sourcing. However, there is no evidence that companies are shifting their business models back to manufacturing.

This benchmarking study was based on a survey of 30 executives at the leading U.S. fashion companies from March 2015 to April 2015. The findings well reflect the views of the most influential players in the U.S. fashion industry, with 90 percent of respondents having more than 100 employees (including 60 percent with more than 1,000 employees).

The full report can be downloaded from HERE.

TPP Textile Negotiation Updates (March 2015)

trans-pacific-trade-agreement_issuebanner

According to Inside US Trade, negotiators continued their work on the technical details of the textile chapter under the Trans-Pacific Partnership (TPP) during the latest round of negotiation in Hawaii. Although progress has been achieved, key issues remain unsolved.   Exceptions to Yarn-Forward Rule of Origin Since the 807A program under the Caribbean Basin Imitative (CBI) enacted in 1998, the so called “yarn-forward” rule of origin has been adopted in almost all free trade agreement (FTA) and trade preference program (TPA) reached between the United States and its trading partners. “Yarn forward” rule requires that each step of apparel production from spinning of the yarn must take place in one of the FTA countries. At the same time, FTA/TPA often adopt exceptions in addition to “yarn-forward” rule so as to provide flexibility to importers, especially in the case when certain textile and apparel products are not available in commercial quantities from the FTA/TPA region. It is almost certain at this point that TPP will continue to adopt the “yarn forward” rules of origin. However, what kind of exceptions to the yarn forward rule will be allowed in TPP remain unclear: 1) How long will be the “short supply” list in TPP? Short supply list is a mechanism which allows fibers, yarns, and fabrics determined not to be available in commercial quantities in a timely manner from within the FTA partner countries to be sourced from outside the countries for use in qualifying textile and apparel products. According to Inside US Trade, some TPP countries want to declare the short-supply list complete as soon as possible so that they can shift the discussion to other possible exceptions to the yarn-forward rule. However, others doubt that the U.S. would be willing to contemplate additional exceptions and therefore believe that the best approach is to keep the short-supply list open and try to add as many products as possible. 2) Whether there will be other exception mechanisms in TPP in addition to the “short supply” list? According to Inside US Trade, there were some discussions on creating a separate mechanism such as the tariff-preference levels (TPL) in TPP. TPL allows for a certain quantity of textile and apparel goods (usually yarns, fabrics and cut pieces) from a third-country (a country who is not a party to the agreement) to qualify for the FTA benefits. Additionally, it is more than just Vietnam that is seeking more exceptions to the “yarn forward” rule in TPP. For example, Australia and New Zealand are also doing so, which may be in large part for tactical reasons — essentially holding up the textile talks as leverage to secure acceptable outcomes in other areas that are more important to them, for instance, agricultural market access or intellectual property. Tariff Phrase-out Mechanism Inside US Trade says that U.S. is sticking to the framework that it laid out in its initial tariff offer, which put products into three categories subject to different phrase-out schedule:

  • X-basket, which covers the most sensitive products that would be subject to an initial cut upon entry into force, but then remain in place until they are eliminated in the tenth year for knit apparel and fifteenth year for woven apparel
  • B-basket, which consists of slightly more sensitive apparel items that would be subject to a linear tariff phase-out over five years
  • A-basket, which consists of least sensitive items whose tariff rate would go to zero immediately upon TPP entries into force

Key questions remain as to which items the United States will place into what basket. Other issues in the textile chapter The TPP textile chapter may also include languages on the following two issues: 1) a special safeguard mechanism under which the importing country can raise tariffs up to the most-favored nation (MFN) level in the case of an import surge; 2) customs language on the inspection mechanism.

%d bloggers like this: