
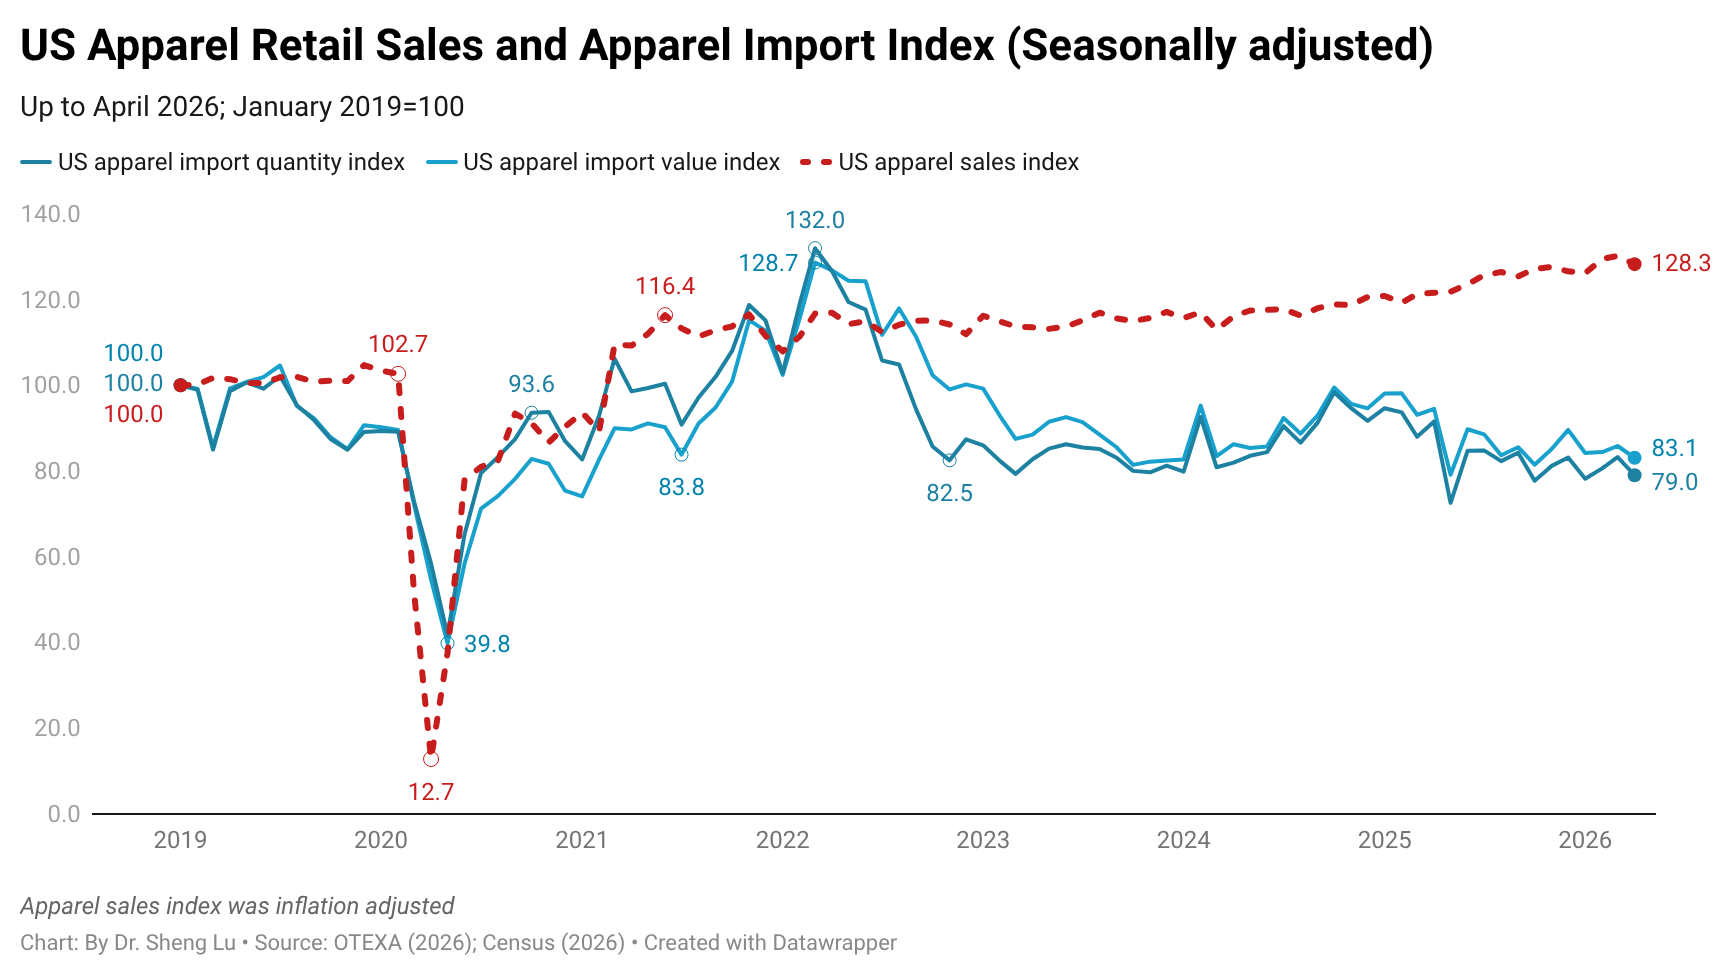
First, U.S. apparel imports continued to shrink in April 2026, reflecting consumers’ hesitation to spend on clothing amid worsening inflation and ongoing economic uncertainty. Specifically, U.S. apparel imports declined by 12.0% in value and 13.8% in April 2026 compared to the previous year, marking the fourth consecutive month of negative growth. Even after adjusting for seasonal factors, U.S. apparel imports in April 2026 were still 3.2% lower in value and 5.1% lower in quantity than in March 2026. As U.S. inflation rose to 4.2% in May 2026, U.S. apparel imports may not reverse the downward trend anytime soon. [see detailed monthly U.S. apparel import data here]
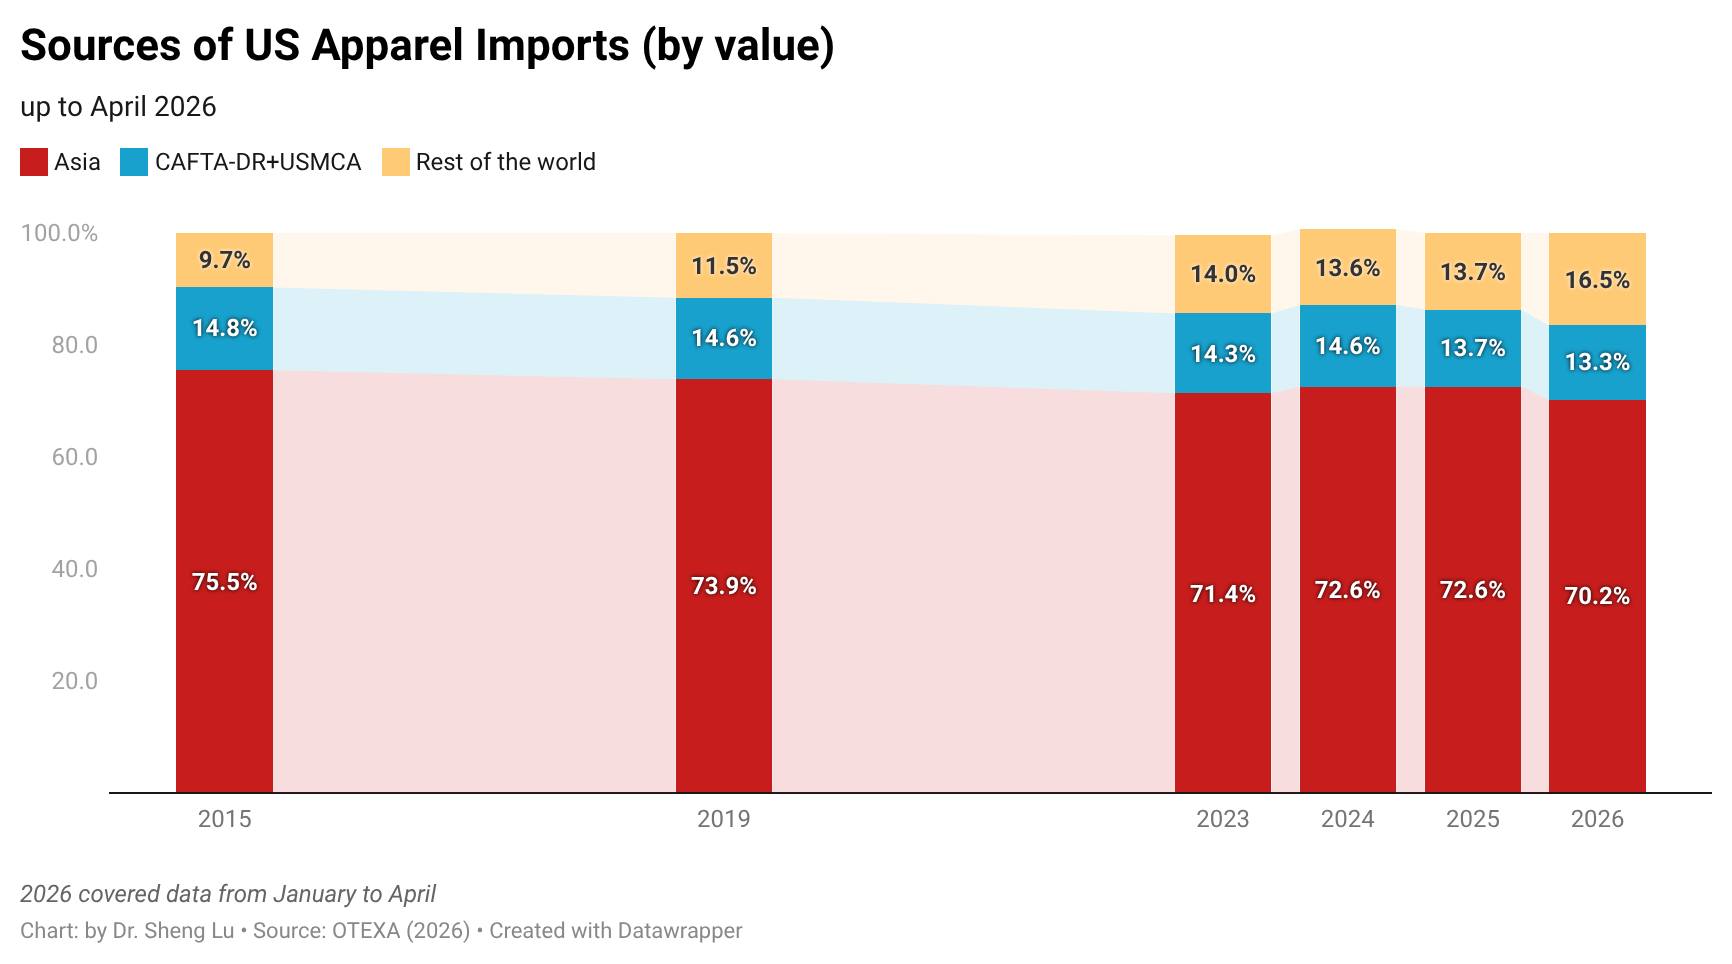
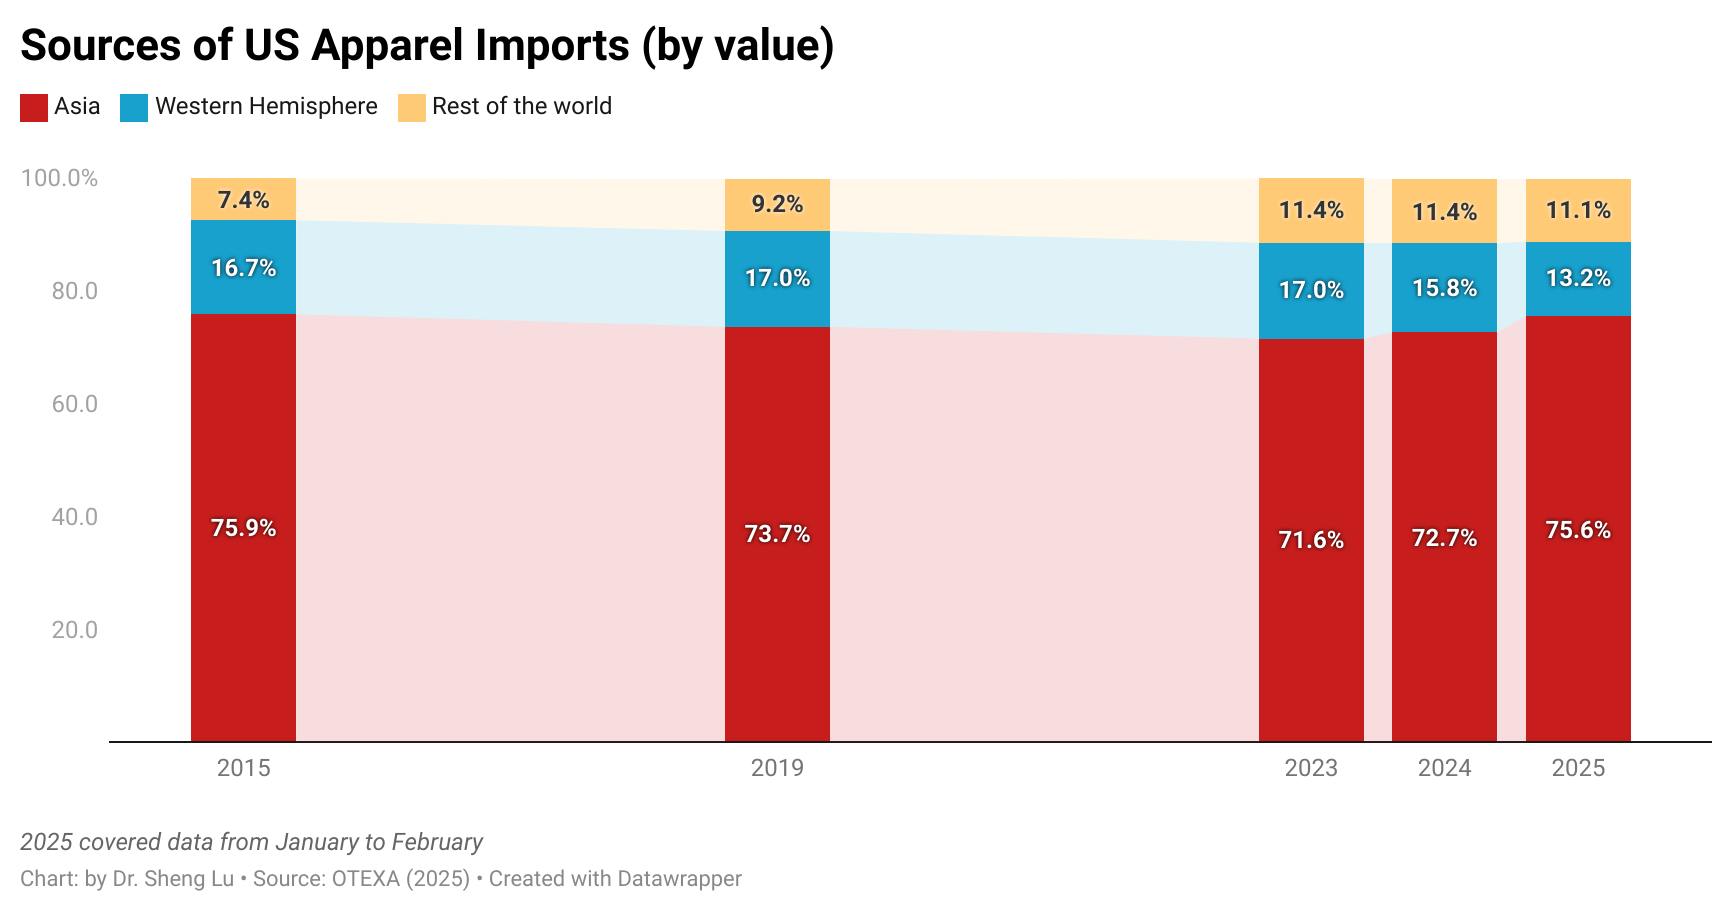
Second, although Asia still dominates, the U.S. apparel sourcing base is becoming increasingly diverse. By value, about 70.2% of U.S. apparel imports came from Asian countries in April 2026, down from 72.0% a year earlier. Notably, Asia’s declining market share was NOT captured by Western Hemisphere countries, whose share remained at 15.7% in April 2026 (including 13.7% for CAFTA-DR and USMCA members), even slightly lower than the 15.8% recorded in April 2025. Instead, U.S. apparel imports from countries outside Asia and the Western Hemisphere reached a new high of 14.1% in April 2026, up from 12.3% in April 2025 and well above the 7.4% recorded in 2015. This shift reflects U.S. fashion companies’ efforts in recent years to explore emerging sourcing destinations in regions such as Africa, the Middle East, and the EU to mitigate growing sourcing risks and other concerns.
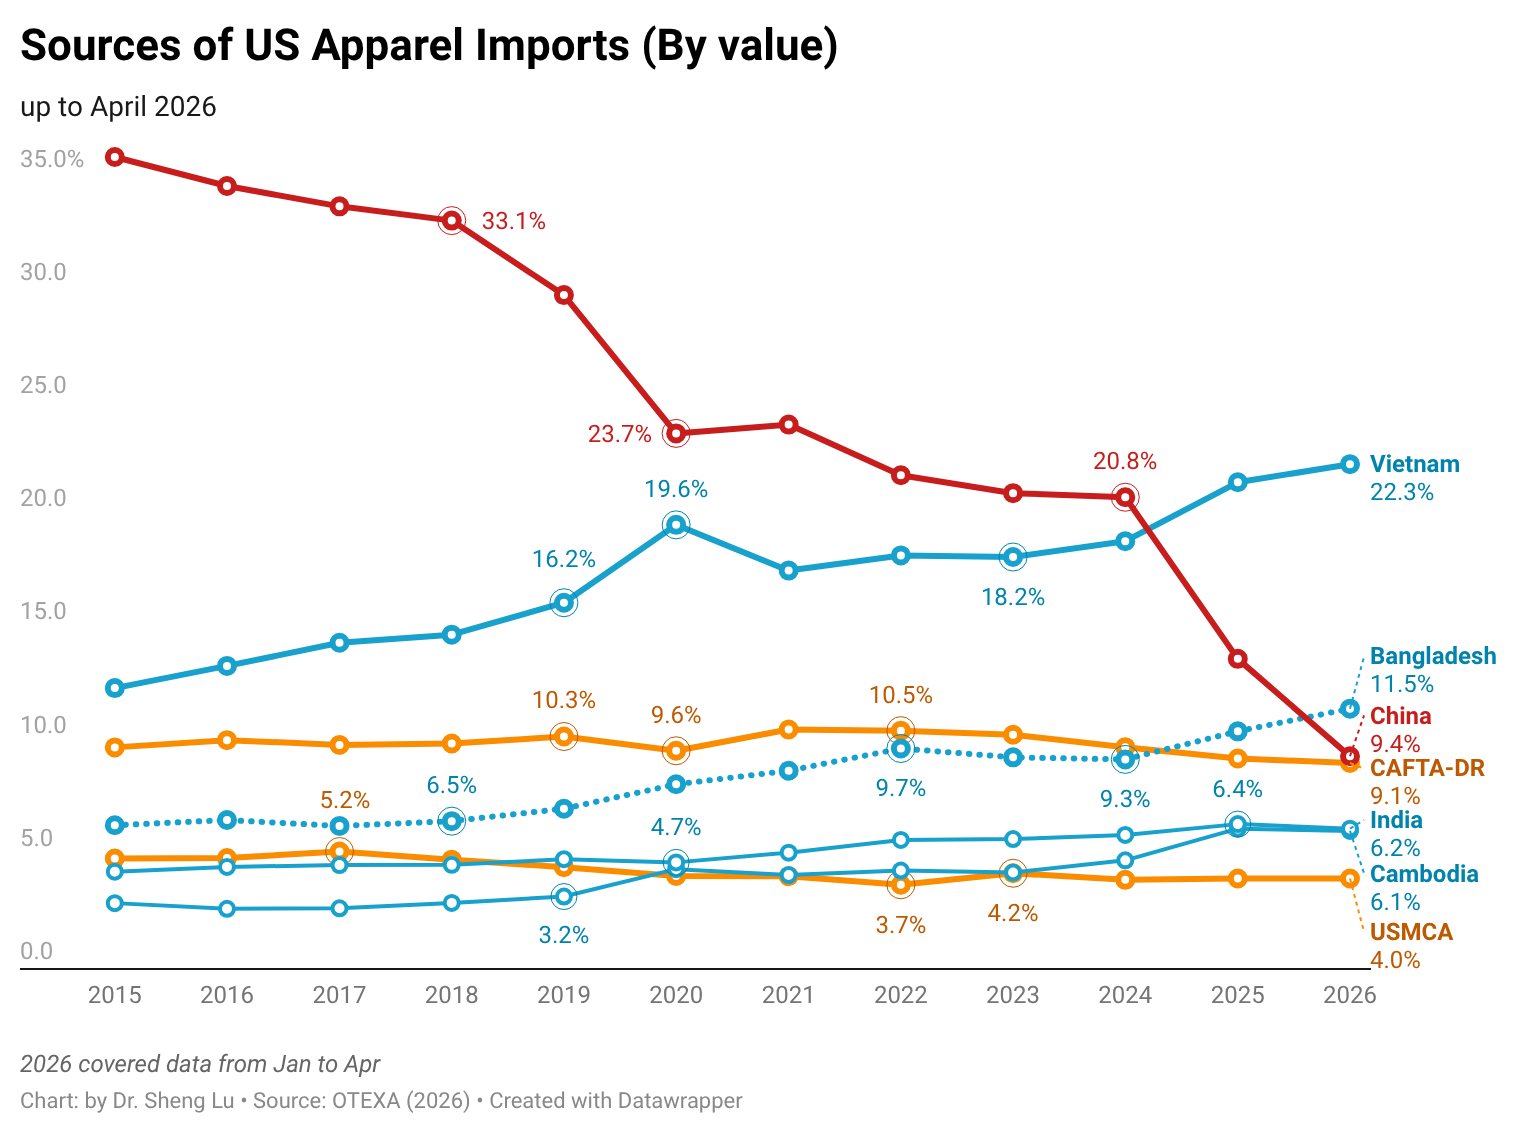
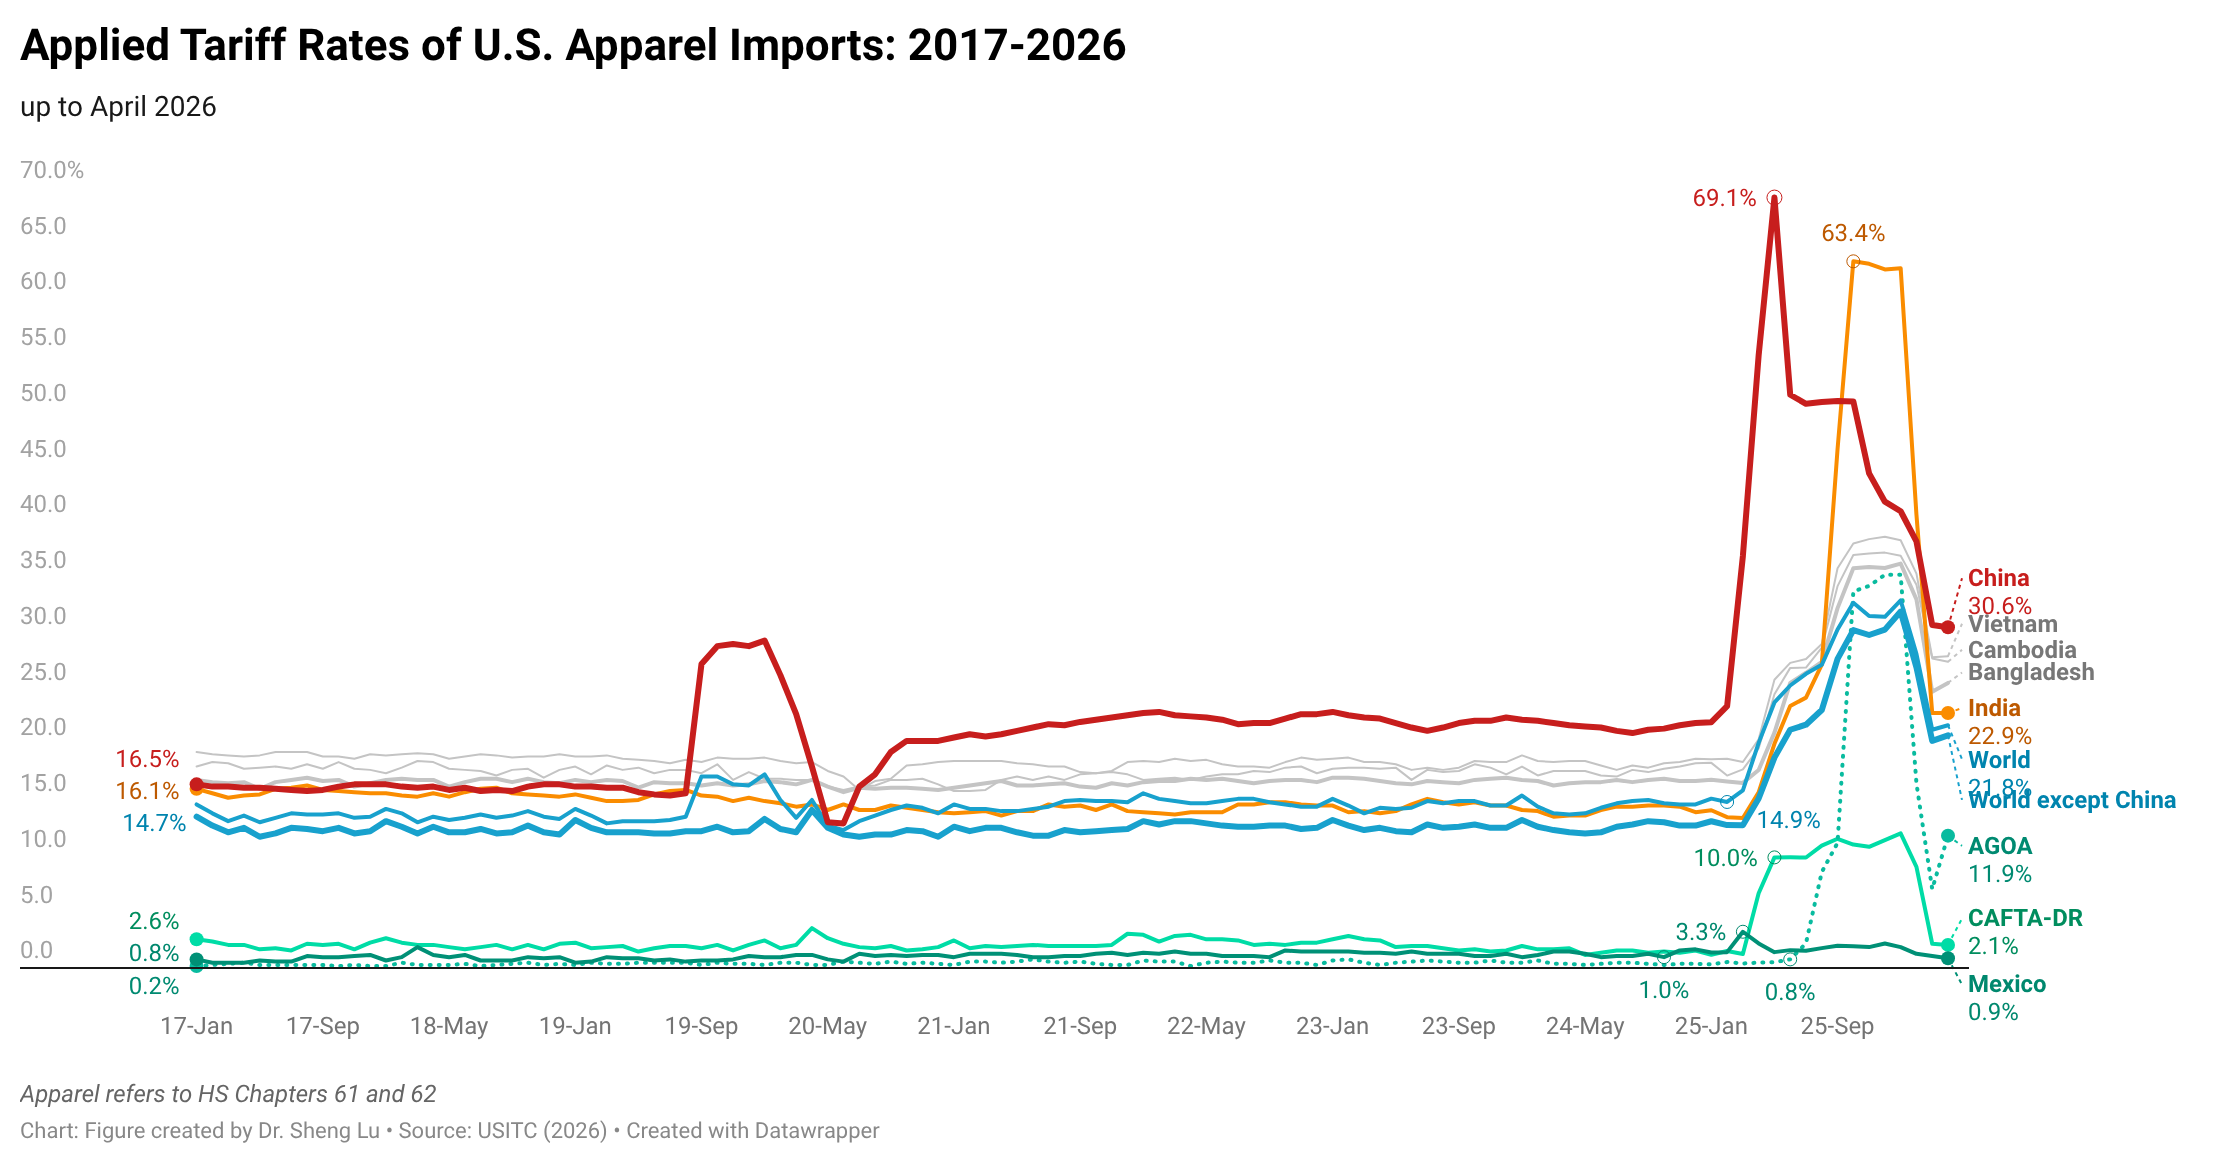
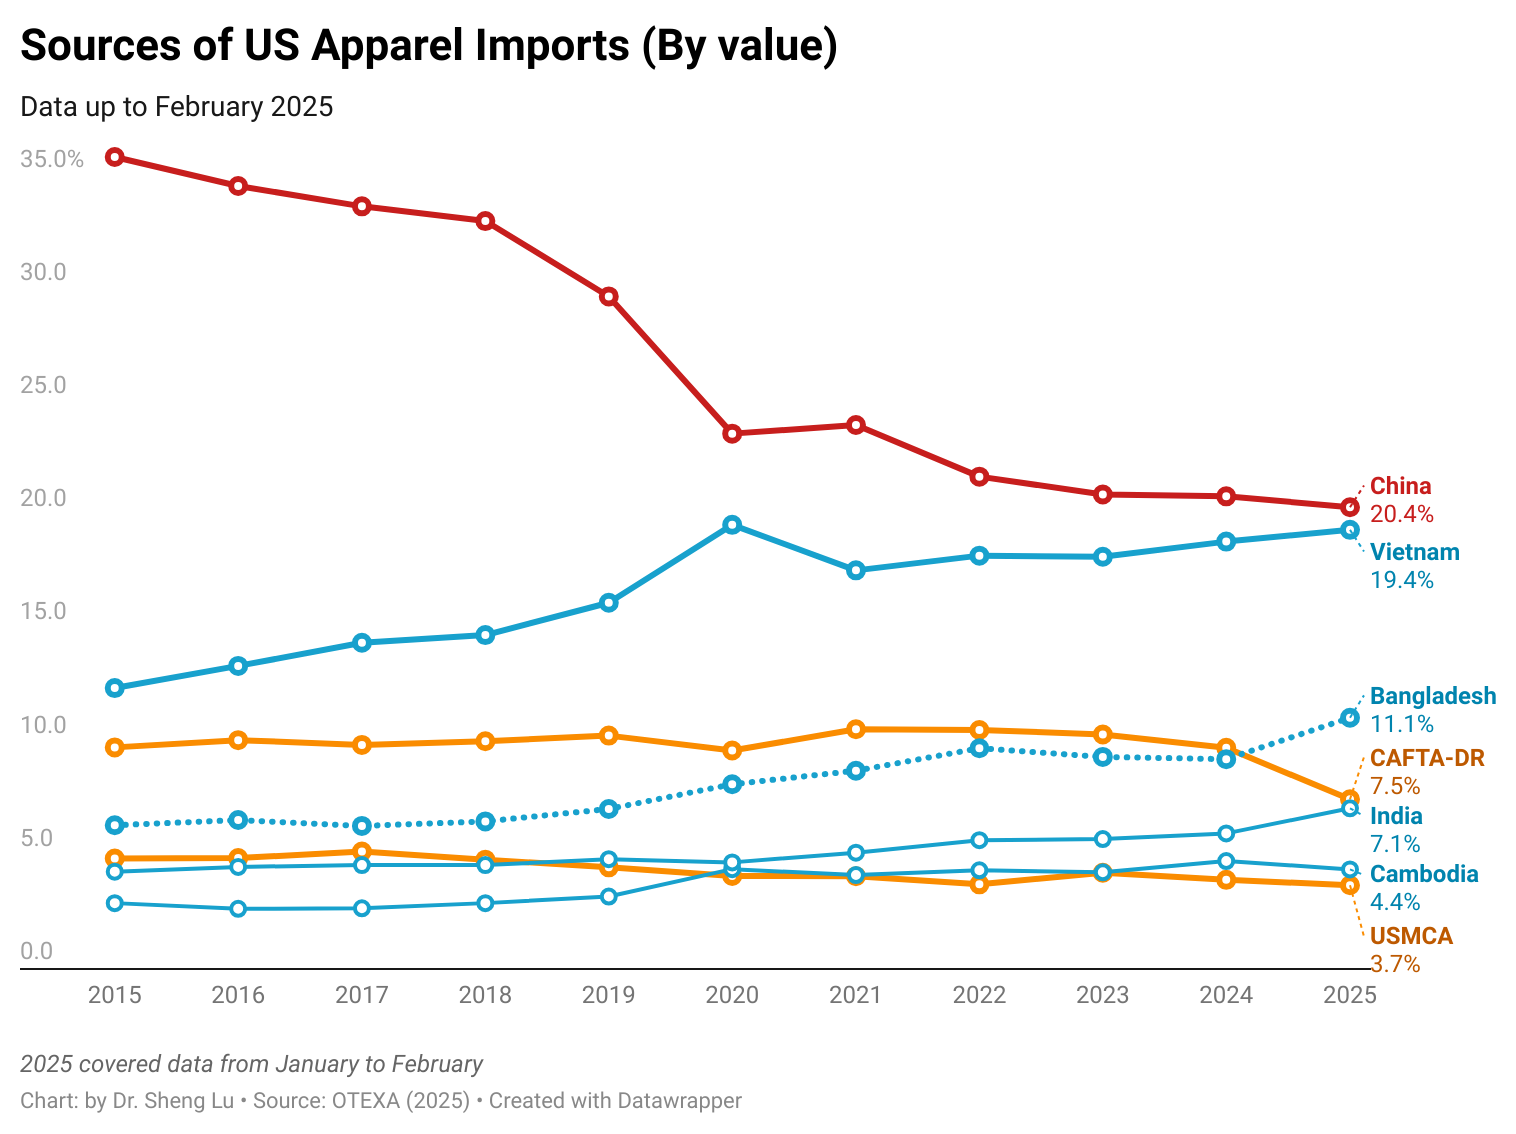
Third, at the country level, U.S. fashion companies have increased sourcing from several key Asian apparel-supplying countries beyond China, as well as from a few emerging sourcing destinations in other regions. Specifically, in the first four months of 2026, while the value of U.S. apparel imports decreased by 12%, imports from Vietnam (up 1.3%), Indonesia (up 2.3%), and Cambodia (up 14.2%) increased. Egypt (up 14.7%) and Turkey (up 6.4%) also became more popular sourcing destinations. In comparison, over the same period, U.S. apparel imports from China (down 50.2%), India (down 28.0%), and Bangladesh (down 11.2%) decreased substantially. Particularly for China and India, the much higher tariff rates imposed on their products were among the critical factors behind their loss of sourcing orders. Regarding Bangladesh, since it primarily produces low-volume items for U.S. fashion companies, it could be disproportionately affected as ordinary U.S. consumers purchase fewer clothing items amid economic stress. [See detailed country market share data here]
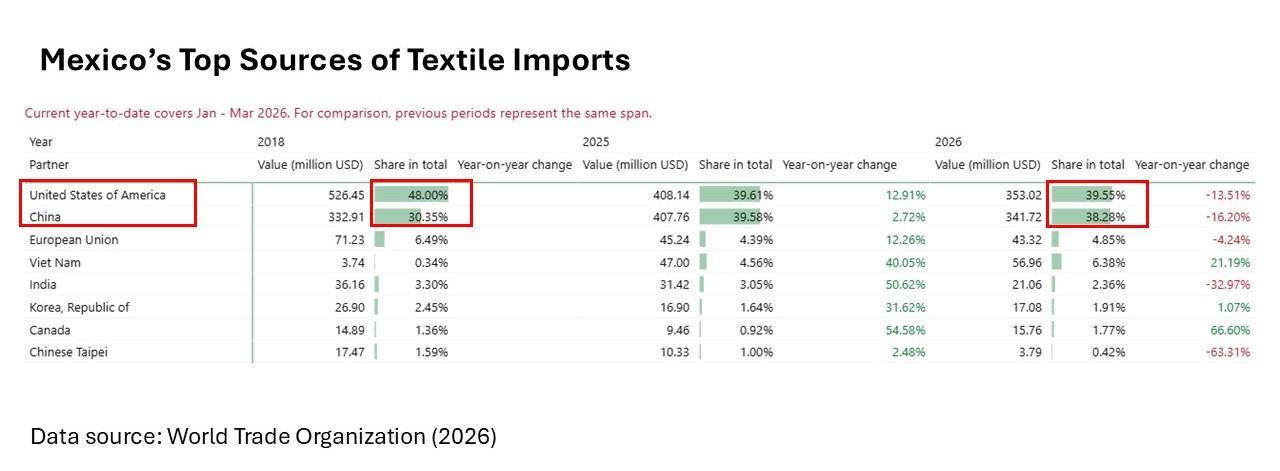
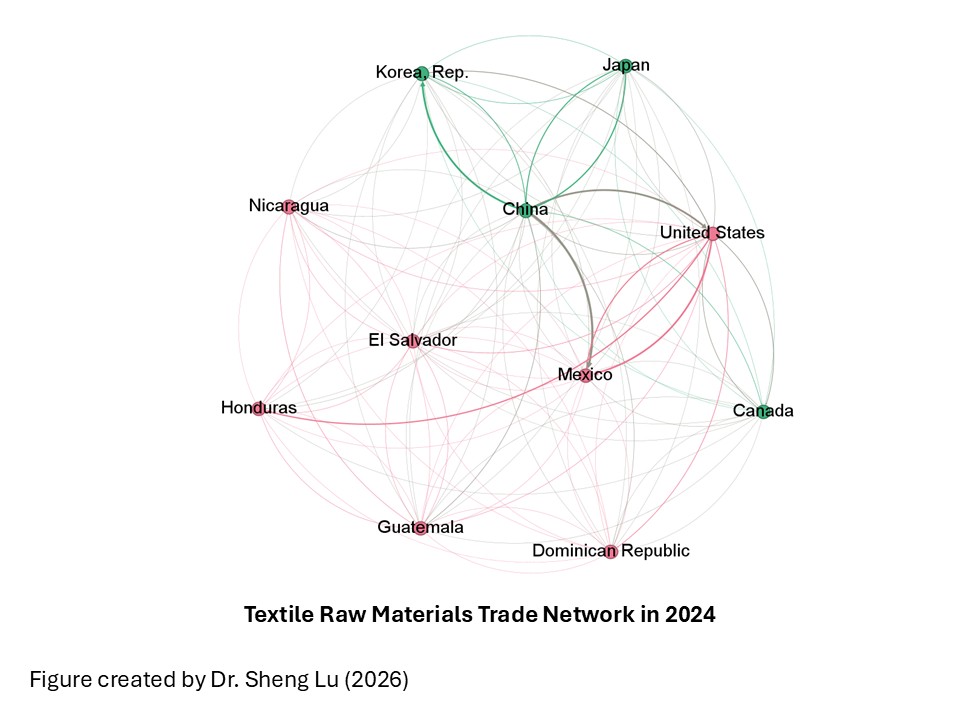
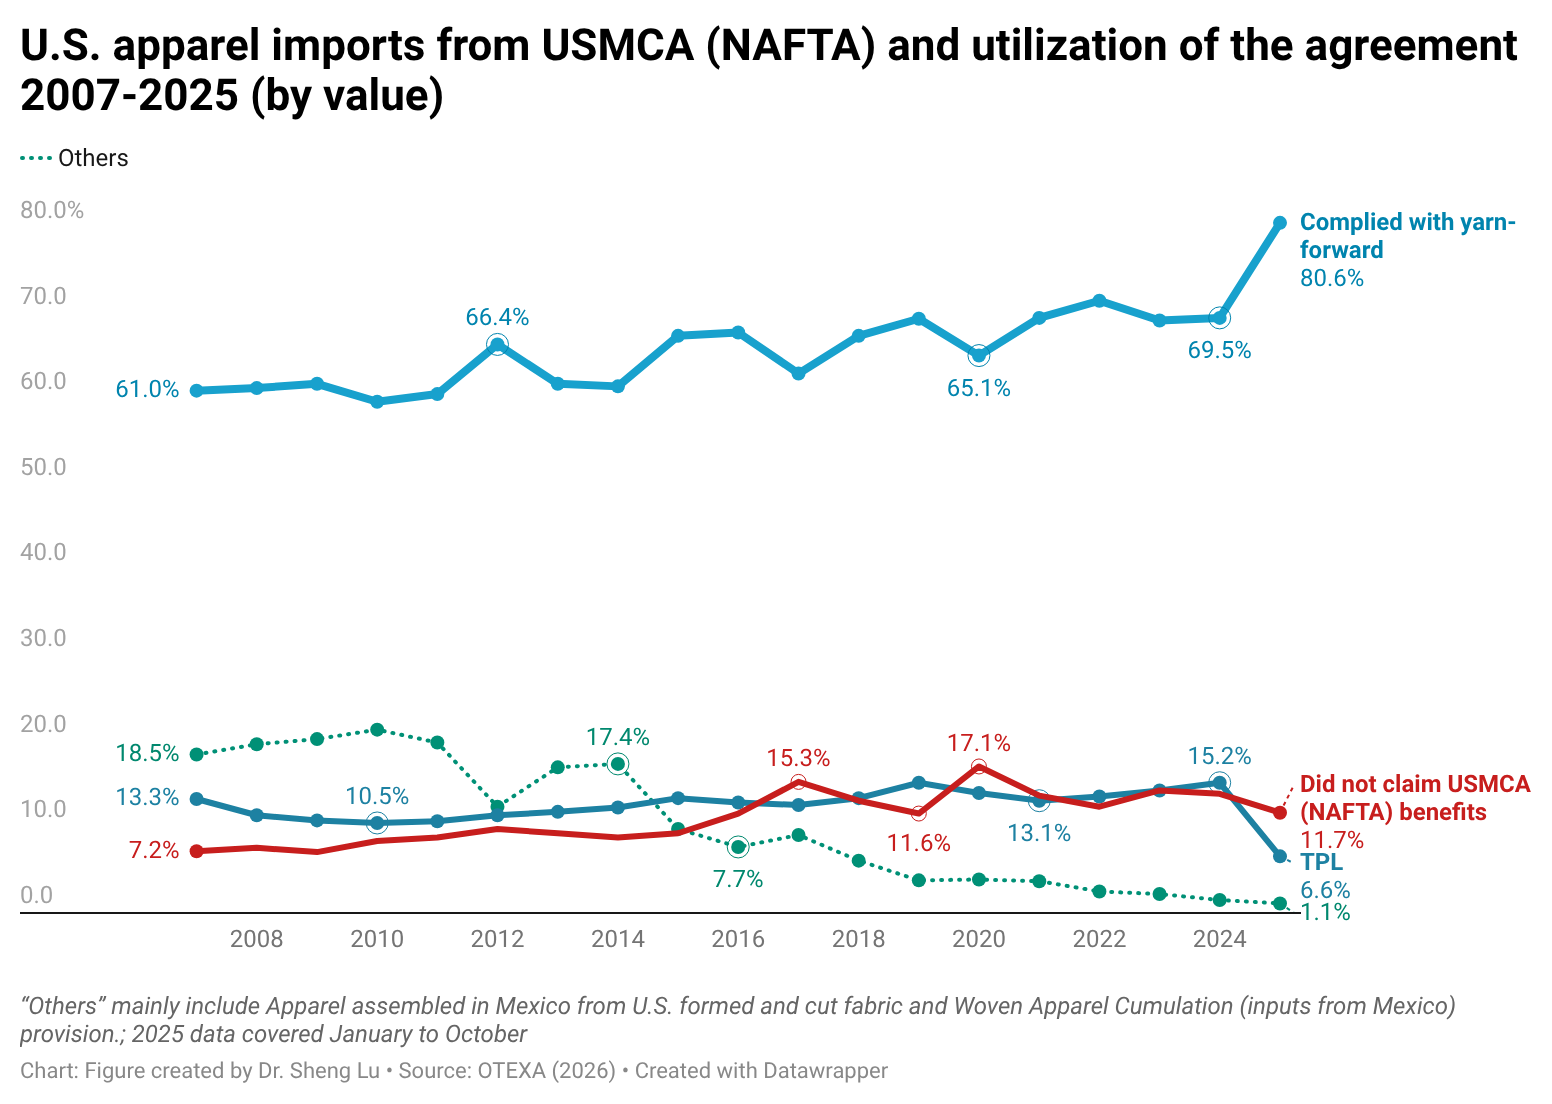
Fourth, with the upcoming US-Mexico-Canada Agreement (USMCA) joint review later this summer, the state of U.S. textile and apparel trade with Mexico and Canada has drawn increased attention. On the one hand, the OTEXA data show that the USMCA remained the single largest export market for U.S.-made yarns and fabrics as of 2026. In the first four months of 2026, about 48.4% of U.S. yarn and fabric exports went to USMCA members, including 33.9% destined for Mexico. This share has been highly consistent over the past decades, including when the USMCA replaced NAFTA in 2020. Meanwhile, according to the latest data from the World Trade Organization (WTO), in the first three months of 2026, the U.S. accounted for about 39.3% of Mexico’s textile imports. However, this percentage was noticeably lower than 48% in 2018. Over the same period, China has become an increasingly important textile supplier for Mexico, with its market share rising from 30.3% in 2018 to 38.3%.
On the other hand, in value terms, USMCA accounted for 3.4% of U.S. apparel imports in the first four months of 2026 (including 2.8% from Mexico), slightly up from 3.2% over the same period in 2025. Despite the relatively low market share compared to Asian suppliers, it should be noted that in the first three months of 2026, nearly 98% of Mexico’s apparel exports went to the United States. Data from the U.S. International Trade Commission further show that almost 94% of those exports claimed duty-free benefits under the USMCA in the first three months of 2026, a significant jump from around 80%-83% in the past. USMCA-qualifying apparel has been among the very few products exempt from the tariff hikes since Trump’s second term.
Furthermore, in the first four months of 2026, about 55.3% of U.S. apparel imports from Mexico were cotton apparel, the lowest share since 2021 (around 57%). While the available data did not establish a direct causal relationship, the growing availability of textile inputs from Asia may have contributed to a broader diversification of Mexico’s apparel exports to the U.S. market beyond traditional products such as men’s and boys’ cotton trousers. This trend also underscores the high stakes of USMCA’s review. The agreement’s duty-free preferences and yarn-forward rules have long encouraged the use of U.S.-made textile inputs, especially those cotton-centered, in Mexican apparel production. Without these incentives, Mexican manufacturers could have greater flexibility in sourcing textile inputs from Asia, given the benefits of diversifying their export offerings. Such a shift could reduce demand for U.S. yarn and fabric exports and further weaken traditional Western Hemisphere textile and apparel supply chains.
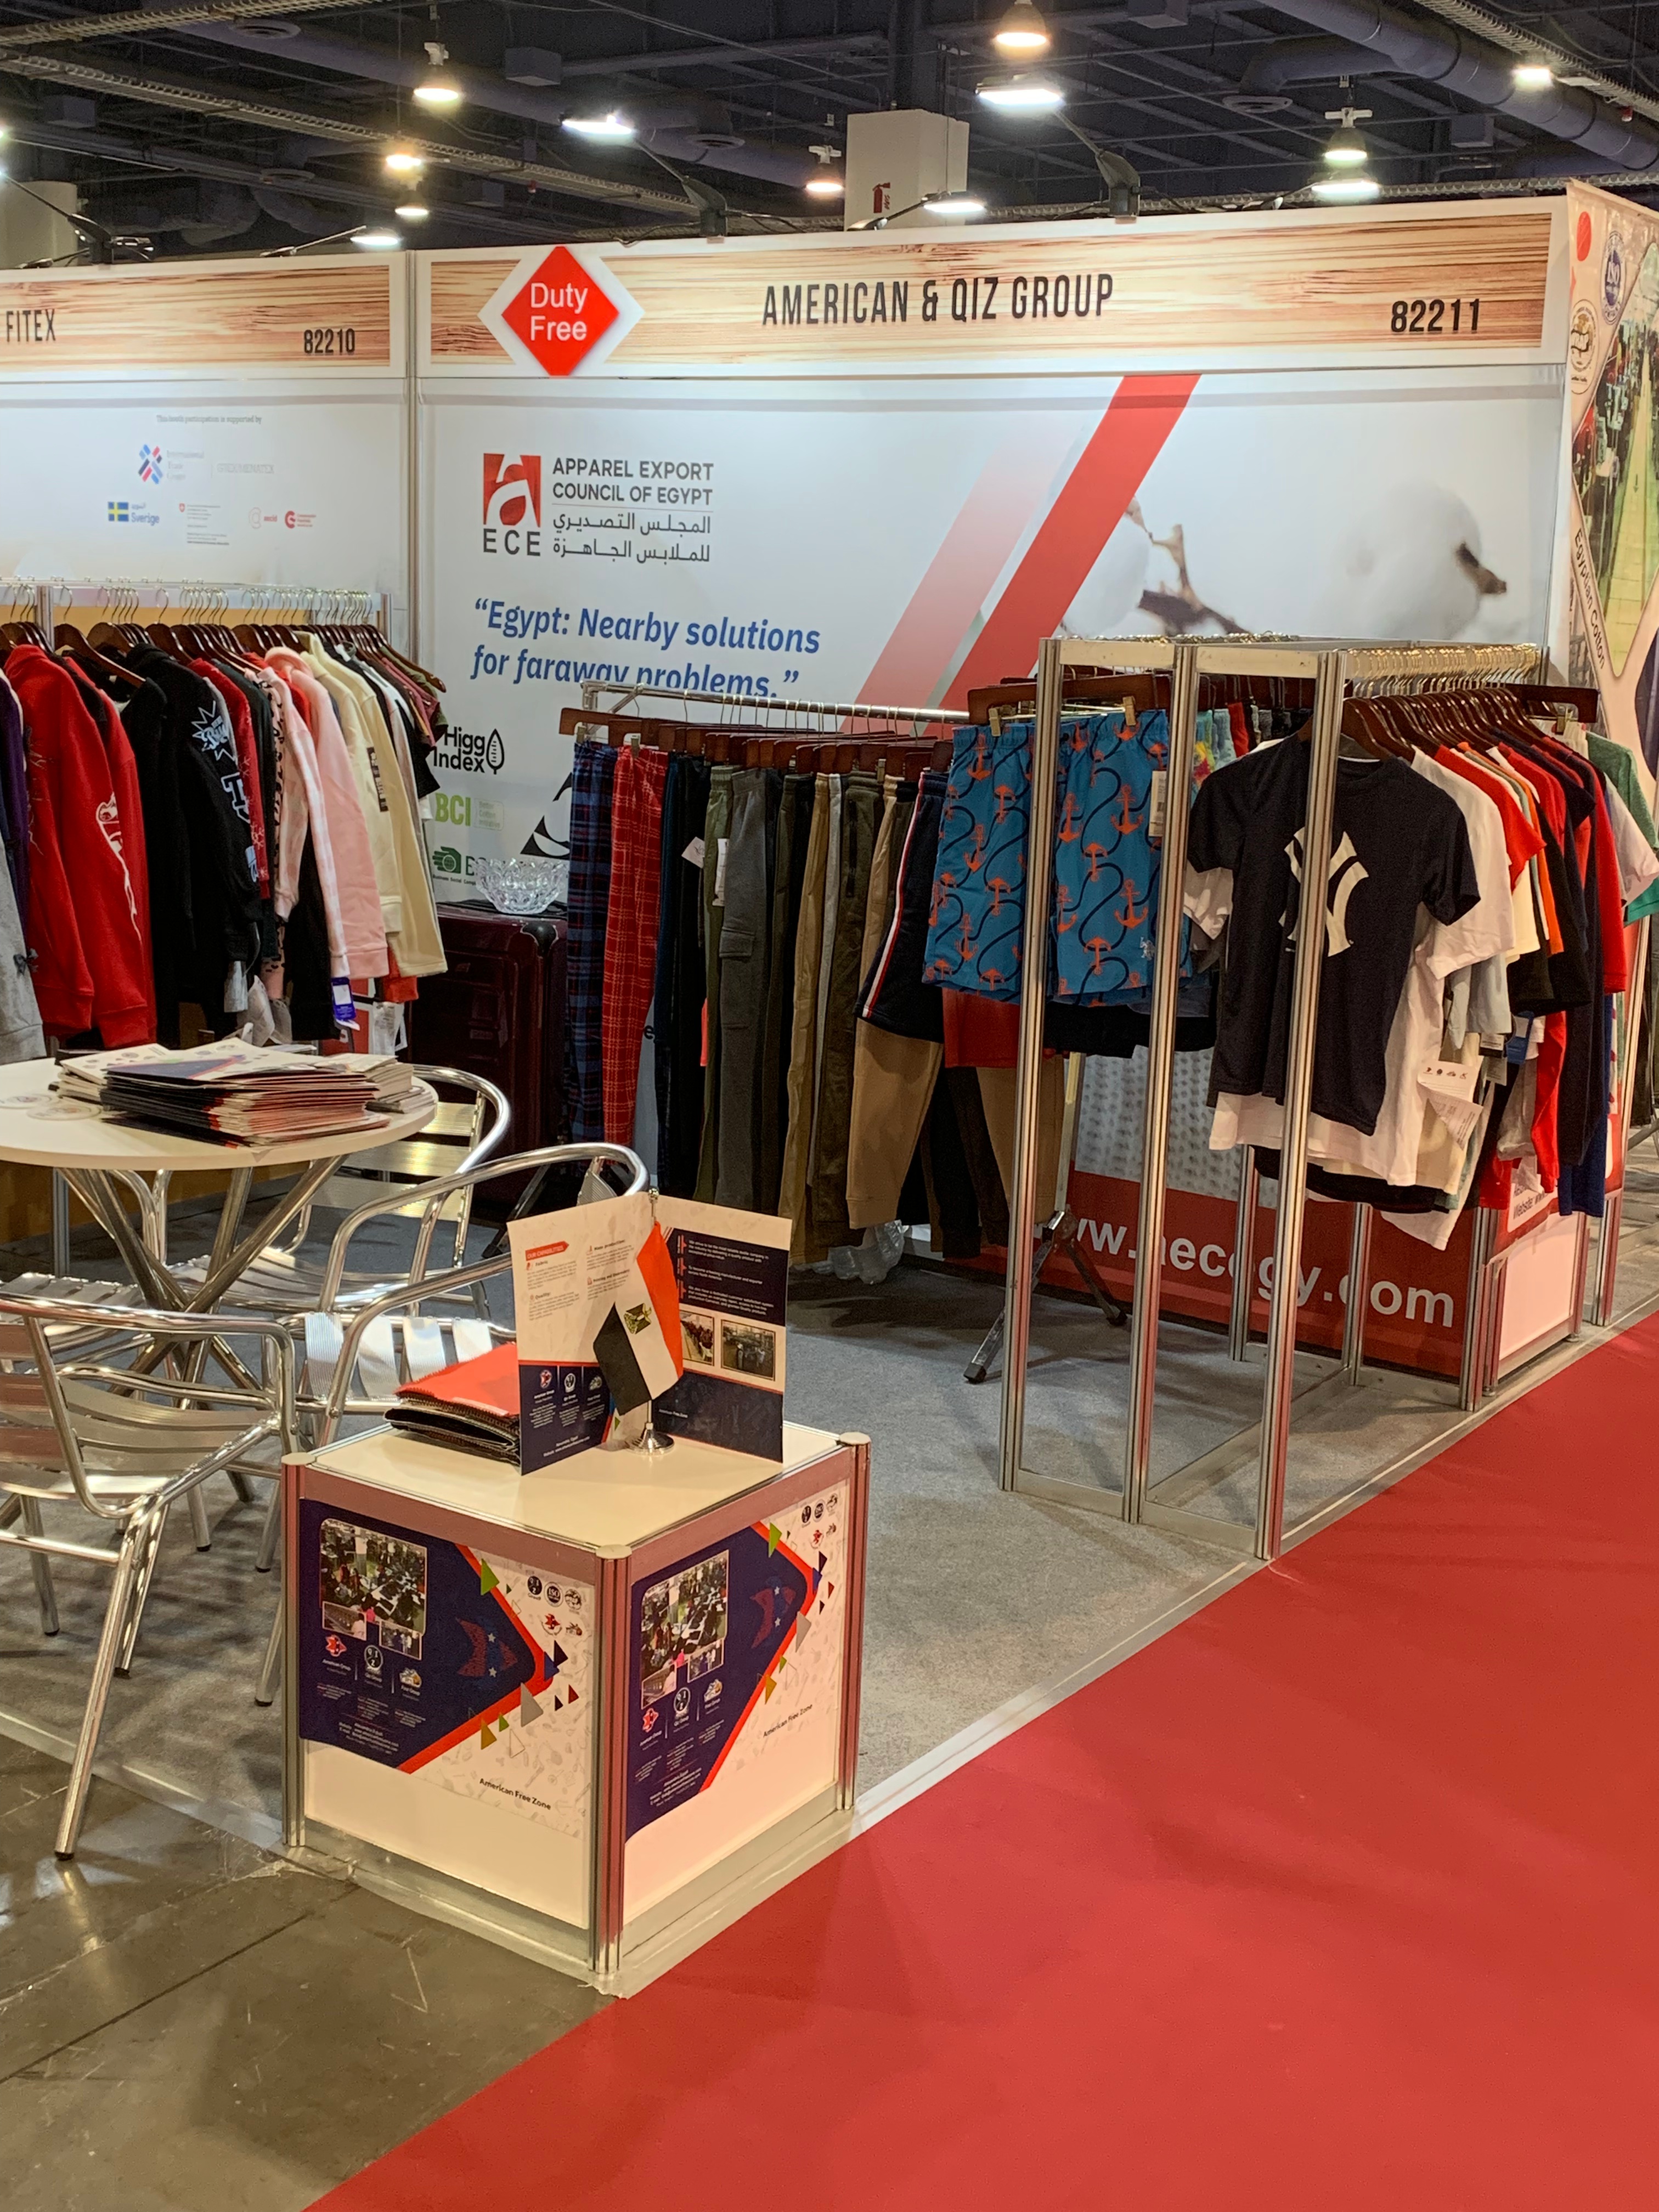
Additionally, U.S. apparel imports from Sub-Saharan African (SSA) countries declined sharply, down 30.9% in value and 22.3% in quantity in April 2026. So far in the first four months of 2026, SSA countries together accounted for 1.9% of U.S. apparel imports, the same as in 2025. With the African Growth and Opportunity Act (AGOA) renewed for only one year and set to expire at the end of 2026, these results reinforce concerns that U.S. fashion companies are unwilling to expand apparel sourcing from AGOA without a clear long-term policy outlook.
by Sheng Lu


