About Martha Girard
My name is Martha Girard, and I am a proud Blue Hen alum. I can’t pinpoint exactly when my passion for fashion began. It has always simply been a part of who I am. Even when I was a toddler, I would wear princess ballgowns and heels to the grocery store (move over, Carrie Bradshaw). When it came time to choose a college, the University of Delaware’s highly regarded fashion program felt like a natural place to pursue that passion.
During my junior year, I had the opportunity to meet Dr. Sheng Lu, who recognized my drive and encouraged me to apply for the UD Summer Scholars research program. Soon after, the COVID-19 pandemic transformed the world as we knew it. While much of life came to a halt, I immersed myself in research, examining how retailers were approaching secondhand product assortment and pricing strategies (note: see the publication based on the summer scholar research). I developed a genuine passion for this work!
That passion for secondhand strategy and sustainable fashion led me to Nuuly, where I joined as a Merchandise Assistant after graduation. As part of a rapidly growing startup, I gained hands-on experience in buying, production, shipping, and planning. This was far more than I ever expected to learn early in my career. I later transitioned to Lilly Pulitzer as an Associate Merchandiser, where I managed women’s pants, shorts, and skirts.
In mid-2024, a personal move brought me to New York City, where I stepped into a new role as a Production Coordinator at Jay Franco. While this position differed from my previous experience—shifting from women’s fashion to licensed children’s home products—it presented an exciting challenge. I was drawn to the team (and my amazing boss, Emily) and trusted my instincts that it was the right opportunity.
Nearly two years later, I can confidently say that decision was the right one. I’ve developed a strong foundation in sourcing, supply chain, and production, and my background in buying and merchandising has strengthened my perspective. Together, these experiences continue to shape me as I grow in my career as a Production Manager.
Disclaimer: The views expressed in this interview are those of Martha Girard and do not reflect the views or positions of her employer or any affiliated organizations.
Sheng: What are your main responsibilities as a production manager? Can you walk us through your typical day? What aspects of the job do you find most interesting, or something you didn’t expect when you took the role?
Martha:My primary responsibility is to ensure that every order meets the buyer’s ship date. While that may sound straightforward, it requires close coordination from the moment a purchase order is issued to when the goods arrive at the warehouse. I serve as the primary point of contact between our factories and internal teams, ensuring all updates are clearly and consistently shared.
I typically start my day by reviewing and updating the status of all open orders. My direct report and I manage approximately 200–300 orders at any given time. These updates include pricing, ship dates, licensor approvals (as all products must be reviewed and approved by their respective licensors), and any factory-related developments. Communicating these updates to our cross-functional partners is critical to ensuring alignment and avoiding delays.
From there, I move on to processing new orders received that day, followed by reviewing shipping reports to confirm that all vessels are on schedule and progressing as expected.
What I find most exciting about my role is the constant variety. No two days are the same. With factors like tariffs and global shipping disruptions, there is always a new challenge to navigate. The role requires strong problem-solving skills and creative thinking to keep operations running smoothly and ensure our buyers’ expectations are consistently met.
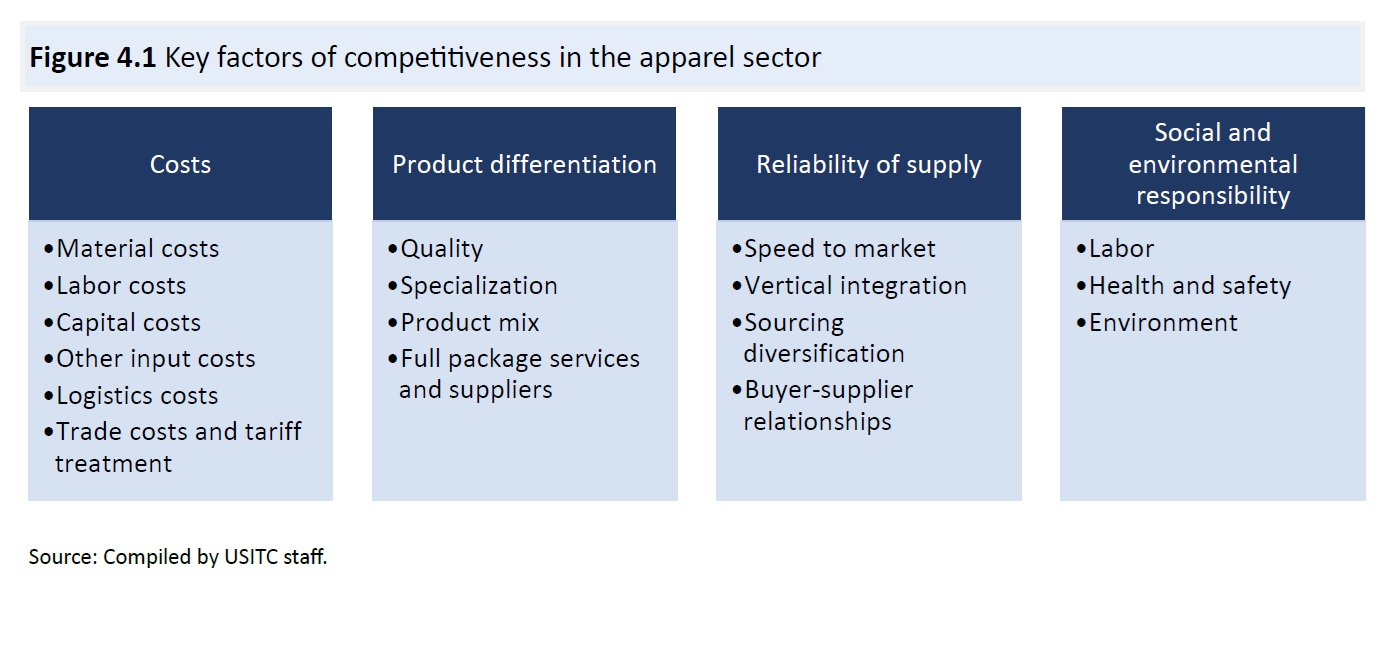
Sheng: When deciding where to source home textile products, what are the most important factors you consider (e.g., cost, lead time, quality, supplier reliability)? How do you balance these trade-offs?
Martha:All of our products are custom-made for each buyer or retailer, so it is ultimately up to our customers to decide on the perfect balance of these trade-offs. The needs of a large department store may focus on classic home assortments, which differ significantly from those of a value-driven retailer like a dollar store. We are well-positioned to support both.
For example, a dollar store partner may collaborate with our product team to develop a cost-efficient item that can move from concept to shelf in as little as 120 days. In contrast, a large department store may work with us to design a premium throw blanket at a higher price point, with a longer development timeline of up to six months to ensure the final product meets their standards. This flexibility allows us to tailor our sourcing approach and deliver solutions that align with each customer’s unique strategy.
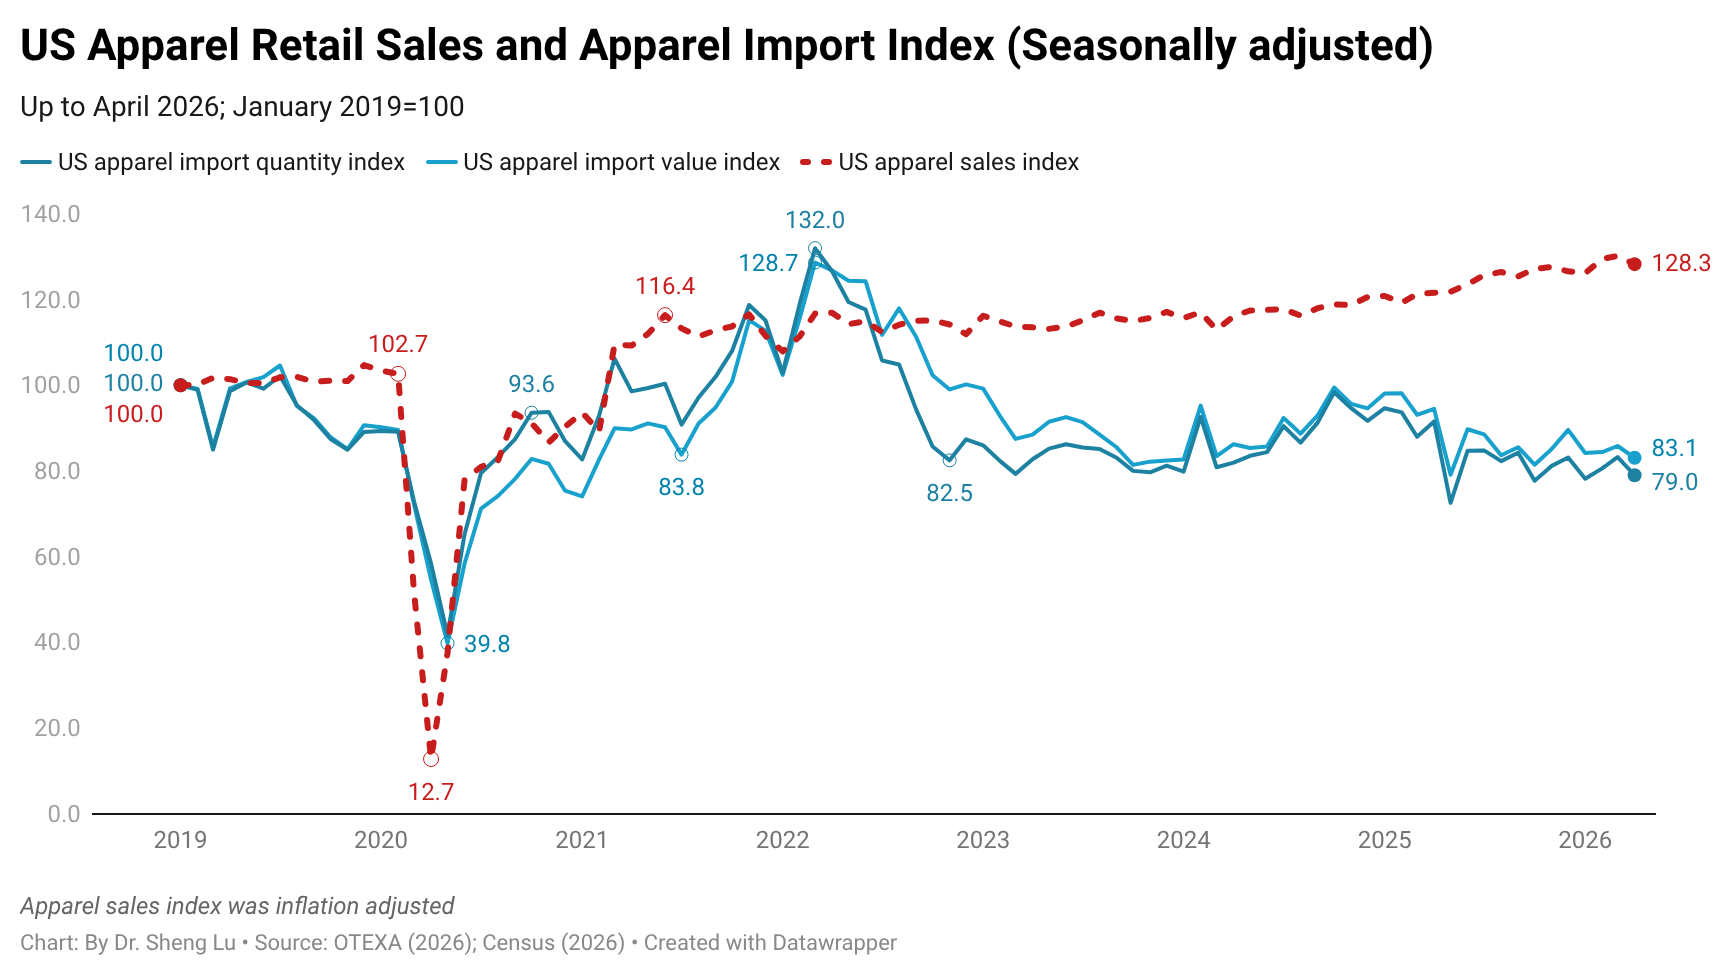
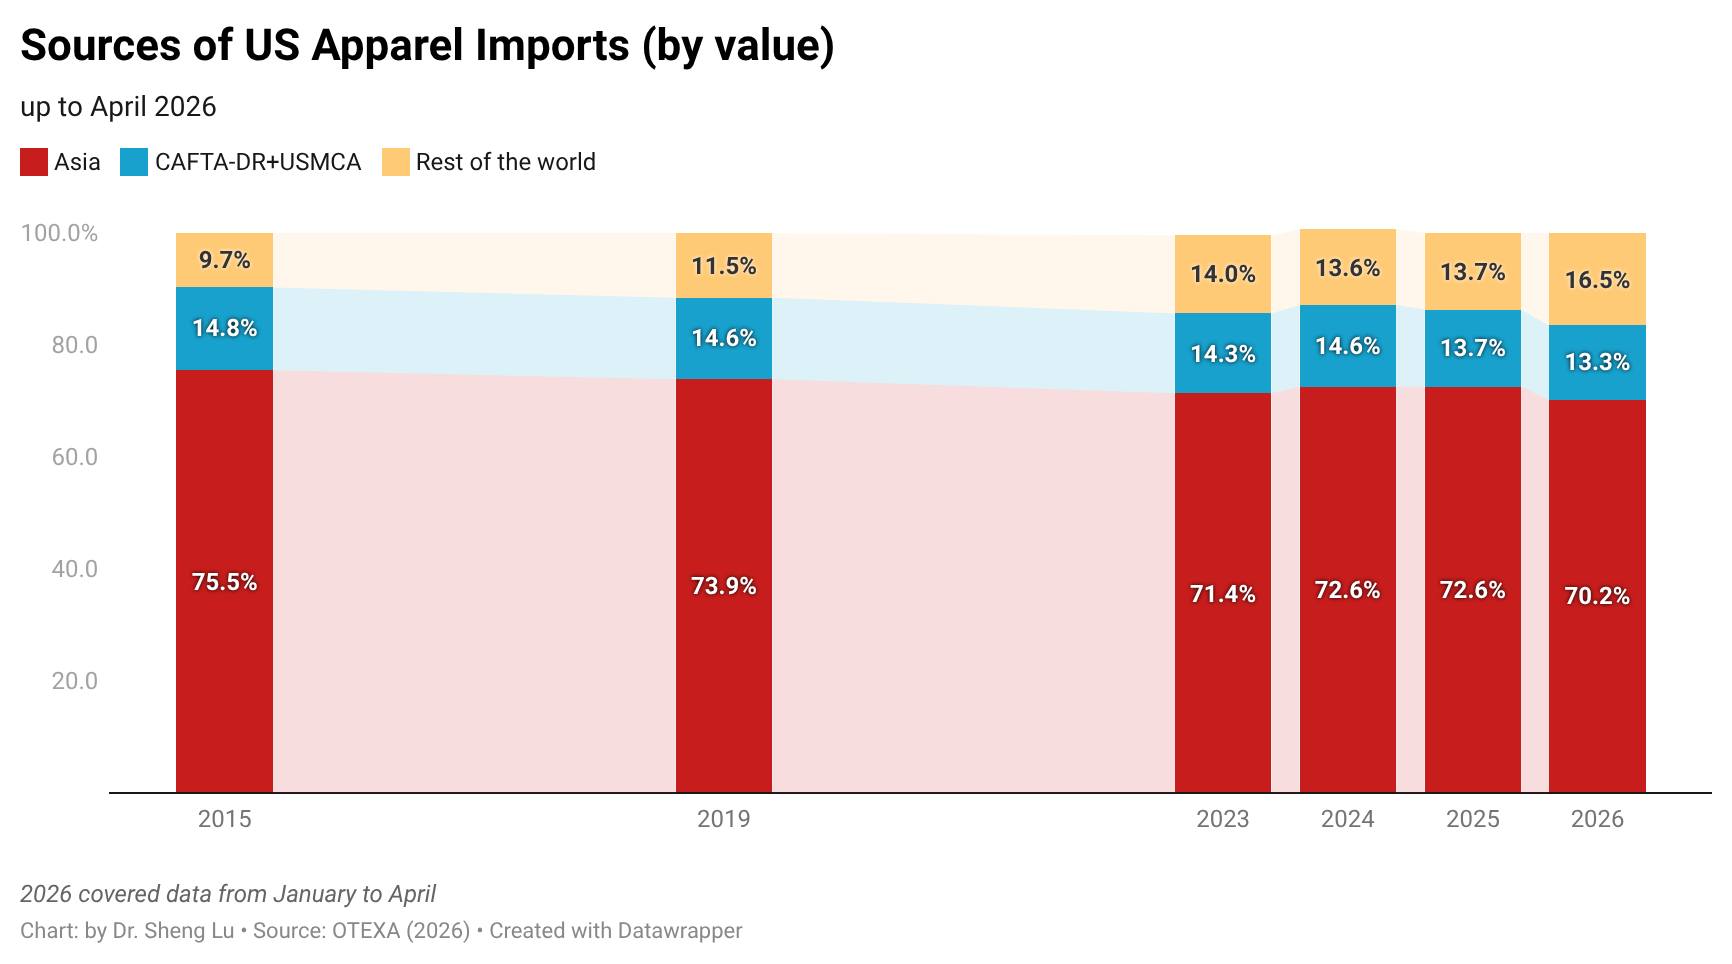
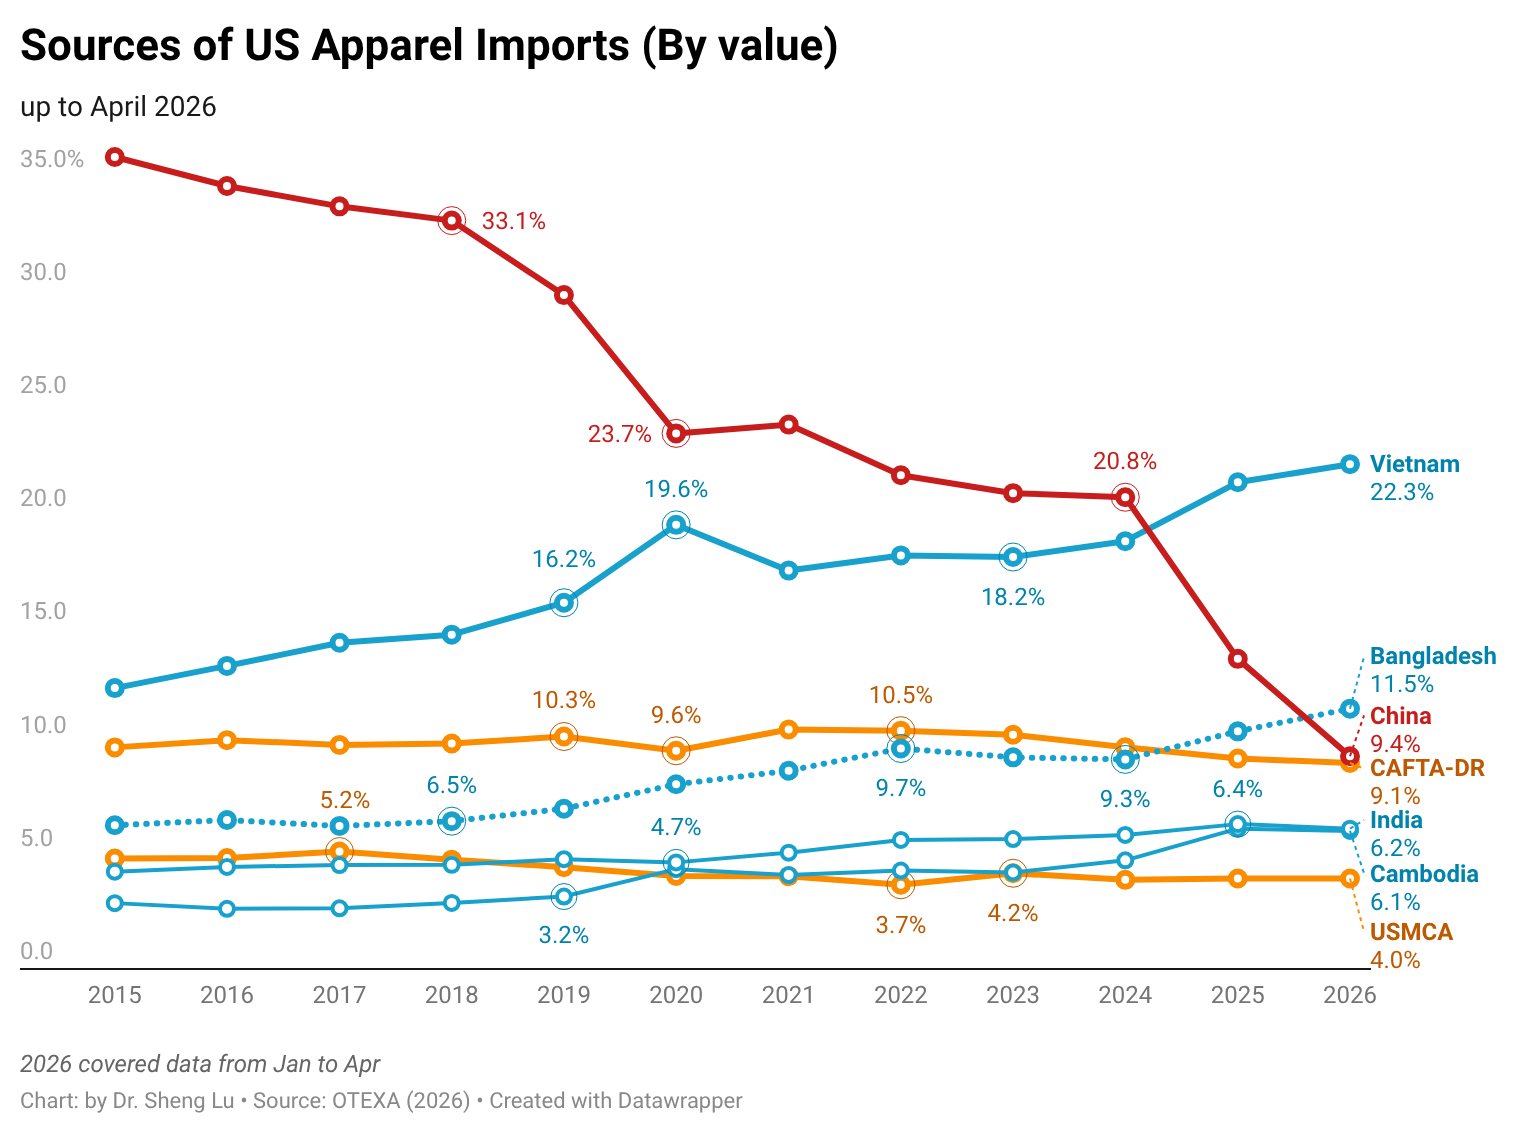
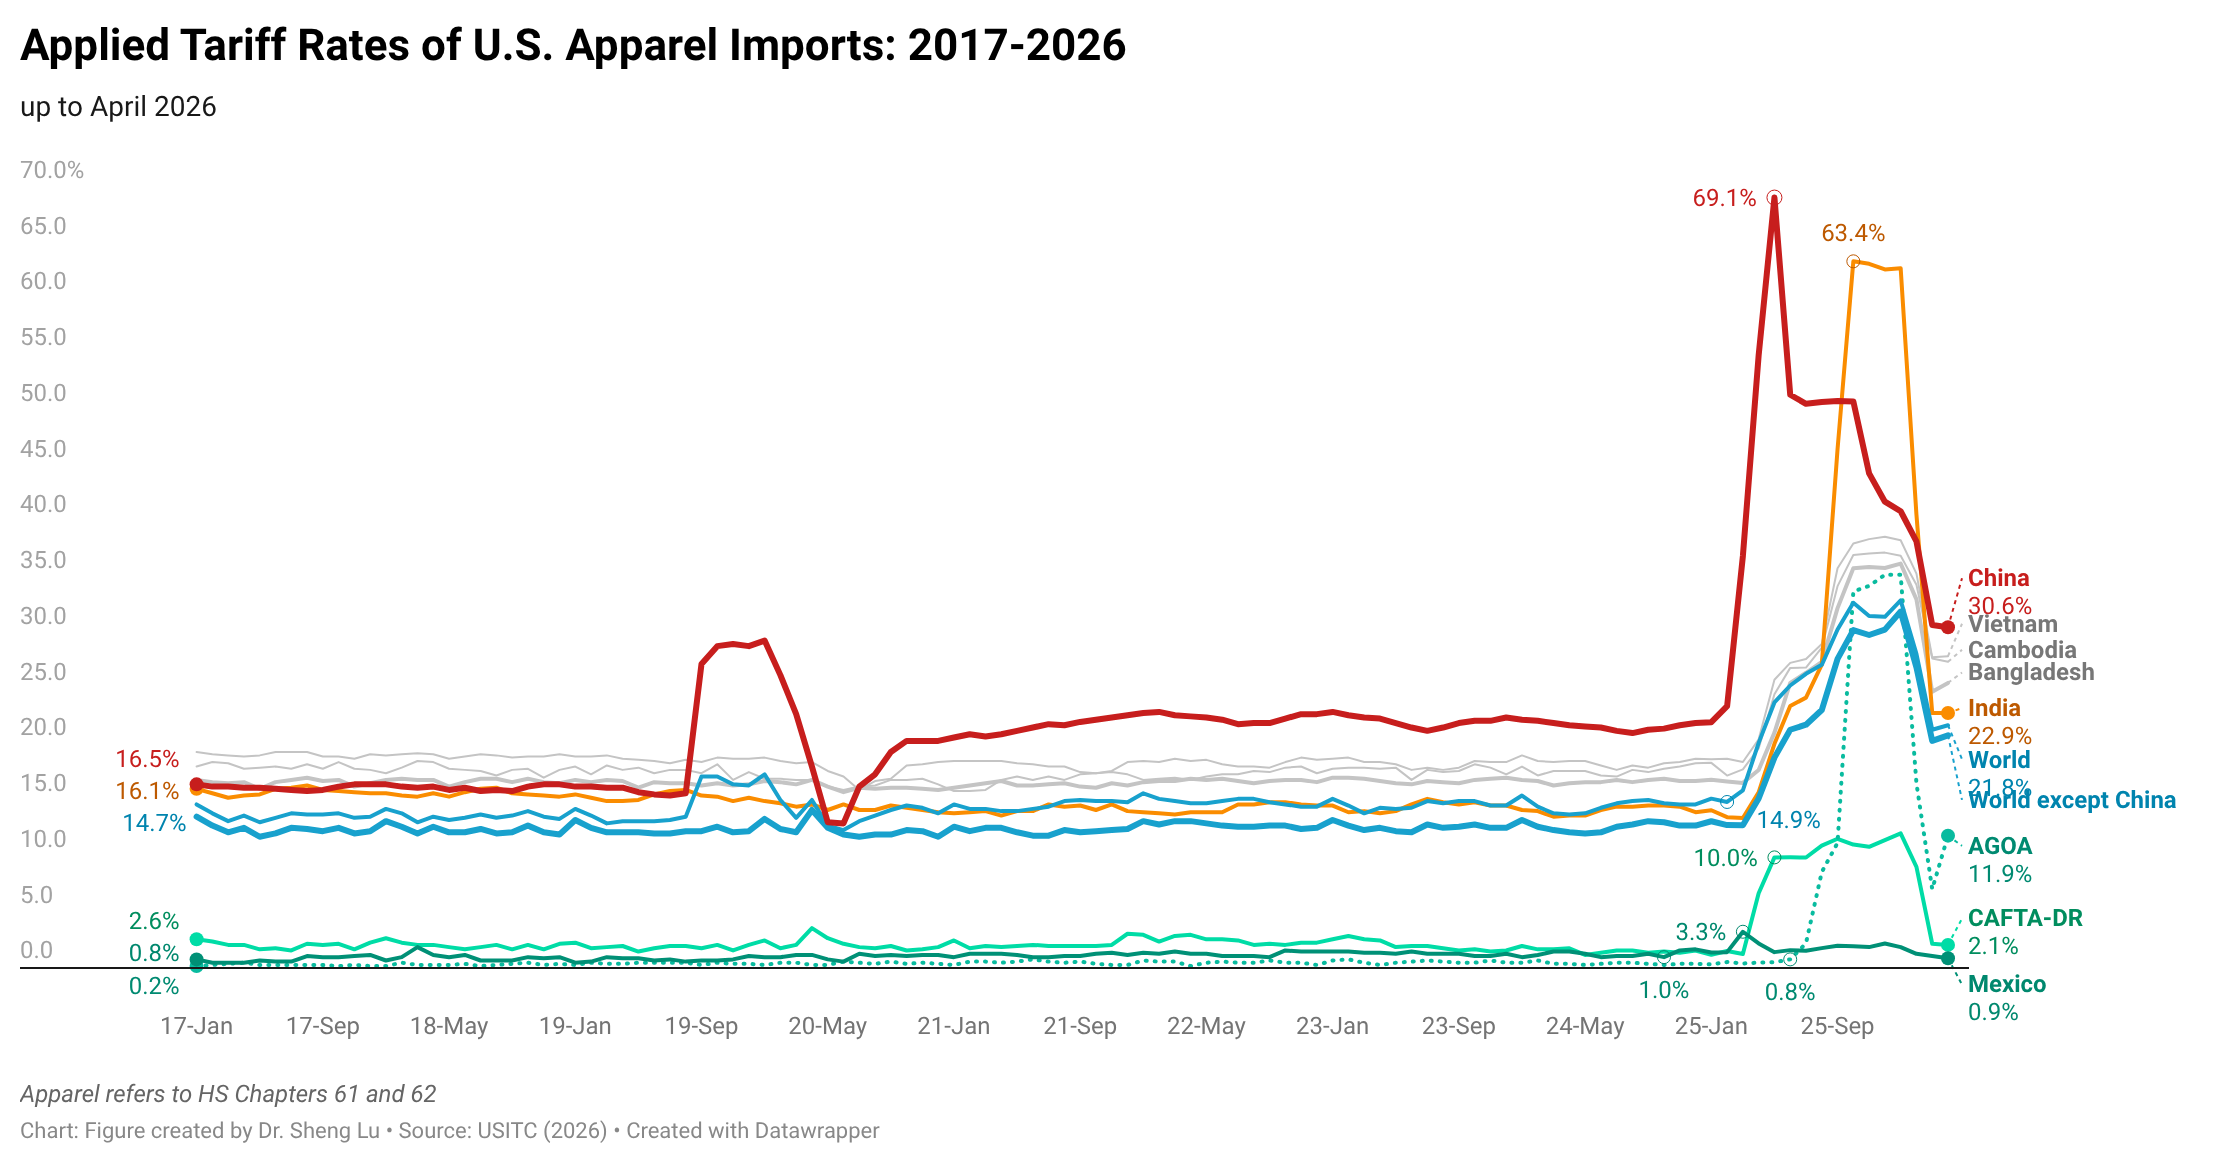
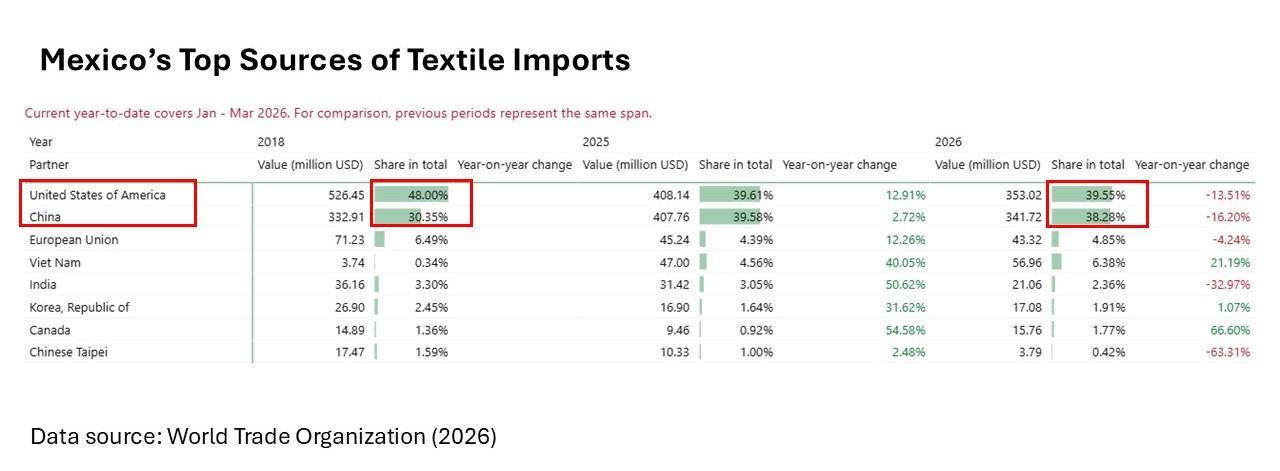
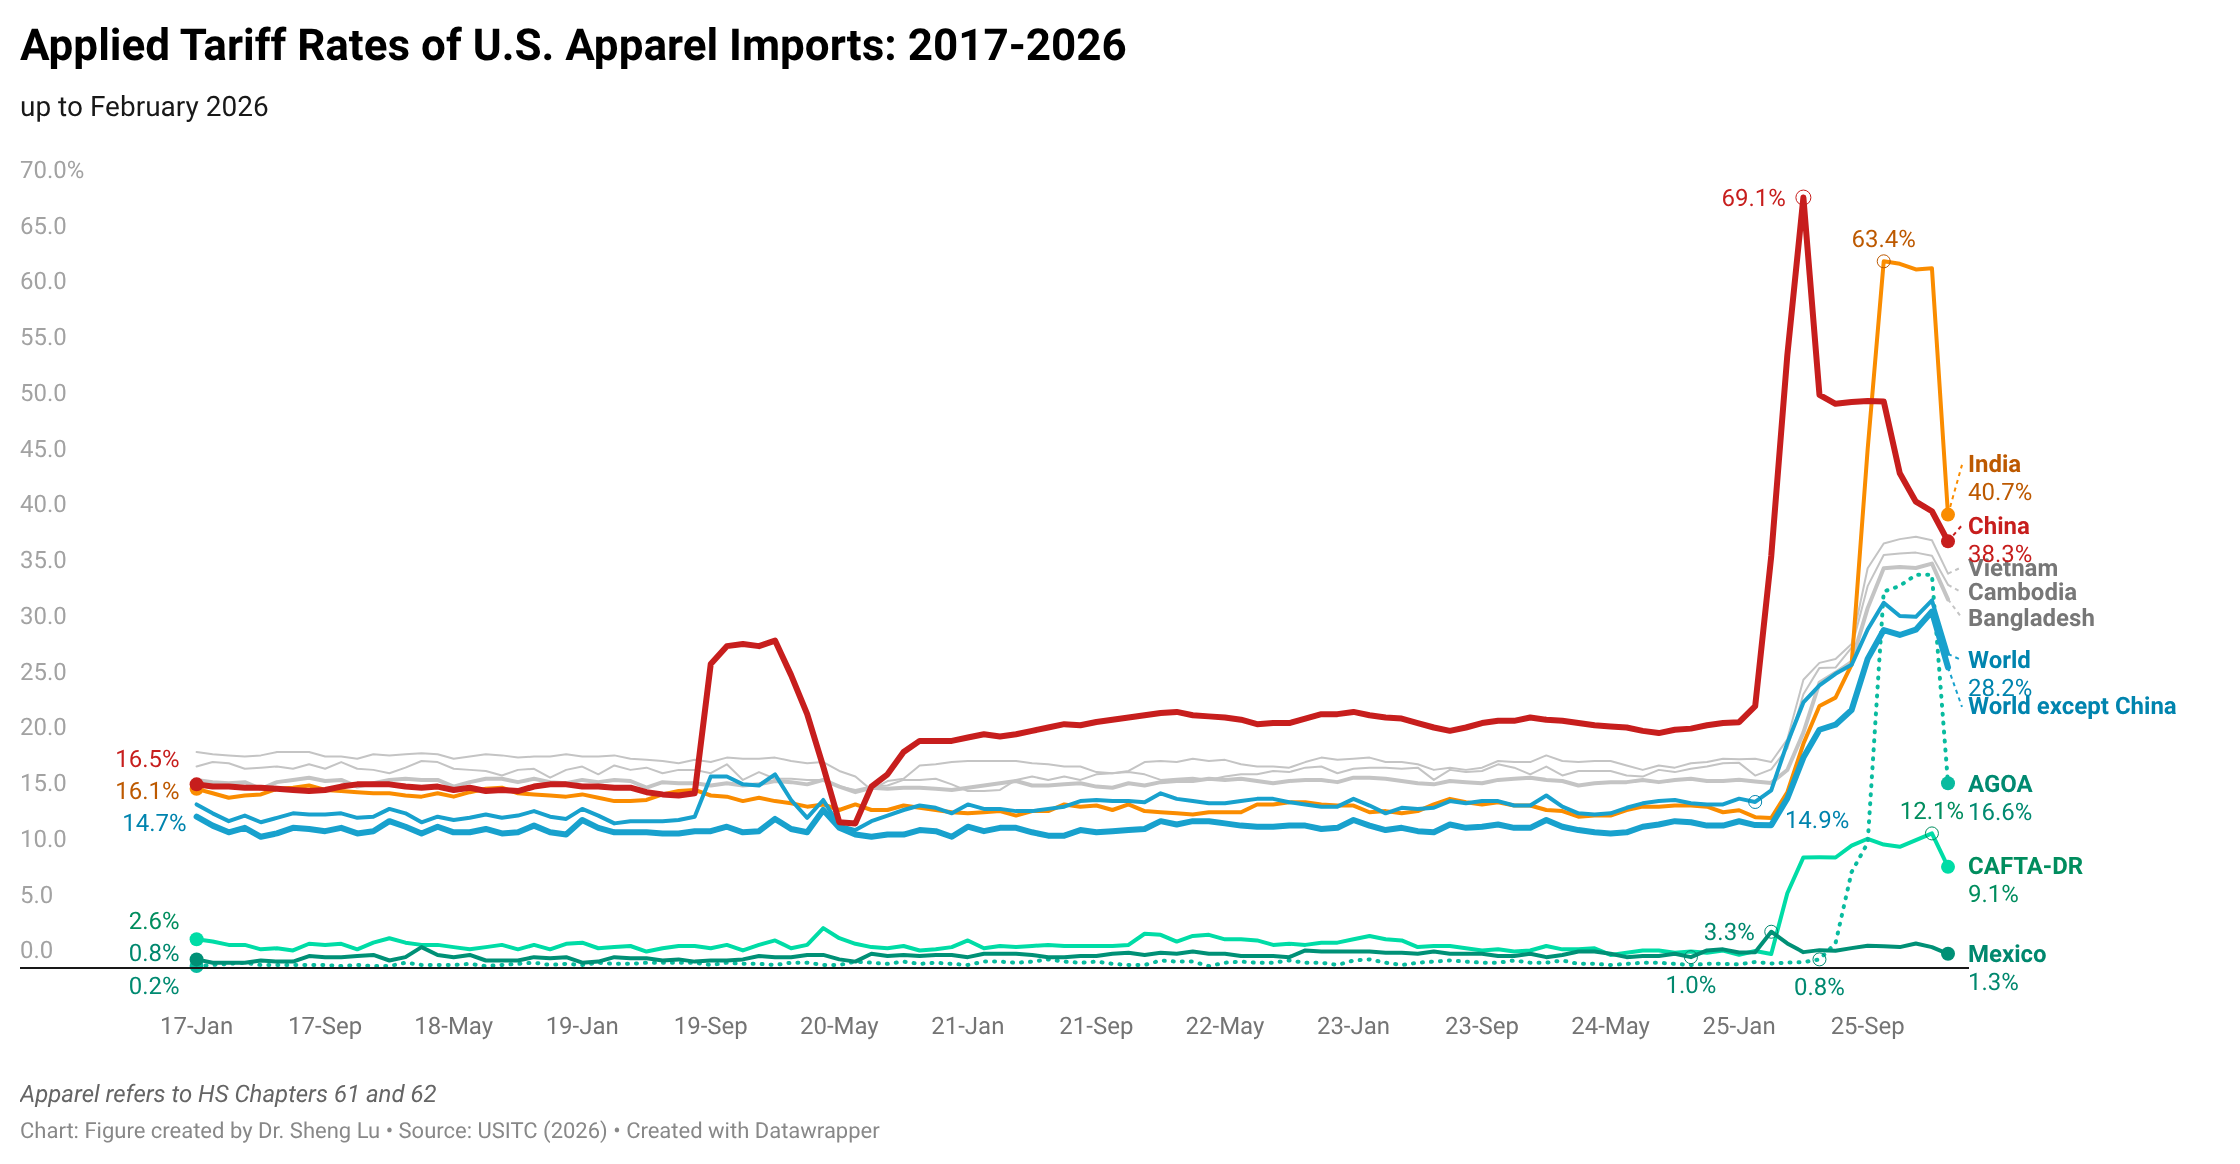
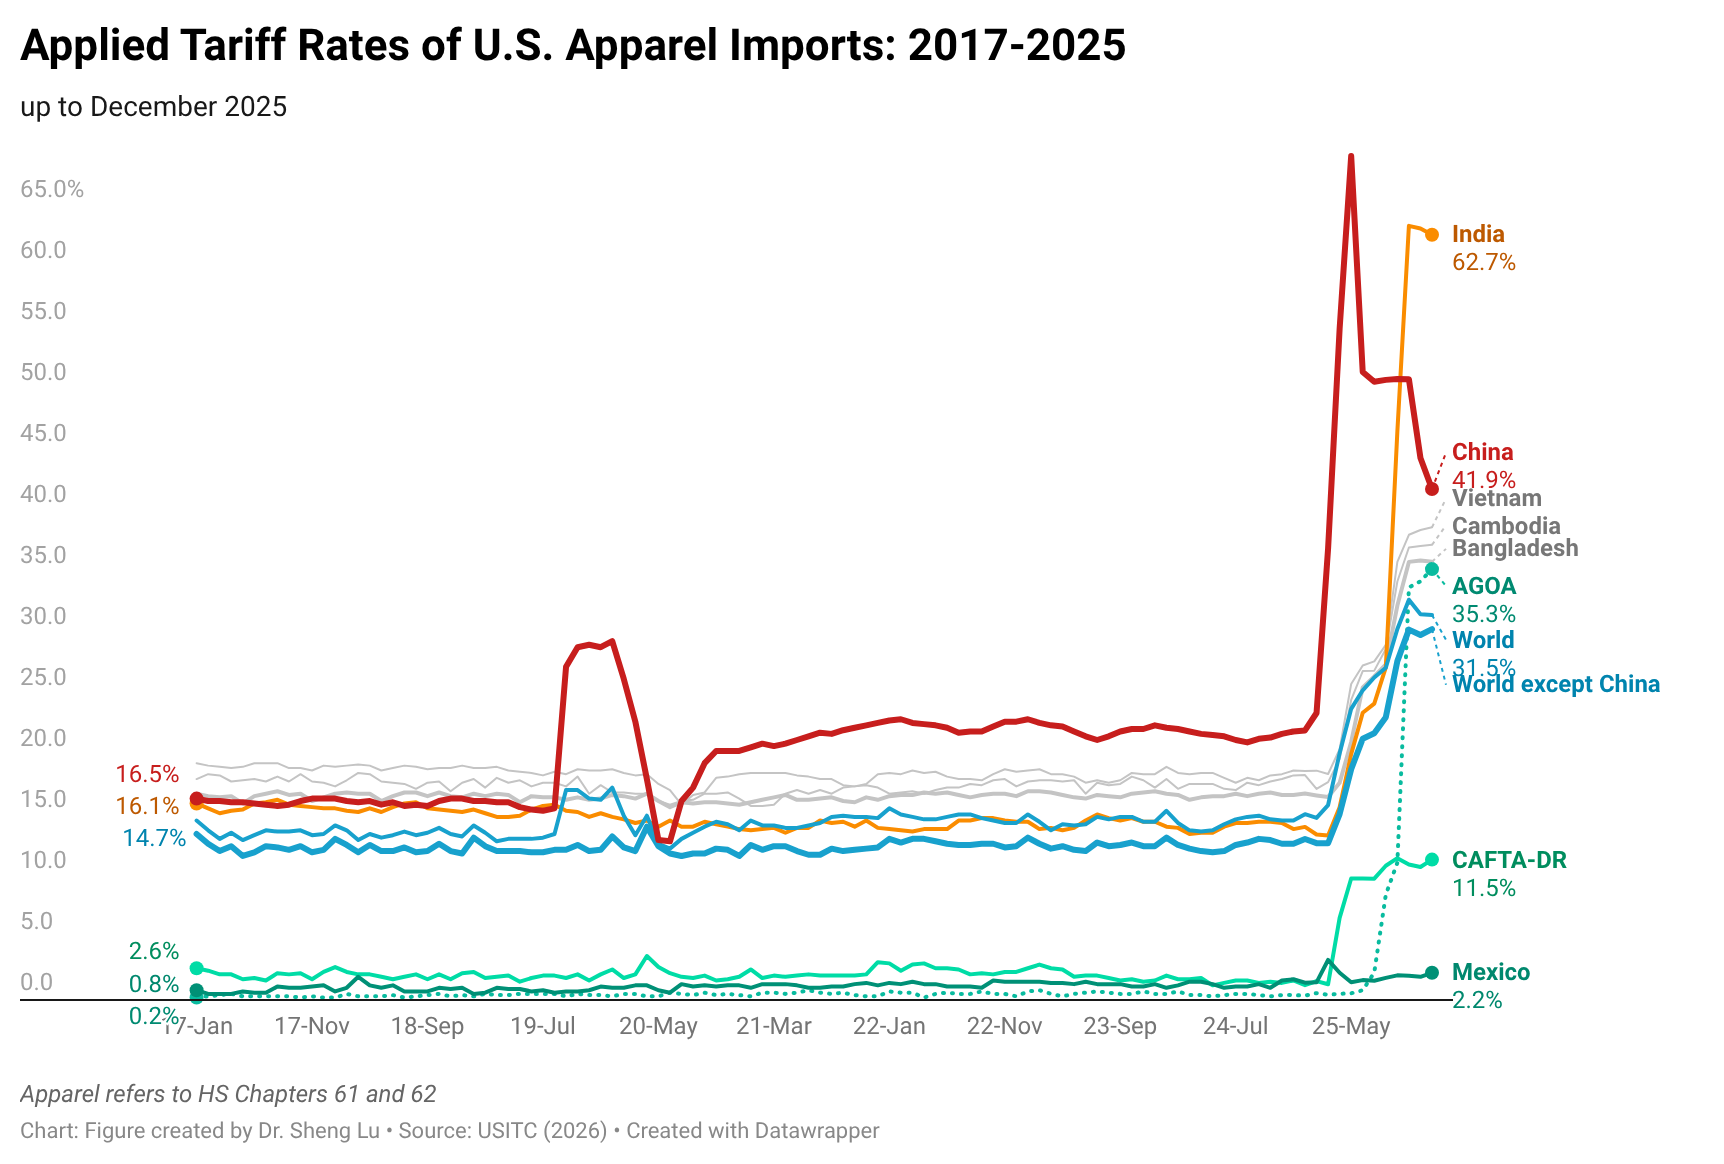
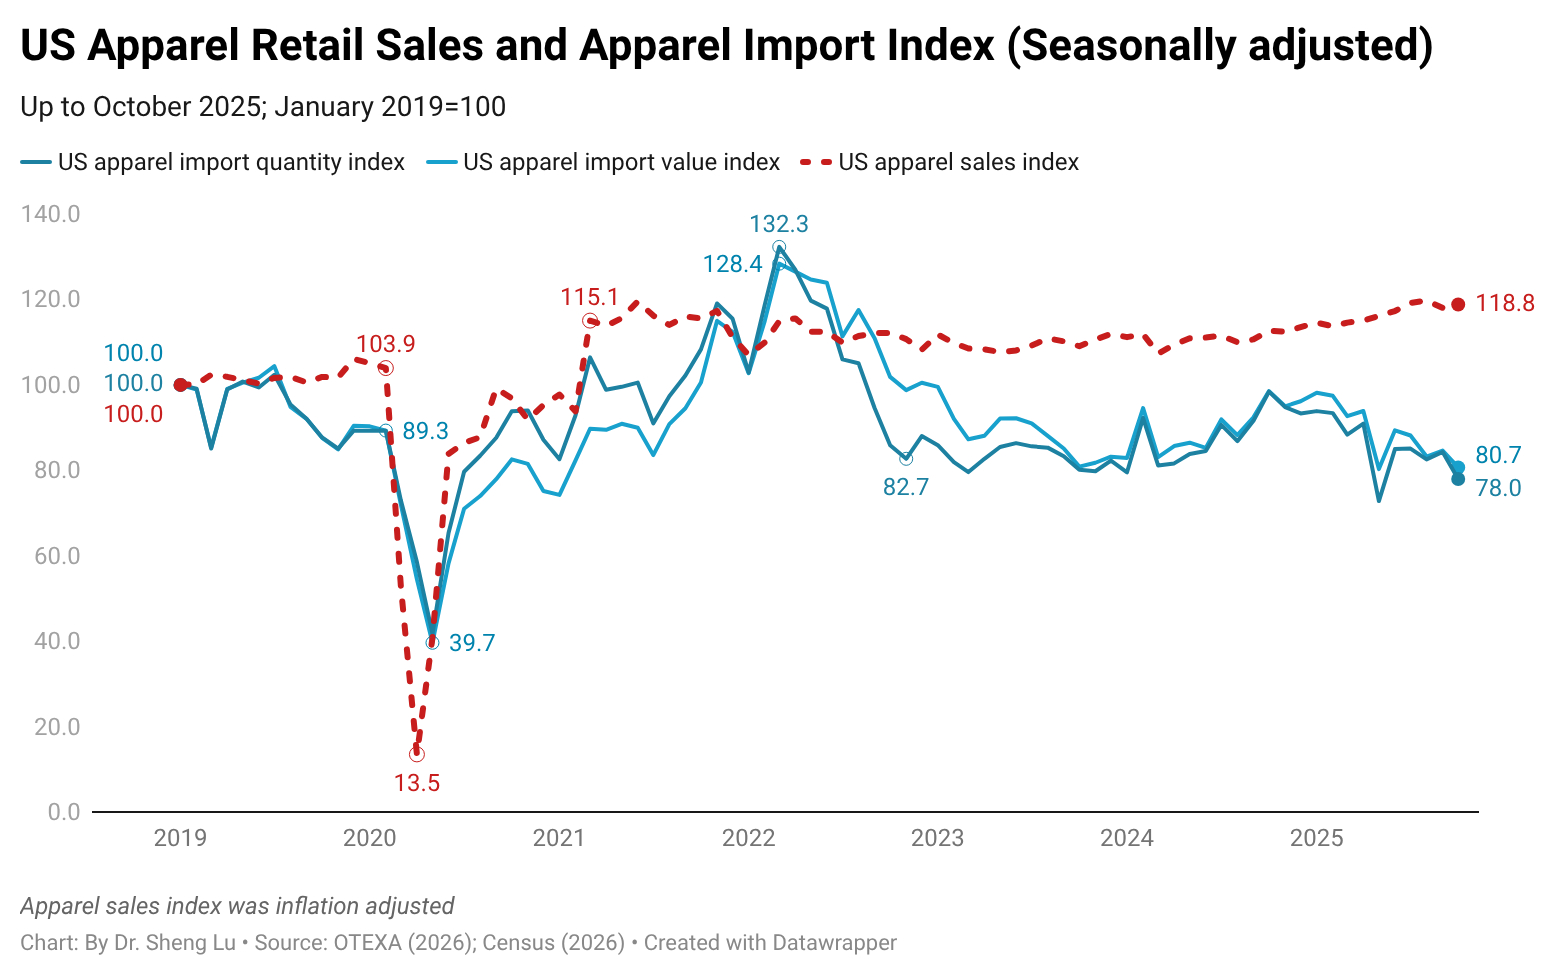
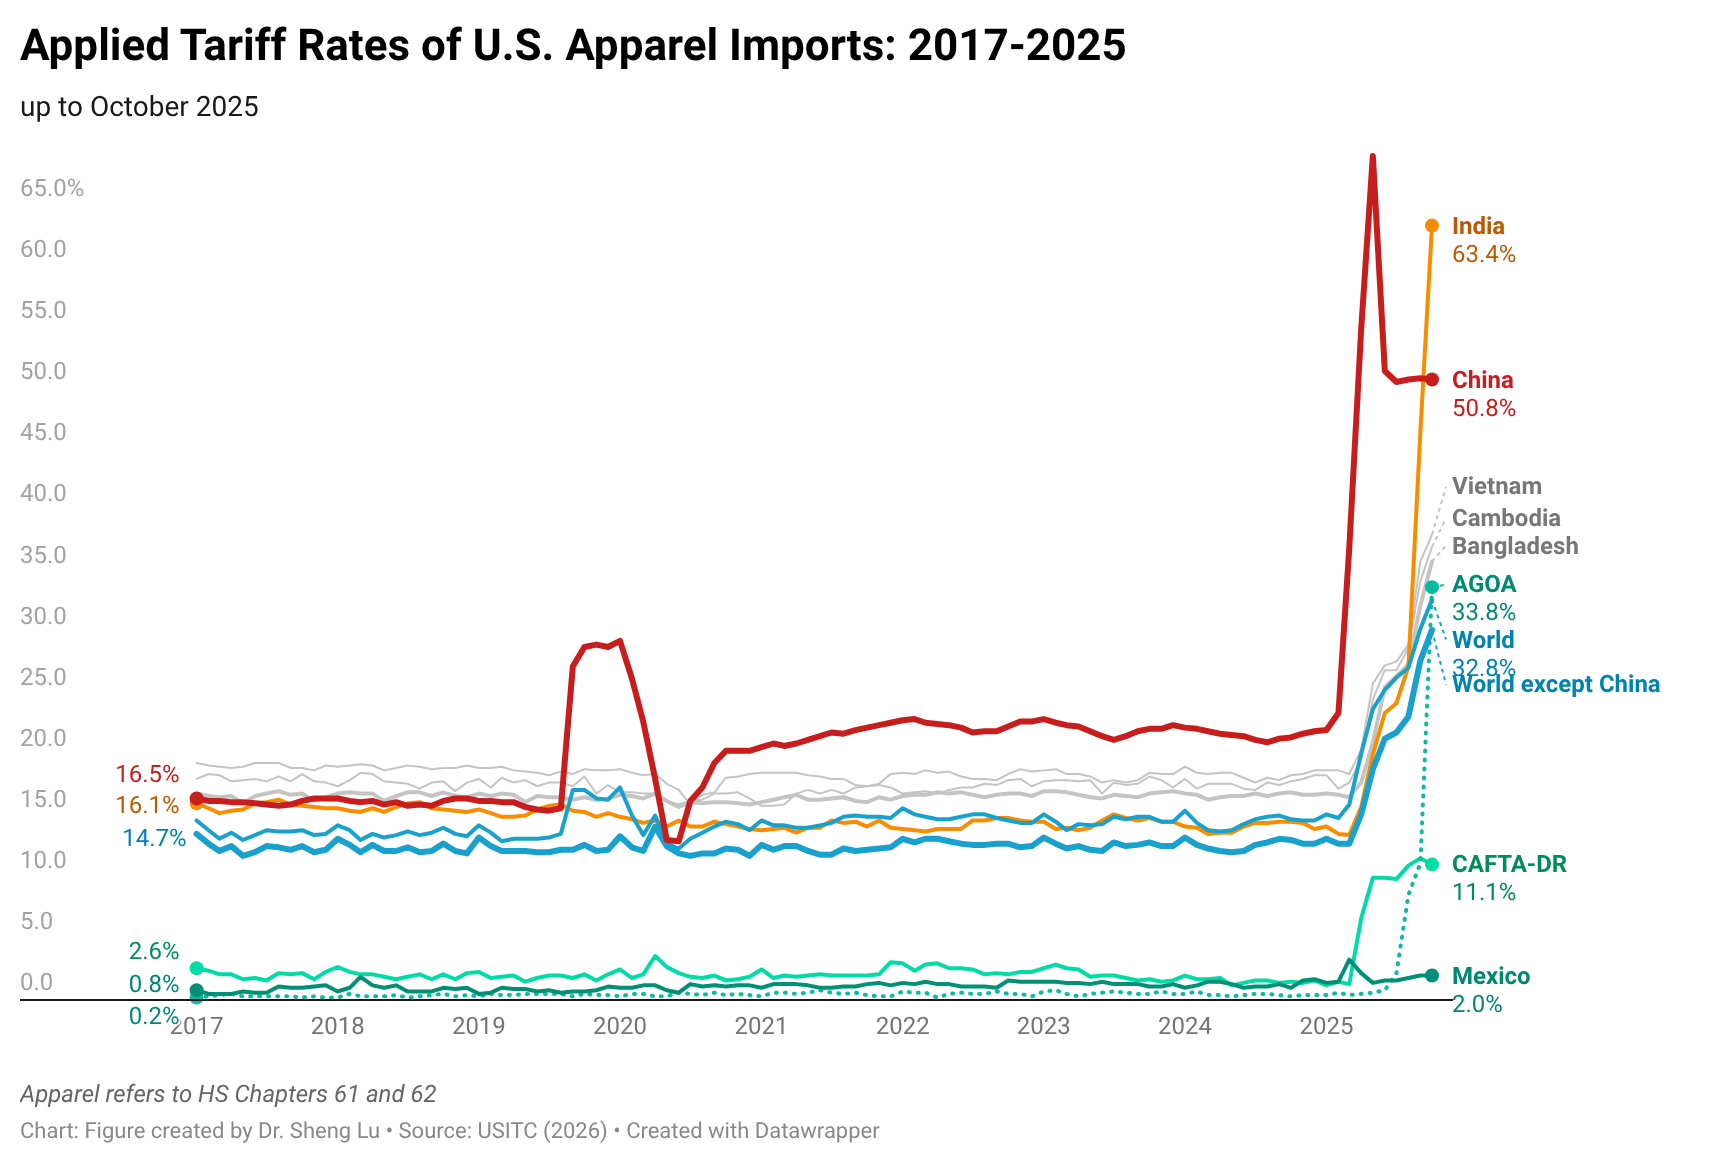
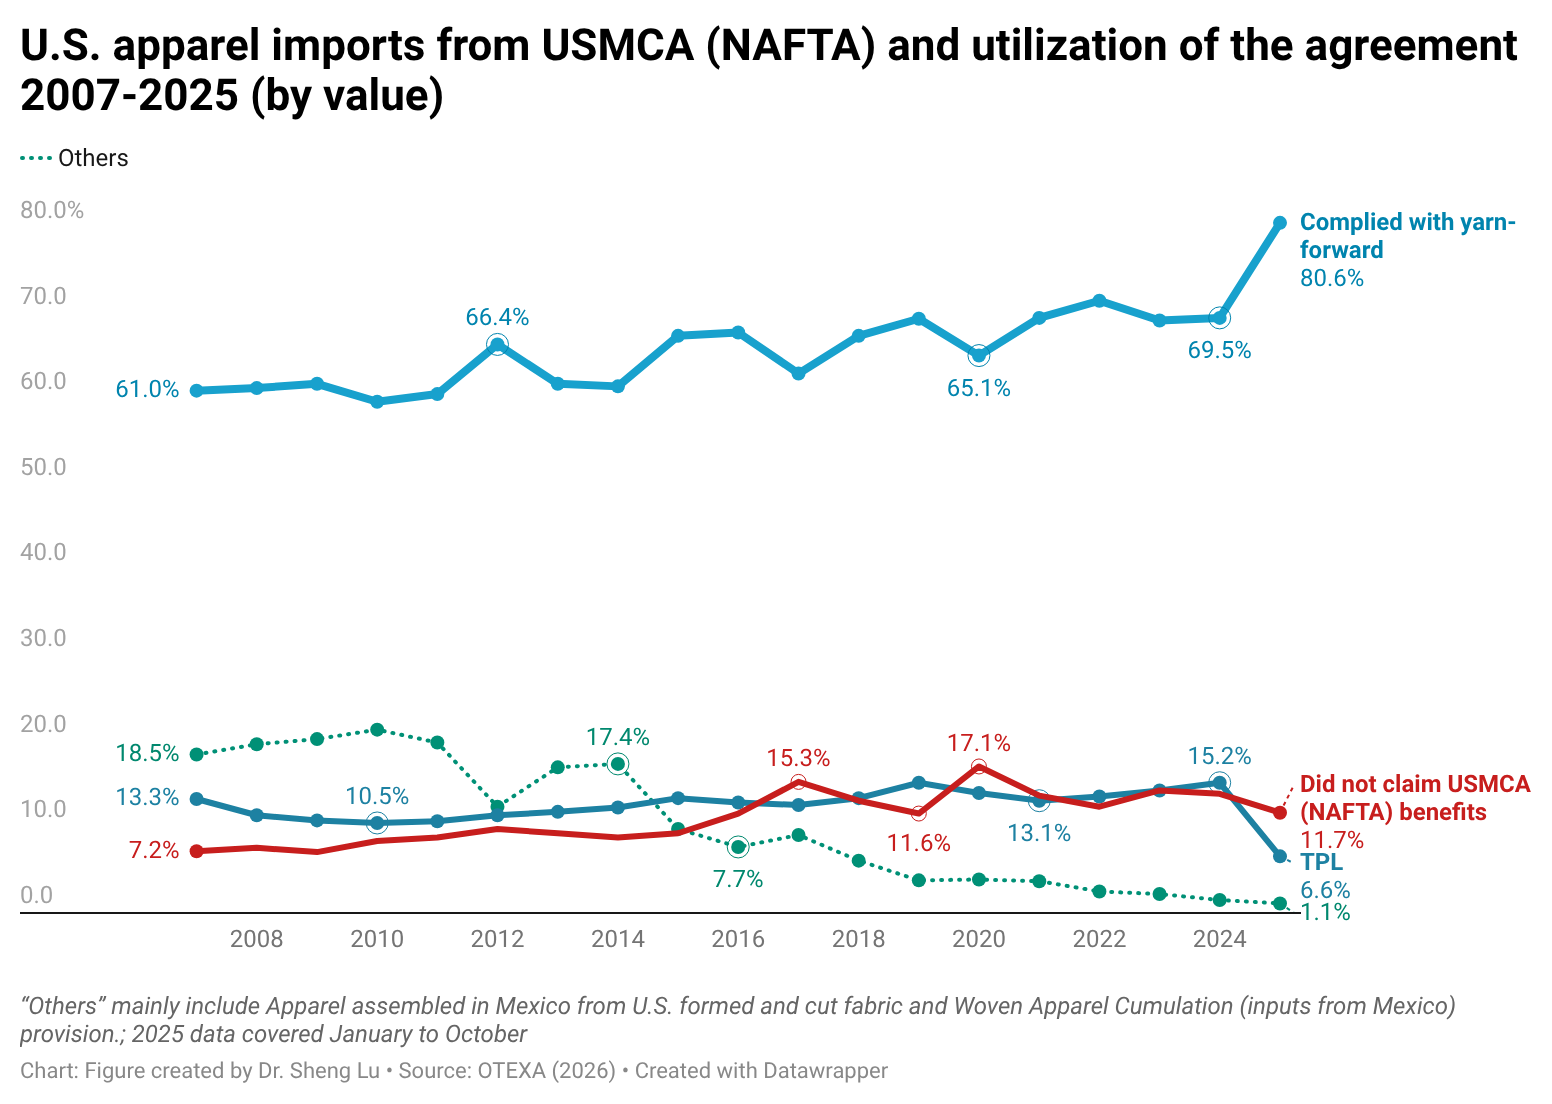
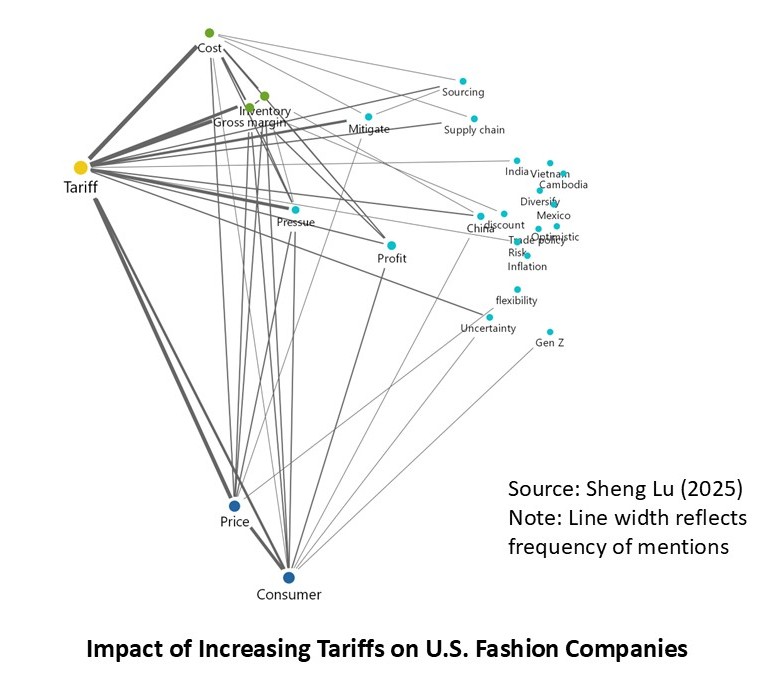
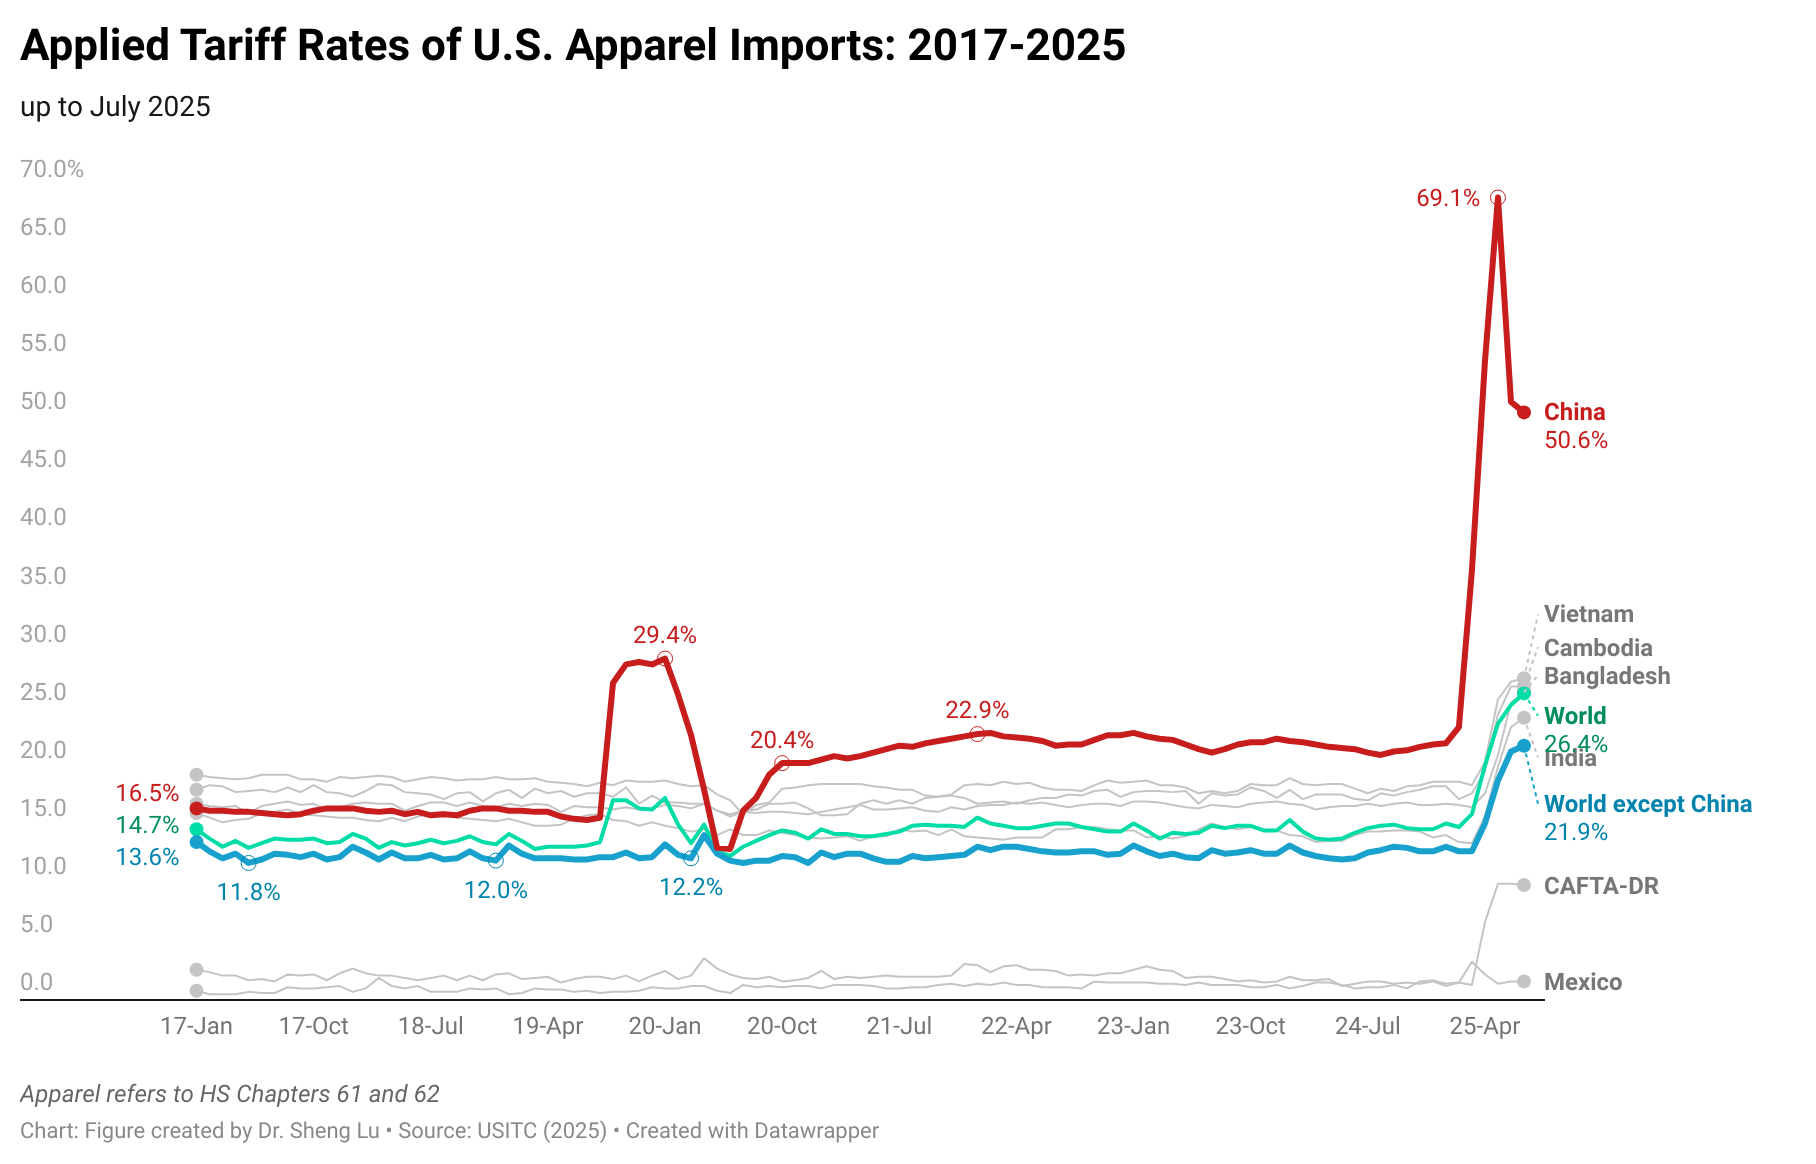
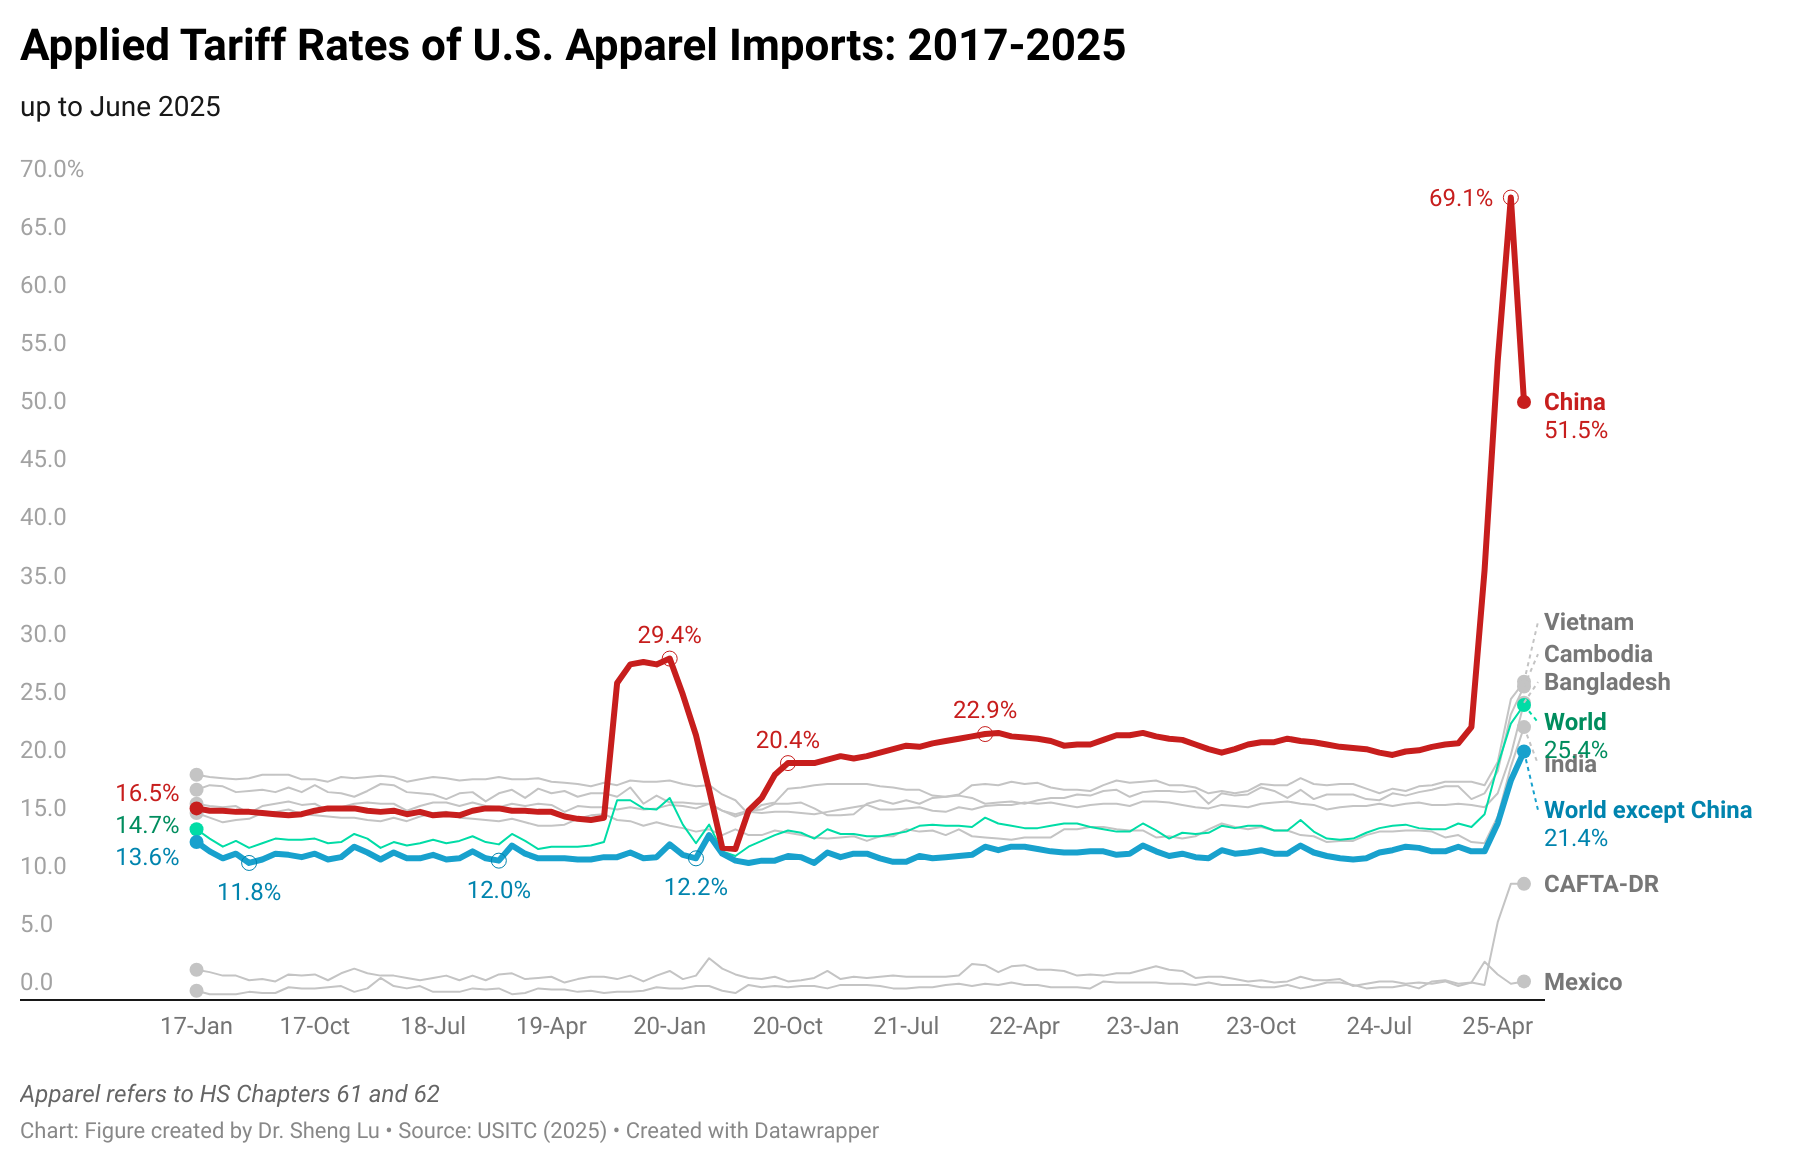
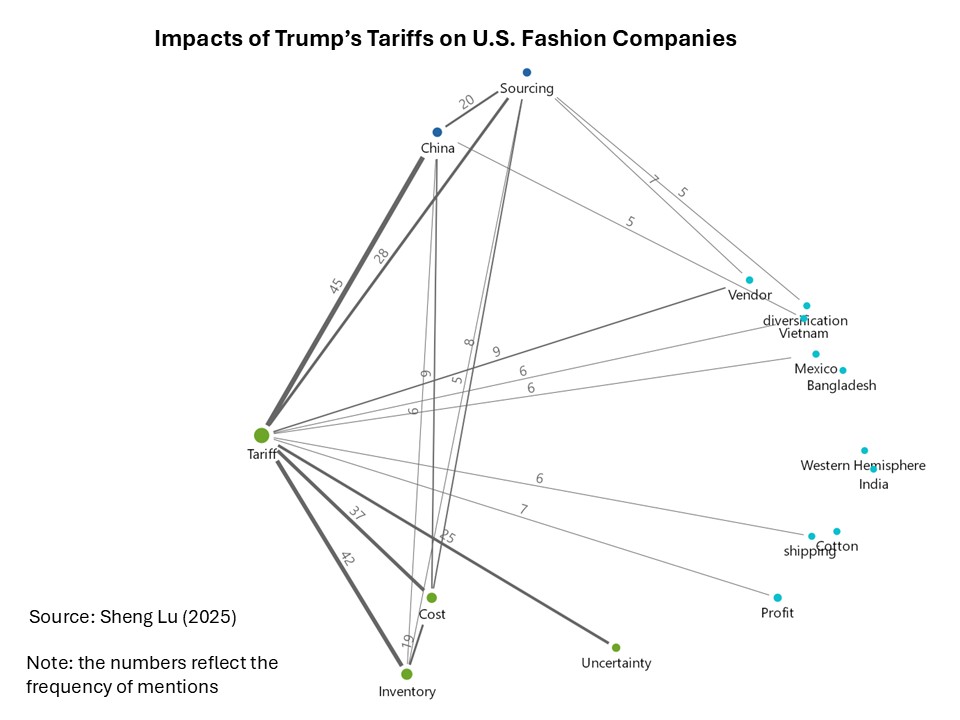
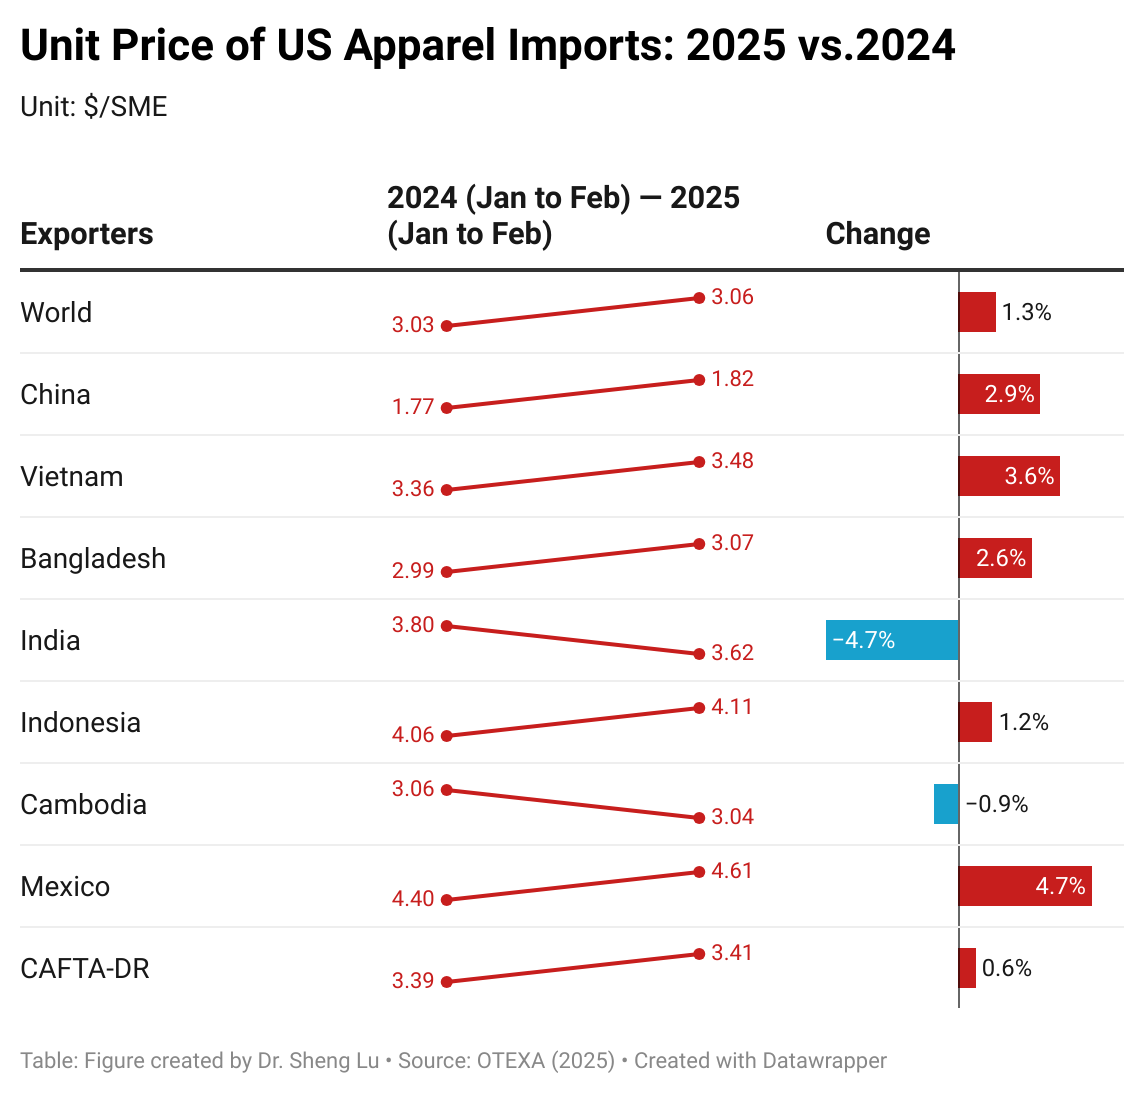
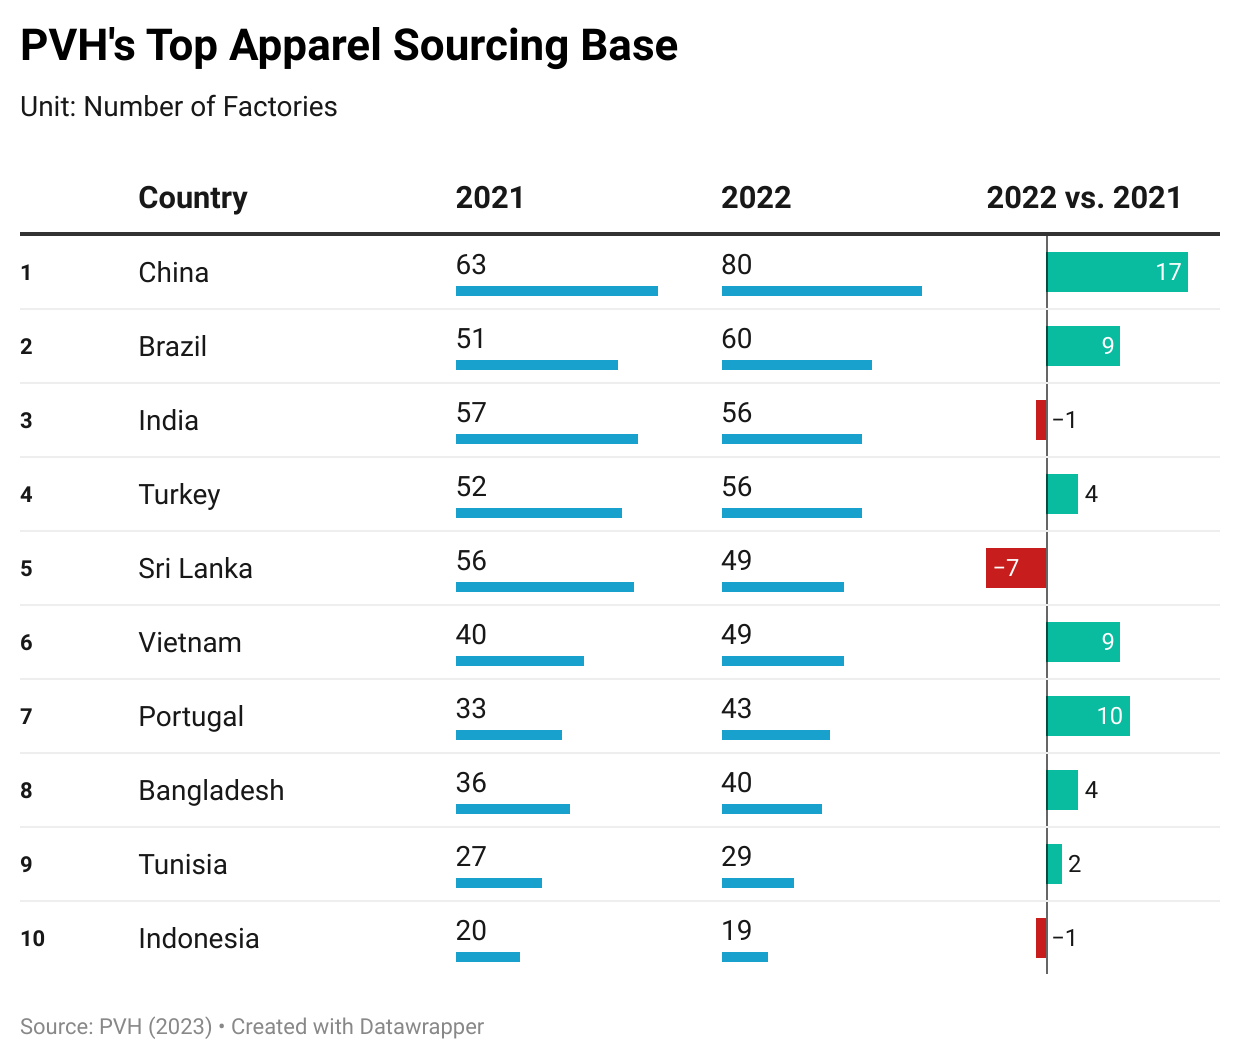
Sheng: How have recent tariffs and policy uncertainties affected home textile production and sourcing? What is your observation?
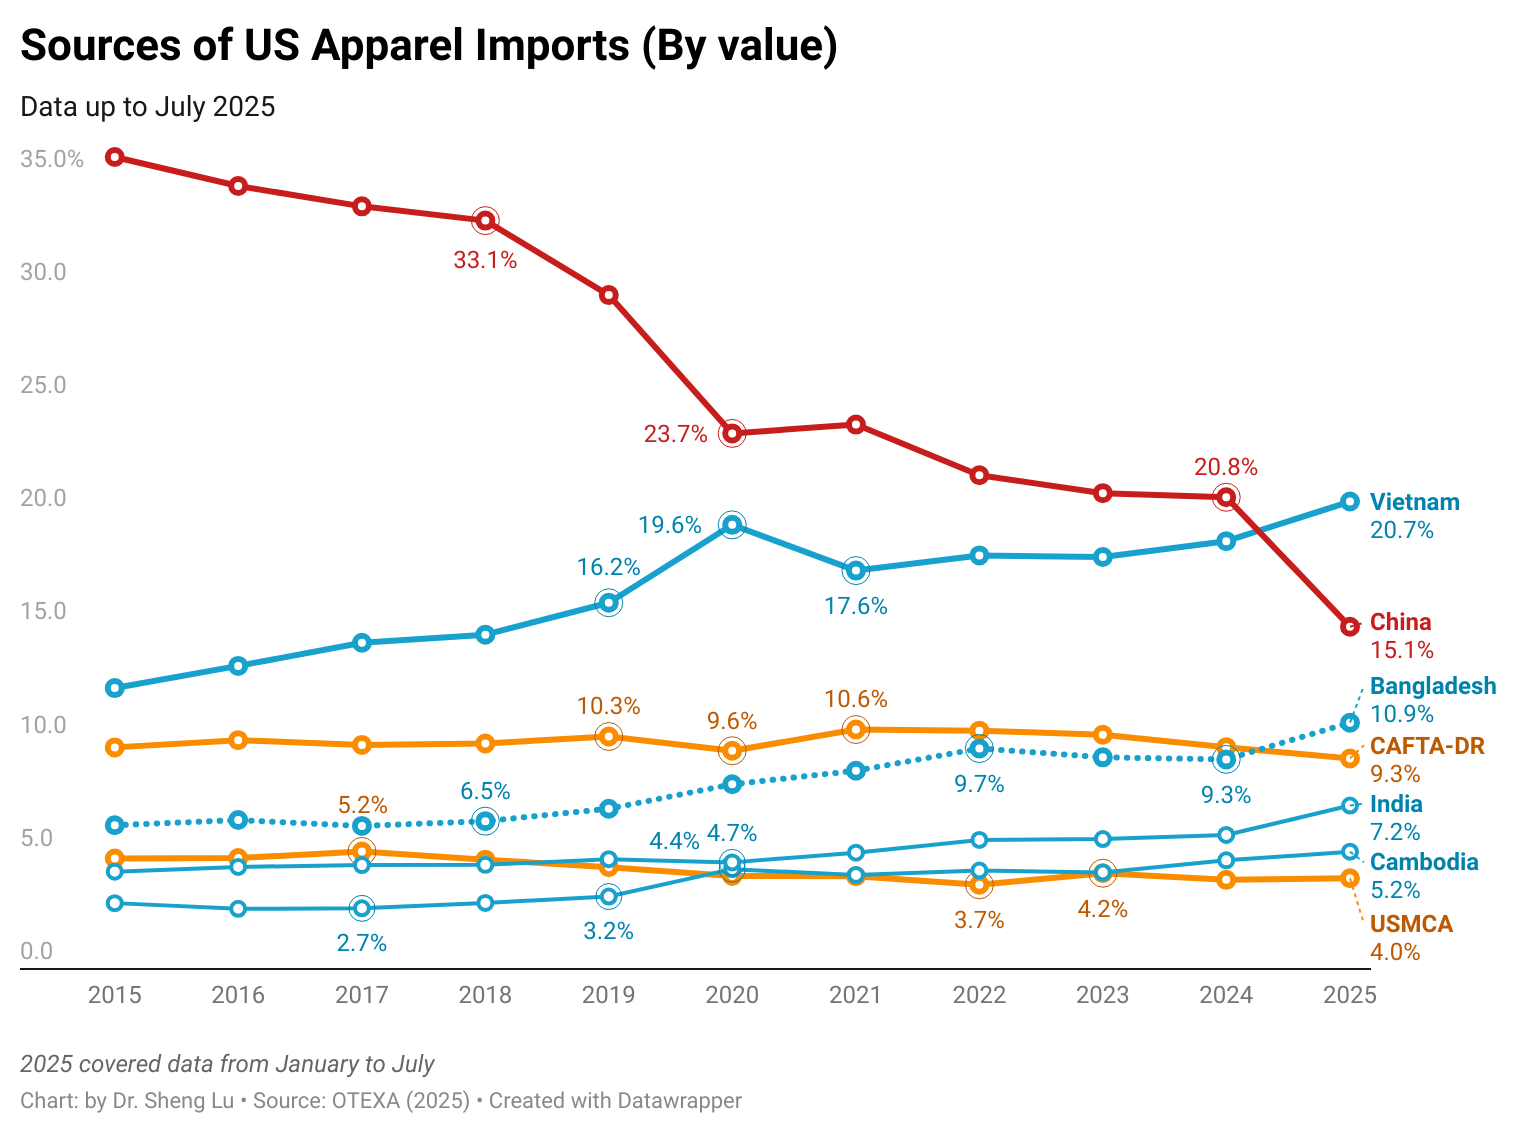
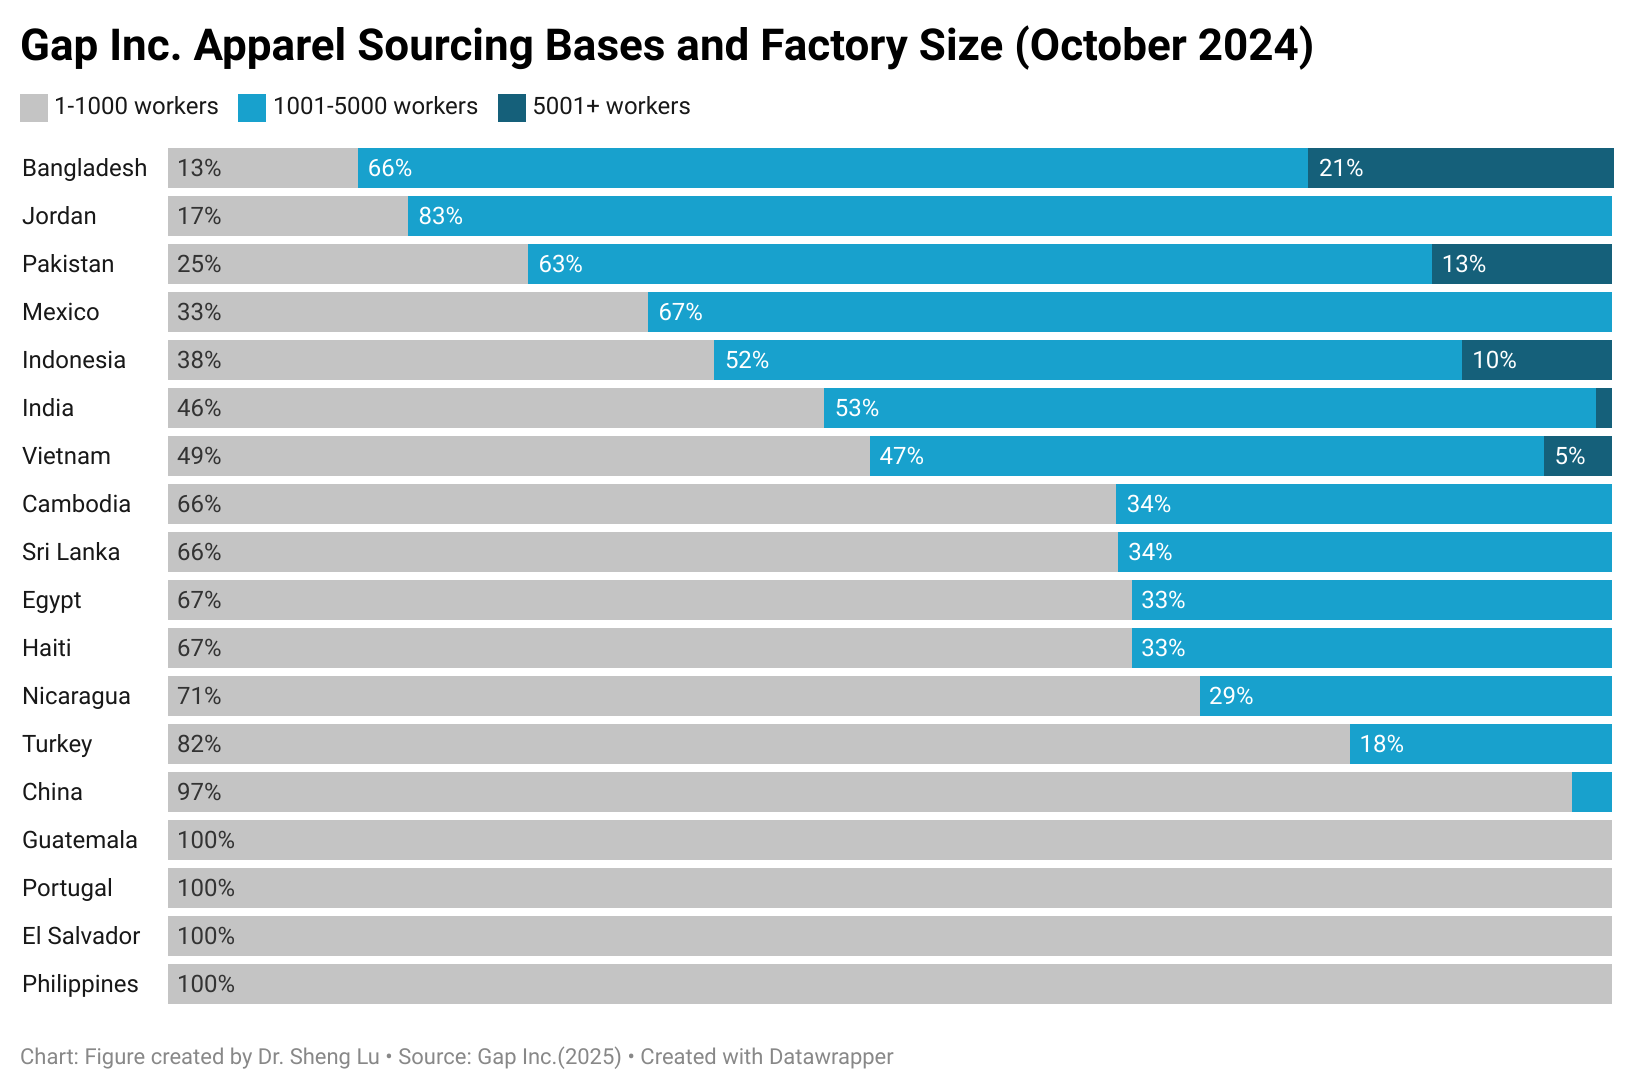
Martha: Unfortunately, the tariffs had a huge negative impact on U.S.-based fashion apparel companies. Many buyers canceled orders from China due to rising costs, prompting companies to explore sourcing options in countries with lower tariff exposure. This shift has been challenging, not only because companies have built strong, long-standing relationships with our manufacturing partners in China, but also because transitioning to new sourcing regions is both time-consuming and costly. It requires extensive research and development to evaluate whether alternative countries can meet our quality, pricing, and production standards.
Sheng: Sustainability is becoming increasingly important in the textile and apparel industry. How is this affecting the home textiles sector and your job? For example, are there changes in materials, sourcing practices, or supplier requirements?
Martha:We are finding that many of our licensors and customers are placing a strong emphasis on sustainability and eco-friendly materials. For example, one major customer (note: a well-known toy brand) only allows us to use 100% recycled polyester for their items and strives for eco-friendly packaging. As a company, we are happy to follow industry trends and advocate for more sustainable materials and practices, even if it could make sourcing and production more complex.
Sheng: Looking ahead, what industry trends will you be keeping a close eye on in the next 1-2 years, and why?
Martha: TikTok (which already seems like old news in 2026) has been one of the biggest game changers for our business. Our products frequently gain traction on the platform, making it an incredibly valuable tool for real-time customer feedback. It’s exciting to see what resonates with consumers to quickly adapt based on those insights. We’ve also introduced TikTok Live events, which have proven highly successful at driving engagement and visibility for our products.
Sheng: Reflecting on your time at UD and in FASH, what experiences helped prepare you for your career? What advice would you give to current students as they plan their career paths, especially in the sourcing field?
Martha: The most influential experiences I had at UD were my involvement with UDress, studying abroad in Paris, and participating in the Summer Scholars program. Each of these opportunities helped shape my perspective, build my confidence, and further define my career path.
My biggest advice is to put yourself out there and take advantage of every opportunity available to you. Try new things, trust your instincts, and don’t be afraid to step outside of your comfort zone. Most importantly, stay committed and work hard. You are all capable of achieving great things!
–The End–
(discussion for this post is closed)


