Chinese Manufacturer to Open $20 Million Garment Factory in the US

mou-signing-between-arkansas-and-suzhou-tianyuan_203804

We all know that China is the single largest supplier of textile and apparel to the U.S. market. But on Oct 20, 2016, Arkansas Gov. Asa Hutchinson announced Tianyuan Garments Company, a Chinese sport apparel manufacturer based in Suzhou, China will invest $20 million to build a new garment factory in the Little Rock area of Arkansas.

Tianyuan, founded in 1998, is a garment maker specializing in the production of casual and sport apparel, including garment for Adidas, Reebok and Armani. With five facilities in China, Tianyuan was named one of the top 100 garment companies in China in 2015. Tianyuan’s annual production rate is nearly 10 million articles and clothing. The company currently supplies 90% of the garments marketed by Adidas, which is the second-largest global sports and apparel maker behind Nike. Tianyuan was also one of several suppliers for the 2014 World Cup and for the Italian Olympic Team in 2016.  

According to the Memorandum of understanding (MOU) signed by Hutchinson and Tianyuan executives, the Chinese apparel giant will hire 400 full-time workers primarily from Arkansas within four years of starting operations in central Arkansas. It is said that these workers will be paid around $14/hour.

As part of the deal, Arkansas offers an incentive package that will include five-year, 3.9% annual tax rebate worth nearly $1.6 million annually. Other incentives include a $1 million infrastructure assistance grant for building improvements and equipment purchases, as well as a $500,000 stipend for worker training.

Arkansas will also help provide assistance in helping Tianyuan get 20 work visas for company executives who will live in Arkansas or travel between the U.S. and China on business related to the Little Rock manufacturing plant. Furthermore, the Chinese garment maker will receive abatement of up to 65% of property taxes from the city of Little Rock and Pulaski County.

Tianyuan is not the only Chinese textile and apparel company that invests in the US in recent years. Back in 2013, Keer Group, a Chinese textile company founded in 1995 and based in Zhejiang, China opened a new facility in Lancaster County, South Carolina as the base of operations for Keer Group’s expansion into the North American market. With $218 million total investment in 5 years, Keer America plans to open one plant with manufacturing capacity of 30,000 metric tons of yarn per year and another plant with 75,000 spindles to make 50 metric tons of yarns daily.

Please feel free to share your thoughts on the following discussion questions:

  1. Why do you think Tianyuan and Keer group decide to open factories in the US? Based on your research, do you think Tianyuan and Keer’s investments reflect a growing trend in the industry or are they just two individual cases?
  2. In your view, are investments made by Tianyuan and Keer group good or bad for the US economy? Why?
  3. What is the business outlook for Tianyuan’s garment factory in the US and Keer America? What are their opportunities and challenges?
  4. Any other thoughts or questions for the case?

[Discussion for this post is closed]

Global Apparel and Footwear Industry (Updated in June 2016)

1

2

The global apparel and footwear industry enjoys a 5 percent value growth in 2015. Asia Pacific remains the world’s largest apparel and footwear market, with market value increased by $30 billion USD in 2015.  In particular, the United States, China and India contributed more than half the absolute increased value.

Market growth in Western Europe remains stagnant in 2015. However, some countries performed better than others. For example, apparel and footwear sales continued to experience significant losses in Greece and Italy with 7 percent and 2 percent declines in 2015, respectively. France didn’t do very well either and size of the French market is expected to contract by $1.5 billion USD by 2020. In comparison, UK, Western Europe’s largest market, posted modest 1 percent growth in 2015. Performance in Germany remained overall stable.

US

The US market continues to perform well with healthy value growth of 4 percent in 2015. However, the performance of key players such as J Crew and Gap, both of which plan to close a significant number of physical stores and lay off employees, highlight the increasingly competitive trading environment. US consumers overall remain cautious and adopt a value- driven approach to buying clothes resulting in a continuous discounting cycle, negatively impacting profit margins and slowing growth for the industry as a whole. From 2013 to 2014, volume growth of apparel sales in the United States exceeded value, primarily due to discounting, the proliferation of fast fashion brands and greater availability of low prices online. However, value growth returned to a more robust position in 2015, as a strengthening economy, improvements in the labor market and rising wages support future growth.

3

Sportswear is maintaining its momentum, increased by 8 percent in market value from 2014 to 2015, faster than any other apparel product categories. Consumers no longer consider sport a task that needs to be checked off on a day-to-day basis but instead it has become a lifestyle. Athleisure remains a heavily prominent trend as more consumers adopt an active and healthy lifestyle, increasing the demand for athletic products that are technically advanced and fashionable. In response to the evolving athleisure trend, major sportswear brands have turned their attention to women’s sports apparel and footwear. With Skechers, Lululemon, Under Armour and Nike reporting growth of 33 percent, 20 percent, 19 percent and 12 percent, respectively, in 2015.

4

Currency weakness, political unrest and tough economic environments continue to result in slowing growth among the emerging markets. However, internet retailing & e-commerce is a spotlight. Apparel and footwear sales through internet retailing grew by 23 percent in 2015 globally and are expected to continue providing impressive growth for apparel brands to 2020. Global mobile internet retailing has grown at a rapid of 92 percent over 2011-2015, highlighting the increasingly vital role mobile is playing within the buying process. Notably, emerging markets are accounting for a significant proportion of growth and are expected to boast a higher market size than developed markets by 2018.

Data source: Euromonitor Passport

A Big Picture of International Trade and the U.S. Economy (updated Feb 2016)

1

1. Trade keeps the US economy growing. Since 1960, trade in the US on average has grown at double the rate of growth of the economy as a whole. Exports of goods and services—produced by businesses employing millions of Americans—are fourteen times what they were six decades ago.

chart 3

2.Trade pushes countries to produce and export what they are relatively more efficient at making. This is called comparative advantage. The US has abundant skilled-labor and has become one of the world’s leading exporters of high-tech machinery, electrical equipment, vehicles and other capital goods. The same can be said for US exports of business, professional and technical services. The chart shows the trend of higher average earnings in manufacturing industries that export more per worker. More broadly, workers producing US exports are higher paid on average, by 16 to 18 percent more than other workers. And by all metrics, exporting industries are generally more productive than non-exporting industries.

chart 4.jpg

3.Imports are essential to US production and exports! Export competitiveness relies on access to high-quality, low-cost imports. US production processes rely on multiple countries forming parts of the supply chain.

4

4. U.S. public opinion on trade has long been divided, although in recent years Americans appear to be more persuaded that the potential gains outweigh the costs. The unequal benefits from growing international trade, loss of manufacturing jobs and the downward pressure on wage level remain the top concerns of trade skeptics.

References:

  1. Council on Foreign Relations (2016) Trading up: U.S. Trade and Investment Policy
  2. Peterson Institute for International Economics (2015). Why International Trade and Investment Are Good for the US Economy: A Story in Eight Charts

JCPenney’s Global Sourcing Practices

JCP sourcing

In the class, we discussed how global U.S.-based apparel companies have become. The typical business model in the U.S. apparel industry today is “producing anywhere in the world and selling anywhere in the world”. Here is one more example: JCPenney.

JCPenney has been importing products from across the world since 1959. The company’s sourcing organization has eight offices globally aside from its office in Dallas. The offices are in Shanghai, Hong Kong, Korea, Bangladesh, Guatemala, Pakistan, India, and Taiwan.

In terms of its future growth opportunities, JCPenney identifies the following three:

  • Omnichannel: Implementing the necessary tools, processes and technologies that enable us to serve the customer no matter how they’re shopping with us. By creating a seamless shopping experience in stores and online, customers are likely to shop and spend more at JCPenney.
  • Center Core: Strengthening and revitalizing the highest traffic area in the store to become a leading destination for women’s shoes, handbags, fashion jewelry, intimate apparel and accessories, which are anchored by two very strong businesses: Sephora inside JCPenney and the Fine Jewelry store.
  • Home: Restoring our Home store to its previous sales productivity with a compelling assortment of value-driven products backed by a promotional strategy that builds customer loyalty and increases traffic.

(Source: JCPenney’s 2014 Annual Report)

What role do you see global sourcing could play in helping JCPenney achieve these strategic development goals? How do you understand the statement that sourcing is part of a company’s overall business strategy? Do you think JCPenney will likely to source more “Made in USA” products in the future? Please feel free to share your views.

U.S. Textile and Apparel Exports in 2013 (Updated in November 2014)

1

U.S. textile and apparel (T&A) exports increased by $543 million (3 percent) to $19.8 billion in 2013. However, because import increased by $3.2 billion (3 percent) to $97.5 billion, U.S. trade deficit in T&A increased rose to $97.5 billion in 2013. Imports supplied about 98 percent of U.S. consumer demand for T&A in 2013.

2

3

Textiles account for 83 percent of all U.S. T&A exports in 2013. Exports of these textiles products (particularly fabrics and yarns) are used primarily as intermediate inputs for finished products manufactured abroad, which are then imported back into the United States (USITC, 2014). In terms of value, specialty & industrial fabrics, spun yarns & thread, felts & other non-woven textiles and other made-up textile articles altogether account for nearly half of U.S. T&A exports in 2013. Statistics further show that U.S. apparel exports also grow fast in recent years. However, it shall be noted that a good proportion of them might be used clothing.

4

5

Mexico and Canada remain the top two largest export markets for U.S. T&A in 2013. 66 percent of U.S. T&A exports in 2013 went to the Western Hemisphere (i.e. North America, Central America, South America, and the Caribbean countries). However, this share has declined from 77.6 percent in 2000. Other leading export markets for U.S. T&A include Honduras, China and Japan.

6

Reference:

USITC (2014). Shifts in U.S. Merchandise Trade. http://www.usitc.gov/press_room/news_release/2014/er1112ll232.htm 

OTEXA (2014). U.S. Imports and Exports of Textiles and Apparel. http://otexa.trade.gov/msrpoint.htm

Japan’s Textile Exports to Vietnam Keep Growing Fast

According to a recent report released by the Textile Outlook International, Japan’s textile and apparel (T&A) exports increased by 9.6% to a five-year high in 2013 (¥763,307 million or $8,571 million USD), added by a sharp depreciation in the value of the yen (Note: Yen or “¥” is Japan’s currency) against US dollar. Specifically, Japan’s textile exports increased by 9.8%, from ¥729,761 million in 2012 to ¥801,450 million in 2013. Japan’s apparel exports rose by 3.7%, from ¥33,546 million in 2012 to ¥34,792 million in 2013. Textiles account for a lion’s share of Japan’s total T&A exports– 95.8% in 2013 and 95.6% in 2012 in terms of value.

1

Statistics also show that Vietnam not only is Japan’s second largest T&A export market, but also is one of the fastest growing export markets for Japan. In 2013, 9.1% of Japan’s T&A exports went to Vietnam (mostly were textiles), increased from 8.5% in 2012. In terms of absolute value, Japans’ T&A exports to Vietnam has also kept growing fast in recent years: 17.1% increase in 2013, 9.7% in 2012 and 27.3% in 2011, much higher than the growth rate of Japan’s overall T&A exports over the same period. Additionally, about 26% of Japan’s textile exports to Vietnam in 2013 were man-made fiber fabrics (SITC 653), followed by special yarns and fabrics (SITC 657) which accounted for 21% in terms of value. This product structure well matches with Japan’s overall textile exports to the world.

2 3

On the other hand, Japans’ T&A exports to the US also grew by 8.1% in 2013, following a 3.2% rise in 2012. Fastest growing category of Japan’s T&A exports to the US in 2013 include blue denim fabric, non-textured filament yarn, wool knitted shirts and blouses and miscellaneous manufactured products made from man-made fibers.

However, the solid performance of Japan’s T&A exports in 2013 “failed to reinvigorate domestic production”. According to the report, Japan’s total T&A exports declined by 2.0% from 2012 to 2013, following a 2.3% fall a year earlier. However, production of miscellaneous textile products in Japan went up 0.6% in 2013.

Questions for discussion:

  • Will Japan further strengthen its ties with Vietnam in T&A production and trade because of TPP?
  • Should the US textile industry care about Japan in the TPP?

Welcome for any comments and suggestions.

Related reading
Lu, S. (2014). Does Japan’s accession to the Trans-Pacific Partnership an opportunity or a threat to the U.S. textile industry: A quantitative analysis. Journal of the Textile Institute. (ahead of print version) 

Lectra Report: The Need for Transformation-An Analysis of the Fashion and Apparel Industry’s Evolution

Lectra

As the saying goes, change is the only constant in the fashion apparel industry. According to a newly released market report by Lectra*, “the pace of fashion has never been faster and neither has the pace of change”.

Lectra’s report highlights a few factors driving the changes in the fashion apparel industry:

1. Consumers

Consumers has much more control than in the past, implying the fashion industry can no longer define what to make and sell without taking consumers’ inputs into consideration. Some companies have alter their business models to be completely demand-driven, i.e. allowing integrating all their resources to meet the customized needs of all consumers.

Social and economic changes like internet access and growing prosperity, have also spurred the growth of new fashion markets in emerging countries that had typically been only supplier region, creating new opportunities for western fashion brands and retailers to expand business.

1

2. Globalization

Historically, local brands dominate local market. However, because of the strategies of geographic expansion and international growth of many fashion brands, in more and more markets, local brands have to face competition from foreign brands. (for example: the Australian fashion industry is worried about the competition from H&M).

But globalization does not reduce diversity and localized consumer preferences. On the contrary, increased internationalization means that populations are more heterogeneous than in the past and retailers have to bring a localized response to individual markets.

3. Technology

New social media and mobile technologies have given consumers the power of instantaneous sharing and buying without restriction of time, place and in many cases, price. The availability of new technologies such as RFID, product life cycle management (PLM) and many other supply chain management tools have also enabled brands, retailers and manufacturers to reduce product development cycle, improve efficiency and better collaborate across the global process.

For example, digital prototyping gives companies the agility they need to adapt to changes in the market and test new products before they start to incur real production costs. PLM facilities the collaboration between design and development departments and breaks the silo mentality that has reigned for so long in the fashion and apparel industry, eliminating bottle- necks that resulted from outdated linear processes and increasing decision making power earlier on in product development.

4. Change of Business models**

In response to the application of new technologies and consumers’ updated demand, companies start to seriously reconsider their business models, especially the process of design, product development, production and distribution. As noted in the report, fashion brands, which have traditionally gone through retailers who sell on their behalf, have developed retail operations with the purpose of capturing a higher percentage of the final sale price and achieving complete control over the presentation, distribution and final price of their merchandise. Many retailers, however, also start to offer more and more private brands and exclusive products that can more effectively segment market and attract targeted consumers.

The traditional manufacturers are also looking for ways to cut costs and increase efficiency because of the pressure from retailers/brands. Manufacturers also have realized that selling directly to the end consumers is the most powerful way to protect revenue. As quoted by the report, roughly 60% of Chinese apparel manufacturers have launched their own brands. Armed with all that know-how, a growing number of Chinese manufacturers are now turning their efforts toward developing an offer for the domestic market and some are even setting their sights abroad. (recall the topic of “upgrading” in our lecture)

2

*: Lectra is a company which provides fashion-focused technology solutions such as the CAD system and the product life-cycle management (PLM) system.

Unleashing Fashion Growth City by City

According to a recent study conducted by McKinsey, the global women’s apparel market growth rate is forecasted to increase by 50 percent over the next 12 years, largely driven by the increasing weight of emerging markets such as China and Russia. Historically, the global women’s apparel market has grown at just over 3 percent per year; However, by 2025 the growth rate is expected to approach 5 percent per year. By 2025, women’s apparel is expected to account for 55% of global apparel sales and 60% of sales growth.

1

For fashion players, cities are mattering more than any other product category. Top 600 growth cities will account for 62% of women’s apparel market’s growth by 2025; and 16 out of top 20 growth cities are from the emerging markets, adding an additional $100 billion to the global women’s apparel market.

2

However, when looking at total size, mature-market cities will still have half the women’s apparel market worldwide, according to McKinsey. Particularly, growth in the luxury markets is still heavily dependent on the mature market, where 70 percent of top growth cities are located.

3

With the help of city level analysis, rather than discussing Europe or Asia as alternative destinations, or even the U.K. versus France, companies can now ask themselves, “in what 10 key cities should we next establish a strong presence?”

Exclusive Interview with William L. “Bill” Jasper, Chairman & Chief Executive Officer, Unifi Inc.

Bill Jasper

William L. “Bill” Jasper has been Unifi’s Chairman of the Board since February 2011 and has served as Unifi’s Chief Executive Officer (CEO) and member of Unifi’s Board of Directors and the Company’s Executive Committee since September 2007. Prior to his role as Chairman of the Board, he served as President and CEO, Vice President of Sales and General Manager of Unifi’s polyester division. He joined the company with the purchase of Kinston polyester POY assets from INVISTA in September 2004. Prior to joining Unifi, Mr. Jasper was the Director of INVISTA’s DACRON® polyester filament business. Before working at INVISTA, he held various management positions in operations, technology, sales and business for DuPont since 1980.

Bill Jasper is also a University of Rhode Island alumni! He graduated in 1977 with a Master of Science in Mechanical Engineering.

Founded in 1971 and Headquartered in Greensboro, NC, Unifi, Inc. is a leading producer and processor of multi-filament polyester and nylon textured yarns. Unifi provides innovative, global textile solutions and unique branded yarns for customers at every level of the supply chain. Unifi’s core business consists of the manufacturing of POY (partially-oriented yarn), the texturing, air-jet texturing, twisting, and beaming of polyester and the texturing and covering of nylon filament yarns. Branded products of Unifi include aio® — all-in-one performance yarns, SORBTEK® A.M.Y.®, MYNX® UV, REPREVE®, REFLEXX®, INHIBIT® and SATURA®, which can be found in many products manufactured by the world’s leading brands and retailers.

Interview Part

Sheng Lu: How would you describe the current status of the U.S. textile industry? What’s your outlook for the industry in the next 5 years? What are the top challenges the U.S. textile industry is facing?

Bill Jasper: The industry has undergone a revival after years of decline, so the current status is strong and I believe we’ll see that environment continue for several more years in this region. The industry is expanding in practically every key economic indicator, including output, employment, exports and investment.

  • U.S. textile shipments topped $56 billion in 2013, up more than 5% from 2012
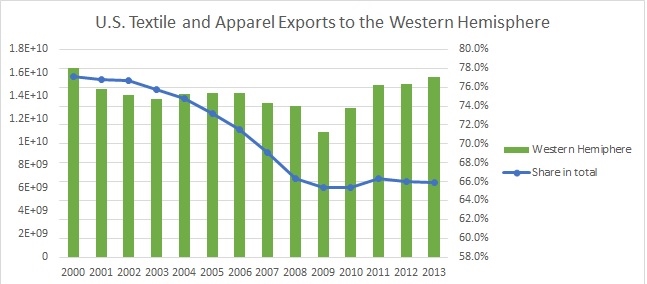
  • U.S. textile exports were $17.9 billion in 2013, up nearly 5%
    • The U.S. has also enjoyed an investment surge in new plants and equipment. Over the past year, 8 foreign companies have made public announcements regarding their intention to invest more than $700 million in new U.S. textile facilities and equipment. These investments are projected to provide approximately 1,900 new jobs in North Carolina, South Carolina, Georgia and Louisiana.
    • This $700 million does not include the ongoing re-investment activities that domestic textile companies have made.

The U.S. industry is also benefitting from several domestic advantages, including reliable and relatively inexpensive energy supplies, infrastructure, access to raw materials, and proximity to markets. We are gaining competitive advantages due to conditions outside the U.S., including rising costs in Asia, high shipping costs, and port capacity restraints. In addition, you’ve probably seen Wal-Mart’s advertising and P.R. blitz that it is committing to buy hundreds of billions of additional dollars in American-made products over the next decade to help support and spur U.S. manufacturing and innovation. With Wal-Mart leading the way, there is definitely a movement afoot to “reshore” some U.S. manufacturing, including textiles and apparel.

Finally, I believe a major driver of recent investments and one of the biggest contributors to the renaissance described above is also one of the biggest challenges the industry is facing. Virtually all of our free trade agreements to date have been based on a yarn forward rule of origin. This means that all processes, including the yarn extrusion, spinning, texturing, fabric formation, and the dyeing, finishing and assembly of the finished garment must take place in a free trade agreement member country to receive duty-free benefits. This rule has benefited the U.S. industry especially in NAFTA and DR-CAFTA, as U.S. yarn and fabric producers have dramatically increased our exports to the region under this regime.

As the U.S. negotiates the Transpacific Partnership Agreement (TPP), if this same rule of origin is undermined by single transformation rules or other loopholes, it could erode the entire supply chain in this hemisphere. In addition, careful attention must be paid to market access for potential TPP members like Vietnam, who is already the second largest exporter of textiles and apparel to the U.S. The domestic industry has requested reasonable duty phase-out periods in market access for our most sensitive products under the TPP so that our partnerships in this region have an adequate adjustment period. The TPP is considered to be the model for all future trade agreements with the U.S., thus it is critically important that our negotiators consider the profound consequences it can have on U.S. jobs and the U.S. textile industry.

Sheng Lu:  “Made in USA” is a very hot topic these days, yet we also live in a globalized world today. From the textile business perspective, what is the relationship between “Made in USA” and “going global” in the 21st century? Do US textile companies today still have to make a choice between the two?

Bill Jasper: Most apparel brands and retailers utilize a balanced sourcing strategy that incorporates production in this hemisphere, as well as Asia, Africa, or other global manufacturing and/or assembly. I do not feel that U.S. textile producers today must necessarily make a choice between the two, but must have a business plan that addresses the realities of the global market. In fact, nearly 98 percent of the clothing purchased in the U.S. is imported from abroad. Only two percent of clothing bought in this country is manufactured here in the U.S., and I doubt there is a business plan in any U.S. textile company that doesn’t reflect that reality.

Unifi, for example, works with downstream customers who want research and development, innovation, speed to market, sustainability, etc., from yarn and fabric production in this hemisphere. It is important that we provide flexibility and these same innovative products anywhere in the world our customers choose to do business. Thus, we export yarn to more than 30 countries from our domestic plants (not counting the exports of fabric from domestic weavers and knitters that use our inputs). Unifi also operates a wholly-owned subsidiary in Suzhou, China, where we focus on the development, sales and service of Unifi’s premium value-added yarns for the Asian market. Our expanding network of manufacturing facilities, sales and sourcing initiatives enables us to drive and capture growth in every major textile and apparel region in the world.

Sheng Lu: We know many products of Unifi are textile intermediaries like fibers and yarns. So how is Unifi’s brand promoted? How much can consumers recognize your product as “made in USA”?

Bill Jasper: As an upstream producer, making that connection with the ultimate consumer can be a challenge. Unifi has succeeded on several fronts. We have differentiated our product offering with premium value-added products, like REPREVE®, which we supply to our global customers wherever they are producing. Our downstream sales and marketing teams work extensively with brands and retailers to help them promote the unique properties of Unifi fibers and yarns. Some ways we do this includes, on product-labeling, hangtags, point of sale, cobranding, advertising and various consumer promotions. The “Made in the USA” message is and can be part of this effort, and I think we’ll see more demand for that as the brands and retailers move more of their sourcing from Asia back to this hemisphere over the next few years.

We recently began marketing directly to the consumer through the launch of our REPREVE #TurnItGreen campaign, which focuses on raising awareness around the importance of recycling and the products that can be created from plastic bottles when they are recycled. The initial launch took place at ESPN’s X Games Aspen in January 2014, where we literally and figuratively helped turn the event green using REPREVE-based product and color. At X Games Aspen, we recycled more than 100,000 plastic bottles to make X Games signage, lanyards and other merchandise. As we grow the REPREVE brand at retail and in the consumer space, we will continue these efforts with various partners, including current partners who have joined the REPREVE #TurnItGreen initiative, including NFL team, the Detriot Lions, where we will recycle more than 200,000 plastic bottles to help turn their stadium green on December 7th, 2014. We’re also driving recycling education by helping turn the live action event, Marvel Universe Live!, green through apparel for the cast and crew, merchandise items and banners, all made with REPREVE recycled fiber.

Sheng Lu: Unifi has opened factories in Brazil and Colombia. Why did Unifi decide to invest in South America? What is the connection between Unifi’s US-based operation and your operations in South America?

Bill Jasper: Both of these manufacturing plants were established in the mid to late 90s as wholly owned subsidiaries of Unifi, Inc. We purchased the small Colombia plant to give us more spandex covering capacity for our yarns that come back to the U.S. for use in pantyhose and socks. The Brazil operation was set up when we saw an opportunity to capture a share of the growing synthetic apparel market in that country. The majority of the textured polyester we make in Brazil stays in Brazil. Over the past several years we have introduced our premium value-added yarns in that market and hope to see strong growth in those product lines as the economy picks up down there.

Unifi also opened a 120,000 square foot polyester yarn texturing facility in El Salvador in 2010 to take advantage of the duty benefits in the DR-CAFTA trade pact and to better serve our growing customer base in the region.

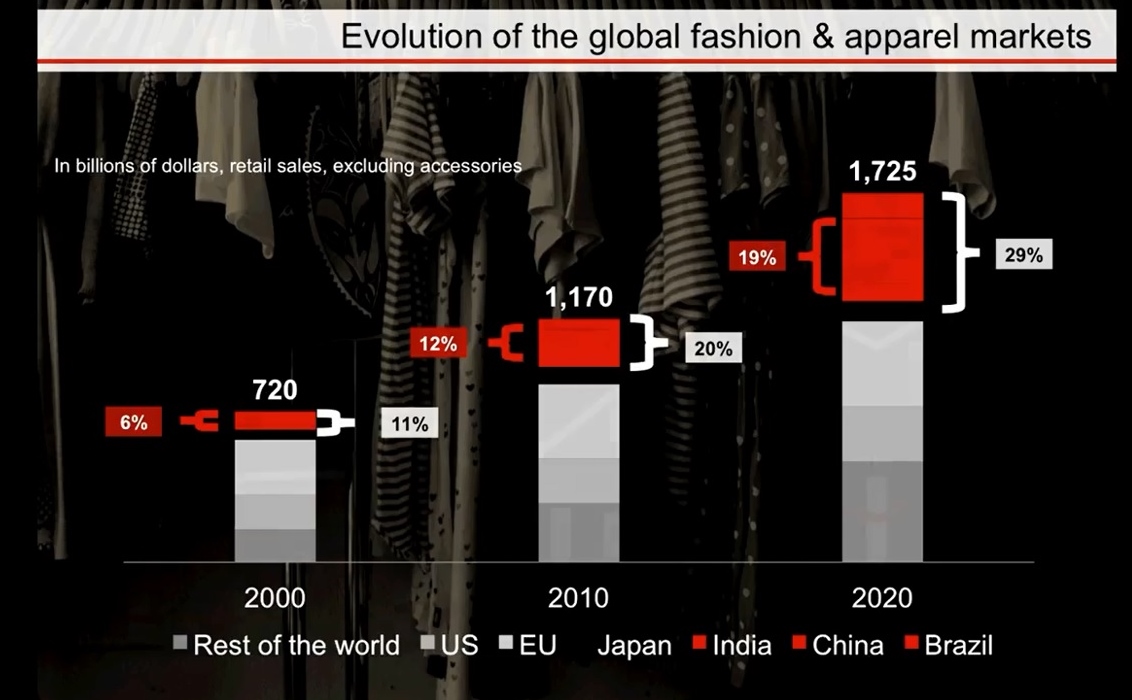
Sheng Lu: What is the market potential of Asia and particularly China for Unifi and the US textile industry in general?

Bill Jasper: The expected growth in China and other Asian markets is enormous, and Unifi’s strategic plan reflects that. By 2020, China’s consumer market is expected to reach 22 percent of total global consumption, second only to the U.S. at 35 percent. Our wholly owned subsidiary (UTSC) is located at the center of one of China’s most important textile regions, Suzhou. UTSC customers will have quick access to new product introductions with the quality and technical service they have come to expect with Unifi. UTSC was established to provide the domestic Chinese market with a full complement of our specialty branded products, not only for their growing appetite for branded apparel, but for growth in their automotive and home furnishing markets.

The U.S. textile industry in general has invested heavily to take advantage of the growth in Asia by adding to their manufacturing facilities here or putting plants in Asia or China. Countries like Vietnam also offer strong manufacturing platforms due to lower wages than China and the prospect of duty-free exports to the European Union, the U.S. and Japan when announced trade agreements like TPP are completed. The growth of the Asian textile market certainly ups the ante in regard to whether there will be a yarn forward rule under TPP. Failure to include a strong yarn forward rule in this key agreement will likely cede key Asian markets to textile suppliers that are not a party to the TPP. To the contrary, inclusion of a yarn forward provision in that agreement will drive investment to partner countries and provides opportunities for U.S. fabrics and yarns to supply production meeting those guidelines.

Sheng Lu: How do you see “sustainability” as a game changer for the textile industry?  What has Unifi done in response to the growing awareness of sustainability among consumers?

Bill Jasper: Reducing our environmental footprint through the entire supply chain has been an important focus of the industry for several years, driven by industry leaders like Unifi and our suppliers and customers.

Unifi has an on-site environmental team constantly reviewing everything we do to see how we can reduce, reuse, recycle and conserve. All of our U.S.-based plants are currently landfill-free; we recycle our shipping pallets, we have installed energy-efficient lighting and increased efficiency around our compressed air usage, for example.

In 2010, Unifi opened our state-of-the-art REPREVE Recycling Center, where we use our own industrial yarn waste, recycled water bottles and even fabric waste to make REPREVE® recycled polyester fibers and yarns which go back into high end consumer apparel, like fleeces made by Patagonia, shoes and apparel by Nike, The North Face jackets, and eco-friendly Haggar pants. You can also find REPREVE® in Ford vehicles, including the 2015 Ford F150. In 2013, REPREVE® turned more than 740 million recycled bottles into fiber, and since 2009, we have recycled more than two billion plastic bottles to make REPREVE. Unifi’s recycled process offsets the need to use newly refined crude oil, uses less energy and water, and produces fewer greenhouse gas emissions compared to making virgin synthetic fibers.

Moreover, for Unifi at least, this is much more than a marketing concept. Our focus on environmental sustainability is now an engrained part of our culture. We believe that sustainability must be an unwavering core value of responsible manufacturing in the 21st century.

Sheng Lu: Given the changing nature of the US textile industry, what kind of talents will be most in needs by the US textile industry in the years ahead? Do you have any advice for textile and apparel majors in terms of improving their employability in the job market?

Bill Jasper: The U.S. textile industry is a diverse, technology driven, capital intensive, innovator of high quality products that is able and ready to compete effectively in the 21st century global marketplace, and a prepared workforce is critical in meeting the needs of this competitive industry. Not only do we look for skills in textile technology, we look for workers with high math and science aptitudes, technical and chemical engineering skills, process improvement, and industrial engineering capabilities. The ability to think strategically and globally is a big advantage in driving sales and creating marketing programs that meet the needs of our customers world-wide.

–The End–

UNCTAD: Sharp Rise of Greenfield FDI in the Textile and Apparel Industry Worldwide from 2012 to 2013

According to the 2014 World Investment Report released this week by the United Nation Conference on Trade and Development (UNCTAD), a sharp rise in greenfield foreign direct investment (FDI)* activity was observed in the textile and apparel (T&A) industry worldwide from 2012 to 2013, with the value of announced investment projects totaling more than $24 billion, more than doubled than the level a year earlier.

Although detailed country-level data is not available, the UNCTAD report shows that the developed countries as a whole attracted $13.7 billion inflows of greenfield FDI and invested $18.7 billion greenfield FDI overseas in the T&A industry from 2012 to 2013. The report further says that Cambodia and Myanmar, the two least developed countries in South-East Asia, have recently emerged as attractive locations for investment in textiles, garments and footwear.

FDI is another critical format of market access in addition to international trade.

*Note: Greenfield FDI means a foreign company opens a new physical facility from which to conduct business.

Untitled

Euratex Releases Key Indicators of the EU Textile and Apparel Industry in 2013

In its annual release, the European Apparel and Textile Federation (Euratex) provides a skeletal statistical profile of the EU textile and apparel (T&A) in 2013. Most statistics cited in the report comes from the Eurostat.

Production
In 2013, T&A production in EU overall remains stable. Output of Man-made fiber (MMF) enjoyed a 6.8 percent growth from a year earlier, although production of textile (yarns, fabrics and made-ups) and apparel respectively declined 0.1 percent and 4.2 percent.  Accumulatively, from 2010 to 2013, production of MMF, textile and apparel in EU has down 15.2 percent, 8.1 percent and 13.3 percent respectively.

Employment
Employment in the EU T&A industry continues to move downward in size, shrinking from 1.73 million in 2012 to 1.64 million in 2013. The most significant drop happened in the apparel subsector, which suffered a 4 percent job loss from 2012 to 2013. The number of employment in the textile and MMF subsectors goes down 3.7 percent and 1 percent respectively.

Consumption
Affected by the slow economic recovery in the region, EU consumers seem still hesitant in expending more money on T&A products in 2013. Value of T&A consumption in EU (28) stood at €483.9 billion in 2013, only a slight increase of 0.2 percent from 2012.

Trade
The two-way EU T&A trade enjoyed a modest growth from 2012 to 2013. Particularly, despite reported decline in production, value of EU apparel exports in 2013 increased 4 percent, reflecting the growing demand for “made in EU” apparel products in other parts of the world. In terms of import, consistent with the pattern of consumption, EU apparel imports slightly increased 1.7 percent from 2012 to 2013. It should be noted that China is gradually losing market share in the EU apparel import market. From 2012 to 2013, value of China’s apparel exports to the EU declined 4 percent, compared with 10 percent growth of Bangladesh.

EU1

EU2

EU Commission Releases Negotiating Positions for Textile and Apparel in T-TIP

EUUSbridgeShutte

The EU Commission released its negotiating positions for the textile and apparel sector in the Trans-Atlantic Trade and Investment Partnership (T-TIP) on May 14, 2014.  The position paper outlines a few areas that the EU Commission says it would include in the T-TIP negotiation with the United States:

  • Labeling requirements for textile & apparel and footwear products
  • convergence and/or harmonization of approaches to guarantee product safety and consumer protection
  • standards approximation

Earlier this year, USTR also released its negotiating objectives for the T-TIP. Specifically for the textile and apparel sector, USTR will “seek to obtain fully reciprocal access to the EU market for U.S. textile and apparel products, supported by effective and efficient customs cooperation and other rules to facilitate U.S.-EU trade in textiles and apparel.” USTR holds the positive view that “eliminating the remaining duties on our exports will create new opportunities for integration into European supply chains and to sell high-quality “made-in-USA” garments to European consumers.  Enhanced U.S.-EU customs cooperation will also help ensure that non-qualifying textiles and apparel from third countries are not being imported into the United States under T-TIP.

However, T-TIP negotiation somehow is under the shadow of the Trans-Pacific Partnership (TPP), another free trade agreement currently under negotiation among the United States and other eleven countries in the Asia Pacific region. As reported by the Inside US Trade, the National Council of Textile Organizations (NCTO) holds the view that TTP and T-TIP negotiation should be dealt with “sequentially”. NCTO would like to avoid a situation where the US makes a concession on textiles and apparel to the EU in T-TIP that goes beyond the US offer to Vietnam in TPP, causing Vietnam to demand the same concession in the TPP talks.

One of the most difficult issues on textiles and apparel in T-TIP will be the rule of origin, given that the U.S. and EU have taken vastly different approaches on this issue in their existing preferential trade agreements. The EU rule of origin for apparel essentially consists of two different rules — one that applies generally and one that can be used as an exception. Under the general rule, an apparel item qualifies as originating if it has undergone at least two “substantial processes” in the EU. In general, weaving the yarn into fabric and finishing the fabric are considered substantial operations. Under this scheme, EU manufacturers can use non-originating yarn to make qualifying apparel as long as that yarn is woven into fabric in the EU and also finished there. As a result, this part of the EU rule is sometimes referred to in the United States as the equivalent of a “fabric-forward” rule, since it usually requires all components of the item, starting with the fabric, to be made in the region.

The second part of the EU rule — which functions as an exception — essentially applies a more liberal rule for certain apparel and textile items. These items can qualify for tariff benefits even if only the printing or other downstream operations occur in the EU. Specifically, under this exception, a textile or apparel item that is made from non-originating fabric but for which the printing occurs in the EU can qualify for tariff benefits if the non-originating part of the item is no more than 47.5 percent of the value of the final product. EU manufacturers of printed bed sheets often take advantage of this printing exception (Inside US Trade).

Latest data from OTEXA shows that in 2013, U.S. textile and apparel imports from EU(28) totaled $4 billion, among which 52% were apparel products and 48% were textiles. Top product categories of U.S. textile and apparel imports from EU include non-woven fabrics, men&boys’ suits, dresses, floor coverings, other man-made fiber apparel, special purpose fabrics and women & girls’ coats. In comparison, U.S. textile and apparel exports to EU(28) reached $2.5 billion in 2013, among which only 29% were apparel products and 71% were textiles. Top product categories of U.S. textile and apparel exports to EU include specialty & industrial fabrics, felts & other non-woven fabrics, filament yarns, other made-up textile articles, waste & tow staples, women & girls slacks, shorts and pants as well as spun yarns & thread.

1

2

3 4

 5

7

OECD Service Trade Restrictiveness Index Shows Trade Obstacles in Emerging Economies Remain High

Untitled

According to the latest Service trade Restrictiveness Index (STRIs) released by the Organization for Economic Cooperation and Development (OECD), service trade barriers in many emerging economies remain much higher than their developed trading partners.

Specifically for the distribution service sector, which covers general wholesale and retail sales of consumer goods, the STRIs suggests the highest trade barriers are in place in Indonesia, China and India whereas Spain, Germany and Czech Republic are among the most open to foreign companies (see the figure above).  Because trade in distribution services has mainly taken place through commercial presence, and the STRI results highlight the importance of impediments on foreign ownership.

The STRIs indices take the value from 0 to 1, where 0 is completely open and 1 is completely closed. The indices are calculated based on the following five factors:

  • Restrictions on foreign ownership and other market entry conditions (30%)
  • Restrictions on the movement of people (10%)
  • Other discriminatory measures and international standards (17%)
  • Barriers to competition and public ownership (22%)
  • Regulatory transparency and administrative requirements (21%) 

Currently, the STRIs include 40 countries (34 OECD members as well as Brazil, China, India, Indonesia, Russia and South Africa) across 18 service sectors.


%d bloggers like this: