Textile and apparel trade matters. Even today in the 21st century, apparel could still account for 80—90% of a developing country’s total merchandise export and play a critical role in promoting economic growth, poverty reduction, and gender equality. The interview explored several key topics:
Why textile & apparel trade matters for development in the 21st century
How ITC provides capacity building support and enhances the export competitiveness of garment exporters in developing countries
Sustainability movement’s impact on apparel sourcing and export competitiveness of developing countries
The promise and complexity of circularity in tackling used clothing challenges
Empowering women entrepreneurs through SheTrades
Skills and education needed to thrive in the global fashion apparel trade
About Matthias Knappe (speaker)
Matthias Knappe is the Head of Fibres, Textiles and Clothing Unit at the International Trade Centre (ITC), which is co-run by the World Trade Organization (WTO) and the United Nations (UN). Matthias has over 30 years of diversified professional experience in international trade and development. He has worked at the enterprise, institutional, and governmental levels. Matthias is leading ITC’s textile and apparel and light manufacturing unit. Over the last 20 years, he has been working with the T&C sector around the world to increase its export competitiveness. He designed and currently manages ITC’s Global Textiles and Clothing (GTEX) programme and various other fibre, apparel and light manufacturing projects. The Unit’s present portfolio includes projects in 15 countries.
AboutEmilie Delaye (moderator)
Emilie Delaye is a master’s student in Fashion and Apparel Studies at the University of Delaware, with a specific interest in supply chain, global sourcing, and sustainability. With a background in Entrepreneurship and Fashion Management, Emilie’s passion lies in improving the fashion industry through innovative problem-solving and collaboration. She has worked on projects exploring sourcing destinations and emerging sourcing trends, as well as collaborated with Macy’s on an initiative centered around Extended Producer Responsibility (EPR) regulations. Emilie’s work is driven by a commitment to fostering innovation and ethical practices in fashion, positioning her as a future leader in driving the industry toward greater sustainability and responsibility.
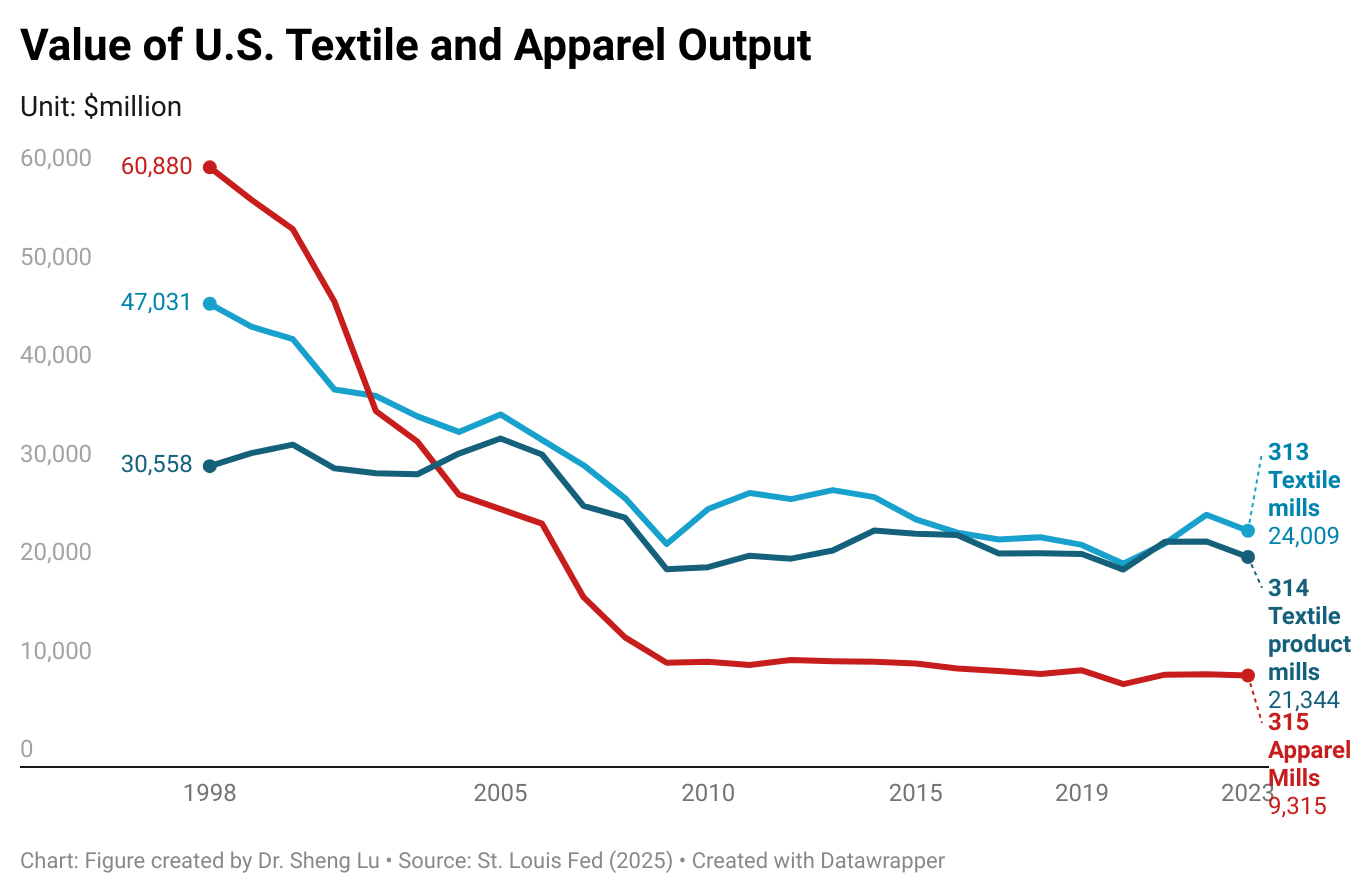
Textile and apparel manufacturing in the U.S. has significantly decreased over the past decades due to factors such as automation, import competition, and the changing U.S. comparative advantages for related products. However, thanks to companies’ ongoing restructuring strategies and their strategic use of globalization, the U.S. textile and apparel manufacturing sector has stayed relatively stable in recent years. For example, the value of U.S. yarns and fabrics manufacturing (NAICS 313) totaled $24 billion in 2023 (the latest data available), up from $23.3 billion in 2018 (or up 2.8%). Over the same period, U.S. made-up textiles (NAICS 314) and apparel production (NAICS 315) moderately declined by only 1.8% and 1.6%.
More importantly, the U.S. textile and apparel manufacturing sector is evolving. Several important trends are worth watching:
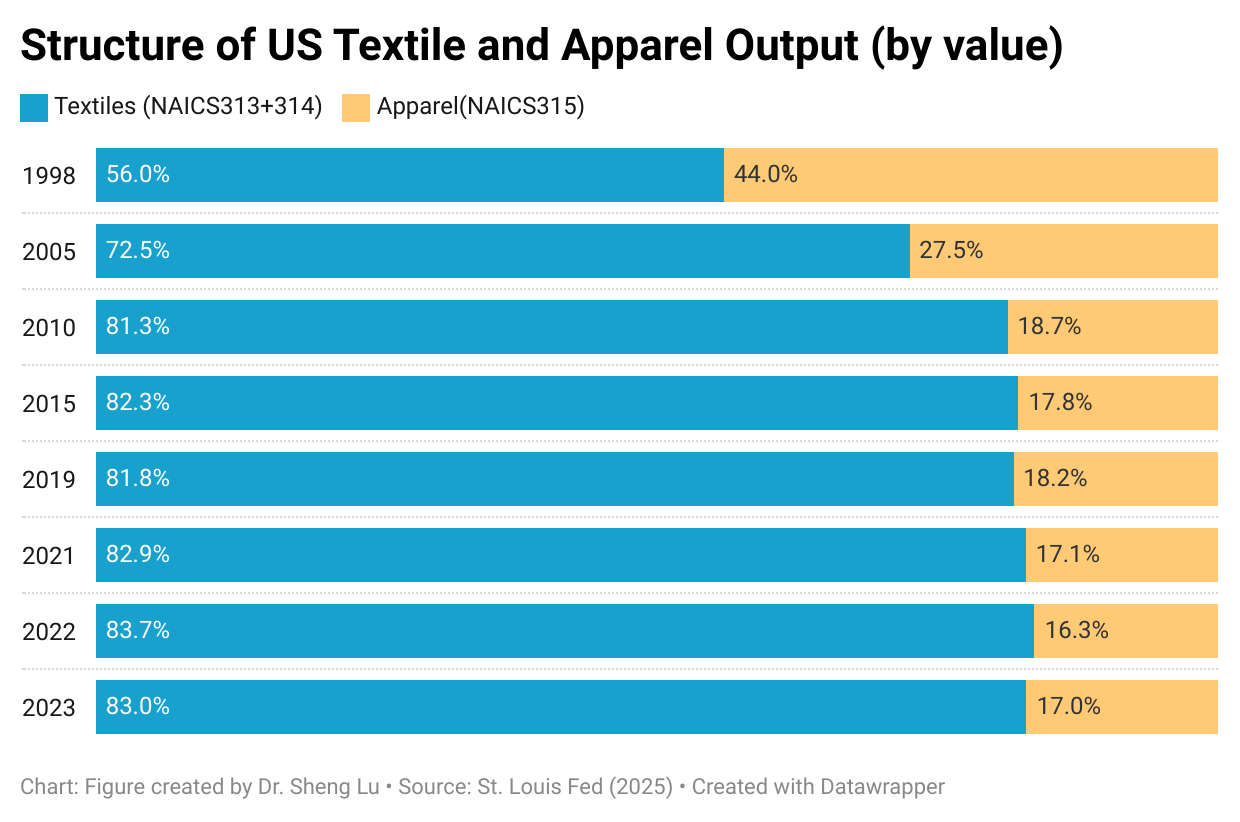
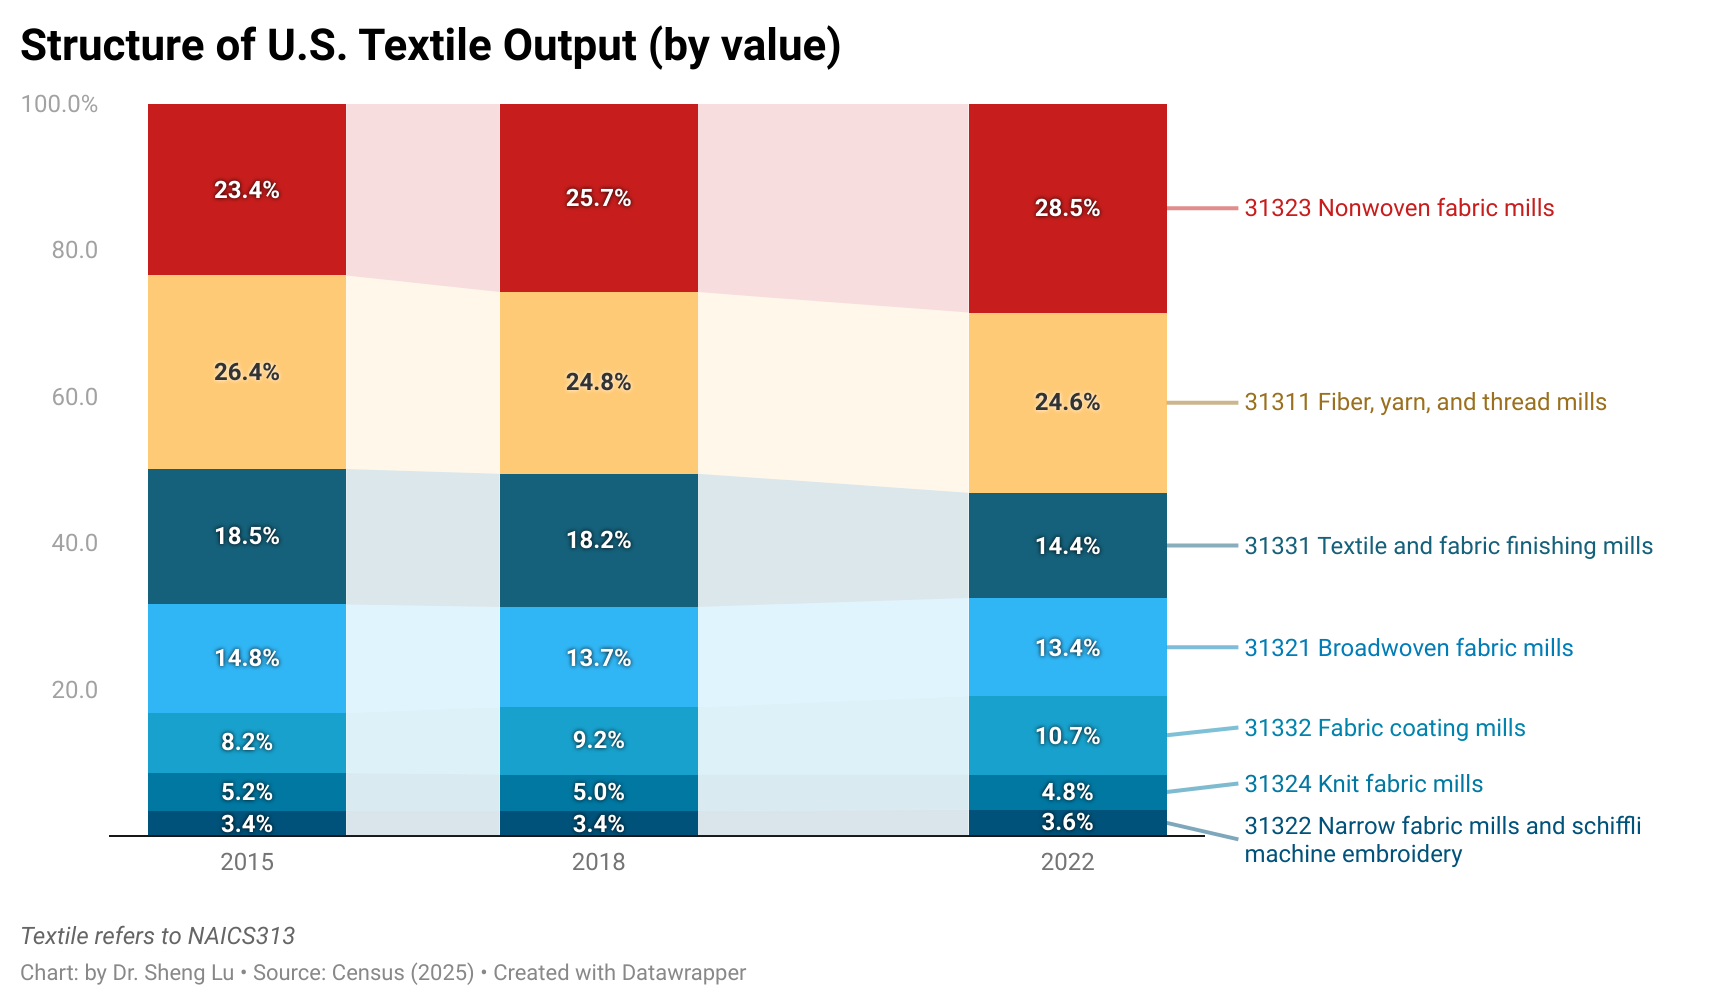
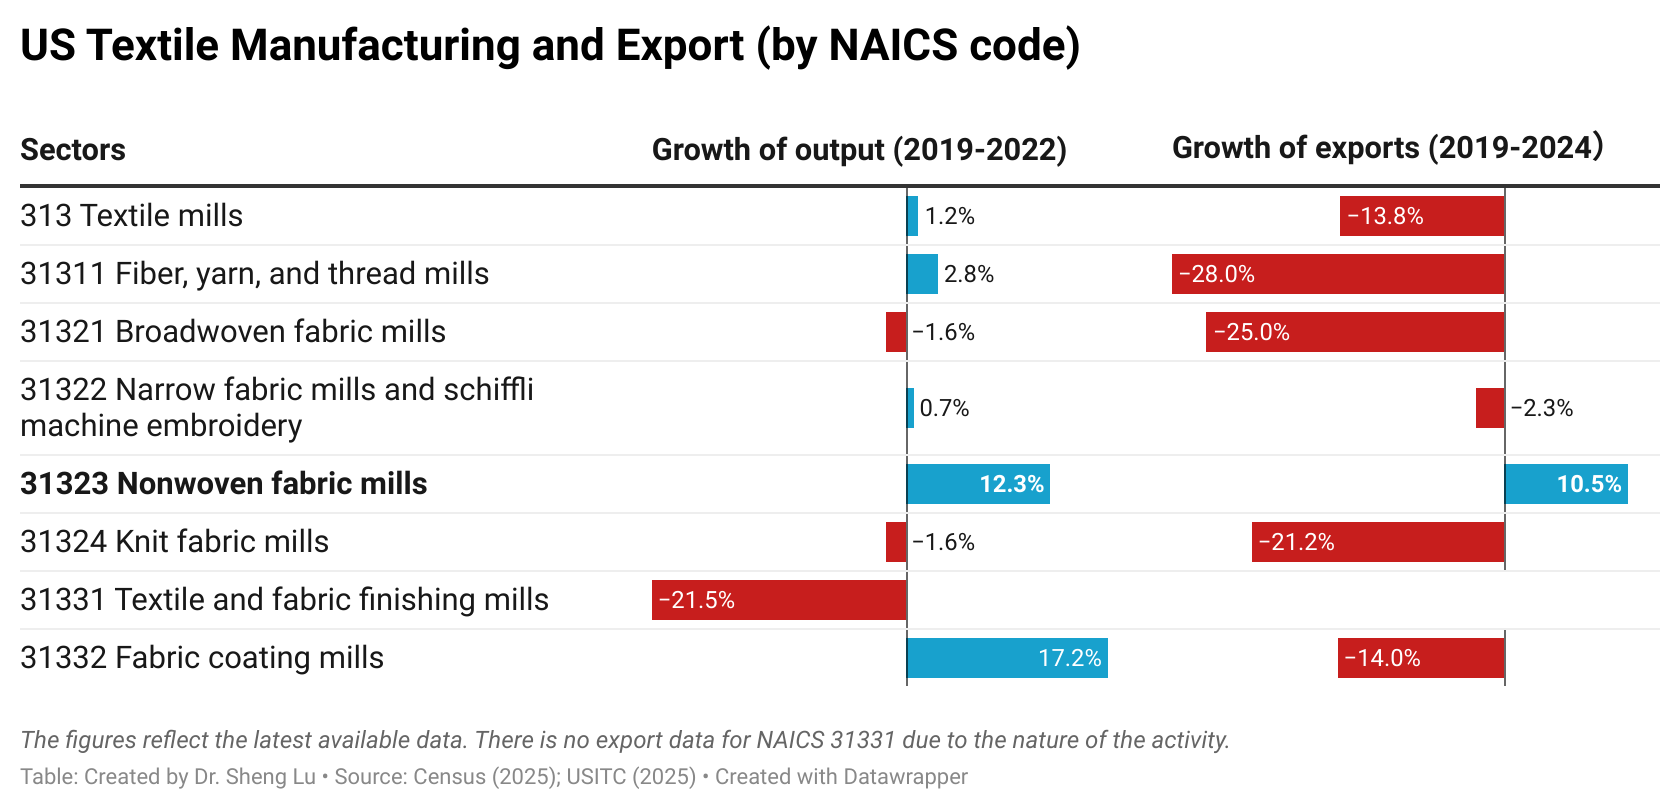
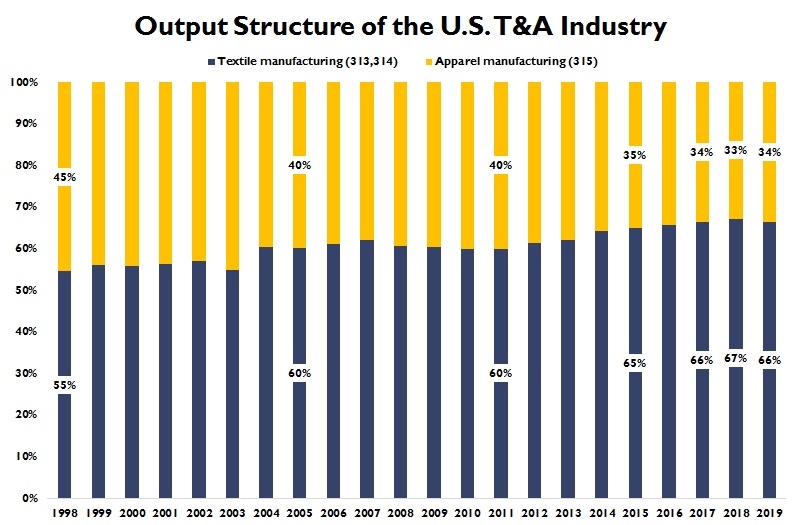
First, “Made in the USA” increasingly focuses on textile products, particularly high-tech industrial textiles that are not intended for apparel manufacturing purposes. Specifically, textile products (NAICS 313+314) accounted for over 83% of the total output of the U.S. textile and apparel industry as of 2023, much higher than only 56% in 1998 (U.S. Census, 2025). Textiles and apparel “Made in the USA” are growing particularly fast in some product categories that are high-tech driven, such as medical textiles, protective clothing, specialty and industrial fabrics, and non-woven. These products are also becoming the new growth engine of U.S. textile exports. Notably, between 2019 and 2022, the value of U.S. “nonwoven fabric” (NAICS 31323) production increased by 12.32%, much higher than the 1.15% average growth of the textile industry (NAICS 313). Similarly, while U.S. textile exports decreased by 13.75% between 2019 and 2024, “nonwoven fabric” exports surged by 10.48%--including nearly 40% that went to market outside the Western Hemisphere (U.S. International Trade Commission, 2025).
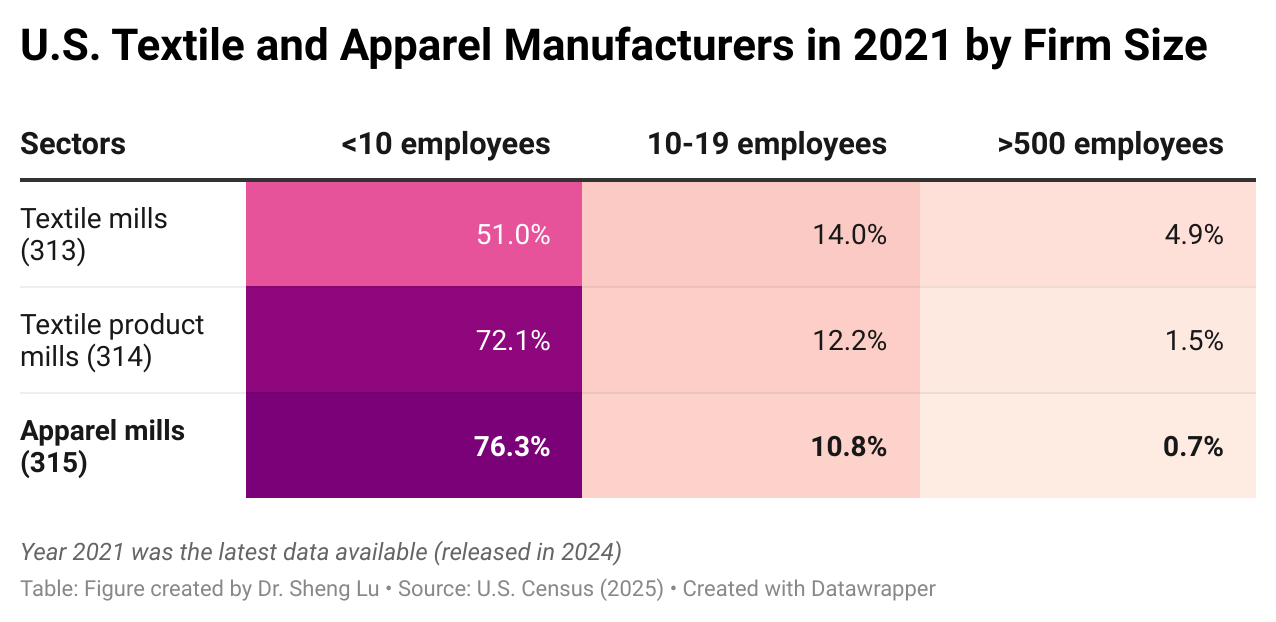
Second, U.S. apparel manufacturers today are primarily micro-factories, and they supplement but are not in a position to replace imports. As of 2021 (the latest data available), over 76% of U.S.-based apparel mills (NAICS 315) had fewer than 10 employees, while only 0.7% had more than 500 employees. In comparison, contracted garment factories of U.S. fashion companies in Asia, particularly in developing countries like Bangladesh, typically employ over 1,000 or even 5,000 workers.
Instead of making garments in large volumes, most U.S.-based apparel factories are used to produce samples or prototypes for brands and retailers. In other words, replacing global sourcing with domestic production is not a realistic option for U.S. fashion brands and retailers in the 21st-century global economy. Nor are U.S. fashion companies showing interest in shifting their business strategies from focusing on “designing + managing supply chain+ marketing” back to manufacturing.
Meanwhile, due to mergers and acquisitions (M&A) and to leverage economies of scale, approximately 5% of U.S. textile mills (NAICS313) had more than 500 employees as of 2021–this is a significant number, considering that textile manufacturing is a highly capital-intensive process.
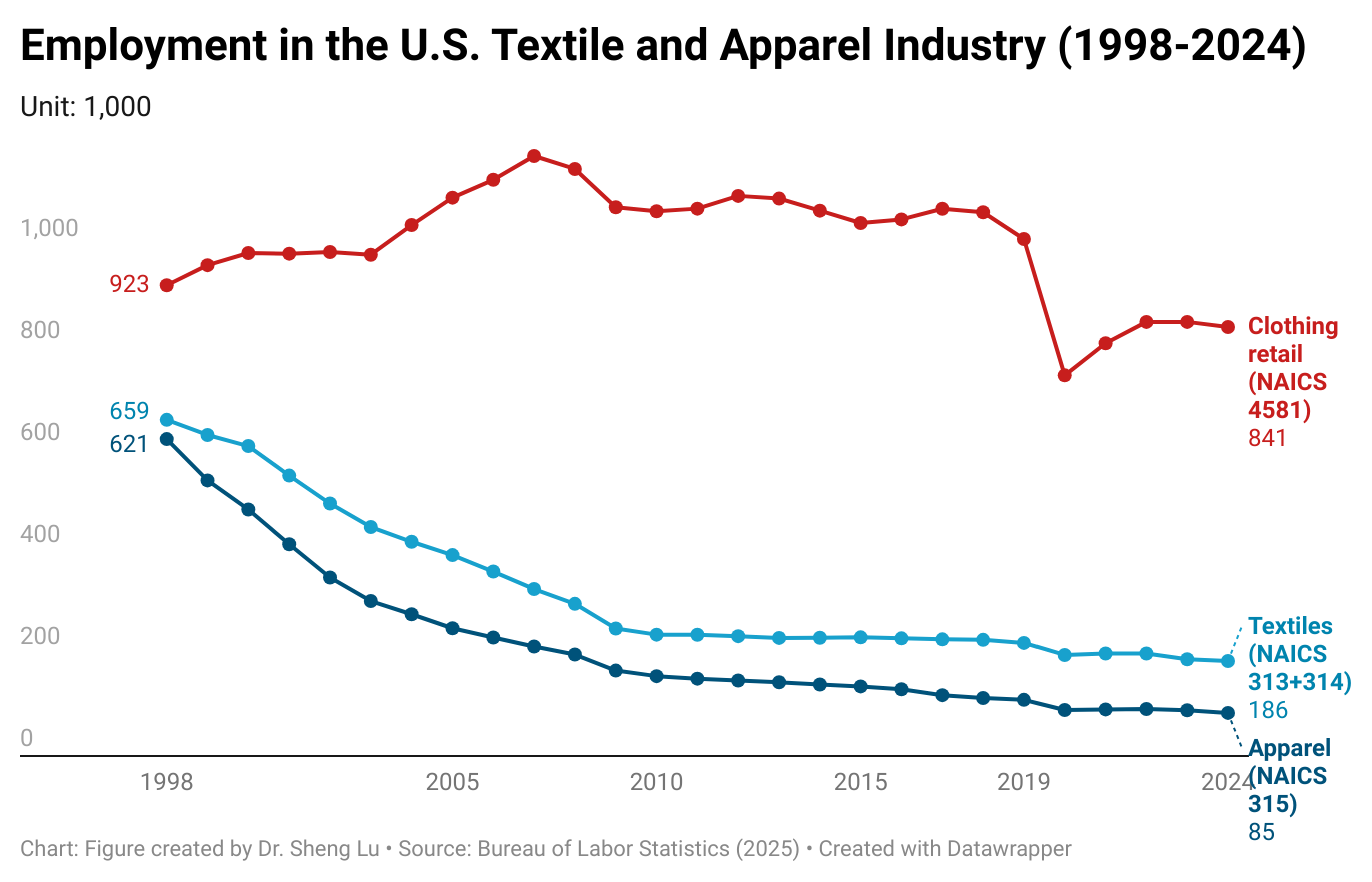
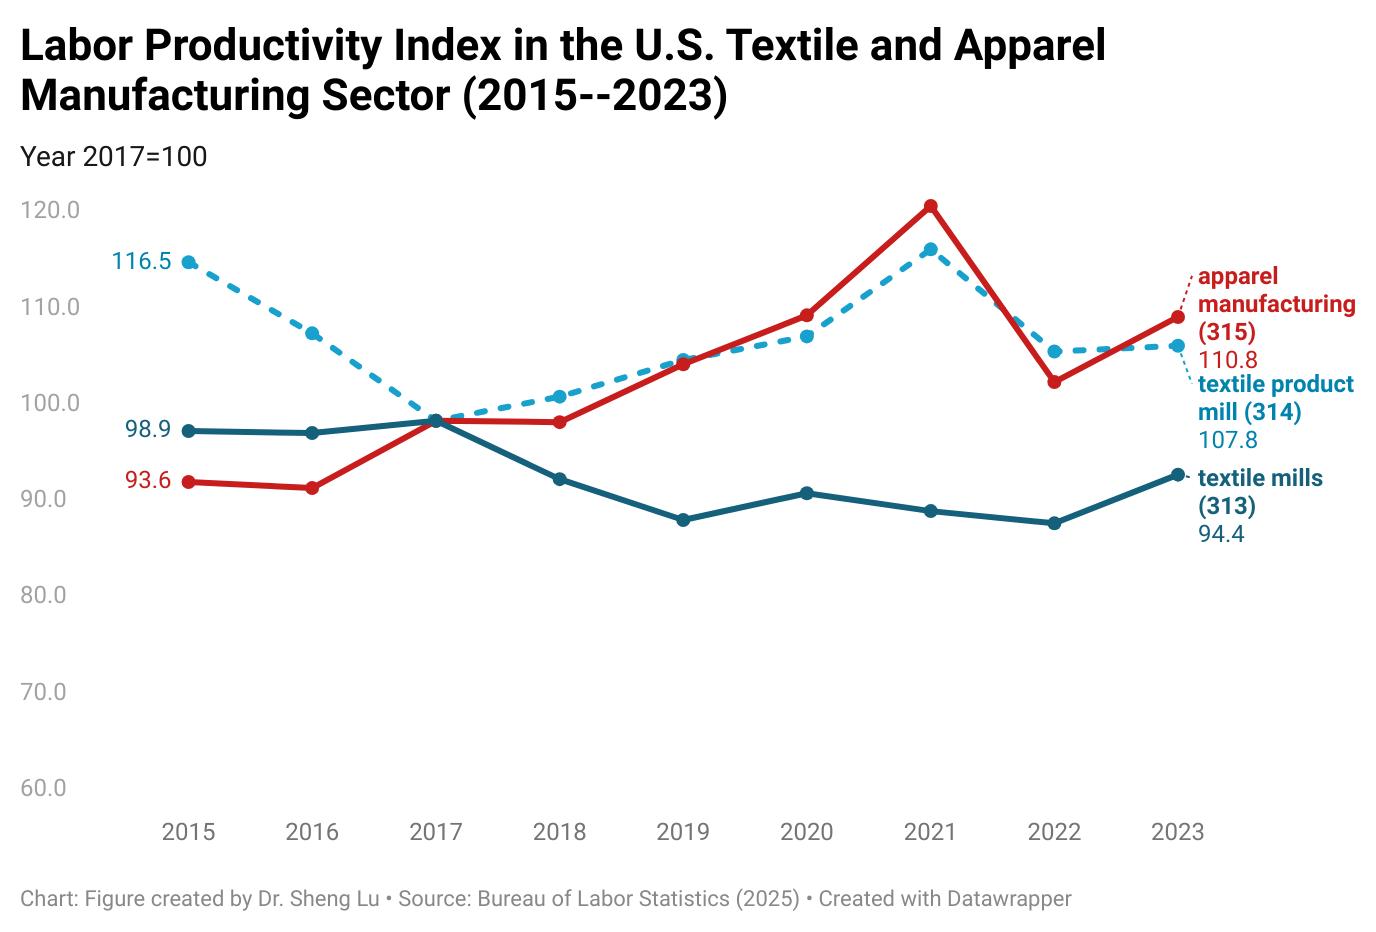
Third, employment in the U.S. textile and apparel manufacturing sector continued to decline, with improved productivity and technology being critical drivers. As of 2024, employment in the U.S. textile and apparel manufacturing sector (NAICS 313, 314, and 315) totaled 270,700, a decrease of 18.4% from 33,190 in 2019. Notably, U.S. textile and apparel workers had become more productive overall—the labor productivity index of U.S. textile mills (NAICS 313) increased from 89.7 in 2019 to 94.4 in 2023, and the index of U.S. apparel mills (NAICS 315) increased from 105.8 to 110.78 over the same period.
On the other hand, clothing retailers (NAICS 4481) accounted for over 75.7% of employment in the U.S. textile and apparel sector in 2024.
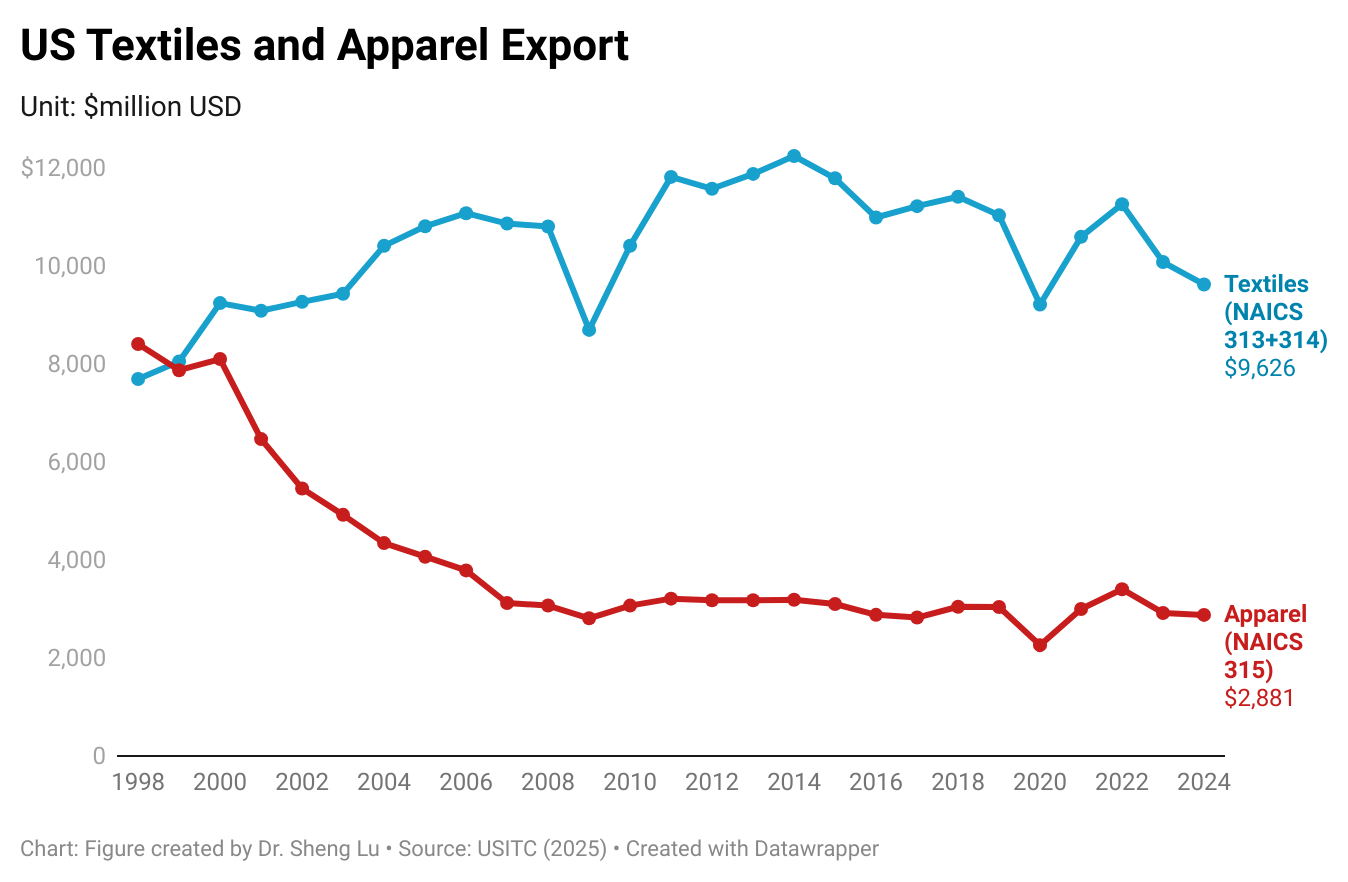
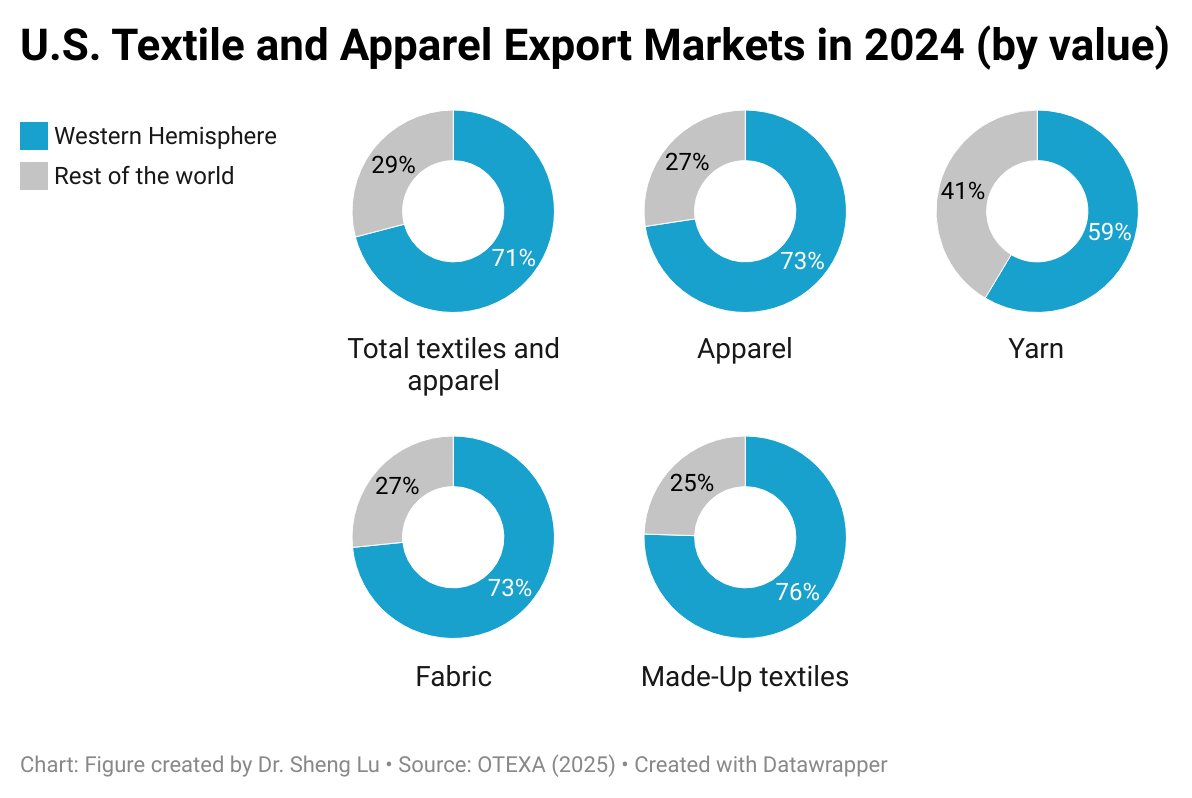
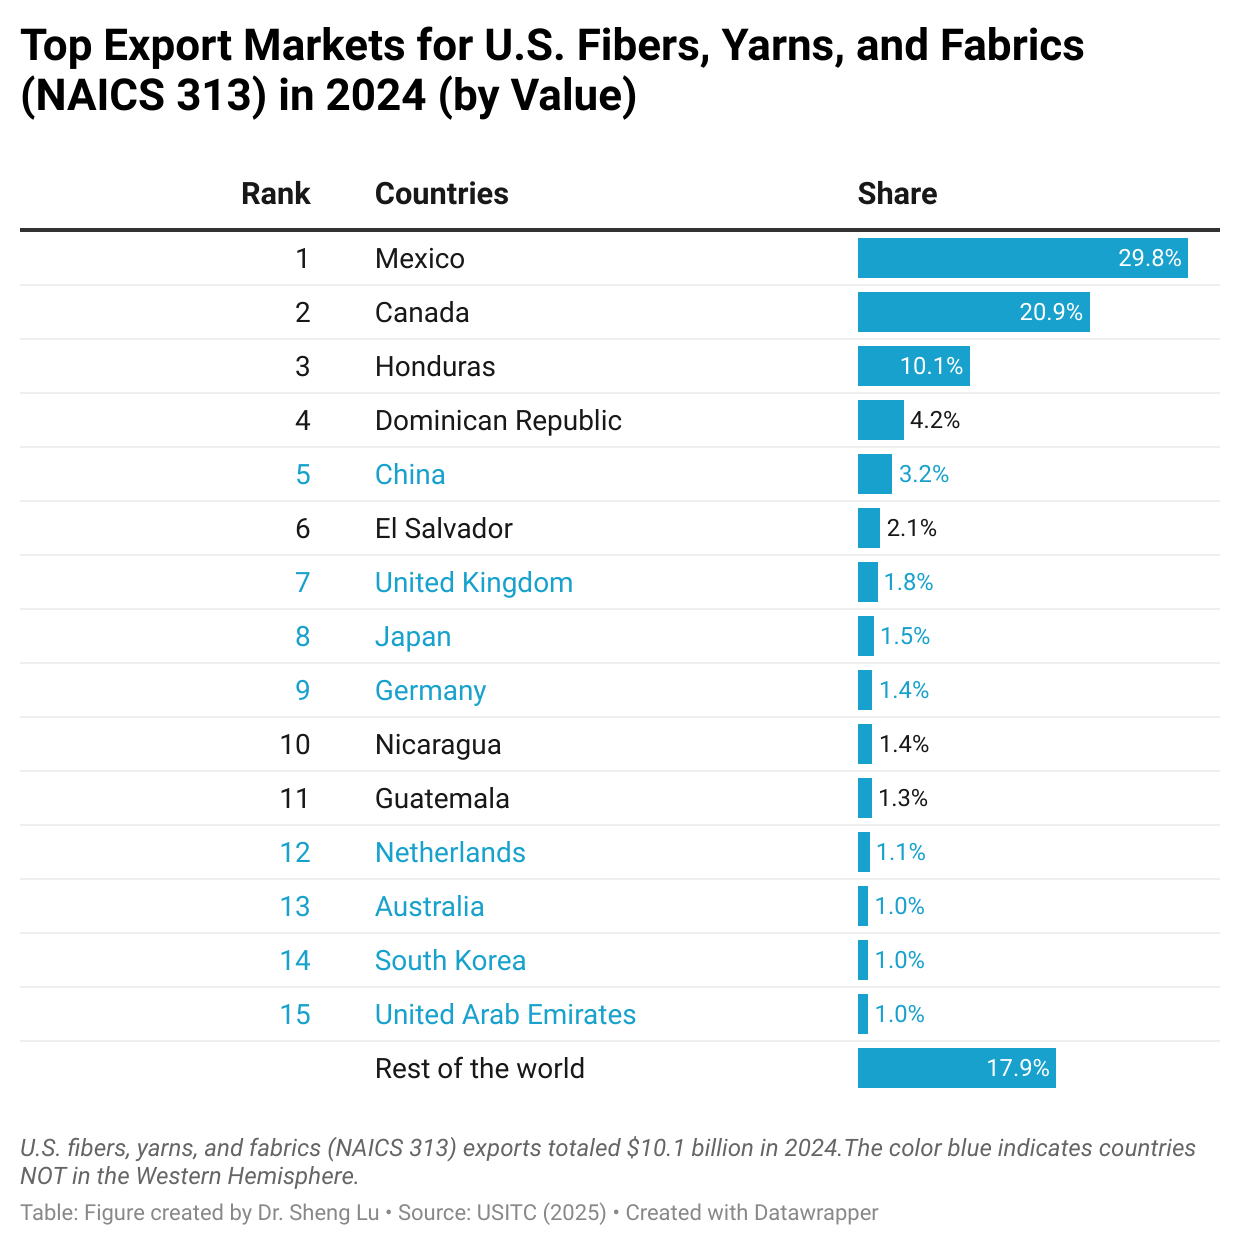
Fourth, international trade, BOTH import and export, supports textiles and apparel “Made in the USA.” On the one hand, U.S. textile and apparel exports exceeded $12.5 billion in 2024, accounting for more than 30% of domestic production as of 2023 (NAICS 313, 314 and 315). Thanks to regional free trade agreements, particularly the U.S.-Mexico-Canada Agreement (USMCA) and the Dominican Republic-Central America Free Trade Agreement (CAFTA-DR), the Western Hemisphere stably accounted for over 70% of U.S. textile and apparel exports over the past decades. However, for specific products such as industrial textiles, markets in the rest of the world, especially Asia and Europe, also become increasingly important. Thus, lowering trade barriers for U.S. products in strategically significant export markets serves the interest of the U.S. textile and apparel industry.
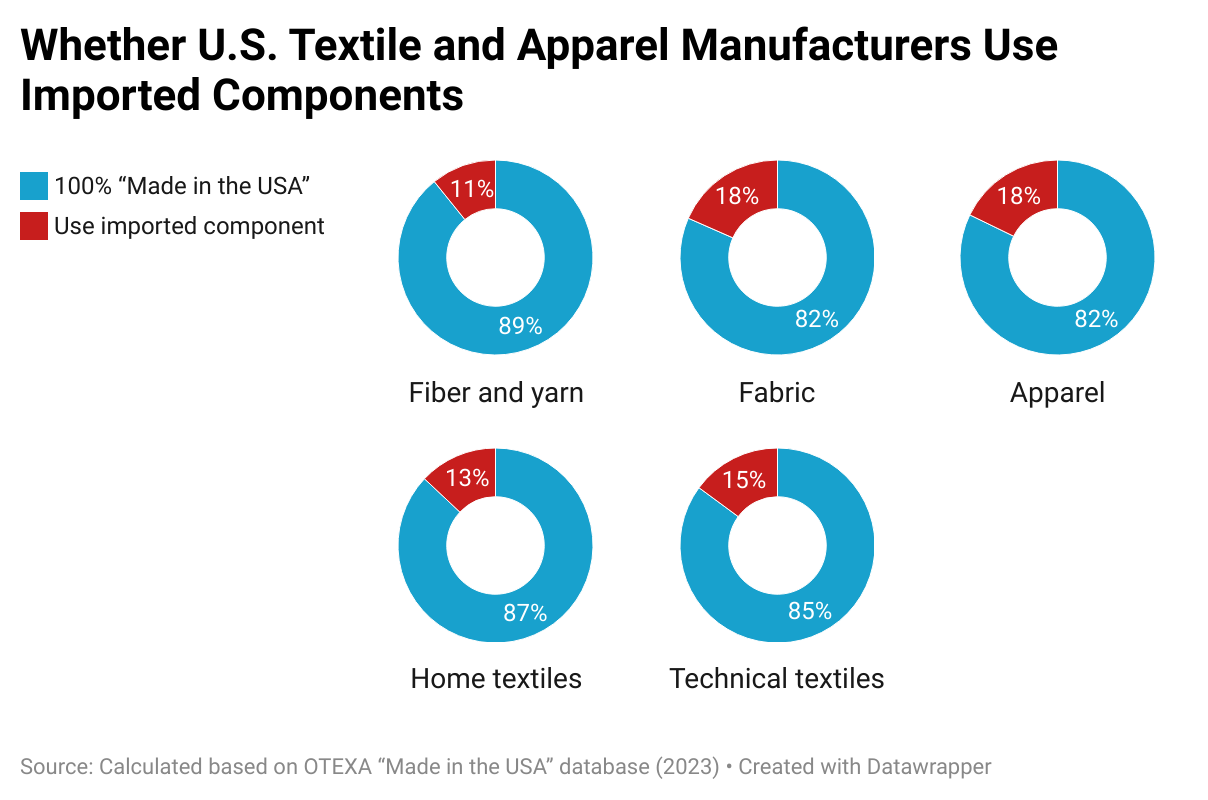
On the other hand, imports support textiles and apparel “Made in the USA” as well. A 2023 study found that among the manufacturers in the “Made in the USA” database managed by the U.S. Department of Commerce Office of Textile and Apparel, nearly 20% of apparel and fabric mills explicitly say they utilized imported components. Partially, smaller U.S. textile and apparel manufacturers appear to be more likely to use imported components–whereas 20% of manufacturers with less than 50 employees used imported input, only 10.2% of those with 50-499 employees and 7.7% with 500 or more employees did so. The results indicate the necessity of supporting small and medium-sized (SME) U.S. textile and apparel manufacturers to more easily access their needed textile materials by lowering trade barriers like tariffs.
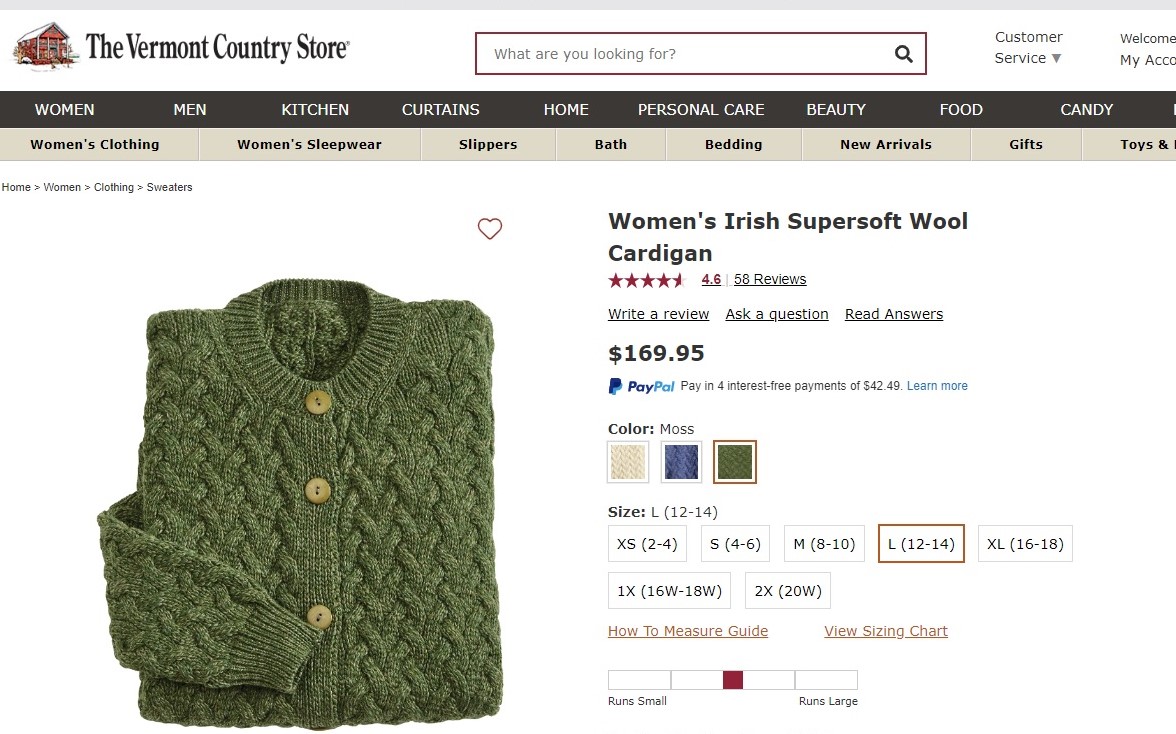
This study explored the survival strategies of apparel manufacturing in a high-wage developed economy using “Made in Ireland” as a case study. Based on a statistical analysis of 4,000 apparel items for sale in the retail market from January 2018 to December 2021, the study found that:
First, unlike the conventional views like the factor proportion trade theory and the global value chain theory, the study’s results showed that garment manufacturing did NOT disappear in Ireland as a high-wage developed country. Notably, garments “Made in Ireland” demonstrated many unique attributes, such as:
statistically more likely to target luxury and high-end markets than foreign-made apparel imported into Ireland;
statistically more likely to highlight their Irish cultural heritage and mention keywords such as “traditional,” “centuries-old,” “craftsmanship,” and “historical” in the product description;
statistically more likely to focus on manufacturing specific product categories with a world reputation, including jumpers and kilts;
statistically less likely to be seen in categories with an abundant supply from lower-cost imports, such as bottoms;
In other words, economic theories need to incorporate non-price competition factors and better explain the development patterns of a country’s garment sector, particularly in developed economies.
Second, the findings called for a rethink of the strategies supporting the garment-manufacturing sector in a high-wage developed country. Current industry practices and government policies aiming to promote garment manufacturing in a developed country primarily focus on implementing protectionist trade measures (i.e., restricting imports) or investing in modern technologies like automation. However, the study’s findings suggested new approaches. For example, using disaggregated product data at the Stock Keeping Unit (SKU) level, the study indicated that a substantial portion of garments “Made in Ireland” was sold overseas. Thus, promoting exports instead of curbing imports could be a more effective way of expanding garment production in a high-wage developed country.
On the other hand, the popularity of “Made in Ireland” jumpers and kilts in the world marketplace suggested that garment manufacturers in a high-wage developed country could survive their business by leveraging cultural heritage, history, and traditional craftsmanship instead of fancy new technologies. Likewise, to a certain extent, the value of maintaining garment manufacturing in a high-wage developed country in the 21st Century may not necessarily be about replacing imports, improving “speed to market,” or creating jobs but preserving a country’s unique cultural heritage and history.
Third, the study’s findings revealed the challenges facing garment manufacturers in a high-wage developed country like Ireland. For example, garments “Made in Ireland” were more likely to be sold with a discount, implying their price competition with foreign-made imports might not be entirely avoidable despite all the efforts from targeting the niche markets to differentiating product assortments.
On the other hand, garments “Made in Ireland” often targeted the high-end market, requiring the workforce to obtain demanding skills such as advanced sewing, craftsmanship, and a deep understanding of the Irish culture. However, the aging workforce and the shortage of skilled labor, a common problem facing developed countries, could also prevent the expansion of apparel manufacturing in Ireland in the long run. Thus, prompting the traditional Irish culture and apparel production craftsmanship, especially to attract the young generation to garment factories and be willing to pursue a career there, would be critical for sustaining the garment manufacturing sector in Ireland and other high-wage developed countries.
Background
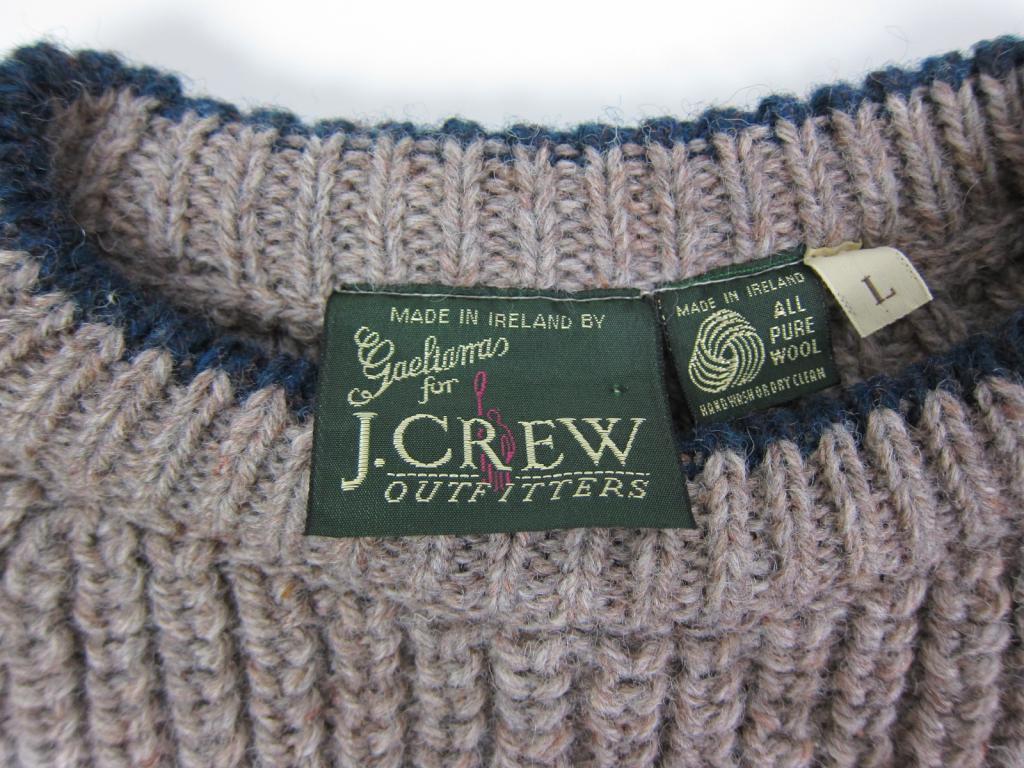
Ireland has a long history of making garments, and specific categories of apparel “Made in Ireland” are famous worldwide, such as jumpers and kilts. As of 2020 (i.e., the latest data available), about 340 garment factories still operate in Ireland, a notable increase from 293 in 2010 (Eurostat, 2022). Meanwhile, the output of Ireland’s apparel manufacturing sector totaled $68 million in 2020 (measured in value-added), a substantial drop from $142 million ten years ago (Eurostat, 2022).
Meanwhile, export was critical in supporting apparel “Made in Ireland” today. Statistics show that Ireland’s apparel exports totaled $270 million in 2019 before the pandemic, down about 19% from 2005 (UNComtrade). However, over that period, Ireland’s apparel exports to most developed countries enjoyed positive growth, such as Spain (up 151%), the Netherlands (up 4.5%), Germany (up 14.5%), France (up 61.6%), and Japan (up 20.2%). Further, Ireland’s top four largest apparel export markets were all developed Western EU countries (UNComtrade, 2022). Geographic proximity and the specific product structure of Ireland’s apparel exports could be important factors behind these distinct export patterns.
by Miriam Keegan (FASH MS student, Fulbright-EPA scholar) and Sheng Lu
Full paper: Keegan, M. & Lu, S. (2023). Can garment production survive in a developed economy in the 21st century? A study of “Made in Ireland”. Research Journal of Textile and Apparel. (ahead of print) https://doi.org/10.1108/RJTA-09-2022-0113
Note: The revealed comparative advantage (RCA) index measures a country’s relative export performance of a particular product compared to the world average. It helps identify sectors in which a country holds a competitive edge in international trade. RCA =(Country’s exports of product X/Country’s total exports)/(World exports of product X/World total exports).
RCA > 1: A value greater than 1 indicates that the country has a revealed comparative advantage in the product, meaning the product has a higher export share in the country’s portfolio compared to the global average. This suggests the country is more competitive in exporting that product relative to the rest of the world.
RCA < 1: A value less than 1 means the country has a revealed comparative disadvantage in that product. It indicates that the country is less competitive in exporting that product compared to the global average.
Observe the sectors in which the U.S. enjoyed a revealed comparative advantage (i.e., RCA > 1) in 2023. How does this compare with Bangladesh? What is your explanation for the observed differences?
Firstly, while China remained the world’s largest clothing exporter in 2023, rising geopolitical tensions and Western fashion companies’ ongoing de-risking efforts pose increasing challenges to its export outlook.
To some extent, 2023 wasn’t too bad for clothing “Made in China.” In value, China’s clothing exports totaled $164 billion, accounting for 31.6% of the world—unchanged from 2022. While China’s clothing exports decreased by 9.7 percent in 2023 compared to the previous year due to weaker market demand, this performance was better than most other top ten suppliers, including Bangladesh (down 16 percent), Vietnam (down 12 percent), India (down 13 percent), and Indonesia (down 17 percent).
However, China’s clothing exporters face significant challenges ahead. Despite maintaining its overall market share, China is losing momentum in nearly all key Western clothing markets, including the United States, the European Union, the UK, and Canada. This trend is primarily driven by perceived heightened sourcing risks associated with China, ranging from concerns over forced labor in the Xinjiang region to escalating geopolitical tensions involving the country.
For example, according to the 2024 Fashion Industry Benchmarking Study released by the US Fashion Industry Association (USFIA) in July, a record 43 percent of surveyed leading US fashion companies reported sourcing less than 10 percent of their apparel products from China in 2024, compared to only 18 percent in 2018. Likewise, nearly 60 percent of respondents no longer use China as their top apparel supplier in 2024, much higher than the 25-30 percent range before the pandemic. Additionally, nearly 80 percent of respondents plan to further reduce their apparel sourcing from China over the next two years through 2026, citing perceived high sourcing risks as the primary concern.
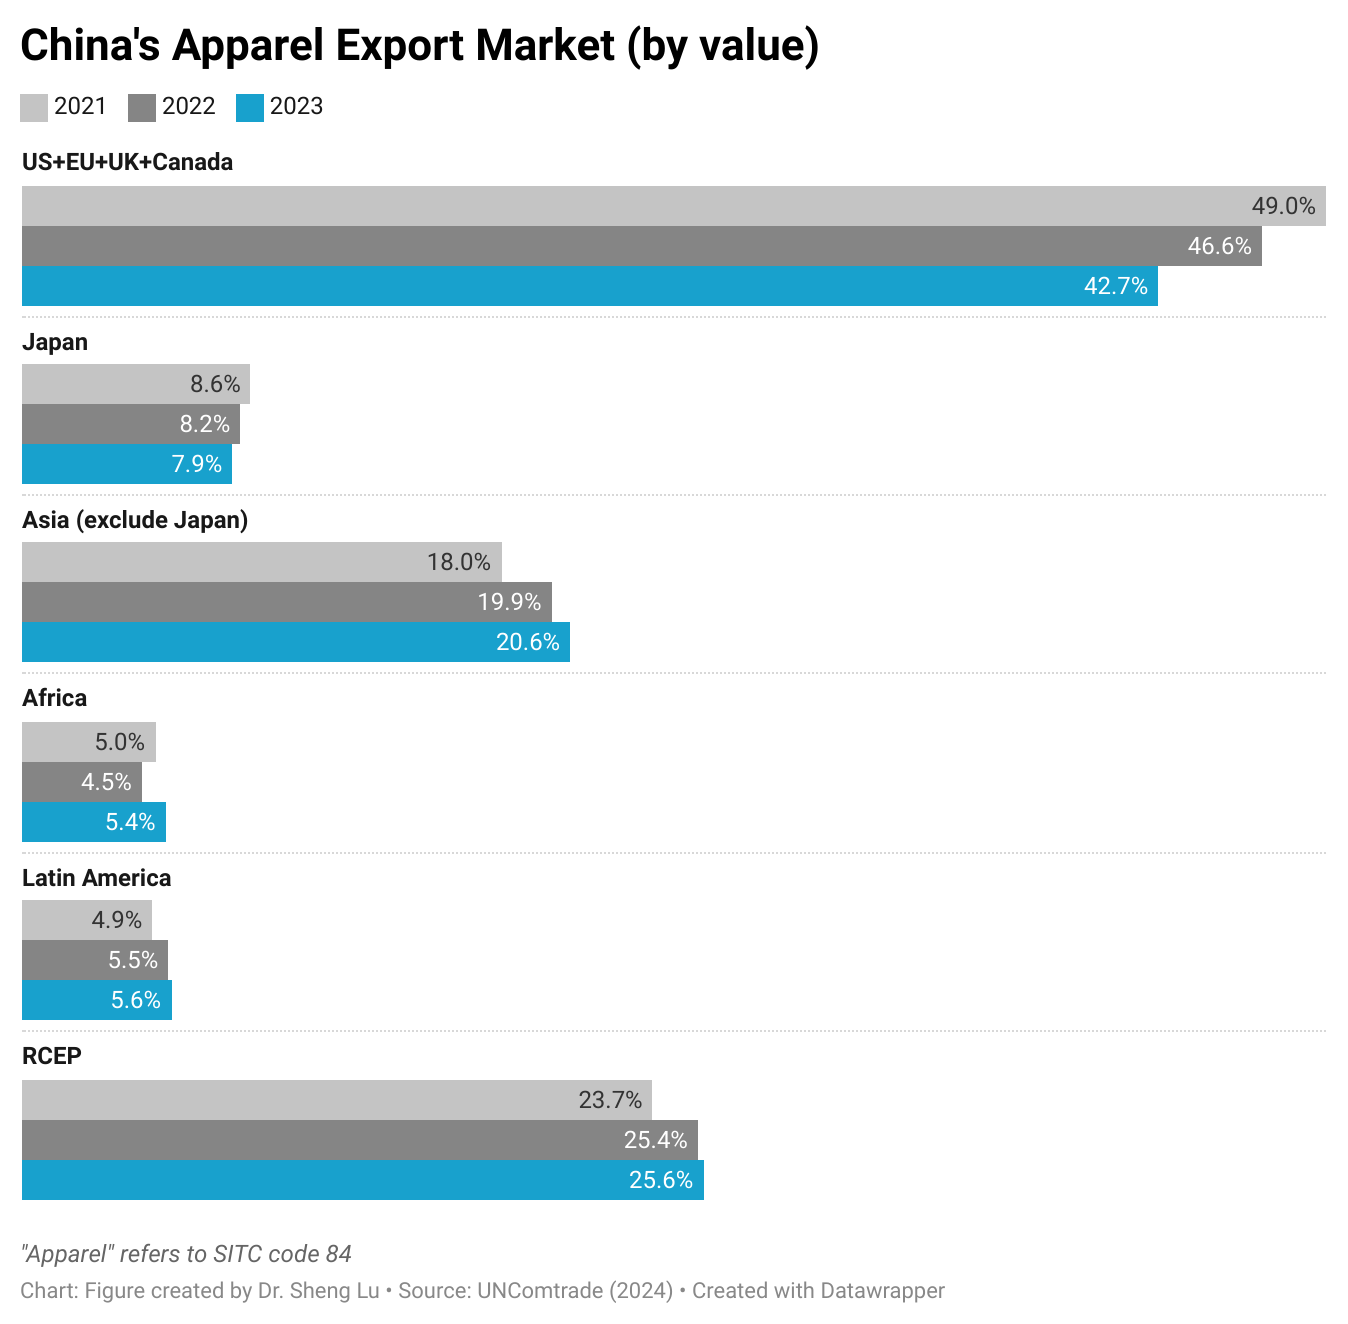
Secondly, China has been diversifying its clothing exports beyond traditional Western markets in response to the “de-risking” movement. For example, the US, EU, UK, and Canada combined accounted for 43-45 percent of China’s clothing exports in 2023, lower than over 50 percent in the past. In comparison, these four Western markets typically accounted for 70 to 90 percent of an Asian country’s clothing exports. Meanwhile, since 2021, Asian economies, especially members of the Regional Comprehensive Economic Partnership (RCEP) and Africa, have become more important export markets for China. Nevertheless, since RCEP members and those in Africa primarily consist of developing economies with ambitions to expand their own clothing production and exports, the long-term growth prospects for their demand for “Made in China” clothing remain uncertain.
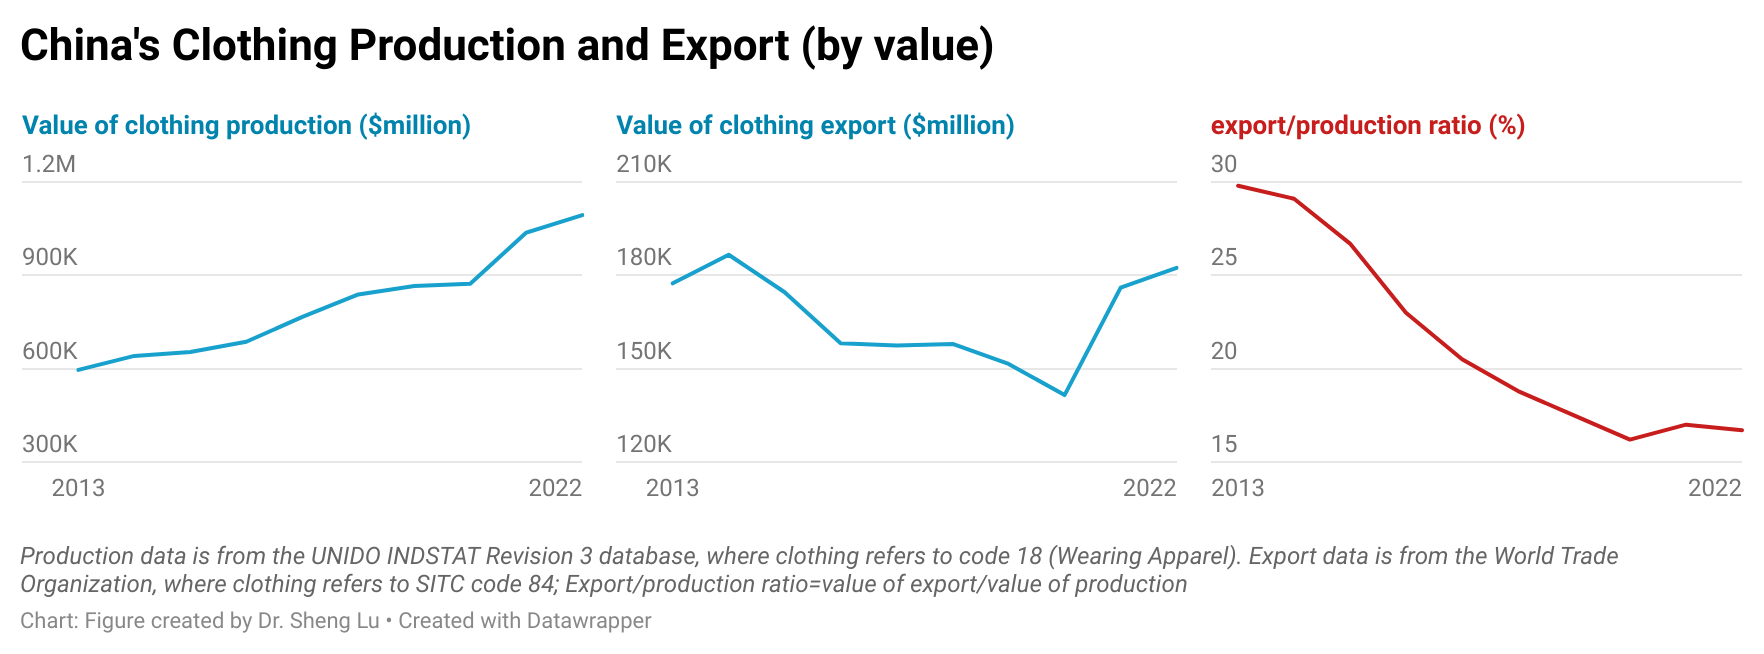
Thirdly, China’s weakened economy could lead to an increased supply of low-cost Chinese clothing in the global market.
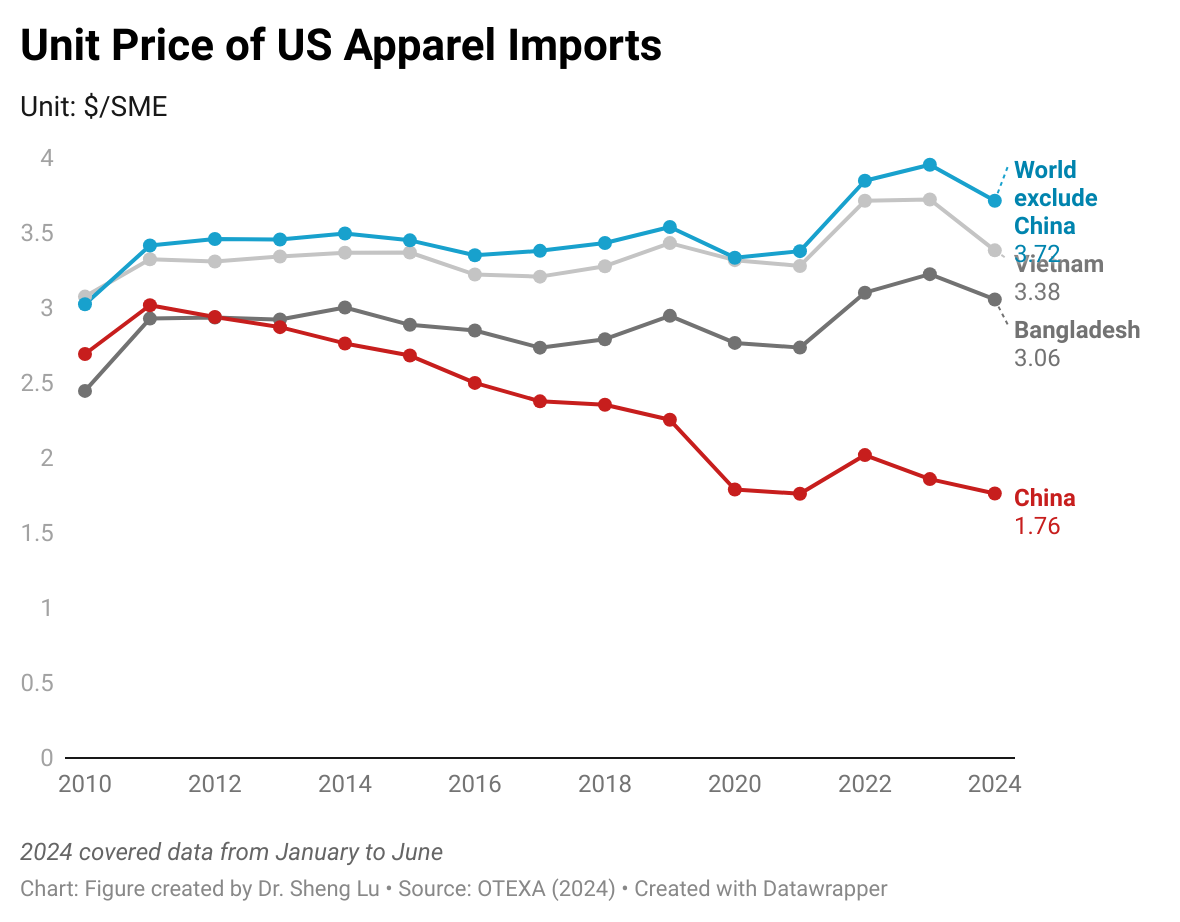
Despite being known as the world’s largest clothing exporter, between 2013 and 2022 (the latest available data), over 70%–80% of clothing produced in China was consumed domestically,with only about 20%–30% being exported. However, as China’s economic growth has slowed and consumer spending on clothing has stalled, more clothing made in China could enter the international market and intensify the price competition. Notably, between June 2023 and June 2024, the average unit price of US apparel imports from China decreased unusually by 7.6 percent, signaling that an increased supply of Chinese clothing began to suppress market prices. Likewise, it doesn’t seem reasonable that the unit price of U.S. apparel imports from China was 40% lower than that of imports from Bangladesh in the first half of 2024. Thus, the growing influx of cheap Chinese products raises the risk of market disruptions, potentially leading to additional trade tensions and restrictive measures against Chinese products.
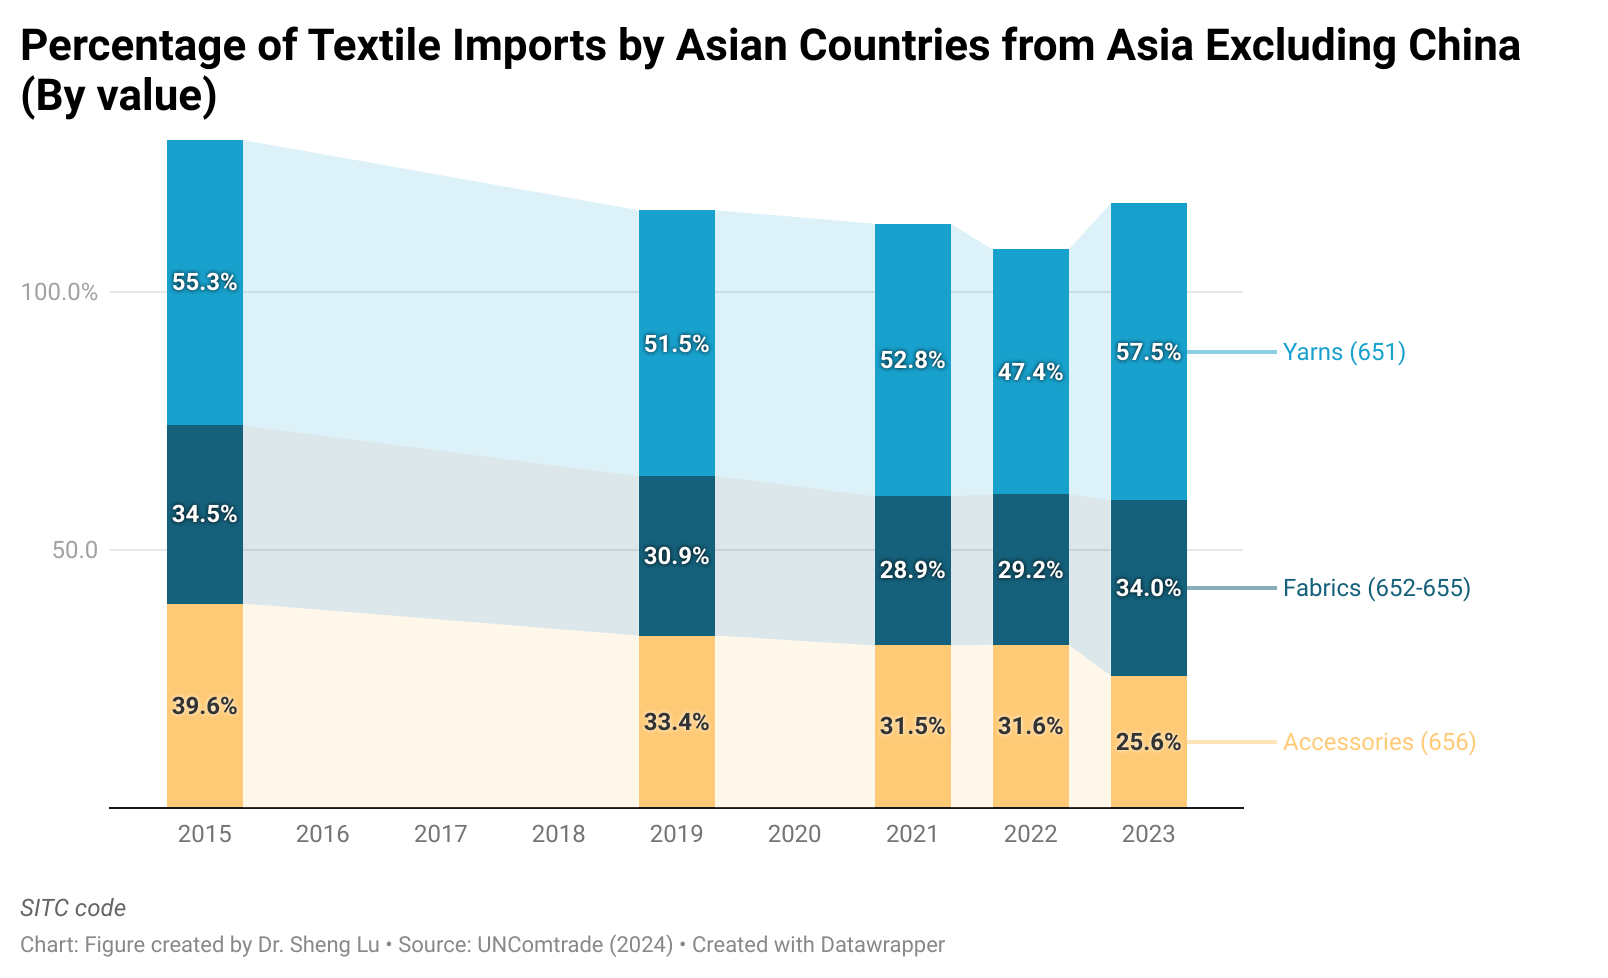
Fourthly, there is an early sign that Asian countries have become more cautious about using Chinese yarns and fabrics. China remained a key supplier of textile raw materials to leading apparel-exporting countries in Asia. However, Asian countries appeared to be sourcing fewer yarns and fabrics from China in 2023, possibly due to the enforcement of anti-forced labor laws, such as the Uyghur Forced Labor Prevention Act (UFLPA), and the perceived risks associated with sourcing Chinese cotton. Instead, more Asian countries’ yarns and fabrics now came from regional suppliers other than China.
Textiles and apparel “Made in the USA” have gained growing attention in recent years amid the increasing supply chain disruptions during the pandemic, the rising geopolitical tensions worldwide, and consumers’ increasing interest in sustainable apparel and faster speed to market. Statistics from the U.S. Bureau of Economic Analysis showed that U.S. textile and apparel production totaled nearly $28 billion in 2022, a record high in the most recent five years. Meanwhile, unlike in the old days, a growing proportion of textiles and apparel “Made in the USA” are sold overseas today. For example, according to the Office of Textiles and Apparel (OTEXA) under the U.S. Department of Commerce, U.S. textiles and apparel exports exceeded $24.8 billion in 2022, up nearly 12% from ten years ago.
By leveraging U.S. Department of Commerce Office of Textiles and Apparel (OTEXA)’s “Made in U.S.A. Sourcing & Products Directory,” this study explored U.S. textiles and apparel manufacturers’ detailed production and export practices. Altogether, 432 manufacturers included in the directory as of October 1, 2023, were analyzed. These manufacturers explicitly mentioned making one of the following products: fiber, yarn, fabric, garment, home textiles, and technical textiles.
Key findings:
First, U.S. textile manufacturers exhibit a notable geographic concentration, whereas apparel manufacturers are dispersed throughout the country. Meanwhile, by the number of textile and apparel manufacturers, California and North Carolina are the only two states that rank in the top five across all product categories, showcasing the most comprehensive textile and apparel supply chain there.
Second, U.S. textile and apparel manufacturers have a high concentration of small and medium-sized enterprises (SMEs). Highly consistent with the macro statistics, few textile and apparel manufacturers in the OTEXA database reported having more than 500 employees. Particularly, over 74% of apparel and nearly 60% of home textile manufacturers are “micro-factories” with less than 50 employees.
Third, U.S. textile and apparel manufacturers have limited vertical manufacturing capability. A vertically integrated manufacturer generally makes products covering various production stages, from raw materials to finished products. Results show that only one-third of U.S. textile and apparel manufacturers in OTEXA’s database reported making more than one product type (e.g., yarn or fabric). Meanwhile, specific types of vertically integrated production models are relatively popular among U.S. textile and apparel manufacturers, such as:
Apparel + home textiles (5.8%)
Fabric + technical textiles (5.1%)
Yarn + fabric (3.9%)
However, the lack of fabric mills (N=38 out of 432) appears to be a critical bottleneck preventing the building of a more vertically integrated U.S. textile and apparel supply chain.
Fourth, it is not uncommon for U.S. textile and apparel manufacturers to use imported components. Specifically, among the manufacturers in the OTEXA database, nearly 20% of apparel and fabric mills explicitly say they utilized imported components. In comparison, given the product nature, fiber and yarn manufacturers had a lower percentage using imported components (11%). Furthermore, smaller U.S. textile and apparel manufacturers appear to be more likely to use imported components. For example, whereas 20% of manufacturers with less than 50 employees used imported input, only 10.2% of those with 50-499 employees and 7.7% with 500 or more employees did so. The results indicate the necessity of supporting SME U.S. textile and apparel manufacturers to access textile input through mechanisms such as the Miscellaneous Tariff Bill (MTB).
Fifth, many US textile and apparel manufacturers have already explored overseas markets. Specifically, factories making textile products reported a higher percentage of engagement in exports, including fiber and yarn manufacturers (68.4%), fabric mills (78.9%), and technical textiles producers (69.1%). In comparison, relatively fewer U.S. apparel and home textile producers reported selling overseas.
Sixth, U.S. textile and apparel manufacturers’ export markets are relatively concentrated. Specifically, as many as 72% of apparel mills and 57% of home textiles manufacturers in the OTEXA database reported selling their products in less than two markets. These manufacturers also have a high percentage of selling to the U.S. domestic market. Likewise, because of the reliance on the Western Hemisphere supply chain, more than half of U.S. fiber and yarn manufacturers reported only selling in two markets or less. In comparison, reflecting the global demand for their products, U.S. technical textile manufacturers had the most diverse markets, with nearly 40% exporting to more than ten countries.
Seventh, while the Western Hemisphere remains the top export market, many U.S. textile and apparel manufacturers also export to Asia, Europe, and the rest of the world. For example, nearly half of U.S. textile and apparel manufacturers in OTEXA’s database reported exporting to Asia, and over 60% of U.S. technical textile manufacturers sold their products to European customers.
Additionally, over half of U.S. textile and apparel mills engaged in exports leveraged U.S. free trade agreements (FTAs). U.S. textile mills, on average, reported a higher percentage of using FTAs than apparel and home textile manufacturers. As most U.S.-led FTAs adopt the yarn-forward rules of origin, the results suggest that while such a rule may favor the export of U.S. textile products, its effectiveness and relevance in supporting U.S. apparel exports could be revisited.
Moreover, in line with the macro trade statistics, U.S. textile and apparel manufacturers in the OTEXA database reported a relatively high usage of USMCA, given Mexico and Canada being the two most important export markets. In comparison, U.S. textile and apparel manufacturers’ use of CAFTA-DR was notably lower, even for fiber and yarn manufacturers (37%) and fabric mills (33.3%).
by Kendall Ludwig, Miranda Rack and Sheng Lu
Picture above: On December 13, 2023, Kendall Ludwig and Miranda Rack, FASH 4+1 graduate students and Dr. Sheng Lu, had the unique opportunity to present the study’s findings to senior U.S. trade officials from OTEXA and the Office of the U.S. Trade Representative (USTR) in Washington DC, including Jennifer Knight (Deputy Assistant Secretary for Textiles, Consumer Goods and Materials), Laurie-Ann Agama (Acting Assistant US Trade Representative for Textiles), Maria D’Andrea-Yothers (Director of OTEXA), Natalie Hanson (Deputy Assistant US Trade Representative for Textiles) and Richard Stetson (Deputy Director of OTEXA).
Check the Udaily article that features the research project and the presentation (February 2024).
Students in FASH455 have proposed the following discussion questions based on the videos about the state of textile and apparel in Asia. Everyone is welcome to join the online discussion. For FASH455 students, please address at least two questions and mention the question number (#) in your reply.
#1 We have seen all the improvements and “upgrading” Vietnam has made toward the fashion industry. What can the garment industry in other countries take away from Vietnam’s experiences?
#2 Is Asia’s highly integrated apparel supply chain unique to the region? Can the Western Hemisphere “copy” Asia’s model?
#3 How can Asia’s textile and apparel industry balance the growing demand for sustainability and the need to remain cost-competitive? What innovative strategies can be adopted to achieve this balance?
#4 As Asian textiles and apparel factories continue to improve their efficiency and expand product offers, will it be beneficial for the US to reach a trade agreement with Asian countries? Or do you believe such an agreement might contradict the goals we try to achieve from CAFTA-DR?
#5 Will Vietnam eventually become the next China, or could its labor shortages be a significant barrier preventing its textile and apparel industry from advancing to the next level?
#6 Should textile and garment factories in Asia make more efforts to appeal to the younger generation (e.g., Gen Z)? Or is automation the solution?
#7 To what extent do you think Asian apparel exporting countries (e.g., Bangladesh, Vietnam and Cambodia) will reduce their dependence on textile raw materials supply from China due to the Uyghur Forced Labor Prevention Act (UFLPA)? Or, instead, do you think Asian apparel-exporting countries other than China benefit from UFLPA?
#8 The video shows that Asian countries have begun to invest heavily in new production capacities for textile recycling. Do you believe the region will continue to dominate textile and apparel production in the era of fashion circularity? Or will the emergence of textile recycling shift the world textile and apparel trade patterns in the long run?
Textile and apparel manufacturing in the U.S. has significantly shrunk in size over the past decades due to multiple factors ranging from automation, import competition to the shifting U.S. comparative advantages for related products. However, U.S. textile manufacturing is gradually coming back. The output of U.S. textile manufacturing (measured by value added) totaled $16.59 billion in 2021, up 23.8% from 2009. In comparison, U.S. apparel manufacturing dropped to $9.5 billion in 2019, 4.4% lower than ten years ago (Bureau of Economic Analysis, 2021).
Meanwhile, like many other sectors, U.S. textile and apparel production was hit hard by COVID-19 in the first half of 2020 but started to recover in the 3rd quarter. Notably, as of December 2021, U.S. textile production had returned to its pre-COVID level.
On the other hand, as the U.S. economy is turning more mature and sophisticated, the share of U.S. textile and apparel manufacturing in the U.S. Gross Domestic Product (GDP) dropped to only 0.12% in 2020 from 0.57% in 1998 (Bureau of Economic Analysis, 2021).
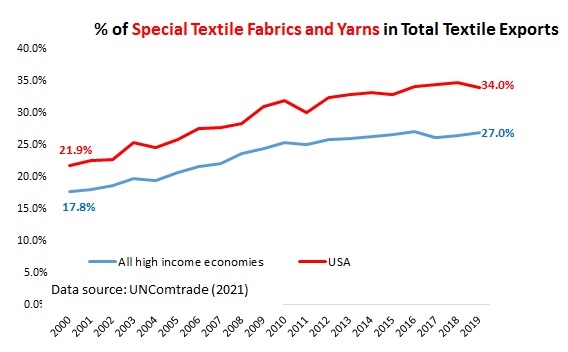
The U.S. textile and apparel manufacturing is changing in nature. For example, textile products had accounted for over 66% of the total output of the U.S. textile and apparel industry as of 2019, up from only 58% in 1998 (Bureau of Economic Analysis, 2020). Textiles and apparel “Made in the USA” are growing particularly fast in some product categories that are high-tech driven, such as medical textiles, protective clothing, specialty and industrial fabrics, and non-woven. These products are also becoming the new growth engine of U.S. textile exports. Notably, “special fabrics and yarns” had accounted for more than 34% of U.S. textile exports in 2019, up from only 20% in 2010 (Data source: UNComtrade, 2021).
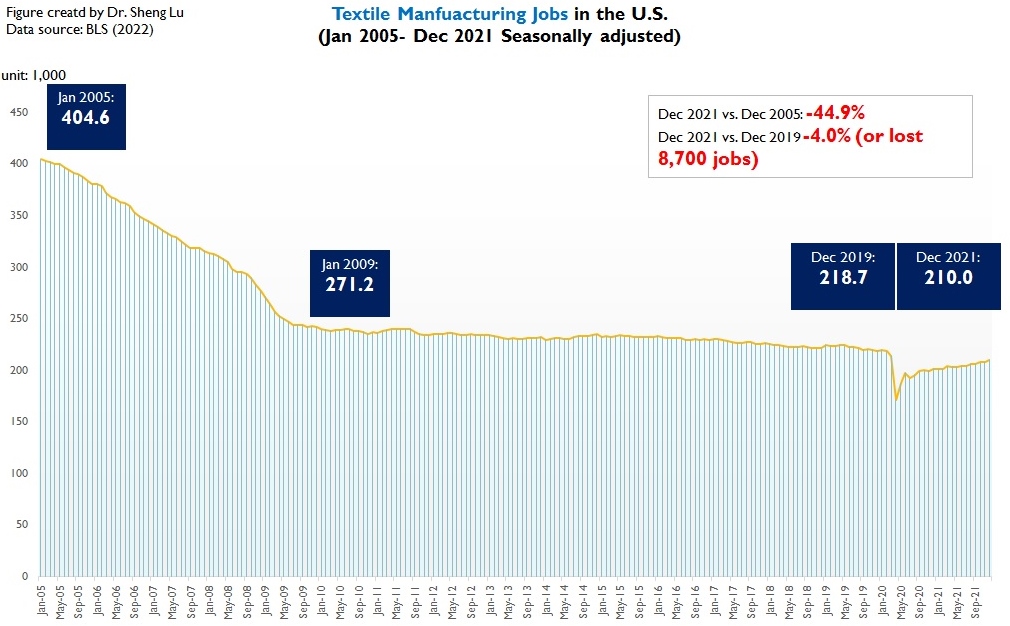
Compatible with the production patterns, employment in the U.S. textile industry (NAICS 313 and 314) and apparel industry (NAICS 315) fell to the bottom in April-May 2020 due to COVID-19 but started to recover steadily since June 2020. From January 2021 to December 2021, the total employment in the two sectors increased by 4.5% and 4.2%, respectively (Seasonally adjusted). However, the employment level remains much lower than the pre-COVID level (benchmark: December 2019).
To be noted, as production turns more automated and thanks to improved productivity (i.e., the value of output per worker), U.S. textile and apparel factories have been hiring fewer workers even before the pandemic. The downward trend in employment is not changing for the U.S. textile and apparel manufacturing sector. Related, how to attract the new generation of workforce to the factory floor remains a crucial challenge facing the future of textile and apparel “Made in the USA.”
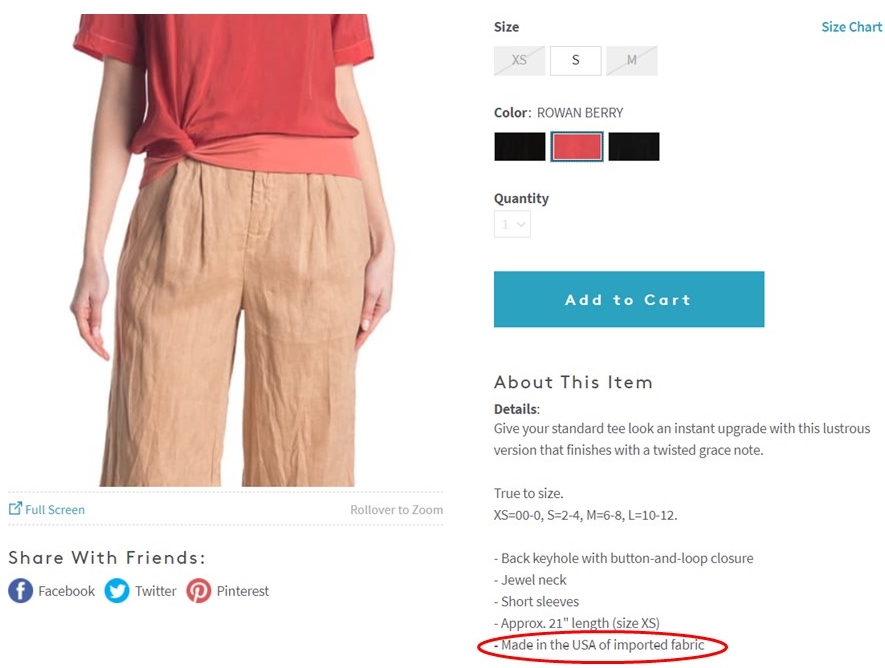
It is not rare to find clothing labeled “made in the USA with imported fabric” or “made in the USA with imported material” in the stores. Statistical analysis shows a strong correlation between the value of U.S. apparel output and U.S. yarn and fabric imports from 1998 to 2019.
Like many other developed economies whose textile and apparel industries had reached the stage of post-maturity, the United States today is a net textile exporter and net apparel importer. COVID-19 has affected U.S. textile and apparel trade in several ways:
Trade volume fell and yet fully recovered: Both affected by the shrinkage of import demand and supply chain disruptions, the value of U.S. textile and apparel imports dropped by as much as 19.3% in 2020 from a year ago, particularly apparel items (down 23.5%). Likewise, the value of U.S. textile and apparel exports in 2020 decreased by 15.6%, including an unprecedented 26% decrease in yarn exports. Further, thanks to consumers’ robust demand, the value of US apparel imports enjoyed a remarkable 27.4% growth in 2021 from a year ago and but was still 2.5% short of the level in 2019.
Trade balance shifted: Before the pandemic, U.S. was a net exporter of fabrics. However, as the import demand for non-woven fabrics (for making PPE purposes) surged during the pandemic, U.S. ran a trade deficit of $502 million for fabrics in 2020; the trade deficit expanded to $975 million in 2021. Meanwhile, as retail sales slowed and imports dropped during the pandemic, the U.S. trade deficit in apparel shrank by 19% in 2020 compared with 2019. However, the shrinkage of the trade deficit did not necessarily boost clothing “Made in the USA” in 2020, reminding us that the trade balance often is not an adequate indicator to measure the economic impact of trade.
No change in export market: More than 70% of U.S. textile and apparel export went to the Western Hemisphere in 2021, a pattern that has stayed stable over the past decades (OTEXA, 2022). More can be done to strengthen the Western Hemisphere supply chain and textile and apparel production in the region by leveraging regional trade agreements like CAFTA-DR and USMCA.
In April 2022, the Office of the United States Trade Representative (USTR) released its 2023 Fiscal Year Budget report, outlining five goals and objectives for 2023. Notably, textile and apparel is a key sector USTR plans to focus on in the coming year:
Goal 1: Open Foreign Markets and Combat Unfair Trade
Provide policy guidance and support for international negotiations or initiatives affecting the textile and apparel sector to ensure that the interests of U.S. industry and workers are taken into account and, where possible, to provide new or enhanced export opportunities for U.S. industry.
Conduct reviews of commercial availability petitions regarding textile and apparel products and negotiate corresponding FTA rules of origin changes, where appropriate, in a manner that takes into account market conditions while preserving export opportunities for U.S. producers and employment opportunities for U.S. workers.
Engage relevant trade partners to address regulatory issues potentially affecting the U.S. textile and apparel industry’s market access opportunities.
Continue to engage under CAFTA-DR working groups and committees to optimize inclusive economic opportunities; strengthen the agreement and address non-tariff trade impediments; provide capacity building in textile and apparel trade-related regulation and practice on customs, border and market access issues, including agriculture and sanitary and phytosanitary regulation, to avoid barriers to trade.
Continue to engage CAFTA-DR partners and stakeholders to identify and develop means to increase two-way trade in textiles and apparel and strengthen the North American supply chain to enhance formal job creation.
Goal 2: Fully Enforce U.S. Trade Laws, Monitor Compliance with Agreements, and Use All Available Tools to Hold Other Countries Accountable
Closely collaborate with industry and other offices and Departments to monitor trade actions taken by partner countries on textiles and apparel to ensure that such actions are consistent with trade agreement obligations and do not impede U.S. export opportunities.
Research and monitor policy support measures for the textile sector, in particular in China, India, and other large textile producing and exporting countries, to ensure compliance with international agreements.
Continue to work with the U.S. textile and apparel industry to promote exports and other opportunities under our free trade agreements and preference programs, by actively engaging with stakeholders and industry associations and participating, as appropriate, in industry trade shows.
Goal 4: Develop Equitable Trade Policy Through Inclusive Processes
Take the lead in providing policy advice and assistance in support of any Congressional initiatives to reform or re-examine preference programs that have an impact on the textile and apparel sector.
According to the World Trade Statistical Review 2021 report released by the World Trade Organization (WTO), the textiles and apparel trade patterns in 2020 include both continuities and new trends affected by the pandemic and companies’ evolving production and sourcing strategies in response to the shifting business environment.
Pattern #1: COVID-19 significantly affected the world textile and apparel trade volumes, resulting in substantial growth of textile exports and a declined demand for apparel.
Driven by increased personal protective equipment (PPE) production, global textile exports grew by 16.1% in 2020, reaching $353bn. In comparison, affected by lockdown measures, worsened economy, and consumers’ tighter budget for discretionary spending, global apparel export decreased by nearly 9% in 2020, totaling $448bn, the worst performance in decades. The apparel sector is not alone. The world merchandise trade in 2020 also suffered an unprecedented 8% drop from a year ago, with COVID-19 to blame.
Notably, as economic activities returned in the second half of 2020, the world clothing export quickly rebounded to around 95% of the pre-covid level by the end of 2020. That being said, the unexpected resurgence of COVID cases in summer 2021, especially the delta variant, caused new market uncertainties. Overall, the world textile and apparel trade recovery process from COVID-19 will differ from our experiences during the 2008 global financial crisis.
Pattern #2: COVID-19 did NOT shift the competitive landscape of the world textile exports; Meanwhile, textile exports from China and Vietnam gained new momentum during the pandemic.
China, the European Union (EU), and India remained the world’s three largest textile exporters in 2020. Together, these top three accounted for 65.8% of the world’s textile exports in 2020, similar to 66.9% before the pandemic (2018-2019).
Notably, China and Vietnam enjoyed a substantial increase in their textile exports in 2020, up 28.9% and 10.7% from a year ago, respectively. The complete textile and apparel supply chain and considerable production capability allow these two countries to switch clothing production to PPE manufacturing quickly. In particular, Vietnamexceeded South Korea and ranked the world’s sixth-largest textile exporter in 2020 ($10 bn of exports), the first time in history.
The United States dropped one place and ranked the world’s fifth-largest textile exporter in 2020 (was 4th from 2015 to 2019), accounting for 3.2% of the shares (was 4.4% in 2019). Production disruptions at the beginning of the pandemic and the shift toward PPE production for domestic consumption were the two primary contributing factors behind the decline in U.S. textile exports. Due to the regional trade patterns, around 67% of U.S. textile exports went to the Western Hemisphere in 2020, including 46% for members of the U.S.-Mexico-Canada Trade Agreement (USMCA) and another 17.2% for members of the Dominican Republic-Central America Free Trade Agreement (CAFTA-DR).
Pattern #3: Fashion companies’ efforts to diversify apparel sourcing from China somehow slowed during the pandemic.
China, the European Union, Vietnam, and Bangladesh unshakably remained the world’s four largest apparel exporters in 2020. Altogether, these top four accounted for 72.2% of the world market shares in 2020, higher than 71.4% in 2019.
Notably, while China steadily accounted for declining shares in the world’s total apparel exports since 2015, its market shares rebounded to 31.6% in 2020 from 30.7% in 2019. We can observe a similar pattern in Canada (up from 36.2% to 41.2%) and the EU (31.2% to 31.3%), two of the world’s leading apparel import markets. Even in the U.S. market, where Chinese goods face adverse impacts of the tariff war, the market shares of “Made in China” only marginally decreased from 30.8% in 2019 to 29.8% in 2020, compared with a more significant drop before the pandemic (i.e., fell from 34.4% 2018 to 30.8% in 2019).
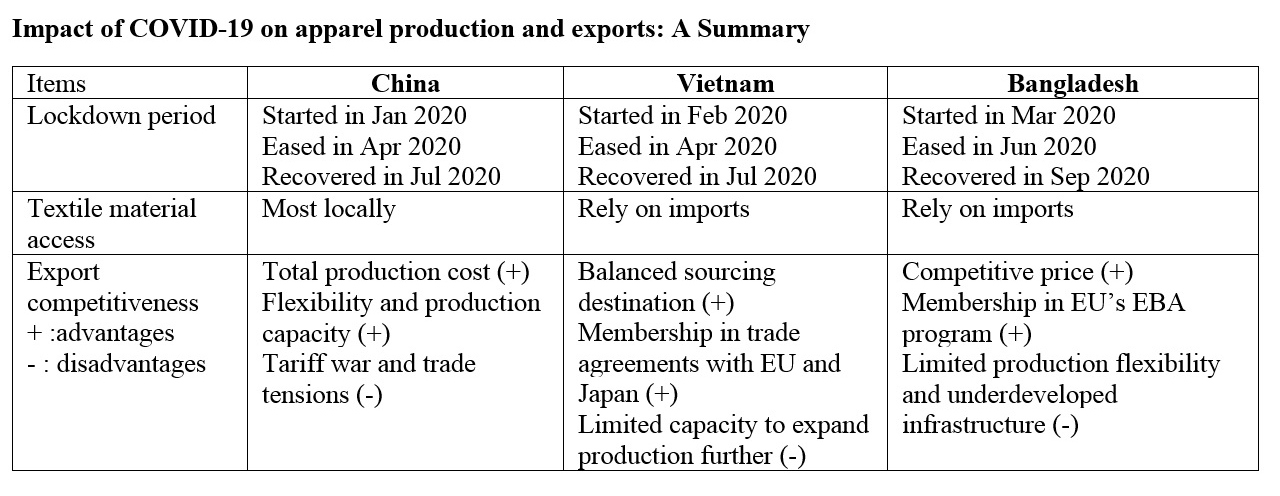
Several factors could explain the resilience of China’s apparel exports: 1) fashion brands and retailers’ particular sourcing criteria match China’s competitiveness during the pandemic (e.g., flexibility, agility, and total landed sourcing cost). 2) China has one of the world’s most complete textile and apparel supply chains, allowing garment factories to access textile raw material and accessories locally. 3) Compared with many other apparel exporting countries, China suffered a shorter COVID lockdown period and resumed apparel production earlier and more quickly. Most Chinese textile and apparel factories started to reopen in April 2020, and they resumed an overall 90%-95% operational capacity rate by July 2020.
Nonetheless, fashion companies are NOT reversing their long-term strategies to reduce “China exposure” for apparel sourcing. On the contrary, non-economic factors, particularly the concerns about forced labor in China’s Xinjiang region, push most western fashion brands and retailers to develop apparel sourcing capacities beyond China. Meanwhile, no single country has yet and will likely become the “Next China” because of capacity limits. Instead, from 2015 to 2020, China’s lost market shares in the world apparel exports (around 7.8 percentage points) were picked up jointly by its competitors in Asia, including ASEAN members (up 4.4 percentage points), Bangladesh (up 1.3 percentage points), and Pakistan (up 0.3 percentage point). Such a trend is most likely to continue in the post-COVID world.
Pattern #4: Developed economies led textile PPE imports during the pandemic, whereas the developing countries imported fewer textiles as their apparel exports dropped.
On the one hand, the value of textile imports by developed economies, including EU members, the United States, Japan, and Canada, surged by more than 30 percent in 2020, driven mainly by their demand for PPE. The result also reveals the significant contribution of international trade in supporting the supply and distribution of textile PPE globally. On the other hand, the developing countries engaged in apparel production and export drove the import demand for textile raw materials like yarns and fabrics. However, most of these developing countries’ textile imports fell in 2020, corresponding to their decreased apparel exports during the pandemic.
Pattern #5: Despite COVID-19, the world apparel import market continues to diversify. The import demand increasingly comes from emerging economies with a booming middle class.
Affected by consumers’ purchasing power (often measured by GDP per capita) and the size of the population, the European Union, the United States, and Japan remained the world’s three largest apparel importers in 2020, a stable pattern that has lasted for decades. While these top three still absorbed 56.2% of the world’s apparel imports in 2020, it was a new record low in the past ten years (was 58.1% in 2019 and 61.5% in 2018), and much lower than 84% back in 2005.
Behind the numbers, it is not the case that consumers in the EU, the United States, and Japan necessarily purchase less clothing over the years. Instead, several emerging economies have become fast-growing apparel-consuming markets with robust import demand. For example, despite COVID-19, China’s apparel imports totaled $9.5bn in 2020, up 6.5% from 2019. From 2010 to 2020, China’s apparel imports enjoyed a nearly 15% annual growth, compared with only 0.56% of the traditional top three. Around 30% of China’s apparel imports today are luxury items made in the EU.
During the pandemic, three factors are most relevant to a country’s apparel export performance: government lockdown measures, textile raw material access, and comprehensive export competitiveness. Against these three factors, apparel producers and exporters in China, Vietnam, and Bangladesh face common but differentiated business challenges and opportunities during the pandemic (see the table above).
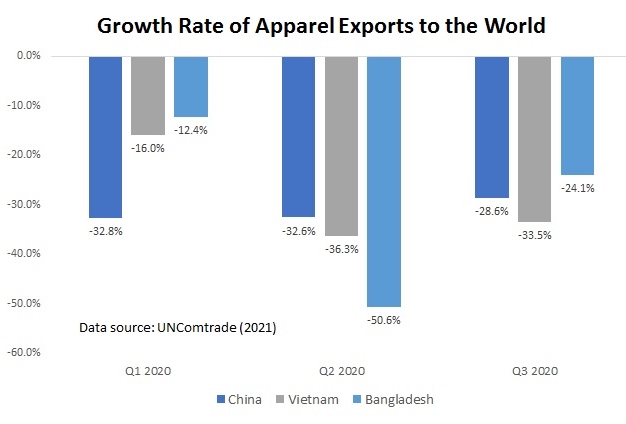
China, Vietnam, and Bangladesh all suffered an unprecedented (nearly 30% year over year) drop in their apparel exports to the world in 2020 (Q1-Q3) due to COVID-19. This result mirrored the reduced import demand in the world’s major apparel consumer markets, where the local economies were also hit hard by the pandemic, including the US (down 2.3%), the EU (down 4.3%), and Japan (down 4.8%).
However, the three countries’ export performance is most different in the US market—China’s apparel exports dropped by 31.6%, much steeper than Vietnam (down 6.9%) and Bangladesh (down 12.6%). It seems that even though COVID-19 may favor China as an apparel sourcing base from an economic perspective, US fashion companies have given more weight to non-economic factors, such as the outlook of the trade war, in their sourcing decisions involving China.
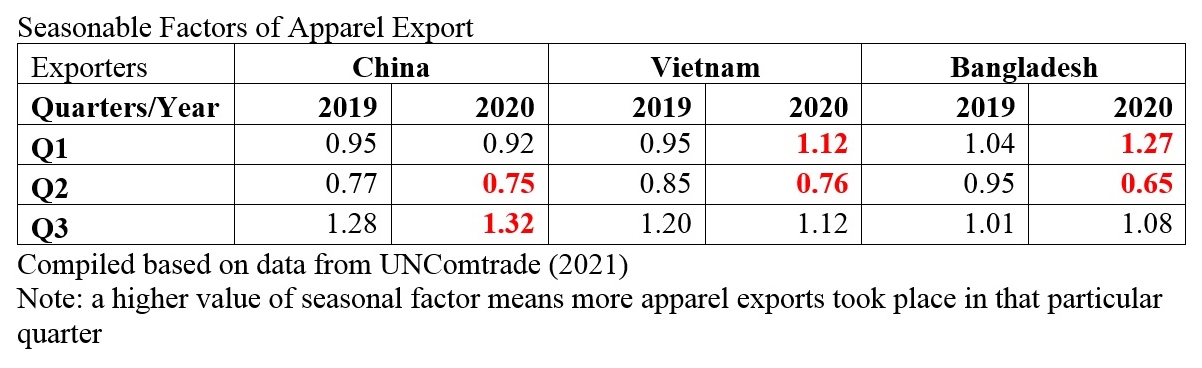
COVID-19 had disrupted apparel exporters’ regular production and export schedule in 2020. The lockdown measures in these three countries seem to affect their export seasonal pattern most significantly. For example, as the first country hit by COVID-19, China’s apparel exports were at the bottom from February to April 2020; however, China’s apparel exports recovered quickly since May 2020 when factories resumed production. In comparison, apparel exports from Vietnam and Bangladesh were at their lowest level from April to May and May to June 2020, respectively, when their factories had to close.
Additionally, Bangladesh’s apparel export seasonality had experienced a more dramatic change in 2020 than in China and Vietnam. A possible reason behind the phenomenon is the export product structure. Notably, China and Vietnam export a more diverse range of products, whereas apparel exports from Bangladesh concentrate on basic fashion items.
Industry sources also indicate that between February 2020 and February 2021, US apparel imports from China and Vietnam see a significant structural change—they include more COVID-popular items such as sweaters, smock dresses, and sweatpants, and fewer dresses, shirts, and suits. However, over the same period, the product structure of US apparel imports from Bangladesh barely changed, and they also included few COVID-popular categories mentioned above. In other words, despite order cancellations, garment factories in China and Vietnam seem more likely to receive new sourcing orders than their counterparts in Bangladesh because of advantages in production flexibility and agility.
Further, China, Vietnam, and Bangladesh all turned less diversified in their apparel export market during the pandemic. Notably, the US, EU, and Japan have become more critical export markets ever. Compared with fashion companies’ efforts in sourcing diversification, it could be more challenging for garment-producing countries to diversify their export market during the pandemic.
[for FASH455 in spring 2022: If you comment on this blog post, please respond to this question: as we are 2 years into the pandemic, why or why not do you think the study’s findings are still valid?]
First, the volume of world textiles and apparel trade reduced in 2019 due to weakened demand and the negative impacts of trade tensions. According to the WTO, the value of the world textiles (SITC 65) and apparel (SITC 84) exports totaled $305bn and $492bn in 2019, respectively, decreased by 2.4% and 0.4% from a year ago. The world merchandise trade also fell by nearly 3% measured by value and 0.1% measured by volume 2018-2019, in contrast with a positive 2.8% growth 2017-2018. Put these numbers in context, the year 2019 was the first time that world merchandise trade fell since the 2008 global financial crisis, and the decline happened even before the pandemic. As noted by the WTO, the economic slowdown and the escalating trade tensions, particularly the tariff war between the United States and China, were among the major contributing factors for the contraction of trade flows.
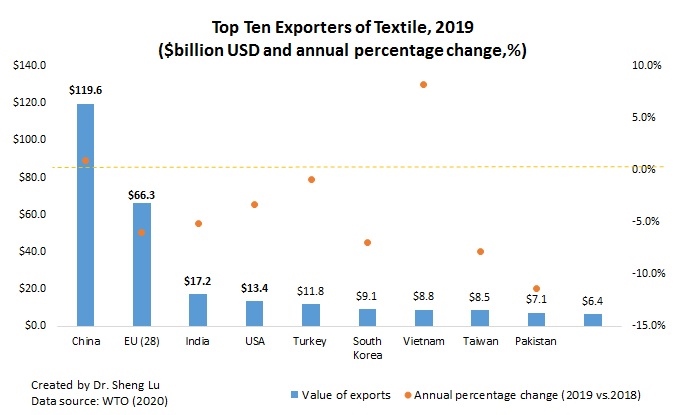
Second, the pattern of world textile exports overall stays stable in 2019; Meanwhile, China and Vietnam continue to gain momentum. China, European Union (EU28), and India remained the world’s top three exporters of textiles in 2019. Altogether, these top three accounted for 66.9% of the value of world textile exports in 2019, almost no change from two years ago. Notably, despite the headwinds, China and Vietnam stilled enjoy the positive growth of their textile exports in 2019, up 0.9%, and 8.3%, respectively. In particular, Vietnam exceeded Taiwan and ranked the world’s seventh-largest textile exporter in 2019 ($8.8bn of exports, up 8.3% from a year earlier), the first time in history. The change also reflects Vietnam’s efforts to continuously upgrade its textile and apparel industry and strengthen the local textile production capacity are paying off.
Third, the pattern of world apparel exports reflects fashion companies’ shifting strategies to reduce sourcing from China. China, the European Union (EU28), Bangladesh, and Vietnam unshakably remained the world’s top four exporters of apparel in 2019. Altogether, these top four accounted for as much as 71.4% of world market shares in 2019, which, however, was lower than 74% from 2016 to 2018—primarily due to China’s reduced market shares.
China is exporting less apparel and more textiles to the world. Notably, China’s market shares in world apparel exports fell from its peak of 38.8% in 2014 to a record low of 30.8% in 2019 (was 31.3% in 2018). Meanwhile, China accounted for 39.2% of world textile exports in 2019, which was a new record high. It is important to recognize that China is playing an increasingly critical role as a textile supplier for many apparel-exporting countries in Asia.
On the other hand, even though apparel exports from Vietnam (up 7.7%) and Bangladesh (up 2.1%) enjoyed fast growth in absolute terms in 2019, their gains in market shares were quite limited (i.e., no change for Vietnam and marginally up 0.3 percentage point from 6.8% to 6.5% for Bangladesh). This result indicates that due to capacity limits, no single country has yet emerged to become the “Next China.” Instead, China’s lost market shares in apparel exports were fulfilled by a group of Asian countries altogether.
Fourth, associated with the shifting pattern of world apparel production, the world textile import is increasingly driven by apparel-exporting countries in the developing world. Notably, 2019 marks the first time that Vietnam emerged to become one of the world’s top three largest importers of textiles, primarily due to its expanded apparel production and heavy dependence on imported textile raw materials. In comparison, although the US and the EU remain the world’s top two largest textile importers, their total market shares had declined from nearly 40% in 2010 to only 31.2% in 2019, the lowest in the past ten years. Furthermore, both the US and the EU have been importing more finished textile products (such as home furnishings and carpets) as well as highly specialized technical textiles, rather than conventional yarns and fabrics for apparel production purposes. The weakening import demand for intermediary textile raw materials also suggests that reshoring (i.e., making apparel locally rather than sourcing from overseas) has NOT become a mainstream industry practice in the developed economies like the US and the EU.
Fifth, the world apparel import market is becoming ever more diversified as import demand is increasingly coming from emerging economies with a booming middle class. Affected by consumers’ purchasing power (often measured by GDP per capita) and size of the population, the European Union (EU28), US, and Japan remained the world’s top three importers of apparel in 2019. This pattern has lasted for decades. Altogether, these top three absorbed 58.1% of world apparel in 2019, which, however, was a new historic low (was 84% back in 2005). Behind the numbers, it is not the case that consumers in the EU, US, and Japan are necessarily purchasing less clothing. Instead, several emerging economies are becoming fast-growing apparel consumption markets and starting to import more. For example, China’s apparel imports totaled $8.9bn in 2019, up 8.1% from a year earlier. From 2010 to 2019, China’s apparel imports enjoyed a nearly 15% annual growth, compared with only 1.9% of the traditional top three.
Presenter: Kendall Keough (MS 2020, Fashion and Apparel Studies)
Textiles and apparel “Made in the USA” are gaining growing attention in recent years amid the escalating U.S.-China trade war, the rising cost of imports, and consumers’ increasing demand for “speed to market.” Statistics show that the value of U.S. textile and apparel (T&A) production totaled $US28.1bn in 2018, which was a record high since 2010. Meanwhile, different from the old days, more and more T&A “Made in the USA” are sold overseas today. According to the Office of Textiles and Apparel (OTEXA) under the U.S. Department of Commerce, the value of U.S. T&A exports reached US$22.9bn in 2019, up nearly 20% from ten years ago.
Despite the strong performance in production and export, however, U.S. T&A manufacturers do not seem to be “visible” enough. Given the information gap, we recently analyzed the 122 U.S. T&A manufacturers included in the OTEXA “Made in the USA” database. Information in the database is self-reported by companies and then verified by OTEXA. Our analysis intends to gain more insights into the state of U.S. T&A mills, including their demographics, production and supply chain strategies, as well as their export behaviors.
Key findings:
First, U.S. T&A manufacturers display a relatively high concentration of geographic locations. Notably, as much as 61% of self-reported yarn manufacturers are from North Carolina (NC), followed by South Carolina (SC), which accounts for another 11%. The concentration of yarn manufacturing in the south, in particular, can be attributed to the abundant cotton supply in that region. Meanwhile, California (CA) has one of the most complete T&A supply chains in the country, with the presence of manufacturers across all T&A sub-sectors.
Second, large-size textile mills are gradually emerging in the United States, whereas U.S. apparel manufacturers are predominantly small and medium-sized. U.S. textile mills, in general, have a high concentration of factories with over 100 employees, particularly those engaged in producing yarns (53%), fabrics (37%), and technical textiles (38%). In the past decade, many relatively small-sized U.S. textile mills had merged into larger ones to take advantage of the economies of scale and reduce production cost. In comparison, over half of the apparel mills in the OTEXA database reported having less than 50 employees. Notably, because of the significant disadvantage in labor cost, U.S. apparel mills are not trying to replace imports, but instead focusing on their “niche market.” For example, designer-based micro-factories are popular these days in U.S. fashion centers such as New York City and California. These factories typically provide customized services, ranging from proto-typing to sample production.
Third, “fabric + apparel” and “fabric + technical textiles” are the two most popular types of vertical integration among U.S. T&A mills. A relatively small proportion of T&A mills included in the OTEXA database had adopted the vertical integration business strategy. Notably, fabric mills seem to be most actively engaged in the vertical integration strategy–around one-third of them reported also making apparel, technical textiles, or home textiles. Additionally, 20% of technical textile manufacturers in the OTEXA database have incorporated an apparel component to their product portfolio. This is a significant trend to watch as more and more sportswear brands are developing technology-driven functional apparel. However, we find few U.S. T&A mills have created a vertical integration model that covers three or more different nature of products.
Fourth, U.S. T&A mills have shifted from only making products to also offering various value-added services. Notably, the majority of companies included in the OTEXA “Made in the USA” database reported having the in-house design capability, including apparel mills (86%), fabric mills (80%), yarn manufacturers (61%), home textiles manufacturers (71%) as well as those making technical textiles (91%). U.S. T&A mills also commonly describe themselves as “innovators” and “solutions providers” on their websites to highlight that the nature of their core business is to serve customers’ needs rather than just “making” physical products.
Fifth, exporting has become an important economic activity of U.S. T&A manufacturers today. Notably, of all the 122 U.S. T&A manufacturers in the OTEXA “Made in the USA” database, as many as 70.5% reported engaged in export, a trend which echoes the rising value of U.S. textile and apparel exports in recent years. Regarding the particular export behaviors of U.S. T&A mills, several patterns are interesting to note:
U.S. textile mills (76%) are more actively engaged in export than those that make apparel products only (37%).
Larger U.S. T&A mills overall had a higher percentage engaged in export than those manufacturers smaller in size.
The Western Hemisphere is the dominant export market for U.S. yarn, fabric, and home textile mills, whereas the export markets for U.S. apparel mills and technical textile producers are relatively more diverse.
Except for apparel producers, the export diversification strategy is commonly adopted by U.S. T&A mills. As many as 77% of yarn manufacturers included in the OTEXA database reported exporting to three or more different markets in the world. Likewise, around 40% of the fabric, home textiles, and technical textiles mills did the same.
Free trade agreements support U.S. T&A exports. A high percentage of U.S. T&A mills that reported exporting to the Western Hemisphere said they took advantage of NAFTA and CAFTA-DR, two primary U.S. free trade agreements with the region. The utilization of NAFTA and CAFTA-DR is particularly high among U.S. yarn producers (83.3%).
Sixth, imports support textile and apparel “Made in the USA”. Using imported inputs such as cut parts, fabrics, accessories and trims is a very common practice among U.S. textile and apparel manufacturers. Notably, more than 76% of companies which make apparel in the United States say they use imported inputs, followed by companies which make technical textiles (52%) and fabrics (46%). Moreover, the lack of sufficient supply of locally made fabrics is the top reason why U.S. textile and apparel companies use imports as alternatives.
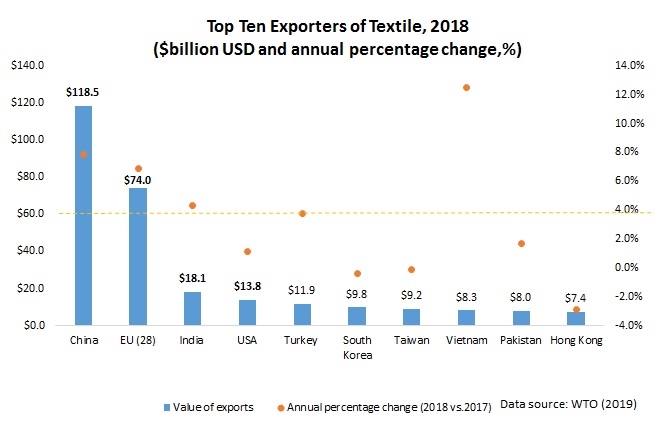
According to the World Trade Statistical Review 2019 newly released by the World Trade Organization (WTO), the current dollar value of world textiles (SITC 65) and apparel (SITC 84) exports totaled $315 billion and $505 billion in 2018 respectively, increased by 6.4% and 11.1% from a year earlier. This has been the fastest growth of world textile and apparel trade since 2012. Specifically:
I. Textile export
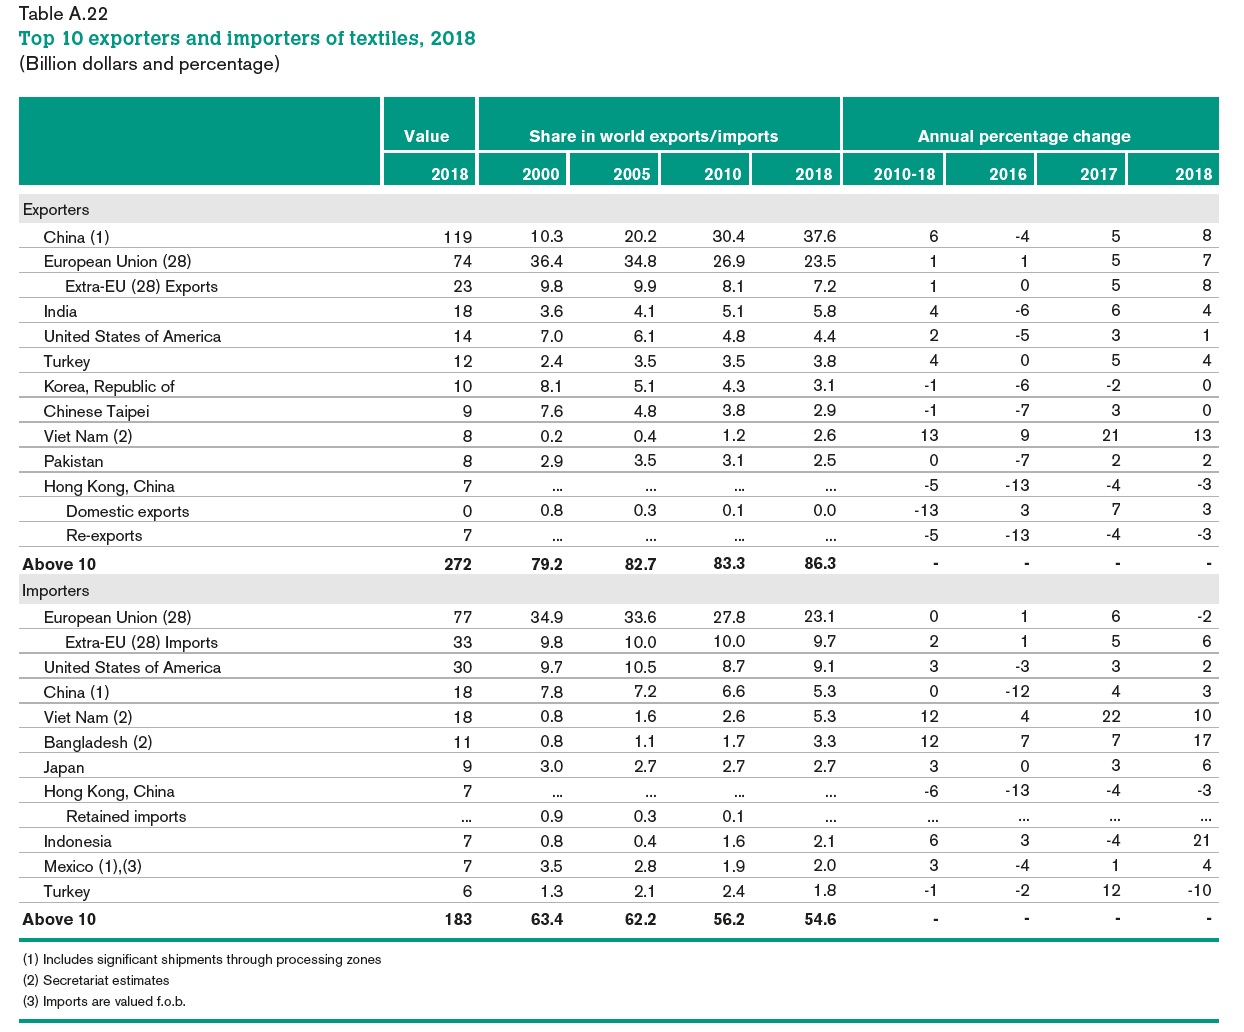
China, European Union (EU28), and India remained the world’s top three exporters of textiles in 2018. Altogether, these top three accounted for 66.9% of world textile exports in 2018, a new record high since 2011. Notably, China and EU (28) also enjoyed a faster-than-world-average export growth in 2018, up 7.9% and 6.9% respectively. The United States remained the world’s fourth top textile exporter in 2018, accounting for 4.4% of the shares, down slightly from 4.6% in 2017.
II. Apparel export
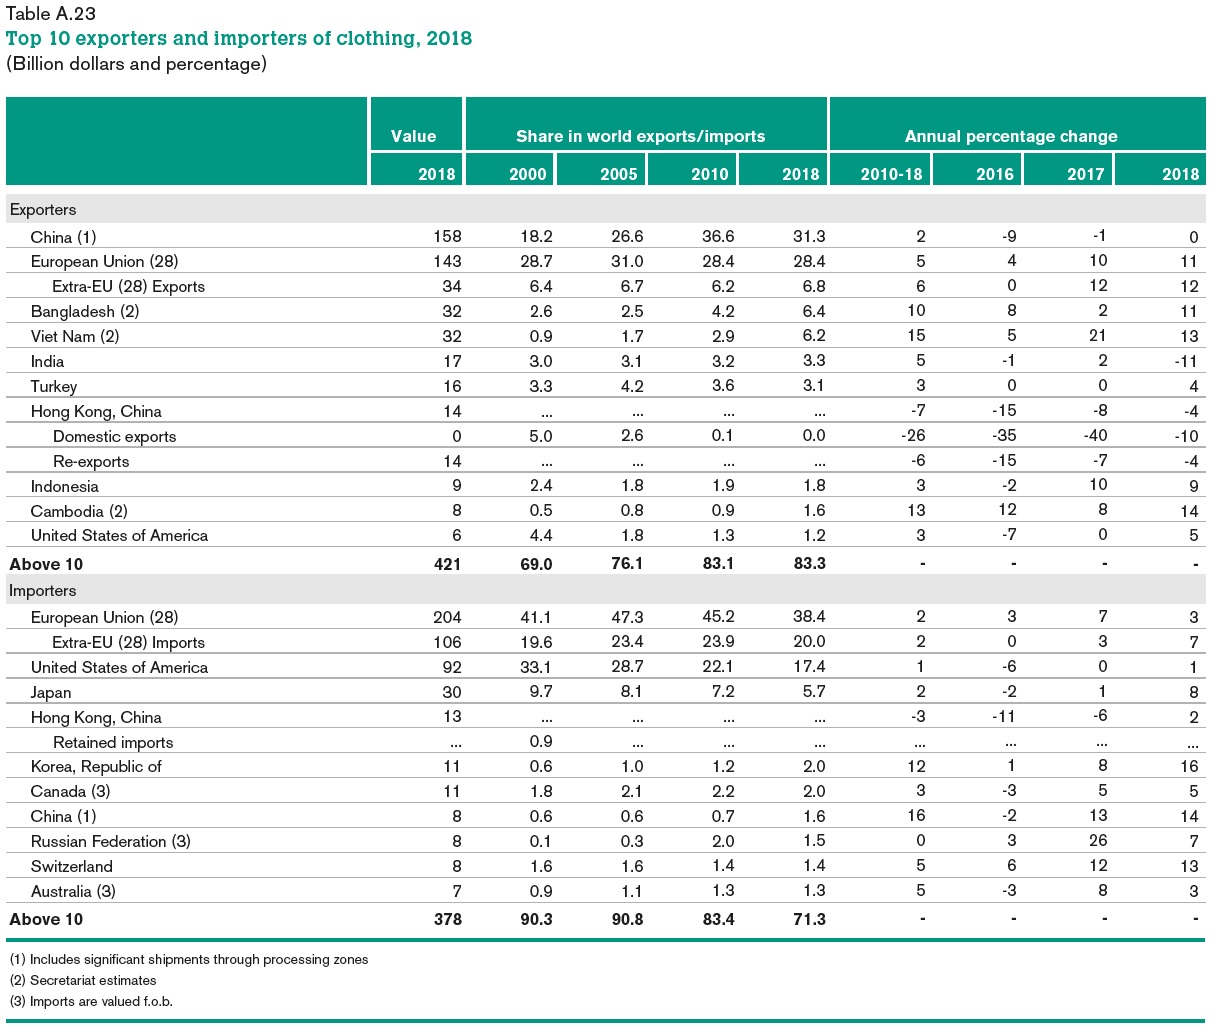
China, the European Union (EU28), Bangladesh, and Vietnam unshakably remained the world’s top four largest exporters in 2018. Altogether, these top four accounted for as much as 72.3% of world market shares in 2018, which, however, was lower than 75.8% in 2017 and 74.3% in 2016—primarily due to China’s declining market shares. Notably, even though apparel exports from Vietnam (up 13.4%) and Bangladesh (up 11.1%) enjoyed a fast growth in absolute terms in 2018, their gains in market shares were quite limited (up 0.3 percentage point from 5.9% to 6.2% for Vietnam and up 0.1 percentage point from 6.4% to 6.5% for Bangladesh). This result once again suggests that due to capacity limits, no single country has emerged to become the “Next China.” Instead, China’s lost market shares in apparel exports were fulfilled by a group of countries, a phenomenon which can be linked with fashion brands and retailers’ sourcing diversification strategy.
III. Textile import
The European Union (EU28), the United States, and China were the top three largest importers of textiles in 2018, accounting for 37.5% of the world’s total textile imports that year. Although the market shares of the top three in 2018 were close to 37.7% a year earlier, it nevertheless was much lower than over 50% back in the 2000s. The increasing diversification of textile import market is associated with the shifting pattern of world apparel manufacturing and export closely.
IV. Apparel import
Affected by consumers’ purchasing power (often measured by GDP per capita) and size of the population, the European Union, the United States, and Japan remained the world’s top three importers of apparel in 2018. Altogether, these top three absorbed 61.5% of world apparel in 2018, which, however, was lower than 62.3% in 2017 and a significant drop from 84% back in 2005. Behind the result, it is not the case that consumers in the EU, U.S., and Japan are importing less clothing. Instead, several emerging economies (such as China) are becoming fast-growing apparel consumption markets and starting to import more. As consumers’ purchasing power in these emerging economies continues to improve, we could expect a more diversified world apparel import market in the years ahead.
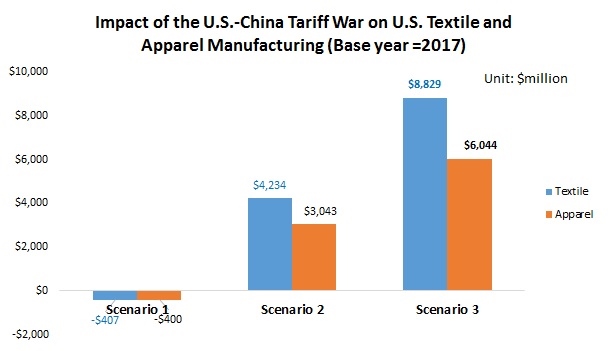
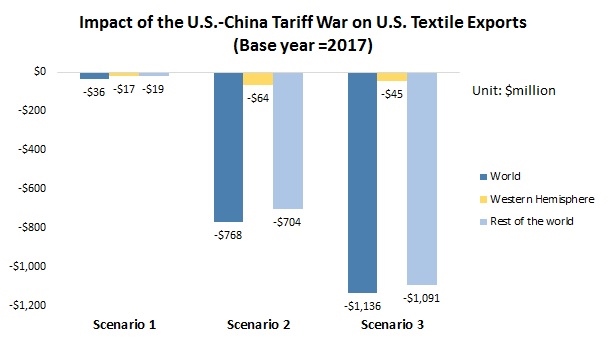
This article tries to evaluate the potential impact of the U.S.-China tariff war on the U.S. textile and apparel (T&A) industry, including manufacturing and related trade activities.
The quantitative evaluation conducted is based on the Global Trade Analysis Project (GTAP) model. Data came from the latest GTAP9 database, which covers trade, employment and production in 57 sectors in 140 countries. In correspondence to the recent development of the U.S.-China tariff war, the analysis focuses on the following three scenarios:
Scenario 1: 10% punitive tariff + base year tariff rate in 2017 applied to products traded between the U.S. and China, except textiles and apparel
Scenario 2: 10% punitive tariff + base year tariff rate in 2017 applied to products traded between the U.S. and China, including textiles and apparel
Scenario 3: 25% punitive tariff + base year tariff rate in 2017 applied to products traded between the U.S. and China, including textiles and apparel
Three findings are of note:
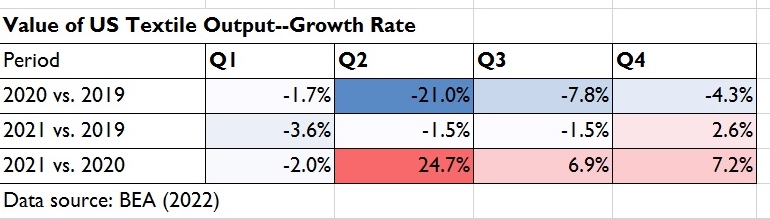
First, the tariff war with China will increase the market price for T&A in the United States and consequentially incentivize more production of T&A “Made in the USA.” As shown in Figure 1, the annual U.S. T&A production will increase when the punitive tariff is imposed on textile and apparel imports from China. The most significant increase will happen in scenario 3 (textile output expands by US$8,829 million and apparel output expands by US$6,044 million) when a 25 percent punitive tariff is imposed and the market price of T&A in the U.S. also correspondingly goes up by nearly 1.5% compared with the base year level in 2017.
Second, the tariff war with China will hurt U.S. textile exports. The results show that the tariff war will increase the production cost of “Made in the USA,” and result in a decline of U.S. textile exports due to reduced price competitiveness. This is the case even in scenario 1 when the tariff war does not target T&A directly, but nevertheless, raises the price of intermediaries for producing textiles in the United States. The results further show that the annual U.S. textile exports will suffer the most significant decline in scenario 3 (down US$1,136 million), especially to China and other Asian countries where U.S. textile products are facing intense competition from local suppliers. In comparison, U.S. textile exports to the Western Hemisphere will suffer a loss as well in the tariff war, but to a much less extent due to the strong supply-chain relationship with the region.
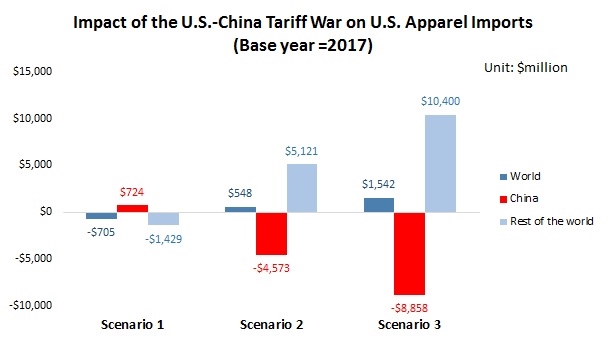
Third, the trade diversion effect of the tariff war will bring in more apparel imports to the U.S. market from Asian suppliers other than China. As shown in the figure above, when the punitive tariff imposed on textile and apparel products, the value of U.S. apparel imports from China will decline ranging from US$4,573 million (10 percent punitive tariff imposed) to US$8,858 million (25 percent punitive tariff imposed) annually compared with the base year level in 2017. This result reflects U.S. apparel importers and retailers’ mounting concerns about sourcing cost in the setting of the tariff war. However, apparently, the tariff war will do little to help U.S. domestic apparel manufacturers reduce the competitive pressure with imports. Particularly, in scenario 3, U.S. apparel imports from suppliers other than China will increase as much as US$10,400 million, worsening the U.S. trade deficit in the apparel sector further.
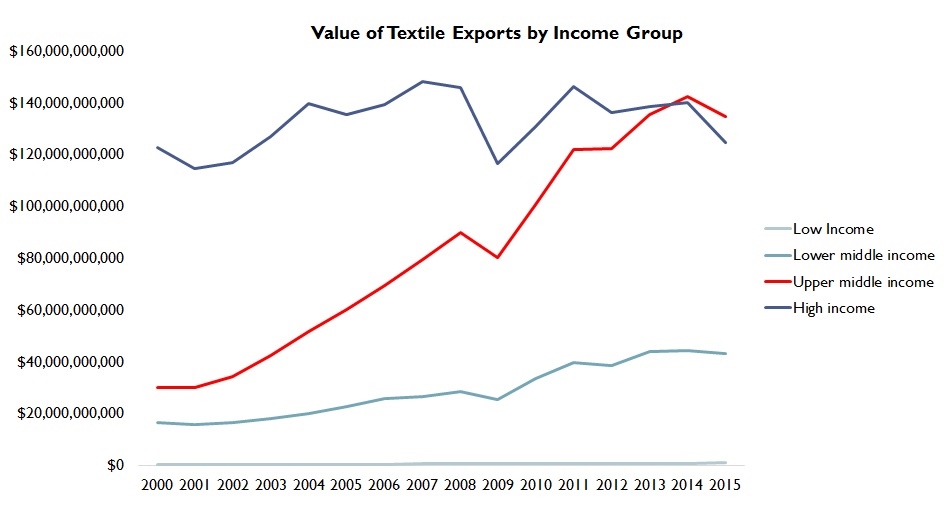
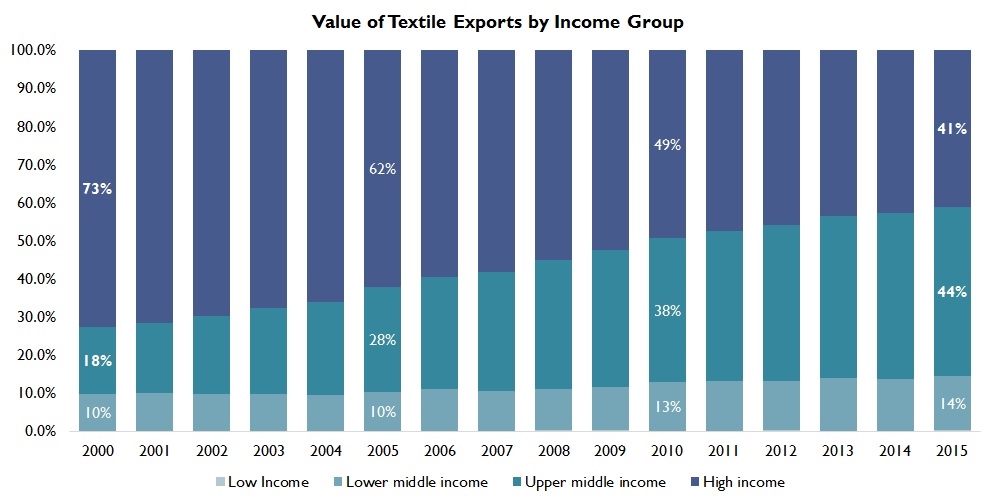
As of 2015, over 40% of textile exports still come from high income countries. Meanwhile, upper middle income countries are quickly expanding exports and gaining more market shares from 2000 to 2015. However, textile exports from low income countries remain minimal.
From 2000 to 2015, shares of apparel exports from high income countries dropped from 50% to 31%. Meanwhile, market shares of upper middle income countries increased from 32% to 46%. However, low incomecountries are becoming even more marginalized in apparel exports: their market shares slipped from 0.3% in 2000 to only 0.1% in 2015.
Additionally, textile and apparel exports in general are economically more important for lower income countries than higher income countries. However, the percentage of textile and apparel in a country’s total merchandise exports seem to be declining across all income groups except for low-income countries. Meanwhile, for a good number of low-income and lower-middle income countries such as Bangladesh, Gambia, Pakistan and Cambodia, textile and apparel remain one of their very few exporting opportunities.
Data source: World Trade Organization (2017), World Bank (2017); Country list (by income groups) can be found HERE
Acknowledgement: Thanks to Sheiron Crawford for assisting the data collection.