
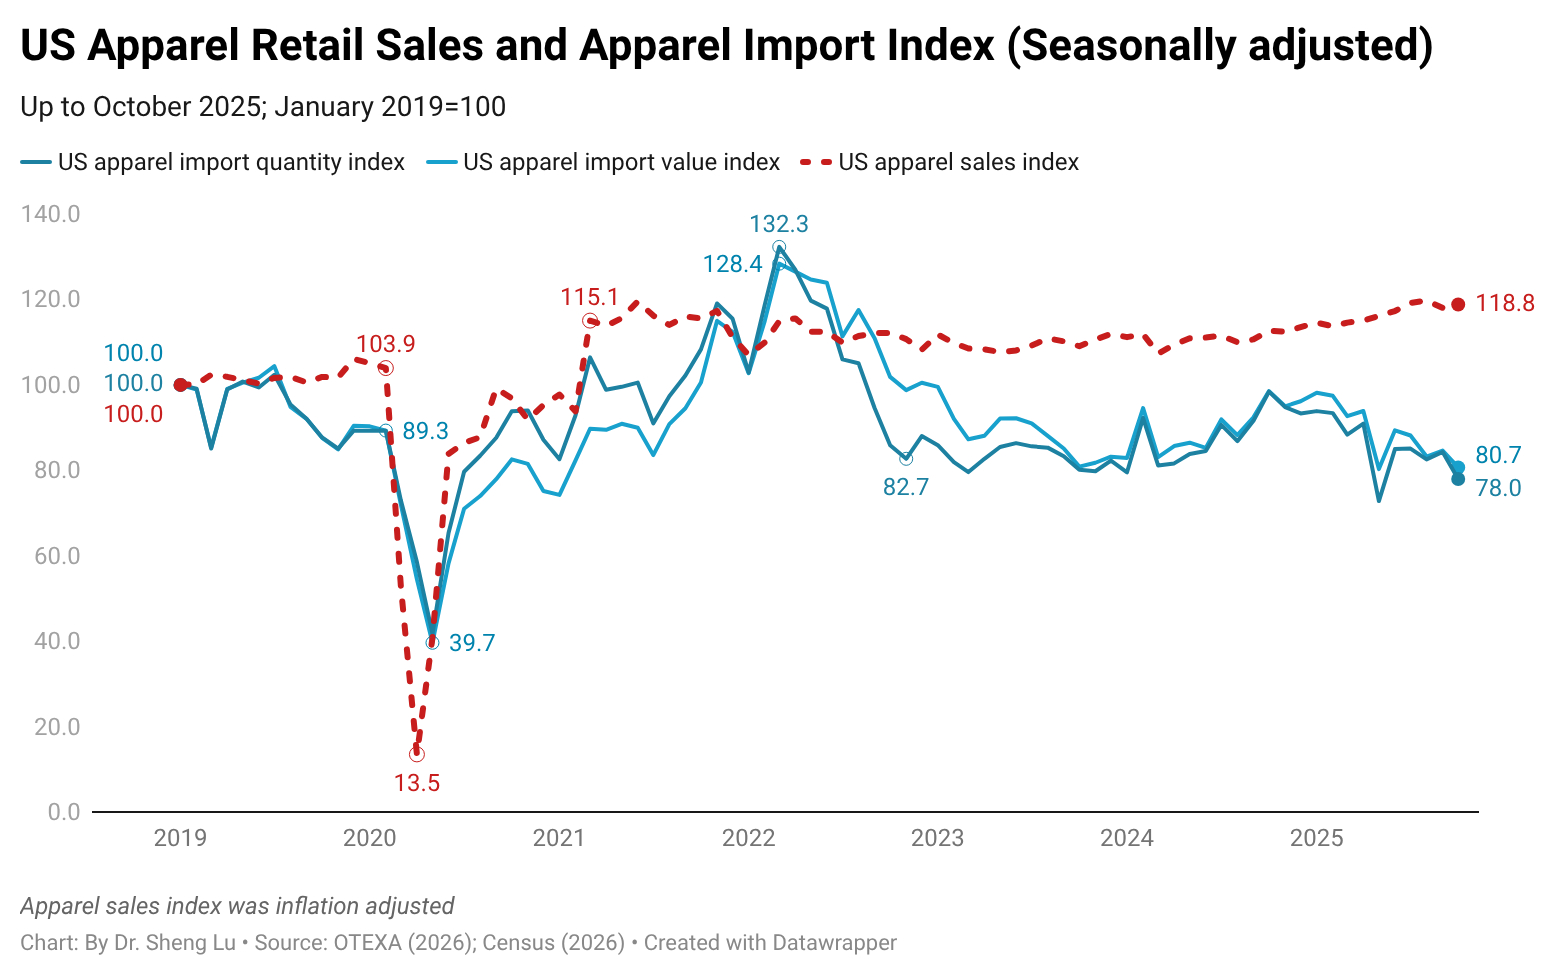
Jointly affected by weak import demand and rising tariffs, US apparel imports in October 2025 sharply declined by 18.5% in value and 21.1% in volume compared to a year earlier. This was the worst performance so far in 2025 and marked a third consecutive month of decline in US apparel imports. Notably, the volume of US apparel imports has become more volatile in 2025 than in previous years, as fashion companies rushed to adjust their original shipping schedules and bring products in early to offset tariff impacts. It is likely that US apparel imports will stay at lower levels in the coming months, especially from December to January, the usual slow import season. (see detailed import data here)

US apparel imports from China experienced another significant decline in October 2025, reflecting US fashion companies’ ongoing strategy of “reducing China exposure.” Specifically, in October 2025, US apparel imports from China dropped by 53.3% in value and 43.1% in quantity year over year, performing much worse than the world average. As a result, in October 2025, China accounted for only 11.3% of US apparel imports in value (down from 19.8% in October 2024) and 25.3% in quantity (down from 35.1% in October 2024), one of the lowest levels in decades. (see detailed market share data here)
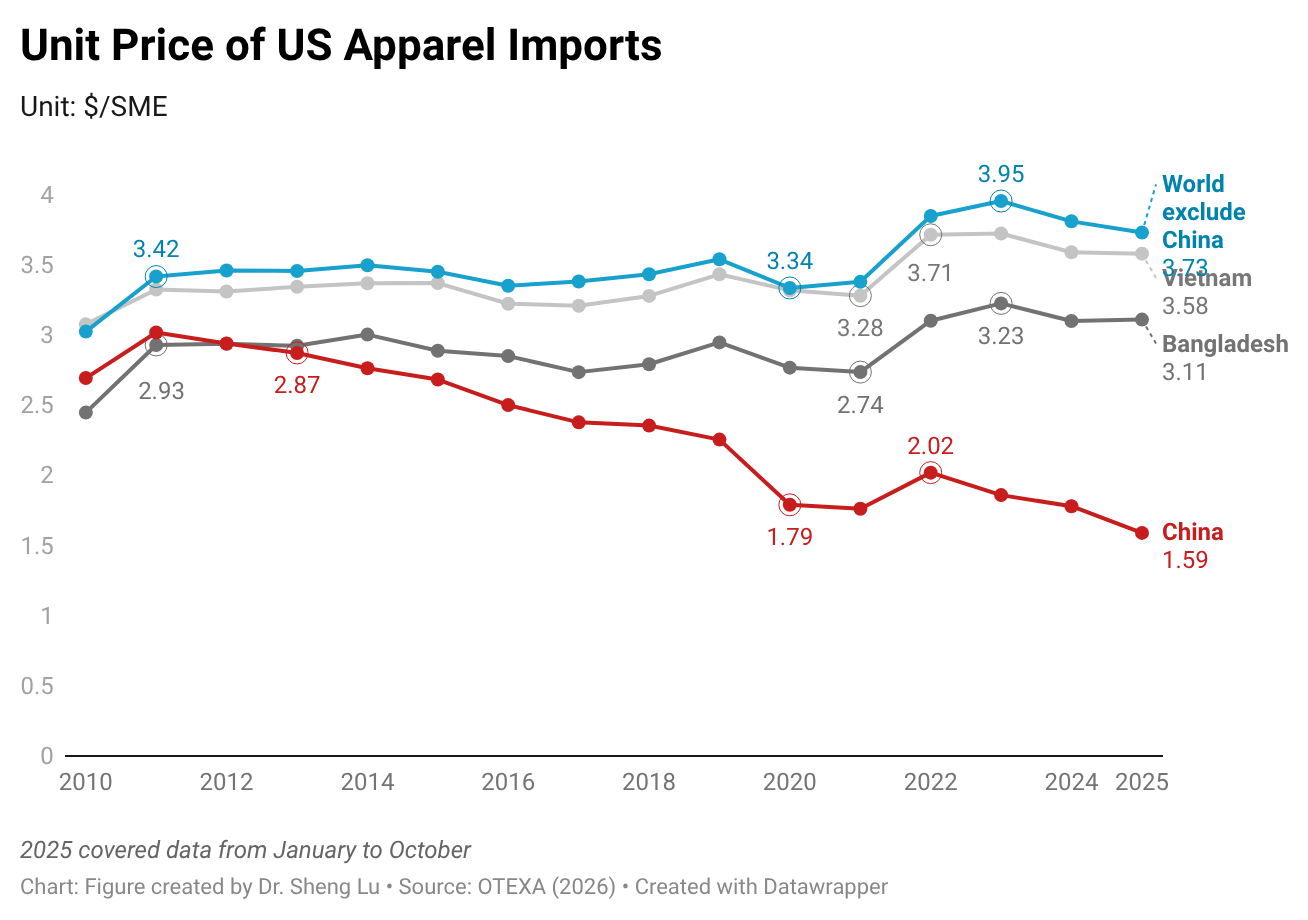
It should also be noted that, measured in dollars per square meter equivalent (SME), the unit price of US apparel imports from China decreased by 10.6% so far in 2025 (January to October), whereas the unit price of total US apparel imports increased by 1.6%. (see detailed unit price data here) These apparently “contradictory” results suggest that the decline in US apparel imports from China may not be driven solely by pricing or even tariffs. Instead, they might also be influenced by US fashion companies’ assessment of sourcing risks and geopolitical issues involving China.

US apparel imports from Asia continued to demonstrate resiliency overall. So far in 2025 (January to October), in value, Asian countries together accounted for 73.0% of US apparel imports, higher than 71.6% in 2024 over the same period. (see detailed Asia market share data here) In October 2025, the value of US apparel imports from top Asian suppliers, excluding China and India, remained relatively stable and even increased. Countries including Vietnam, Bangladesh, Cambodia, Indonesia, and Pakistan also gained additional market share in October 2025 compared to a year ago. These results revealed US fashion companies’ sourcing diversification strategy amid hiking tariffs and policy uncertainty, as well as the competitiveness of these Asian countries in meeting importers’ demand.
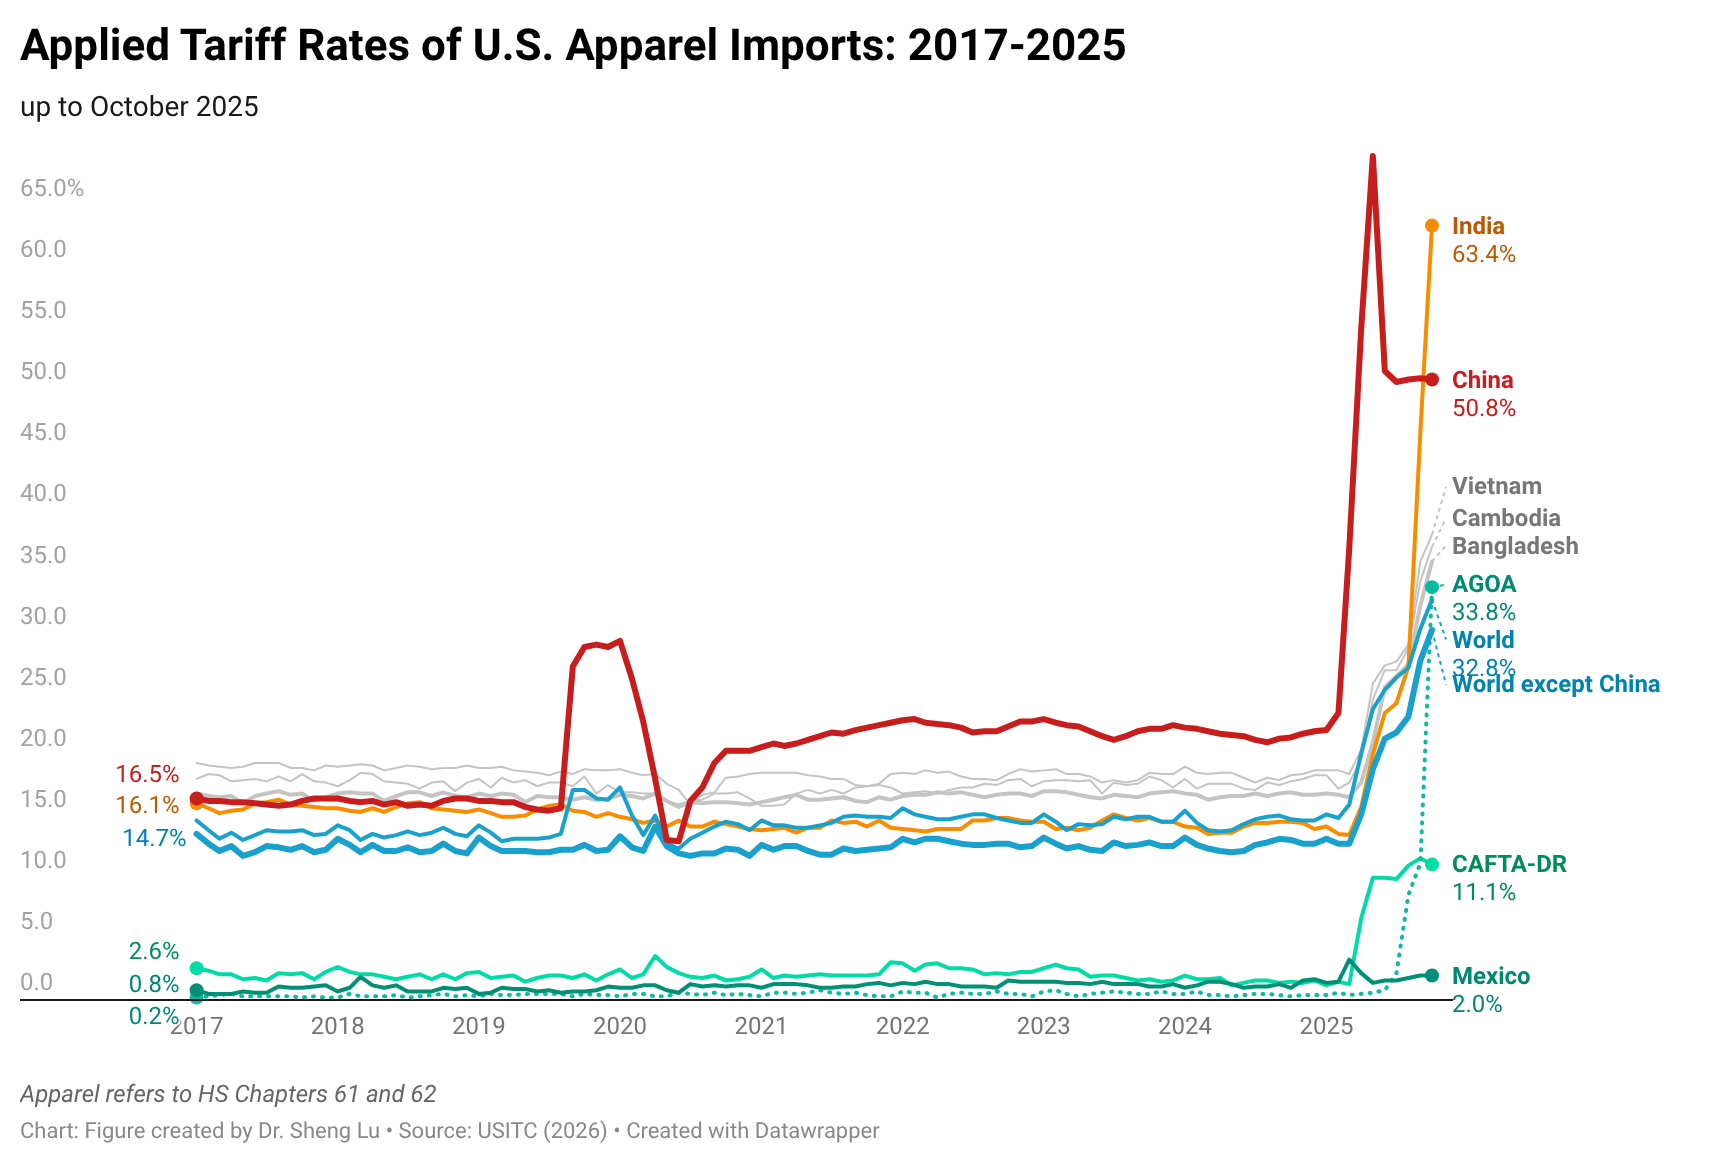
US apparel imports from India declined by nearly 30% in October 2025, highlighting the negative impact of high tariffs on the country’s appeal as a sourcing destination for U.S. fashion companies. Notably, U.S. apparel imports from India were subject to an average tariff of 63.4% in October 2025, even higher than the 50.8% tariff on Chinese products. (See the detailed tariff rates data here) Considering President Trump’s recent comments on sanctioning countries that buy Russia’s oil, the prospects for reducing the punitive tariffs on U.S. apparel imports from India remain uncertain.
In relative terms, Western Hemisphere suppliers gained a small share in US apparel imports in October 2025, including Mexico (rising from 3.1% to 3.5%) and CAFTA-DR members (up from 9.1% to 9.5%). However, in absolute terms, U.S. apparel imports from Mexico and CAFTA-DR still dropped by 8.5% and 15.3% in October 2025, respectively. It also remains uncertain how the recent turmoil related to Venezuela might impact US fashion companies’ assessment of trading and geopolitical risks in the region and their willingness to expand sourcing from the Western Hemisphere in the coming year.
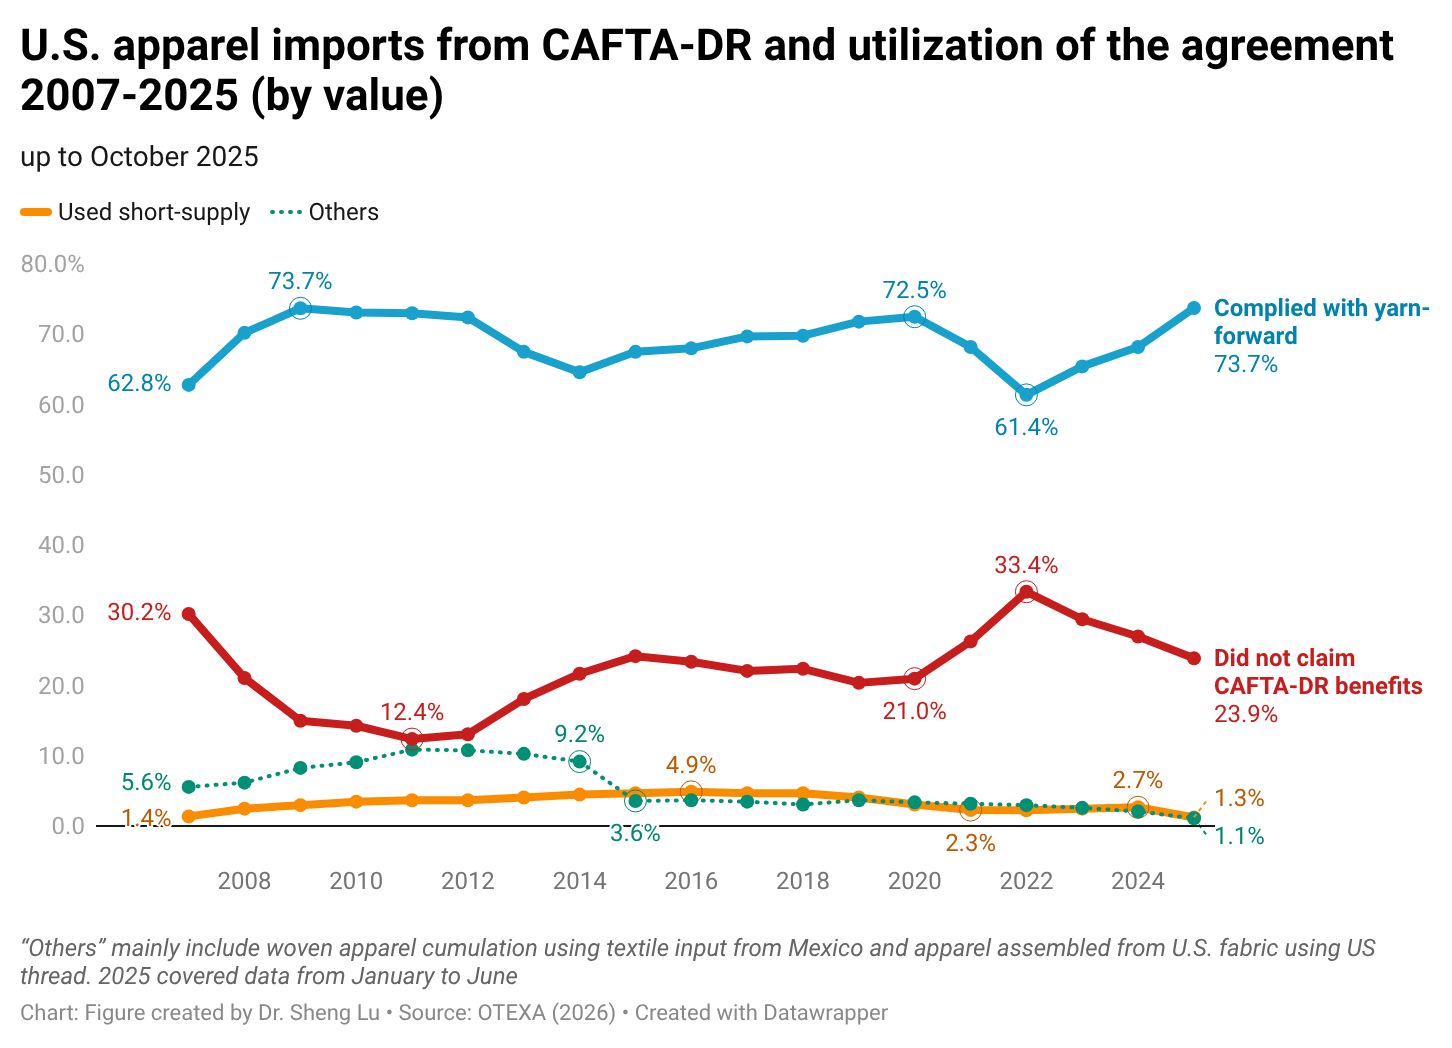
As a silver lining regarding near-shoring from the Western Hemisphere,so far in 2025 (January to October), about 76.1% of US apparel imports from the CAFTA-DR claimed duty-free benefits under the agreement, up from 72.9% in 2024 over the same period. The improved CAFTA-DR utilization so far in 2025 was driven by a higher volume of imports that complied with the yarn-forward rules of origin. However, the utilization rate of the agreement’s short supply mechanism decreased from 2.8% to 1.2% despite more products being added to the list. (See detailed CAFTA-DR utilization data here).
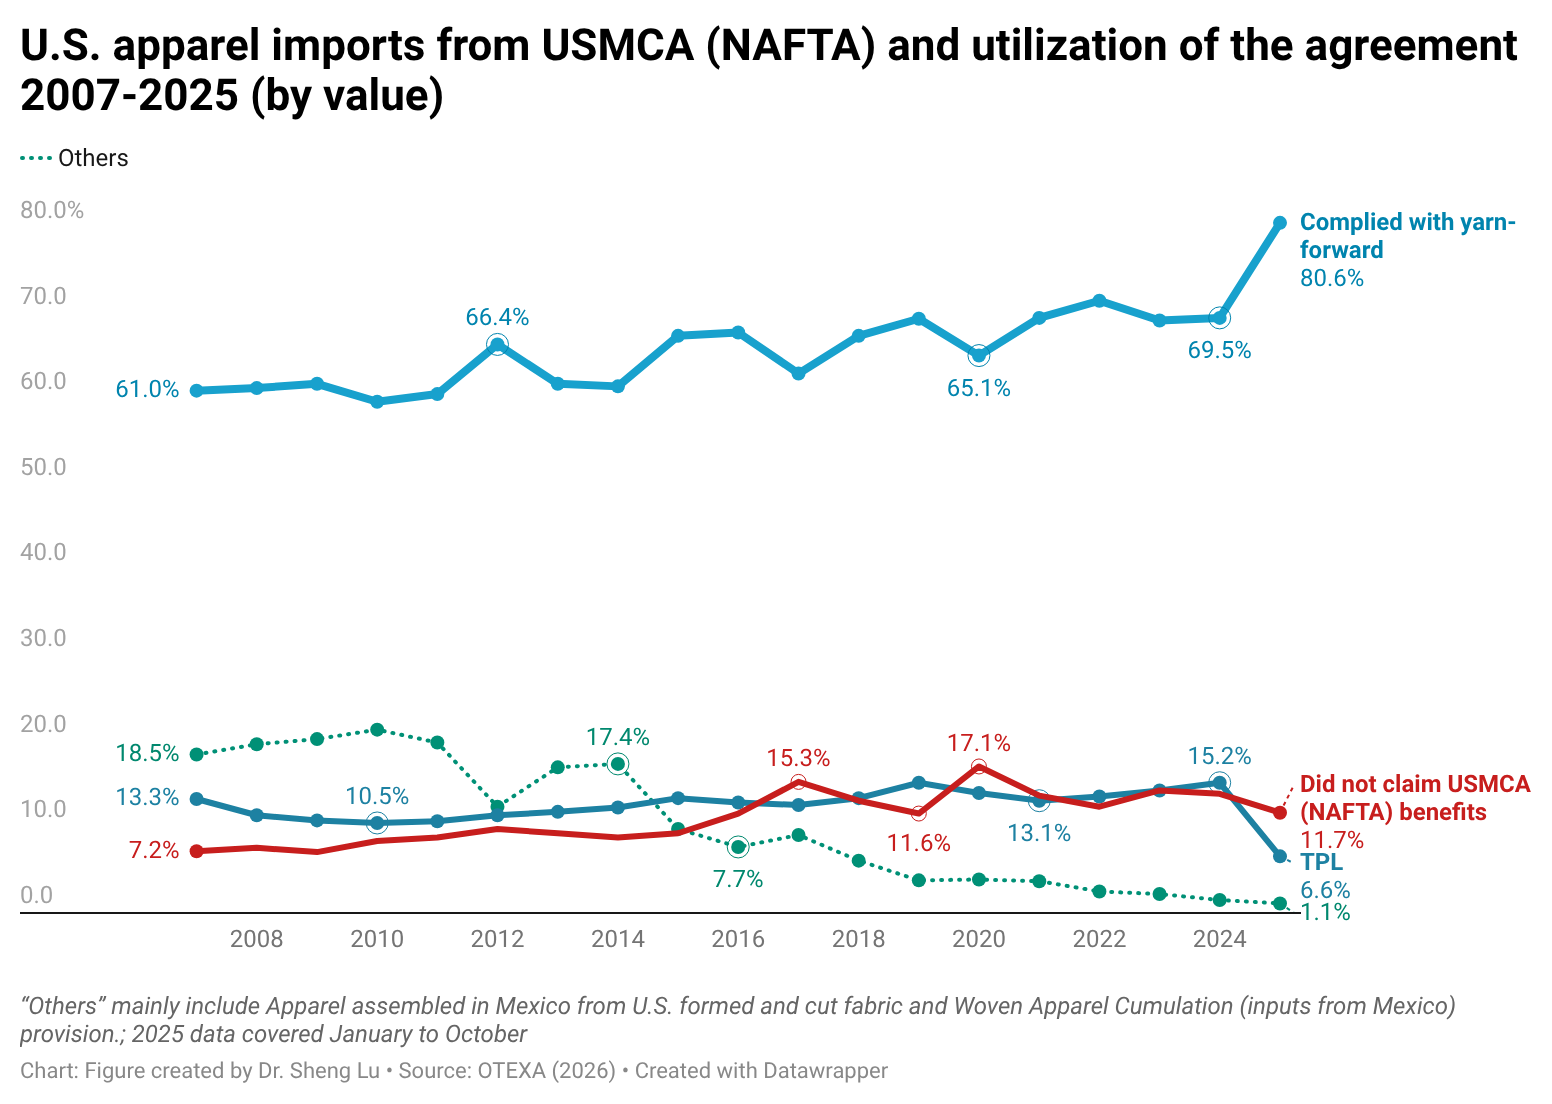
Likewise, in the first ten months of 2025, about 88.3% of US apparel imports from the USMCA claimed duty-free benefits under the agreement, up from 86.4% over the same period in 2024. Notably, in the past, only about 20% of US apparel imports from Canada met the yarn-forward rules of origin; however, this rate increased significantly to 63% in 2025. (See detailed USMCA utilization data here)
by Sheng Lu
Additional reading: Geopolitics Will Shake Up Sourcing—Again—In 2026 (Sourcing Journal)
[discussion for this post is closed; please see the updated analysis]
