Patterns of US Apparel Imports (Updated June 2023)

Please also see the updated analysis: Patterns of US apparel imports in 2023 (Updated February 2024)

The latest OTEXA trade data suggests several US apparel import patterns:

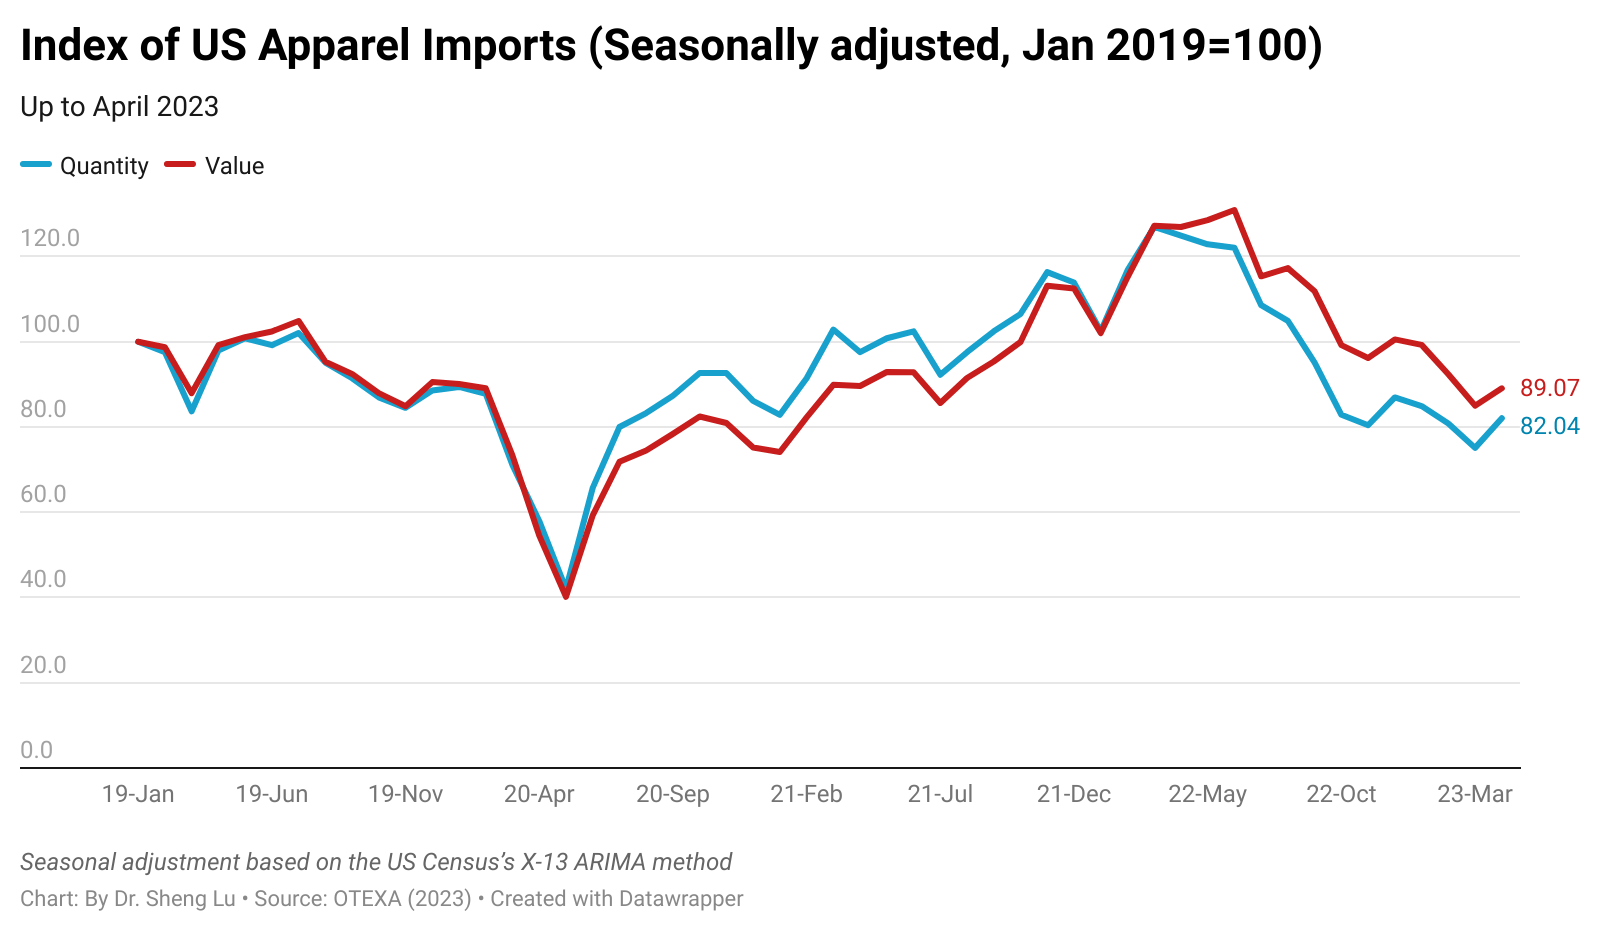
First, US apparel imports indicated a slow improvement in April 2023 but remained weak this year. For example, measured in quantity, US apparel imports fell by 33.9% in April 2023 from a year ago, but it was less significant than in March (i.e., down 40.2% YoY*). Likewise, measured in value, US apparel imports fell by 29.3% YoY in April 2023, which improved from a 32.7% YoY decline in March 2023. (*YoY: Year-over-year)

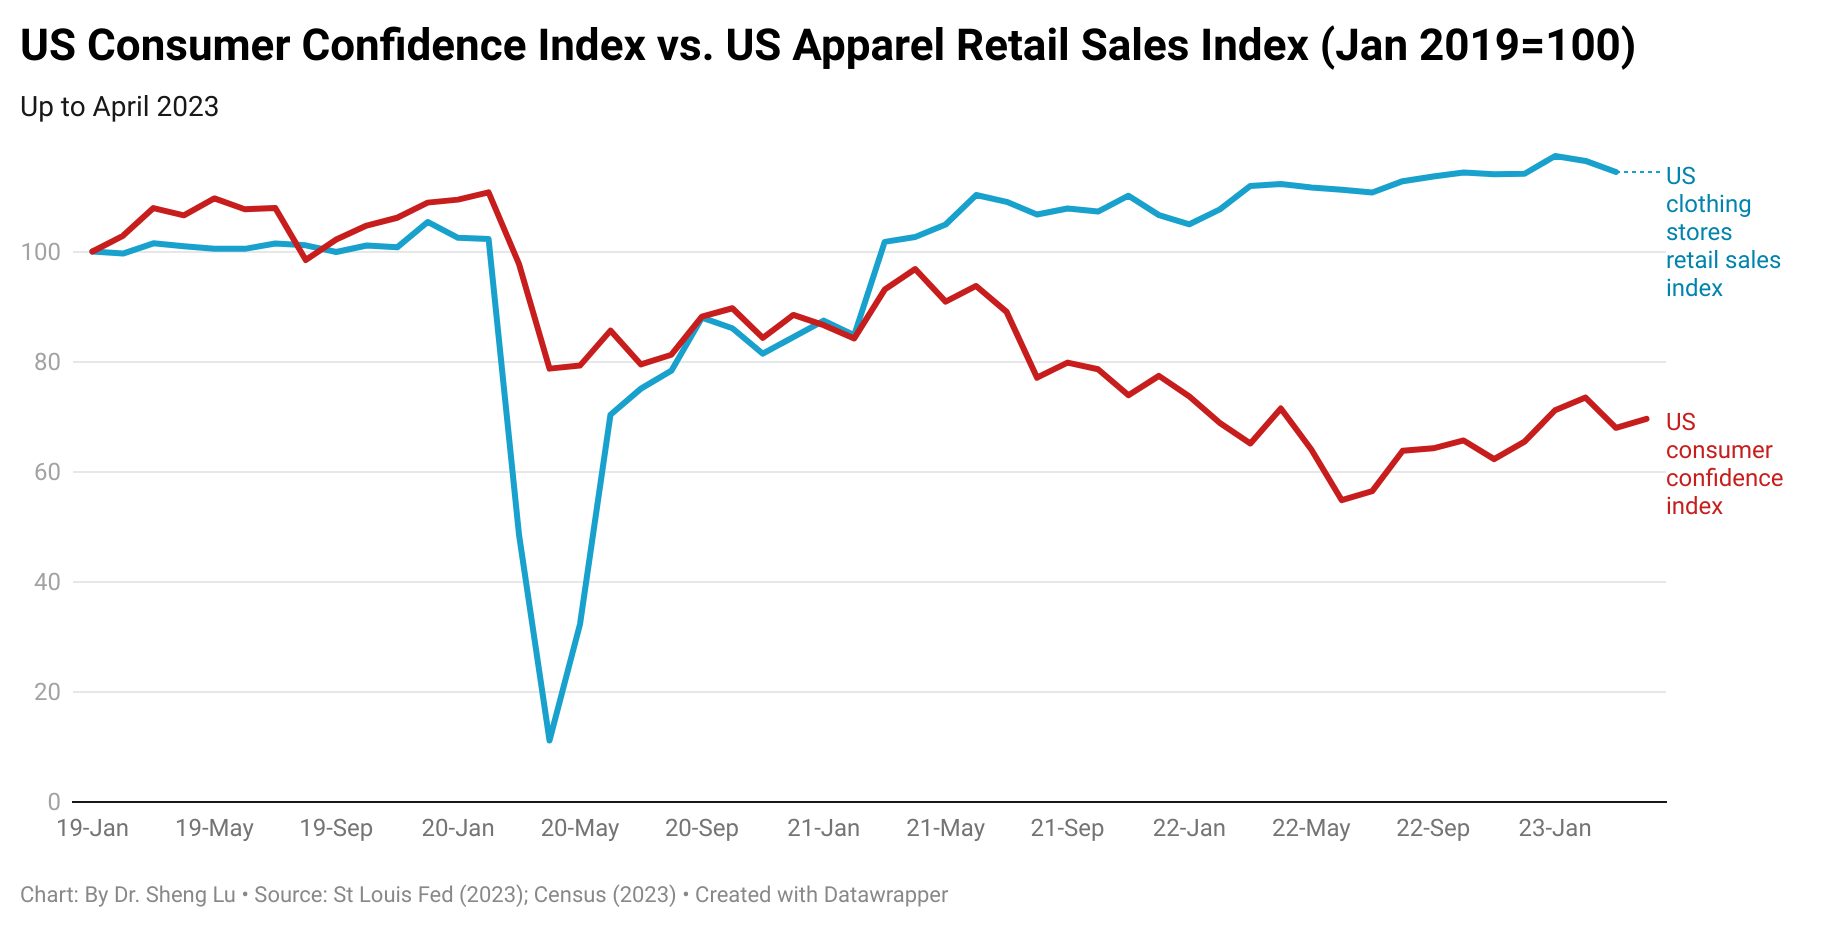
Overall, the shrinking US apparel import volume reflected the headwinds in the US economy and consumers’ hesitancy to purchase clothing amid financial uncertainties and high inflation. Recent economic indicators also present a mixed picture of the US economy’s growth trajectory. For example, while the US consumer confidence index slightly went up from 68.0 in March to 69.6 in April 2023 (January 2019=100), the advanced clothing store sales index in April fell to 115.6 (Jan 2019=100), the lowest so far in 2023 (e.g., was 120.6 in January 2023). However, since summer is traditionally a peak season for clothing sales, followed by events like back-to-school shopping, there remains hope that US apparel imports may experience a slight recovery at some point in the second half of the year.

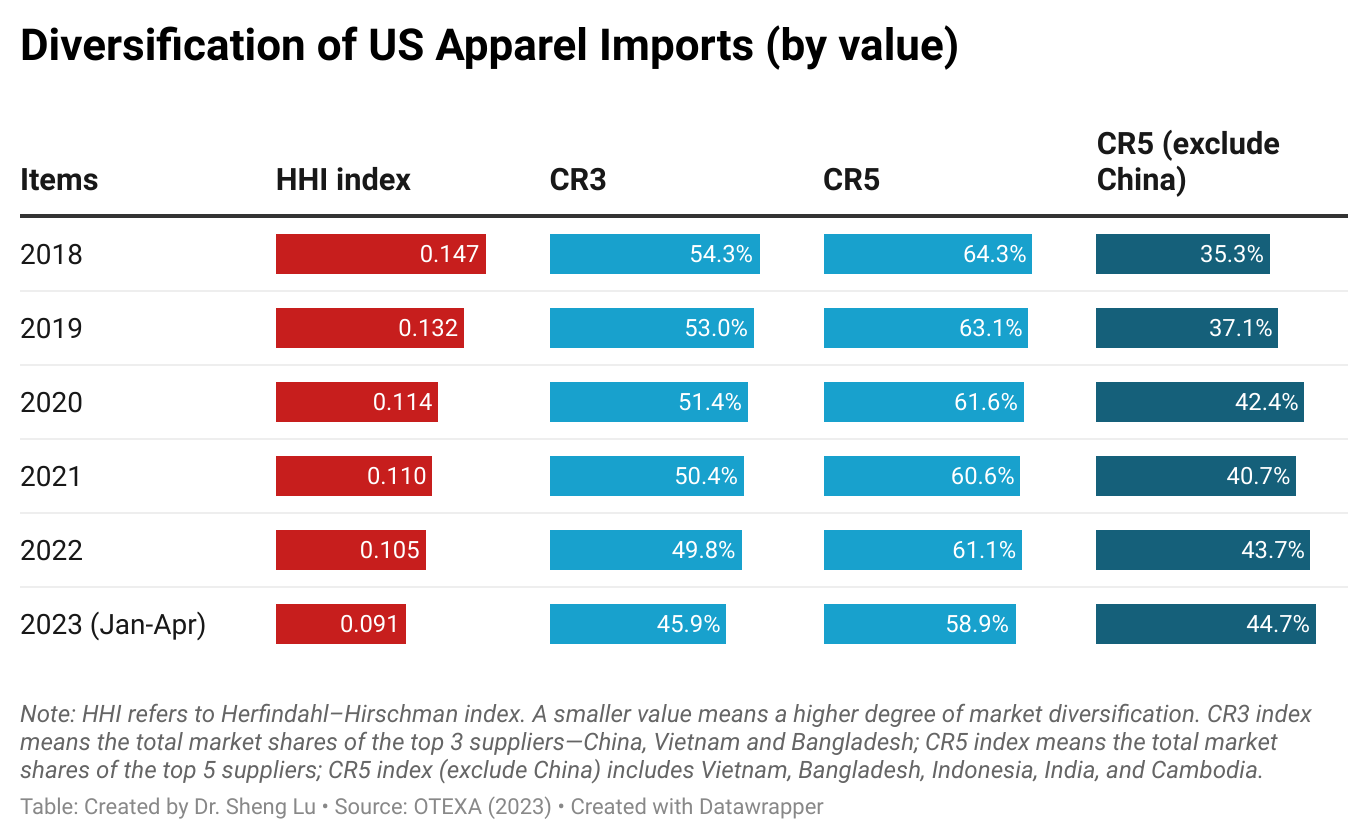
Second, trade data suggested that US apparel imports came from more diverse sources. For example, the Herfindahl–Hirschman index (HHI) fell below 0.1 in the first four months of 2023. Likewise, the market shares of the five largest suppliers (CS5) fell below 60% for the first time since 2018. The result suggested that leveraging sourcing diversification is a prevalent strategy among US fashion companies to mitigate supply chain risks and address market uncertainties.

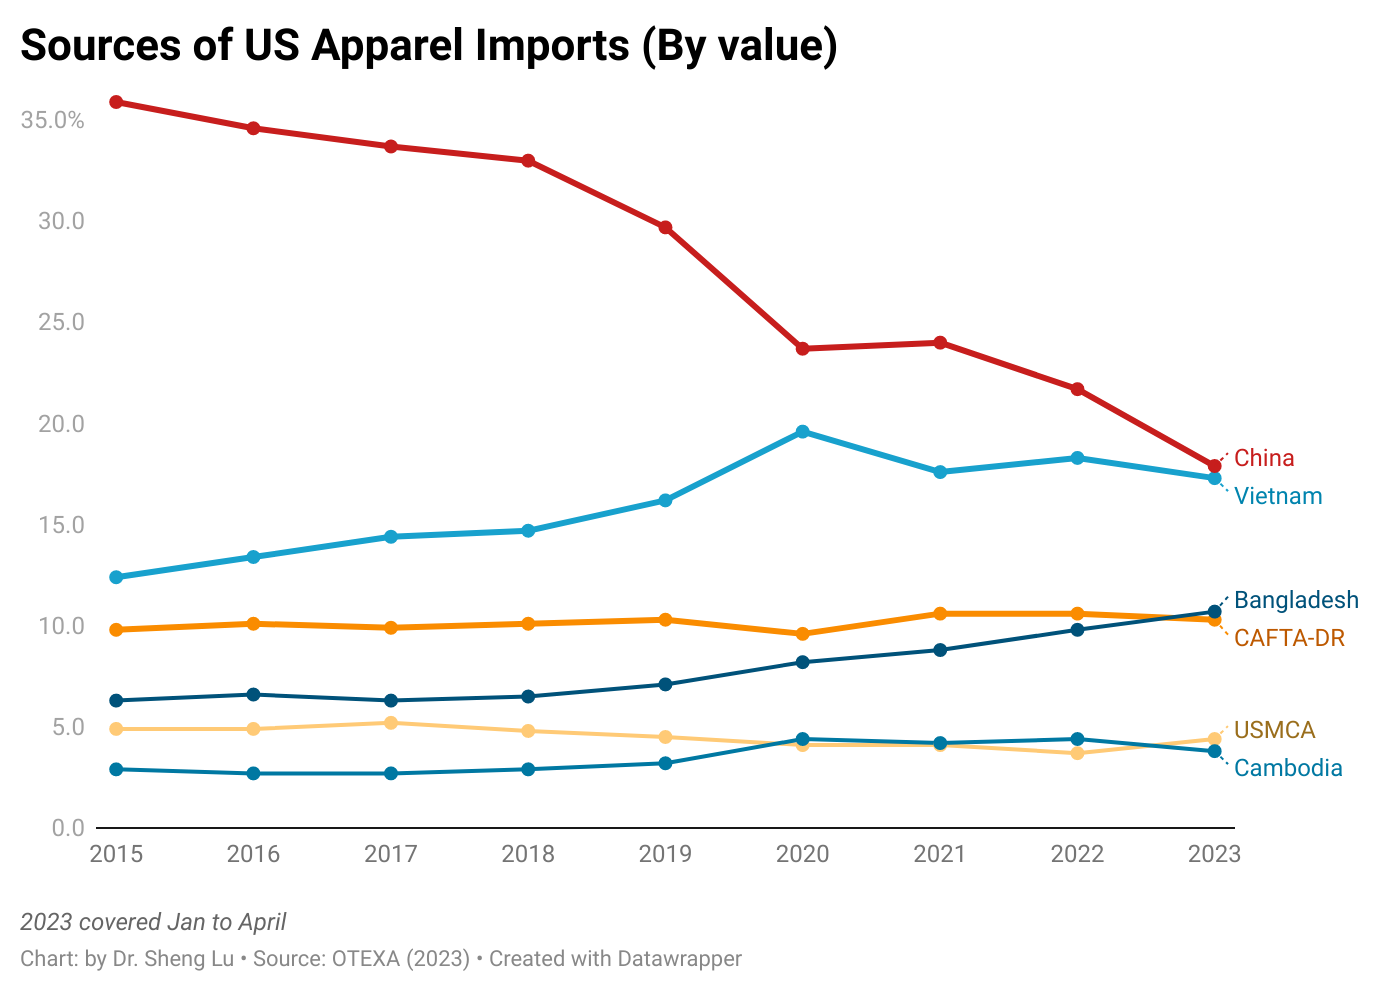
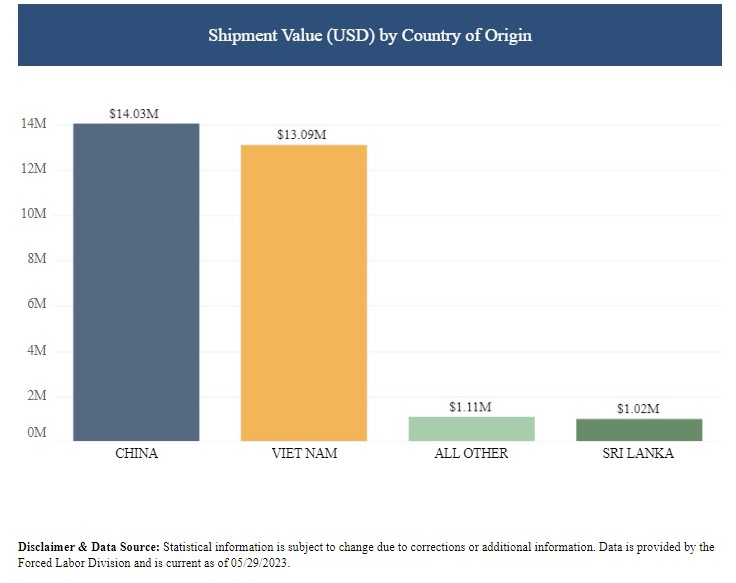
Third, US fashion companies are serious and eager to further reduce their “China exposure.” Although China remained the top apparel supplier to the US, its market share fell to a new low of 17.9% in value and 30.6% in quantity in the first four months of 2023. Notably, for the first time in decades, less than 10% of US cotton apparel imports came from China in March/April 2023, revealing the significant impact of the Uyghur Forced Labor Prevention Act (UFLPA) on US fashion companies’ China sourcing strategies.

Related, US fashion companies appear to be increasingly cautious about sourcing apparel from Vietnam as its supply chain is too exposed to China, raising concerns about forced labor risks. In value, Vietnam accounted for 17.3% of US apparel imports in the first four months of 2023, down from 18.6% a year ago. Notably, almost the same amount of Vietnam’s textile and apparel products were subject to the CBP’s UFLPA investigation as China in FY2023.

CBP UFLPA enforcement statistics—FY2023—Apparel, Footwear and Textiles—All investigated (denied+ pending+released) see https://www.cbp.gov/newsroom/stats/trade/uyghur-forced-labor-prevention-act-statistics

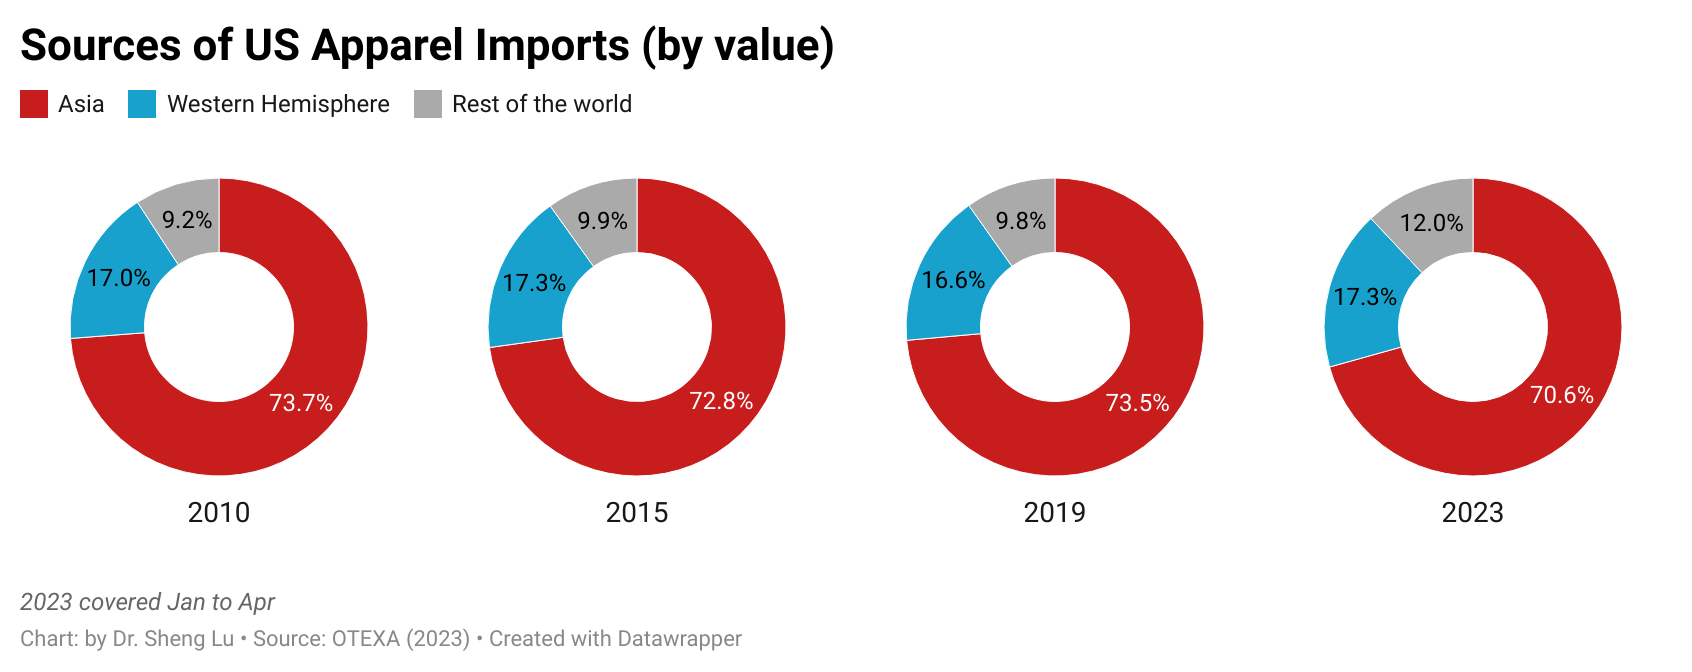
Fourth, large-scale Asian countries benefited the most as US fashion companies looking for China’s alternatives. Specifically, measured in value, about 70.6% of US apparel imports came from Asia in the first four months of 2023, down from 74.9% in 2022. However, the five largest apparel exporting countries in Asia other than China (i.e., Vietnam, Bangladesh, Indonesia, India, and Cambodia) accounted for 44.7% of US apparel imports in the first four months of 2023, a new high since 2018 (i.e., was 35.3%). These countries are among the most popular “alternatives to China” because of their balanced performance regarding production capacity, cost, flexibility, and compliance risks.

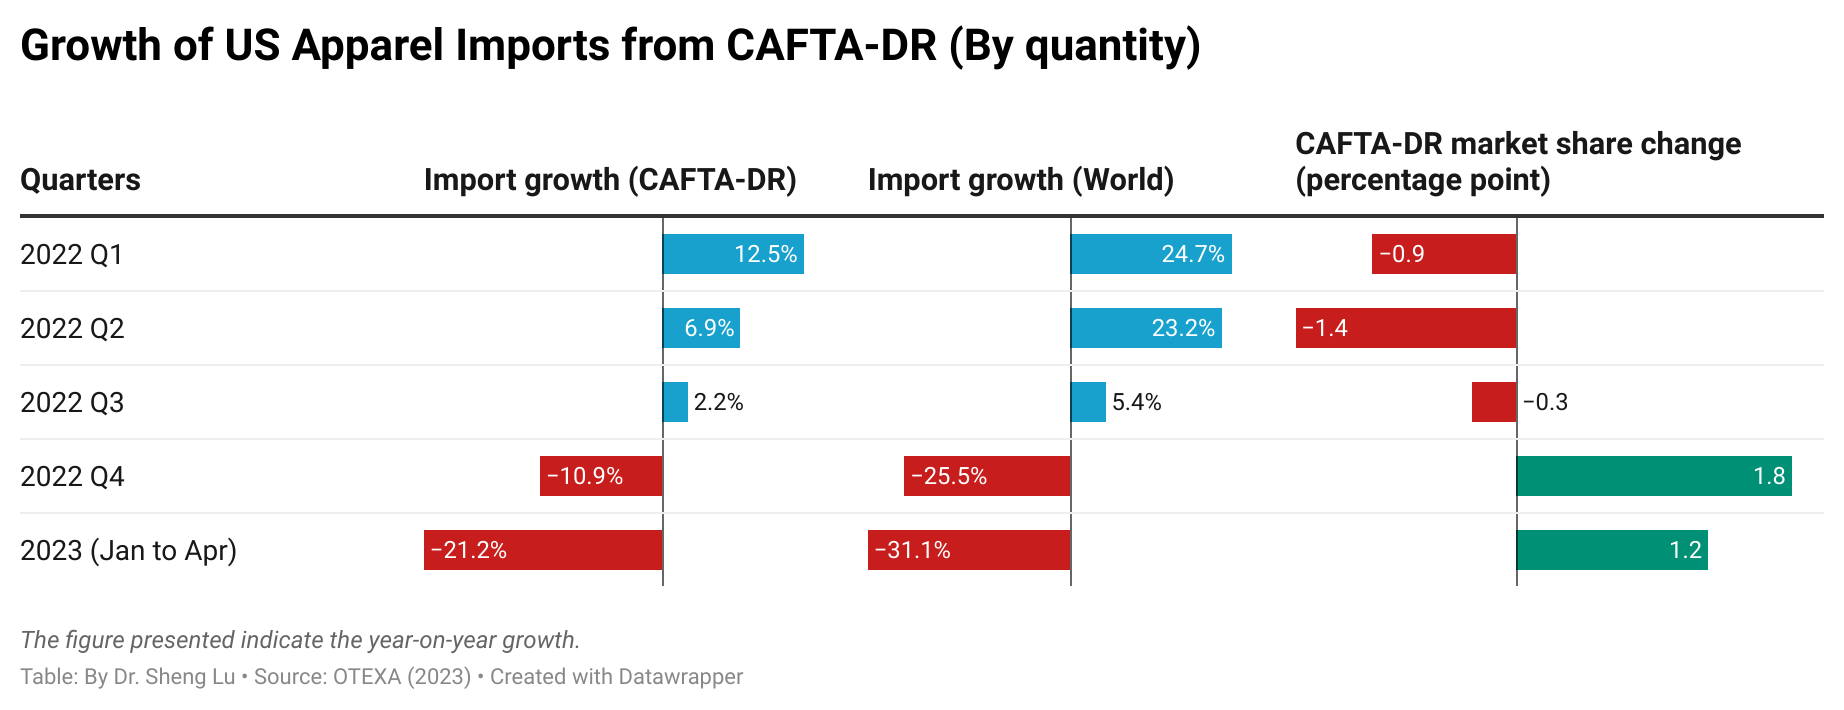
Fifth, US fashion companies are also actively exploring new near-shoring opportunities from the Western Hemisphere. For example, about 17.3% of US apparel imports came from Western Hemisphere countries in the first four months of 2023, up from 15.6% in 2023. That being said, measured in quantity, US apparel imports from Mexico and CAFTA-DR members fell by 13.0% and 21.2% in the first four months of 2023 from a year ago due to the struggling US economy. It will be interesting to see whether CAFTA-DR and Mexico can keep or enhance their market shares when the US import demand recovers.

By Sheng Lu

Progress and Challenges in Apparel Supply Chain Traceability: A Case Study on ASKET

ASKET is a prominent online retailer based in Sweden that commits to complete supply chain transparency. Based on analyzing nearly 40 unique products and their detailed supply chain information posted on ASKET’s website as of May 2023, the article aims to shed light on the company’s supply chain traceability progress and the remaining challenges it faces.

First, while ASKET achieved full traceability for Tier 1 suppliers, tracking Tier 2 and Tier 3 suppliers was more difficult. For example, compared with its perfect traceability score for Tier 1 suppliers (i.e., garment factories), ASKET’s average traceability for Tier 2 Milling factories (i.e., yarn and fabric producers) was at around 97%, and the score fell to only 77% for trims suppliers in Tier 3.

As one critical contributing factor to the phenomenon, Tier 2 and Tier 3 suppliers had far more players than Tier 1, which presented a more significant challenge in obtaining detailed information about all the factories involved. For example, ASKET’s garment cutting and sewing operations predominantly occurred within a single facility. In contrast, making yarns, fabrics, and trims EACH usually involve multiple facilities in different parts of the world.

Second, a comprehensive understanding of the sub-supply chains associated with apparel components is pivotal in enhancing a fashion company’s overall traceability. Notably, the apparel supply chain is far more complicated than the commonly known four stages—fiber, yarn, fabric, and garment manufacturing. Rather, apparel components like yarns, fabrics, sewing threads, buttons, and zippers have complex and intricate sub-supply chains. For instance, for ASKET’s shirts or polo shirts:

  • Cotton was “farmed in New Mexico, Arizona, California and Texas, USA, ginned in Anqing, China.”
  • Yarn was “spun and twisted in Hyderabad, India,” and “dyed in Varese, Italy.”
  • Fabric was “woven in Letohrad, Czech Republic, dyed and finished in Prato, Italy.
  • Sewing thread was “produced in Breisgau, Germany, wound and packed in St. Maria de Palautordera, Spain
  • Button was produced in Saccolongon, Italy, with corozo farmed in Manabi, Ecuador.

Third, using recycled textile materials in apparel products could make it trickier to map the supply chain.

  • ASKET reported no problem tracking recycled textile materials derived from natural fibers, especially recycled wool products.
  • ASKET’s capability of tracing recycled man-made fiber textiles yielded mixed results. For example, ASKET was still investigating the Tier 3 raw material suppliers for one fabric made with “100% pre-consumer recycled nylon.” Likewise, for one body fabric derived from “plastic waste collected from Spanish Mediterranean and French Atlantic oceans and coastlines,” pinpointing the precise origin of the raw fiber posed a challenge.

Fourth, ASKET’s data shows that using recycled textiles in apparel products could incur higher transportation costs. For example, the average transportation cost for an ASKET garment using recycled textiles would reach $5 per unit (or 6.3% of the total production costs), much higher than regular clothing using non-recycled materials ($1 per unit or 3% of the total production). However, on average, making a garment using recycled textile materials could involve fewer facilities(e.g., 9 vs. 12). This result suggests that the higher transportation cost associated with clothing made from recycled textiles may not be attributed to a longer supply chain but rather to a more tedious and expensive recycled fiber collection process.

Additionally, ASKET’s data indicates a strong correlation between its retail price and sourcing costs. Specifically, ASKET’s applied a gross margin% ranging from 71%–81%. This implies that a $2 increase in sourcing costs could potentially lead to a retail price increase of $10-$20. Thus, controlling and managing sourcing costs will always be a priority for a fashion company.

By Sheng Lu

Further reading: Lu, Sheng (2023). How Asket is achieving apparel supply chain traceability. Just-Style.