How does the video enhance your understanding of the complexity of apparel supply chain and sourcing? What is your evaluation of Ferrara Manufacturing’s strategies and best practices for maintaining apparel production in New York? Are high-end luxury brands the only viable opportunity for apparel “Made in the USA”? Feel free to share your thoughts and other reflections on the video.
Firstly, while China remained the world’s largest clothing exporter in 2023, rising geopolitical tensions and Western fashion companies’ ongoing de-risking efforts pose increasing challenges to its export outlook.
To some extent, 2023 wasn’t too bad for clothing “Made in China.” In value, China’s clothing exports totaled $164 billion, accounting for 31.6% of the world—unchanged from 2022. While China’s clothing exports decreased by 9.7 percent in 2023 compared to the previous year due to weaker market demand, this performance was better than most other top ten suppliers, including Bangladesh (down 16 percent), Vietnam (down 12 percent), India (down 13 percent), and Indonesia (down 17 percent).
However, China’s clothing exporters face significant challenges ahead. Despite maintaining its overall market share, China is losing momentum in nearly all key Western clothing markets, including the United States, the European Union, the UK, and Canada. This trend is primarily driven by perceived heightened sourcing risks associated with China, ranging from concerns over forced labor in the Xinjiang region to escalating geopolitical tensions involving the country.
For example, according to the 2024 Fashion Industry Benchmarking Study released by the US Fashion Industry Association (USFIA) in July, a record 43 percent of surveyed leading US fashion companies reported sourcing less than 10 percent of their apparel products from China in 2024, compared to only 18 percent in 2018. Likewise, nearly 60 percent of respondents no longer use China as their top apparel supplier in 2024, much higher than the 25-30 percent range before the pandemic. Additionally, nearly 80 percent of respondents plan to further reduce their apparel sourcing from China over the next two years through 2026, citing perceived high sourcing risks as the primary concern.
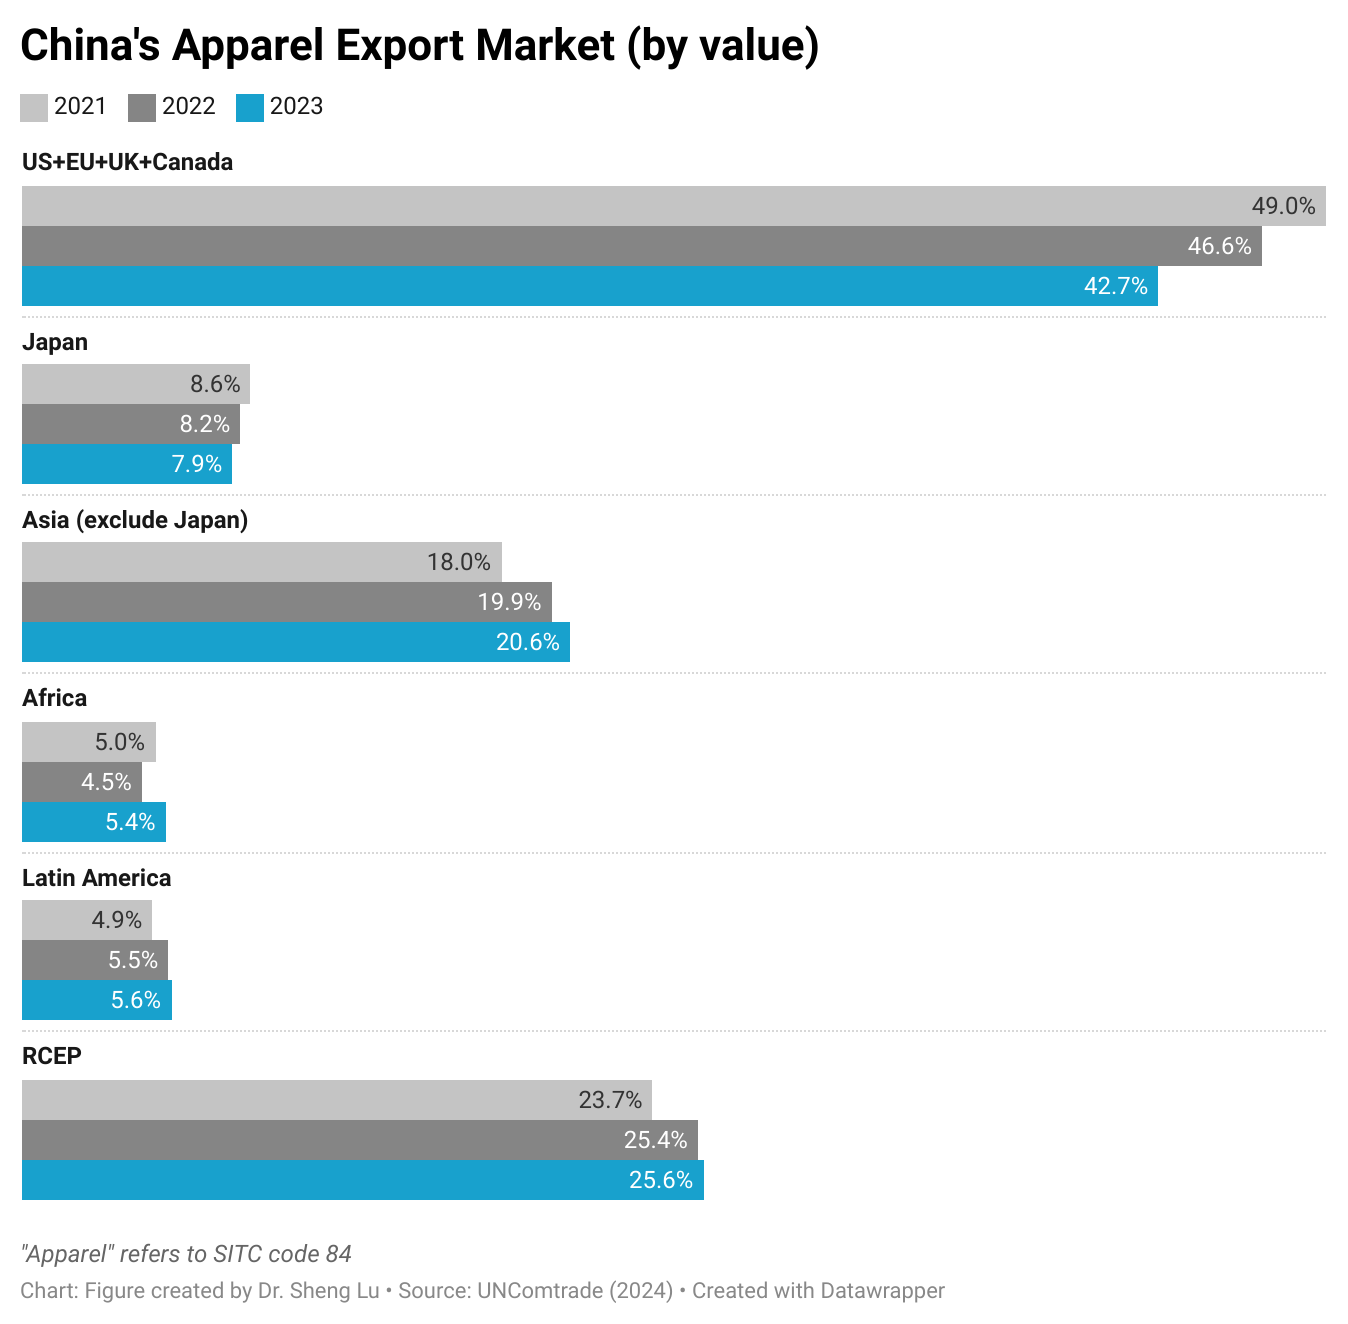
Secondly, China has been diversifying its clothing exports beyond traditional Western markets in response to the “de-risking” movement. For example, the US, EU, UK, and Canada combined accounted for 43-45 percent of China’s clothing exports in 2023, lower than over 50 percent in the past. In comparison, these four Western markets typically accounted for 70 to 90 percent of an Asian country’s clothing exports. Meanwhile, since 2021, Asian economies, especially members of the Regional Comprehensive Economic Partnership (RCEP) and Africa, have become more important export markets for China. Nevertheless, since RCEP members and those in Africa primarily consist of developing economies with ambitions to expand their own clothing production and exports, the long-term growth prospects for their demand for “Made in China” clothing remain uncertain.
Thirdly, China’s weakened economy could lead to an increased supply of low-cost Chinese clothing in the global market.
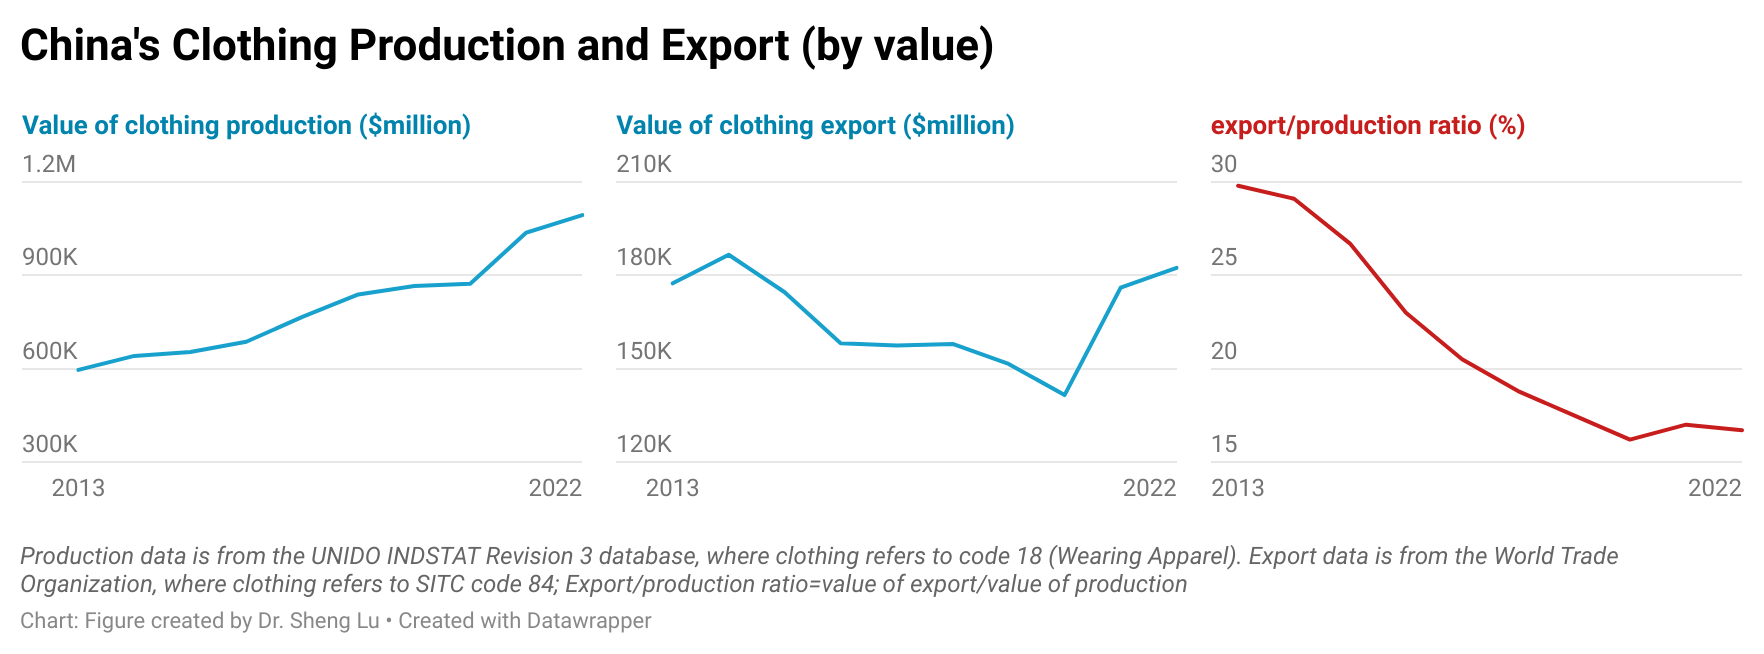
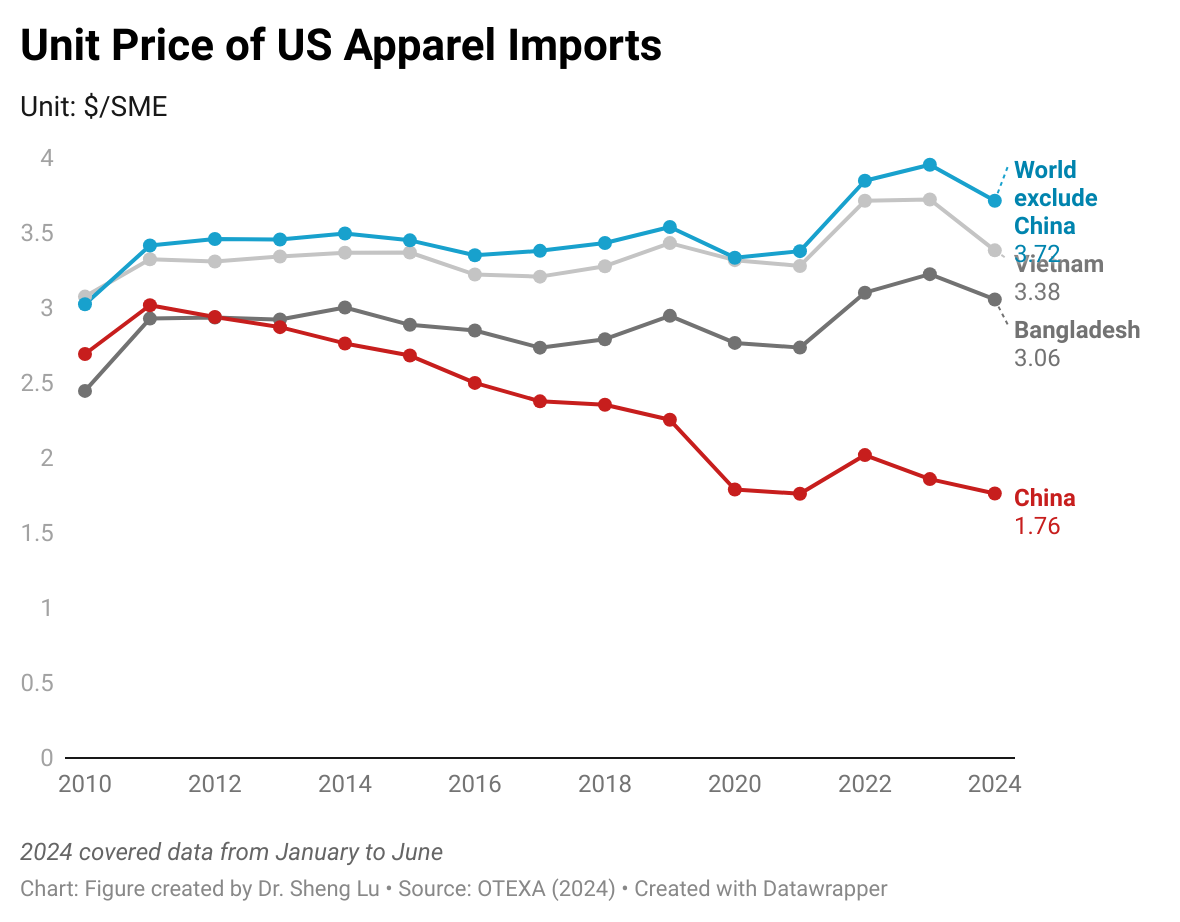
Despite being known as the world’s largest clothing exporter, between 2013 and 2022 (the latest available data), over 70%–80% of clothing produced in China was consumed domestically,with only about 20%–30% being exported. However, as China’s economic growth has slowed and consumer spending on clothing has stalled, more clothing made in China could enter the international market and intensify the price competition. Notably, between June 2023 and June 2024, the average unit price of US apparel imports from China decreased unusually by 7.6 percent, signaling that an increased supply of Chinese clothing began to suppress market prices. Likewise, it doesn’t seem reasonable that the unit price of U.S. apparel imports from China was 40% lower than that of imports from Bangladesh in the first half of 2024. Thus, the growing influx of cheap Chinese products raises the risk of market disruptions, potentially leading to additional trade tensions and restrictive measures against Chinese products.
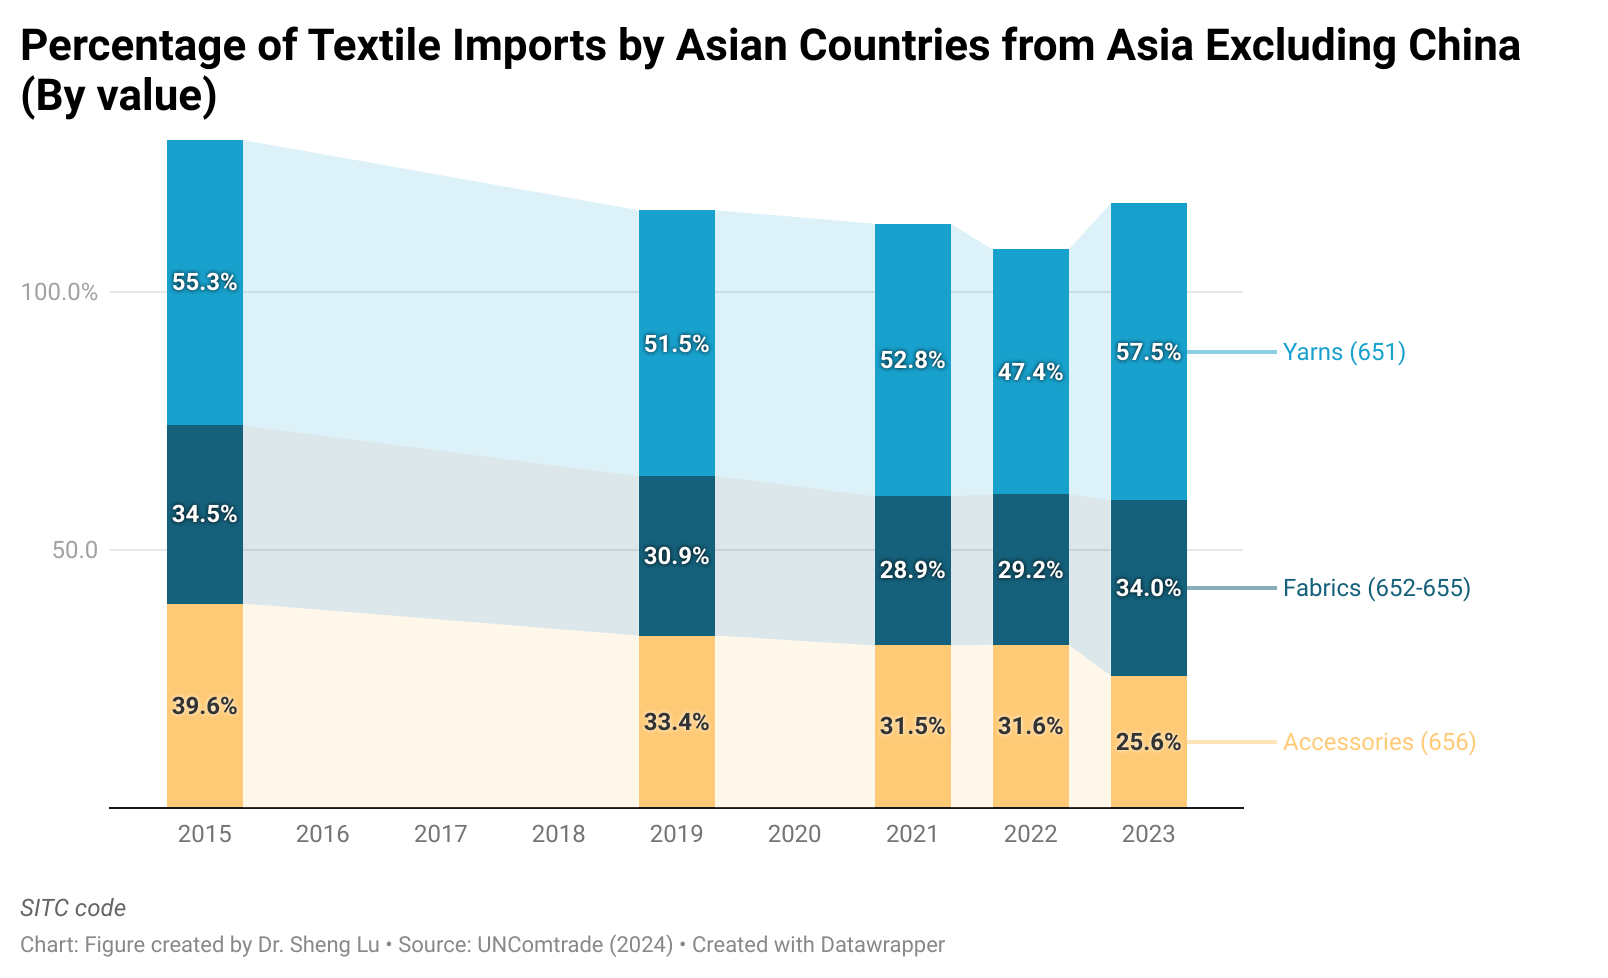
Fourthly, there is an early sign that Asian countries have become more cautious about using Chinese yarns and fabrics. China remained a key supplier of textile raw materials to leading apparel-exporting countries in Asia. However, Asian countries appeared to be sourcing fewer yarns and fabrics from China in 2023, possibly due to the enforcement of anti-forced labor laws, such as the Uyghur Forced Labor Prevention Act (UFLPA), and the perceived risks associated with sourcing Chinese cotton. Instead, more Asian countries’ yarns and fabrics now came from regional suppliers other than China.
Speaker: Dr. Deborah Elms, Founder and Executive Director of the Asian Trade Centre and the President of the Asia Business Trade Association. The clip was part of the webinar “Asia’s Noodle Bowl Of Trade” (March 2023).
Background
The Asia-Pacific region includes several mega free trade agreements:
ASEAN (Association of Southeast Asian Nations) is a regional intergovernmental organization comprising ten countries in Southeast Asia (Brunei, Cambodia, Indonesia, Laos, Malaysia, Myanmar, the Philippines, Singapore, Thailand, and Vietnam). In 2022, ASEAN members have a combined nominal GDP of $3.6 trillion and a population of 671.6 million.
CPTPP (Comprehensive and Progressive Agreement for Trans-Pacific Partnership) is a free trade agreement signed by 11 countries in the Asia-Pacific region, including Japan, Malaysia, Vietnam, Australia, Singapore, Brunei, New Zealand, Canada, Mexico, Peru, and Chile. The CPTPP covers a market of 495 million people with a combined GDP of $13.5 trillion in 2021. The United States was originally a participant in the Trans-Pacific Partnership (TPP) negotiations, but in January 2017, former US President Trump withdrew the US from the agreement. The Biden administration has indicated no interest in rejoining CPTPP. Additionally, China is actively seeking to join CPTPP (as of March 2024).
RCEP (Regional Comprehensive Economic Partnership) is a free trade agreement signed by 15 countries in the Asia-Pacific region, including China, Japan, South Korea, Australia, New Zealand, Brunei, Cambodia, Indonesia, Laos, Malaysia, Myanmar, the Philippines, Singapore, Thailand, Vietnam. In 2021, RCEP members collectively represented a market of 2.3 billion people with a combined GDP of $26.3 trillion. India was an RCEP member but withdrew from the agreement due to concerns about import competition with China.
IPEF (Indo-Pacific Economic Framework for Prosperity) is a US-led economic cooperation framework that aims to “link major economies and emerging ones to tackle 21st-century challenges and promote fair and resilient trade for years to come.” IPEF is NOT a traditional free trade agreement, and it does not address market access issues like tariff cuts. Instead, IPEF includes four pillars: trade, supply chains, clean economy, and fair economy. IPEF members in the Asia-Pacific region include the United States, Japan, Australia, New Zealand, South Korea, India, Fiji, Brunei, Indonesia, Malaysia, the Philippines, Singapore, Thailand, and Vietnam. The IPEF is designed to be flexible, meaning that IPEF partners are not required to join all four pillars. For example, India chooses not to join the trade pillar of the framework. In 2021, IPEF countries collectively represented a market of 2.1 billion people with a combined GDP of $23.3 trillion. The potential economic impact of IPEF remains too early to tell.
Notably, ASEAN, CPTPP, RCEP, and IPEF members play significant roles in the world textile and apparel trade. Specifically:
ASEAN and RCEP members have established a highly integrated regional textile and apparel supply chain. For example, a substantial portion of ASEAN and RECP members’ textile imports came from within the region.
ASEAN and RCEP members’ supply chain connection with China has substantially strengthened over the past decade. In contrast, the US barely participated in Asia-based textile and apparel supply chains. For example, other than CPTPP, the US accounted for less than 2% of ASEAN, RCEP, and IPEF members’ textile imports in 2022.
ASEAN and RCEP members also hold significant market shares in the world textile and apparel exports (over 50%). Meanwhile, the US and EU are indispensable export markets for ASEAN and RCEP members.
Because of the inclusion of the United States, IPEF represented one of the world’s largest apparel import markets (i.e., 33.7% in 2021, measured in value). Similarly, in 2022, about 26% of US apparel imports came from current IPEF members. Should IPEF address market access issues, it could offer significant duty-saving opportunities for textile and apparel products.
Additionally, the UK’s membership in CPTPP may have a limited direct impact on the textile and apparel sector, at least in the short to medium terms. For example, current CPTPP members only accounted for about 6% of the UK’s apparel imports in 2022.