FASH455 Current Event Discussion: Ongoing Tariff War and Apparel Sourcing and Trade (Updated April 2025)

Video 1: Is U.S. Clothing Manufacturing at Risk? Tariffs and Competition Threaten Jobs (RT≠ Endorsement)
Video 2: Northern Virginia T-shirt brand faces challenges (RT≠ Endorsement)
Video 3: Tariffs could raise wedding dress prices for American brides (RT≠ Endorsement)
Video 4: Bangladeshi garment industry sweating on Trump tariffs (RT≠ Endorsement)
Video 5: Trump’s Tariff Twist: Can Pakistan’s Textiles Fill China’s Shoes? (RT≠ Endorsement)
Video 6: Tariffs: Europe’s textile sector holds its breath

Discussion questions (note: you may answer any of the following questions. However, you must watch all the videos above and use examples from the videos to support your viewpoints and arguments. For this learning activity, students are expected to form their own independent assessments of the topic.)

#1 Based on the videos, how do you expect the apparel sourcing strategy of US fashion companies to evolve in response to the tariff increase? For example, will companies continue to diversify sourcing, wait and see, or focus on expanding sourcing to countries or regions regarded as “safe havens”?

#2 Do you expect the higher tariffs on U.S. imports, including textiles and apparel, to benefit domestic “Made in the USA” production? Why or why not?

#3 As consumers, how do you perceive the impact of the tariffs on your shopping behavior and experiences? Have you noticed any changes, such as in price and product availability, while shopping for clothing recently? Feel free to share your observations.

#4 Are there any other notable impacts of the tariff increase on the global fashion apparel industry that we should be aware of? What additional questions do you have in mind about the tariff impacts?  

Patterns of U.S. Apparel Sourcing and Imports (updated April 2025)

The following analysis was based on the latest trade statistics from the Office of Textiles and Apparel (OTEXA) under the U.S. Department of Commerce.

First, the growth of U.S. apparel imports significantly slowed as fashion companies shifted from eagerly piling up stock to the wait-and-see mode. Specifically, in February 2025, U.S. apparel imports moderately went up 3.2% in value and 1.5% in quantity, much lower than the 18-19% increase seen in late 2024 and January 2025. The much-slowed growth confirmed that the earlier U.S. apparel import surge was largely driven by fashion companies’ worries about the upcoming tariff hikes rather than an actual increase in consumer demand.

Adding to the concern, U.S. consumer confidence fell sharply, which could lead to a steep drop in U.S. apparel imports ahead. For example, the Consumer Confidence Index dropped to a two-year low of 92.9 in March 2025, down from 100.1 the previous month (1985=100). Similarly, the Expectations Index—which measures consumers’ short-term outlook for income, business, and labor market conditions—plunged to 65.2, marking its lowest level in 12 years. With the announcement of reciprocal tariffs and the growing likelihood of an economic recession, U.S. consumer demand for clothing may decline significantly, potentially leading to the cancellation of many sourcing orders.

Second, apparel imports have become more expensive. Measured in dollars per square meters equivalent (SME), the unit price of U.S. apparel imports averaged $3.06/SME in the first two months of 2025, up from $3.03/SME a year ago (or a 1.3% increase). The unit price of U.S. apparel imports from many leading Asian countries rose at a notably higher rate, including China (up 2.9%), Vietnam (up 3.6%), and Bangladesh (up 2.6%), as well as those from Mexico (up 4.7%) and CAFTA-DR (up 0.6%). This result reflected the growing pressure of sourcing and production costs facing U.S. fashion companies and their suppliers, driven by rising labor costs and raw material prices among other factors. Indeed, if Trump’s reciprocal tariffs ultimately take effect, import prices could increase even more significantly.

Third, U.S. fashion companies’ sourcing diversification efforts appeared to slow amid rising uncertainty. In February 2025, Asian countries collectively accounted for 71.5% of the total value of U.S. apparel imports—unchanged from a year earlier. Similarly, in the first two months of 2025, the top five suppliers (China, Vietnam, Bangladesh, Cambodia, and India) made up 63.7% of total apparel imports by value, up from 59.7% during the same period in 2024. Even China’s market share remained largely stable at 18.4% in value and 32% in quantity, compared to a year ago.

These figures suggest that U.S. fashion companies somehow have become more hesitant to adjust their sourcing base in response to the universal tariffs imposed by the Trump administration, which target nearly all U.S. trading partners. As a result, U.S. fashion companies may find the sourcing diversification strategies no longer as effective as in the past in effectively mitigating their sourcing risks.

Meanwhile, data from the United Nations (UN Comtrade) show that Asian countries’ dependence on the U.S. market for apparel exports varied. In 2024, Vietnam, Sri Lanka, and ASEAN members exported about 40% of their apparel to the U.S., whereas the U.S. accounted for only about 20% of China’s and Bangladesh’s total apparel exports to the world. At the same time, the U.S. remained the single largest export market for Mexico and CAFTA-DR members, due to the integrated Western Hemisphere textile and apparel supply chain.

Fourth, no evidence shows that the current trading environment has benefited from near-shoring from the Western Hemisphere. On the contrary, measured in quantity, in February 2025, only 7.6% of U.S. apparel imports came from CAFTA-DR members, a notable drop from 9.6% a year ago. Similarly, Mexico accounted for 2.3% of U.S. apparel imports in February 2025, also lower than 2.4% a year earlier.

As a silver lining, the utilization rate of CAFTA-DR reached 81.1% in 2025 (January to February), much higher than 73.8% over the same period in 2024. About 75.3% of U.S. apparel imports from CAFTA-DR in 2025 (January to February) complied with the yarn-forward rules of origin compared to 67.4% a year ago. However, the use of “short-supply” remained low–only about 2.0% in 2025 so far.

by Dr. Sheng Lu

Related analysis: Lu, S. (2025). Patterns of U.S. Apparel Imports in 2024. Global Textile Academy, International Trade Centre, Geneva, Switzerland.

State of U.S. Textile and Apparel Manufacturing, Employment and Trade (updated April 2025)

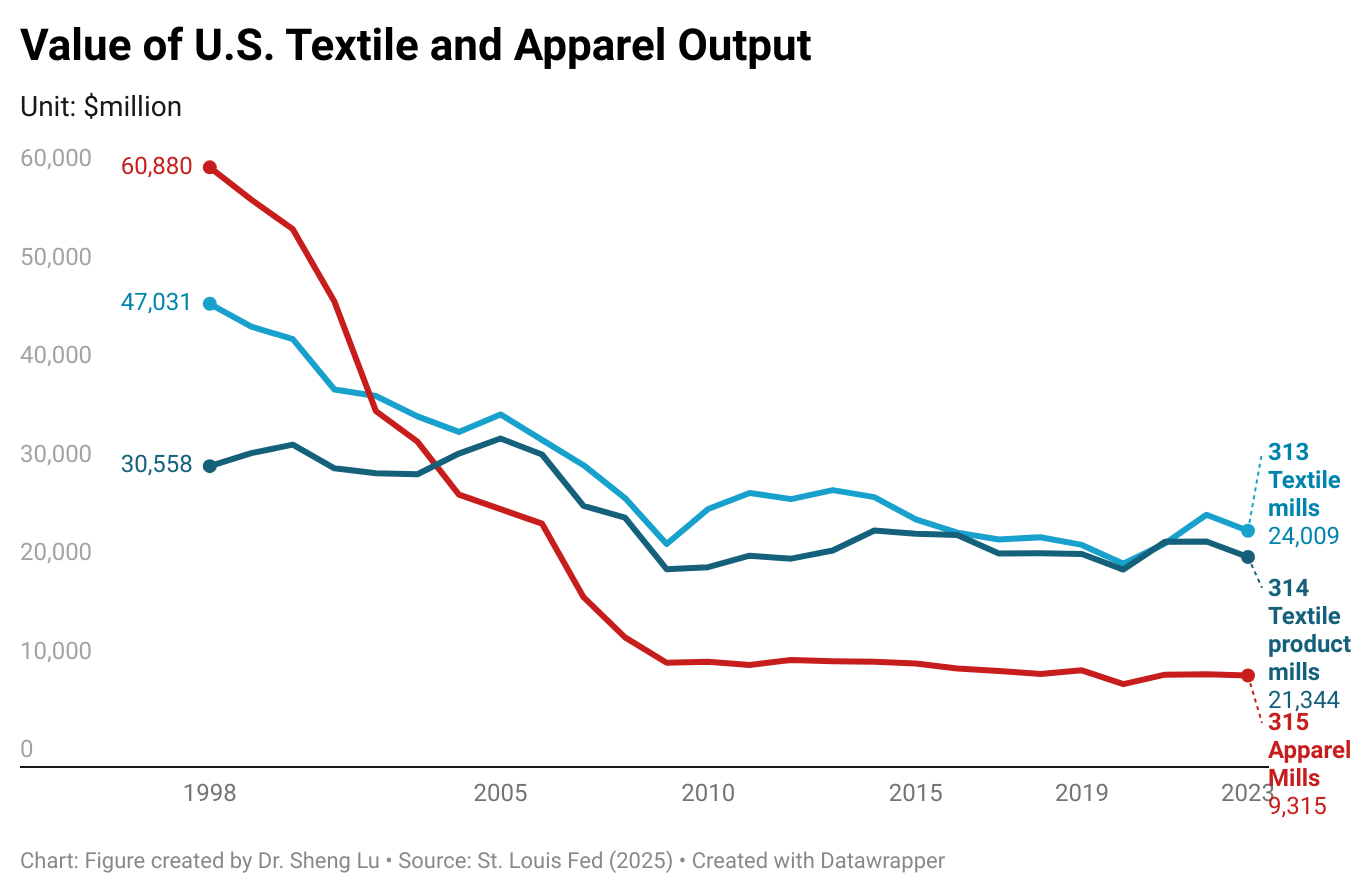
Textile and apparel manufacturing in the U.S. has significantly decreased over the past decades due to factors such as automation, import competition, and the changing U.S. comparative advantages for related products. However, thanks to companies’ ongoing restructuring strategies and their strategic use of globalization, the U.S. textile and apparel manufacturing sector has stayed relatively stable in recent years. For example, the value of U.S. yarns and fabrics manufacturing (NAICS 313) totaled $24 billion in 2023 (the latest data available), up from $23.3 billion in 2018 (or up 2.8%). Over the same period, U.S. made-up textiles (NAICS 314) and apparel production (NAICS 315) moderately declined by only 1.8% and 1.6%.

More importantly, the U.S. textile and apparel manufacturing sector is evolving. Several important trends are worth watching:

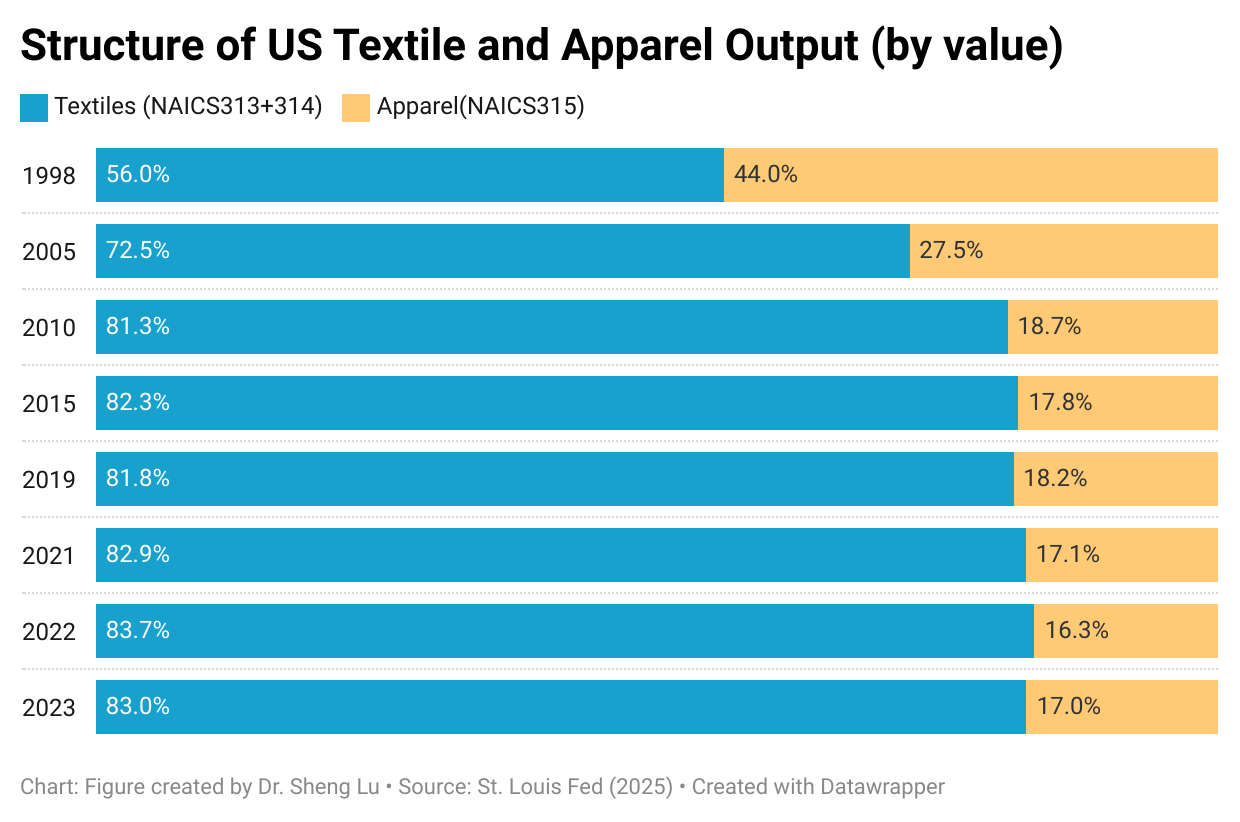
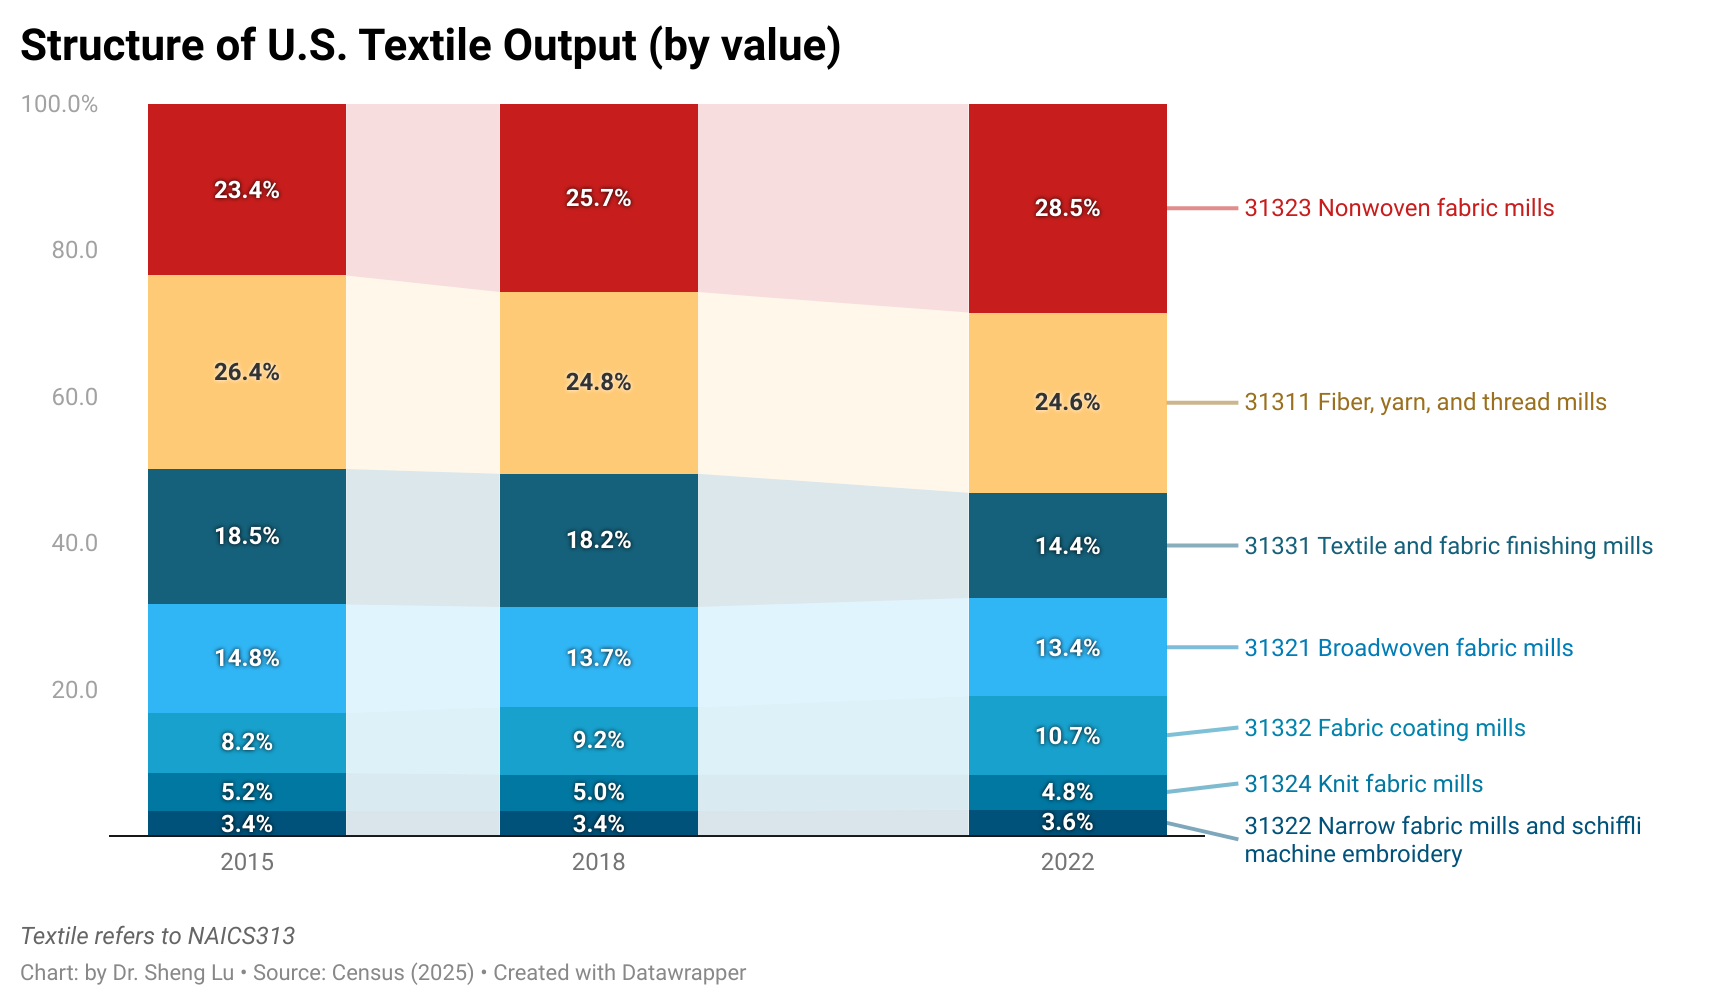
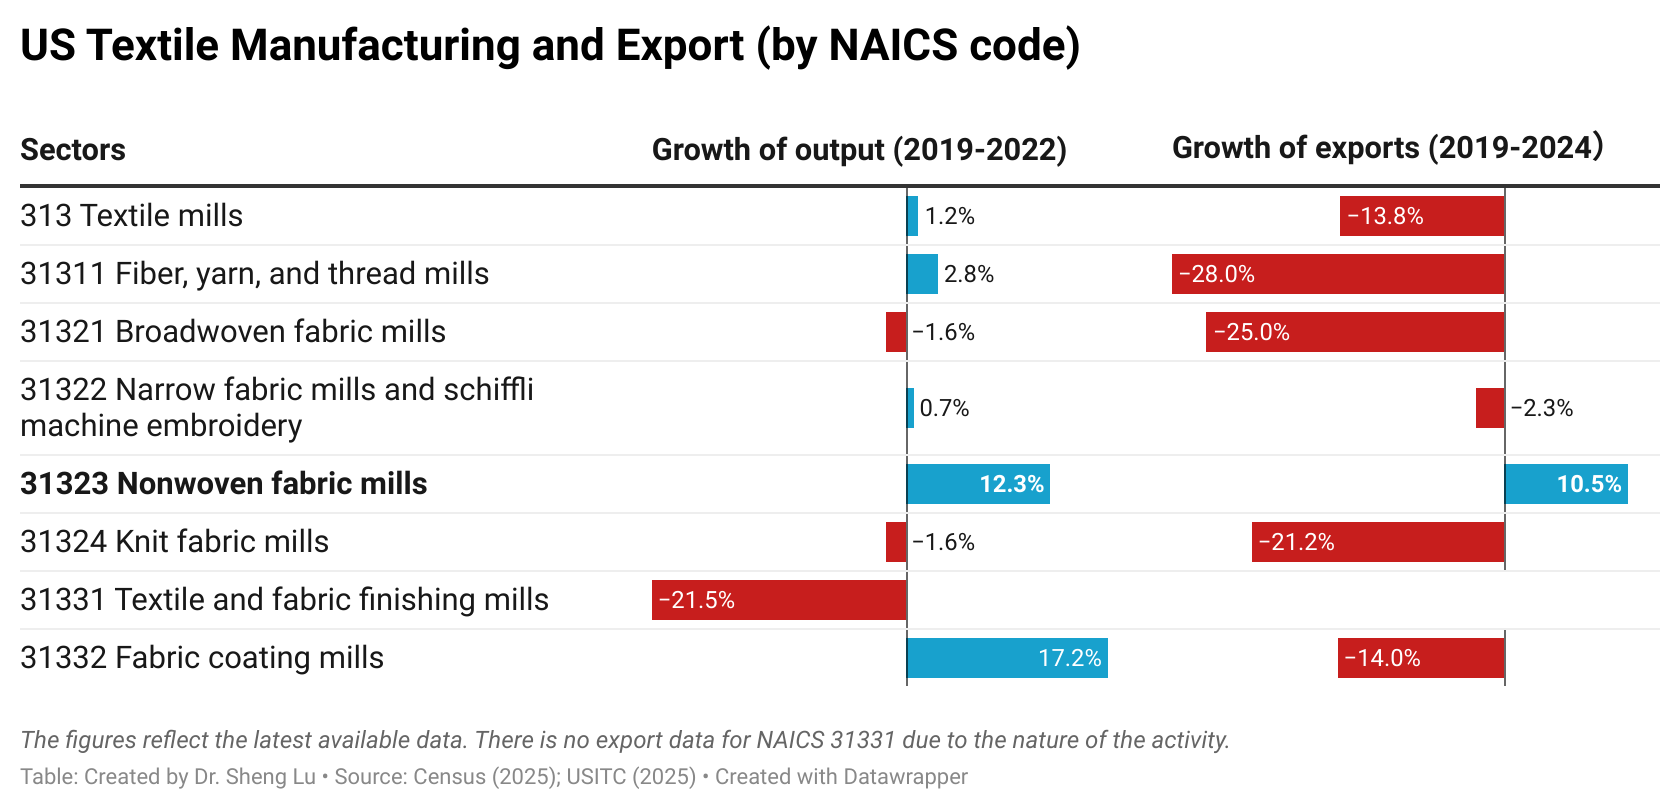
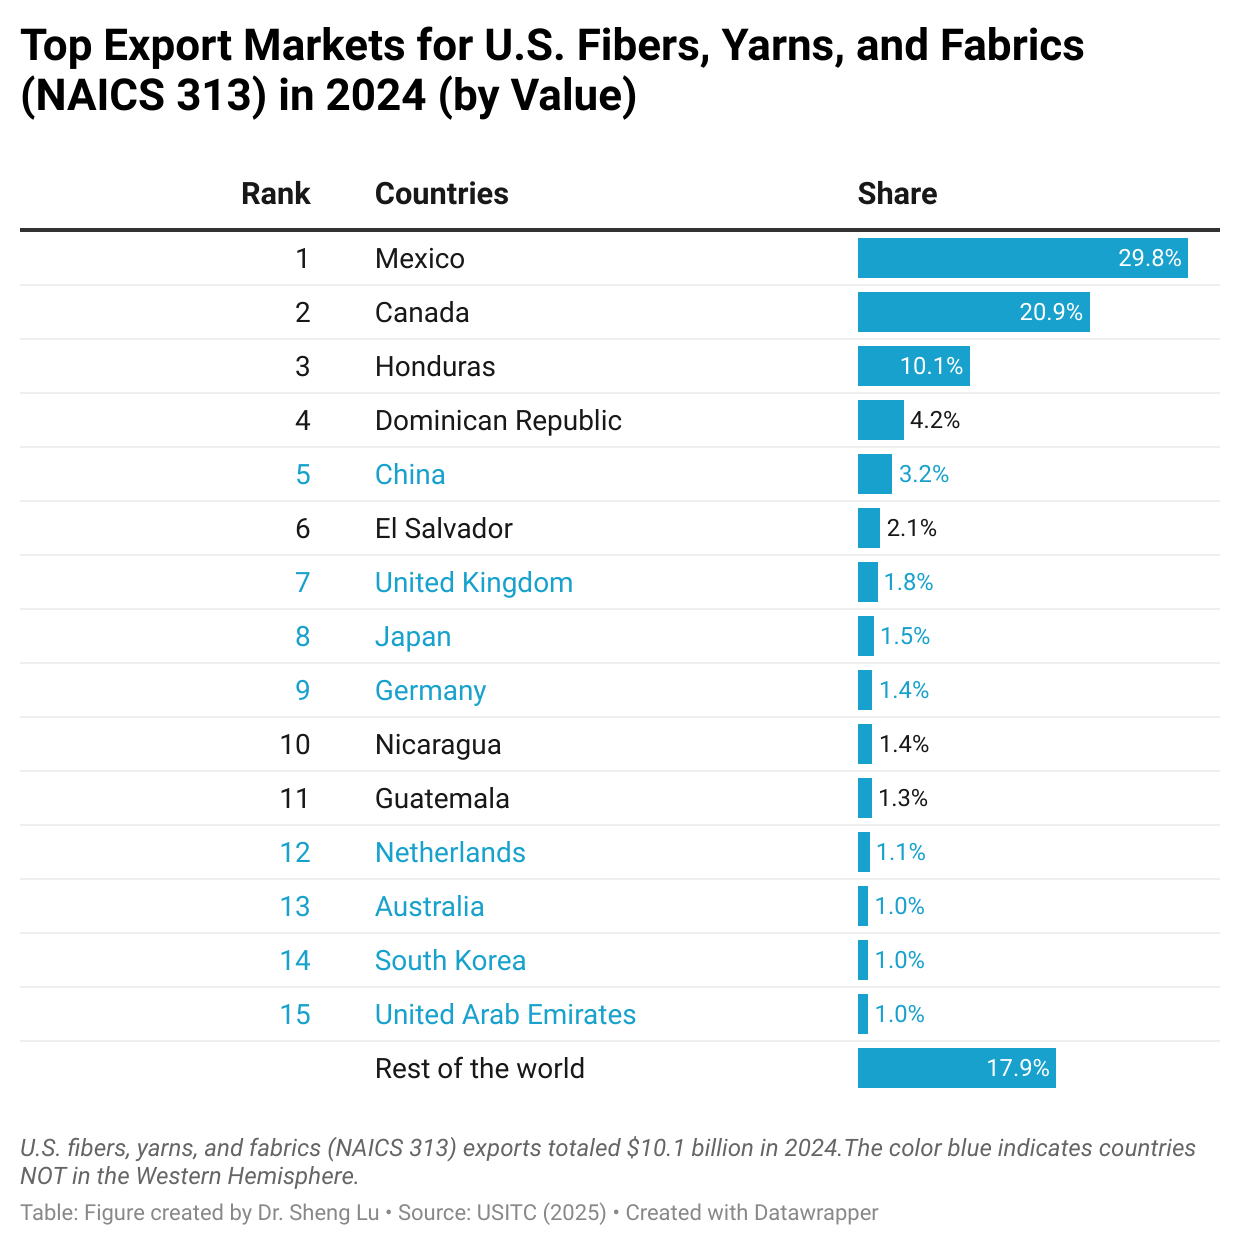
First, “Made in the USA” increasingly focuses on textile products, particularly high-tech industrial textiles that are not intended for apparel manufacturing purposes.  Specifically, textile products (NAICS 313+314) accounted for over 83% of the total output of the U.S. textile and apparel industry as of 2023, much higher than only 56% in 1998 (U.S. Census, 2025). Textiles and apparel “Made in the USA” are growing particularly fast in some product categories that are high-tech driven, such as medical textiles, protective clothing, specialty and industrial fabrics, and non-woven. These products are also becoming the new growth engine of U.S. textile exports. Notably, between 2019 and 2022, the value of U.S. “nonwoven fabric” (NAICS 31323) production increased by 12.32%, much higher than the 1.15% average growth of the textile industry (NAICS 313). Similarly, while U.S. textile exports decreased by 13.75% between 2019 and 2024, “nonwoven fabric” exports surged by 10.48%--including nearly 40% that went to market outside the Western Hemisphere (U.S. International Trade Commission, 2025).

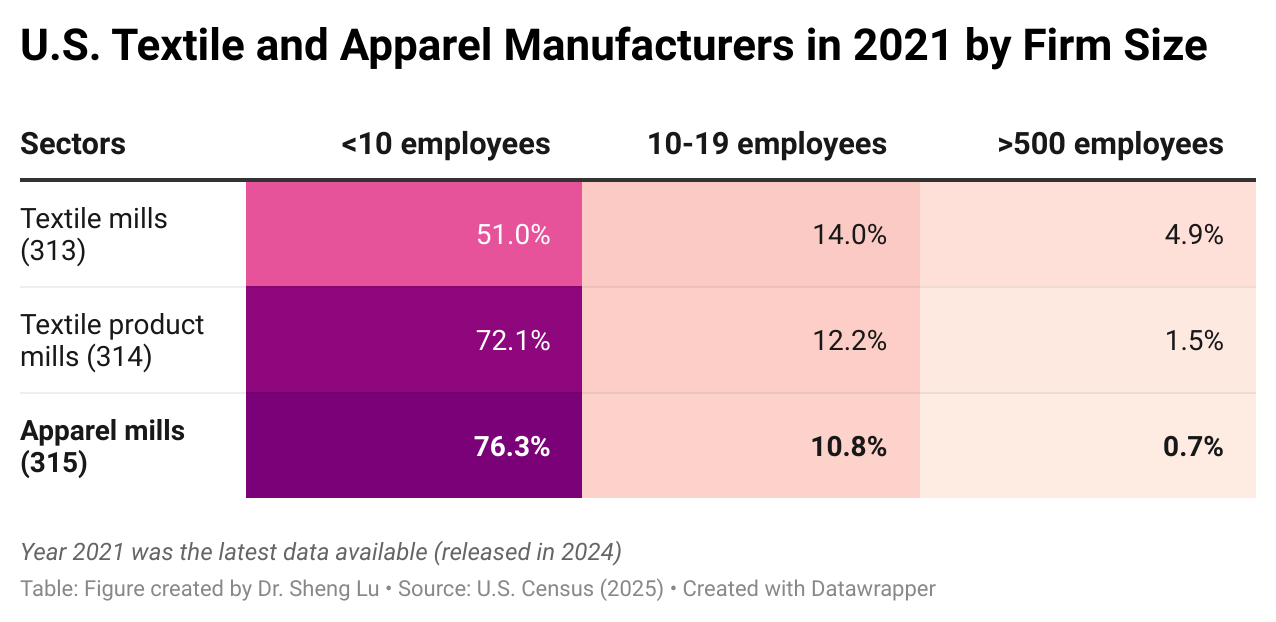
Second, U.S. apparel manufacturers today are primarily micro-factories, and they supplement but are not in a position to replace imports. As of 2021 (the latest data available), over 76% of U.S.-based apparel mills (NAICS 315) had fewer than 10 employees, while only 0.7% had more than 500 employees. In comparison, contracted garment factories of U.S. fashion companies in Asia, particularly in developing countries like Bangladesh, typically employ over 1,000 or even 5,000 workers.

Instead of making garments in large volumes, most U.S.-based apparel factories are used to produce samples or prototypes for brands and retailers.  In other words, replacing global sourcing with domestic production is not a realistic option for U.S. fashion brands and retailers in the 21st-century global economy. Nor are U.S. fashion companies showing interest in shifting their business strategies from focusing on “designing + managing supply chain+ marketing” back to manufacturing.

Meanwhile, due to mergers and acquisitions (M&A) and to leverage economies of scale, approximately 5% of U.S. textile mills (NAICS313) had more than 500 employees as of 2021–this is a significant number, considering that textile manufacturing is a highly capital-intensive process.

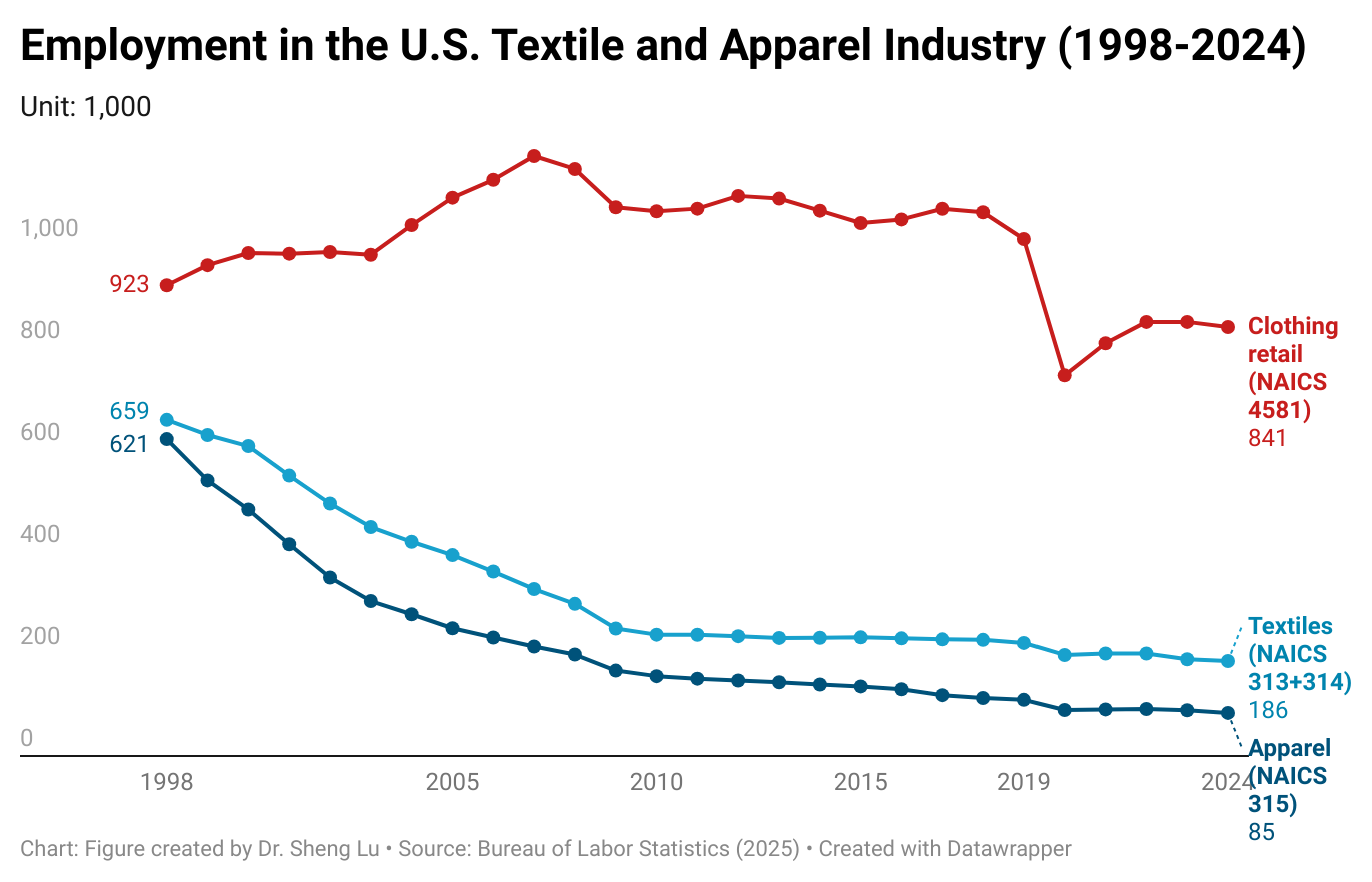
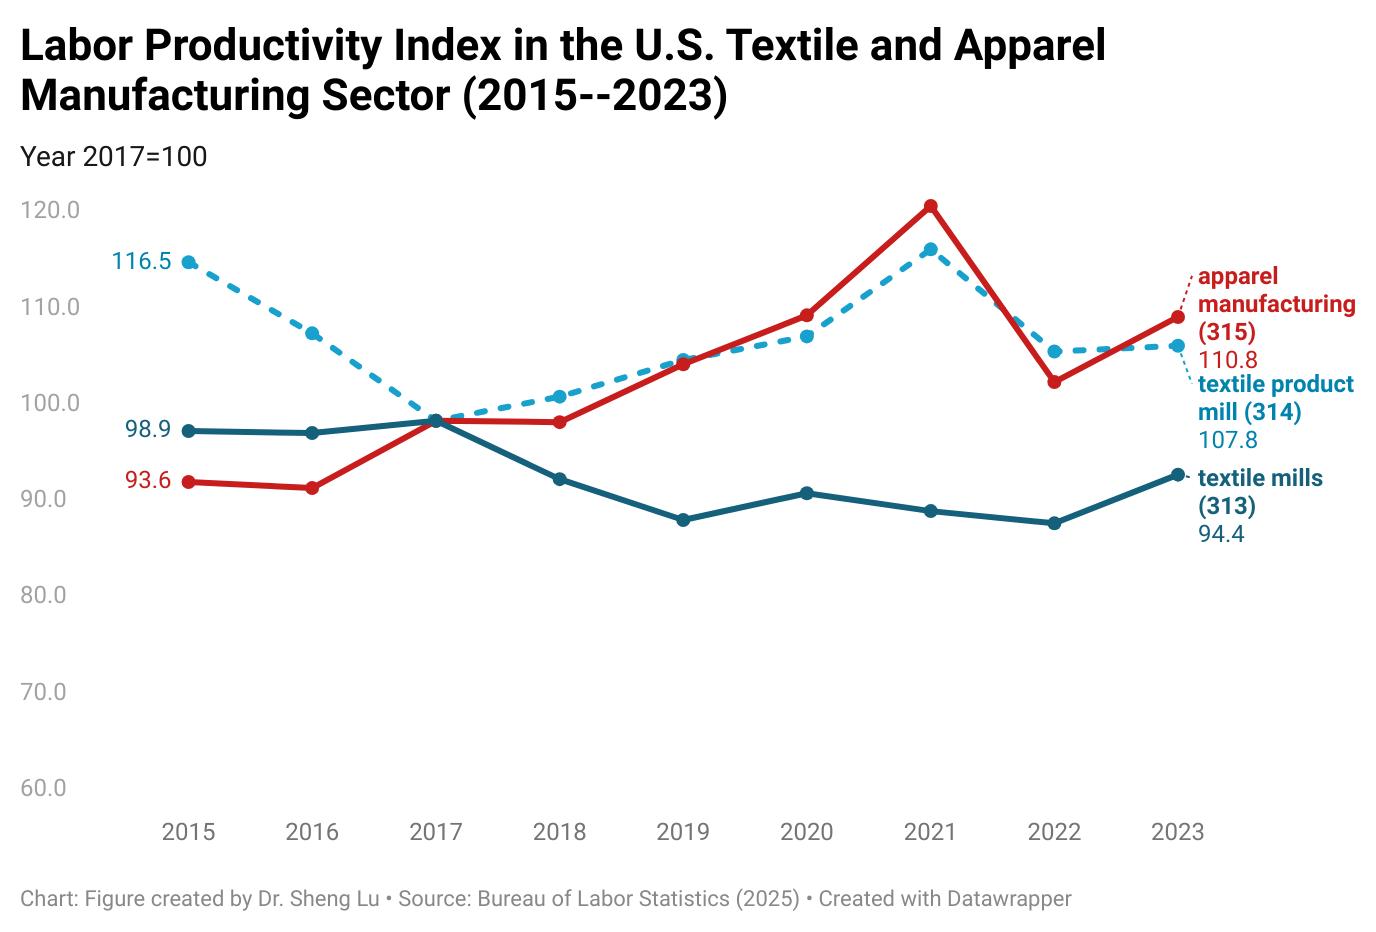
Third, employment in the U.S. textile and apparel manufacturing sector continued to decline, with improved productivity and technology being critical drivers.  As of 2024, employment in the U.S. textile and apparel manufacturing sector (NAICS 313, 314, and 315) totaled 270,700, a decrease of 18.4% from 33,190 in 2019. Notably, U.S. textile and apparel workers had become more productive overall—the labor productivity index of U.S. textile mills (NAICS 313) increased from 89.7 in 2019 to 94.4 in 2023, and the index of U.S. apparel mills (NAICS 315) increased from 105.8 to 110.78 over the same period.

On the other hand, clothing retailers (NAICS 4481) accounted for over 75.7% of employment in the U.S. textile and apparel sector in 2024.

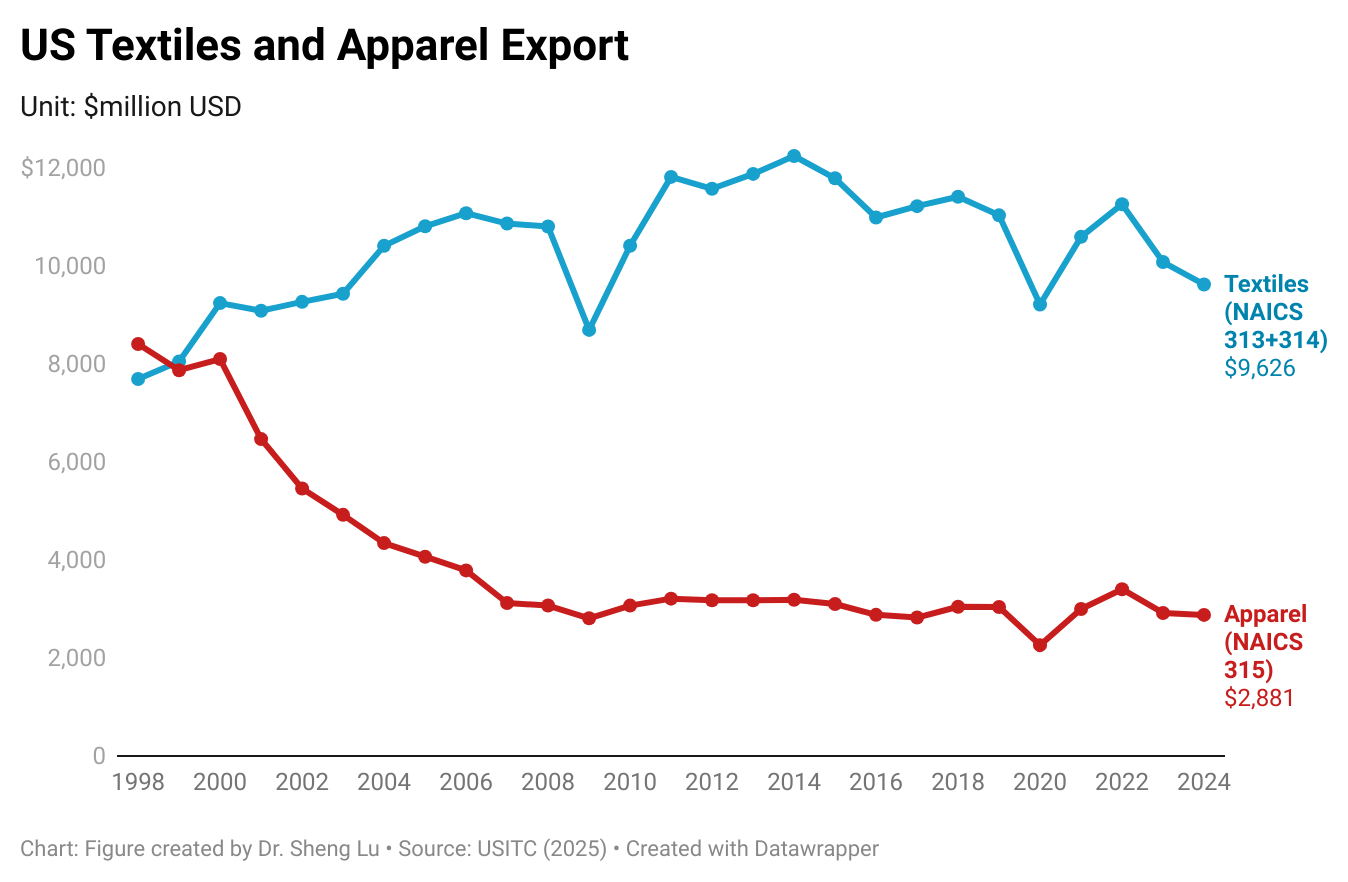
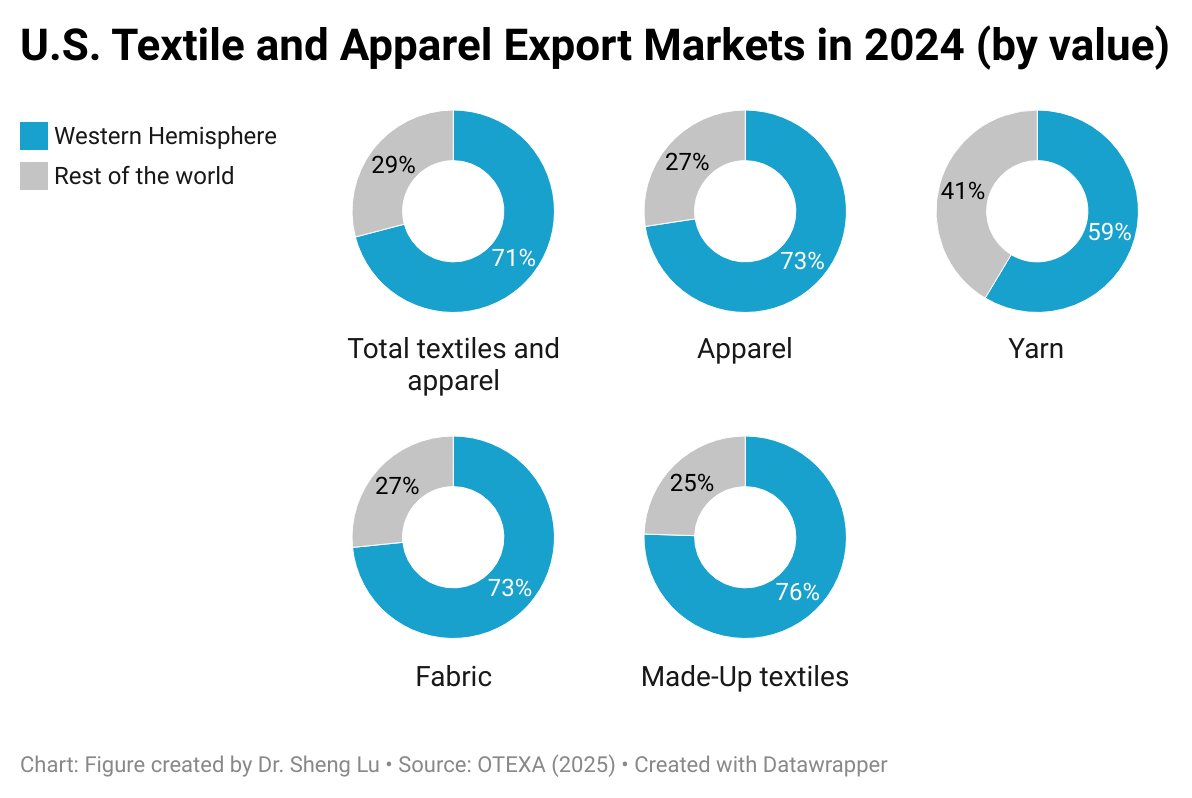
Fourth, international trade, BOTH import and export, supports textiles and apparel “Made in the USA.” On the one hand, U.S. textile and apparel exports exceeded $12.5 billion in 2024, accounting for more than 30% of domestic production as of 2023 (NAICS 313, 314 and 315). Thanks to regional free trade agreements, particularly the U.S.-Mexico-Canada Agreement (USMCA) and the Dominican Republic-Central America Free Trade Agreement (CAFTA-DR), the Western Hemisphere stably accounted for over 70% of U.S. textile and apparel exports over the past decades. However, for specific products such as industrial textiles, markets in the rest of the world, especially Asia and Europe, also become increasingly important. Thus, lowering trade barriers for U.S. products in strategically significant export markets serves the interest of the U.S. textile and apparel industry.

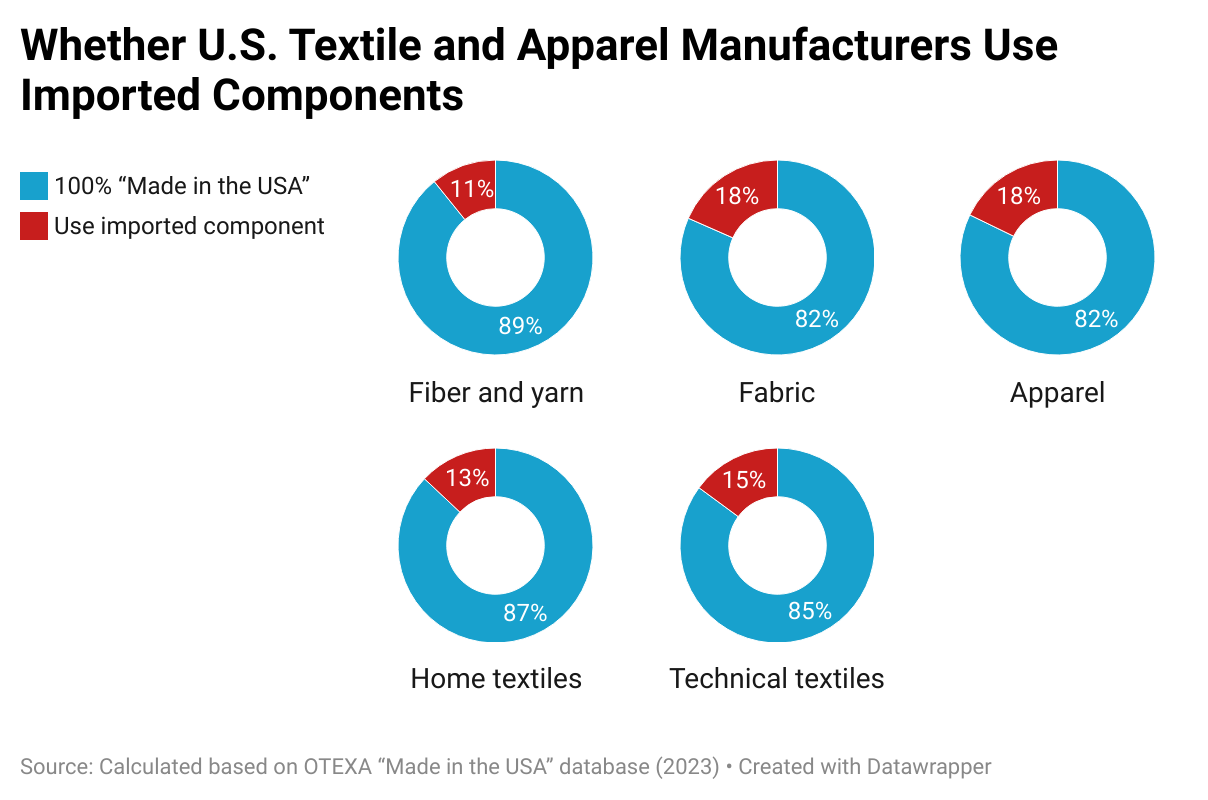
On the other hand, imports support textiles and apparel “Made in the USA” as well. A 2023 study found that among the manufacturers in the “Made in the USA” database managed by the U.S. Department of Commerce Office of Textile and Apparel, nearly 20% of apparel and fabric mills explicitly say they utilized imported components. Partially, smaller U.S. textile and apparel manufacturers appear to be more likely to use imported components–whereas 20% of manufacturers with less than 50 employees used imported input, only 10.2% of those with 50-499 employees and 7.7% with 500 or more employees did so. The results indicate the necessity of supporting small and medium-sized (SME) U.S. textile and apparel manufacturers to more easily access their needed textile materials by lowering trade barriers like tariffs.

By Sheng Lu

Exploring the “Pink Tariff”

Begin at 36 minutes; Students are expected to form their own independent assessments of the topic.

Additional readings:

Discussion questions:

  • What do you think about the pink tariff? How does the pink tariff affect different stakeholders, including consumers and fashion companies?
  • How can fashion companies respond to or navigate pink tariffs in their global sourcing, particularly considering the tariff escalation in 2025?
  • What role can governments and international trade organizations play in addressing pink tariffs, and what policy changes could help eliminate the disparities? What are the challenges?