
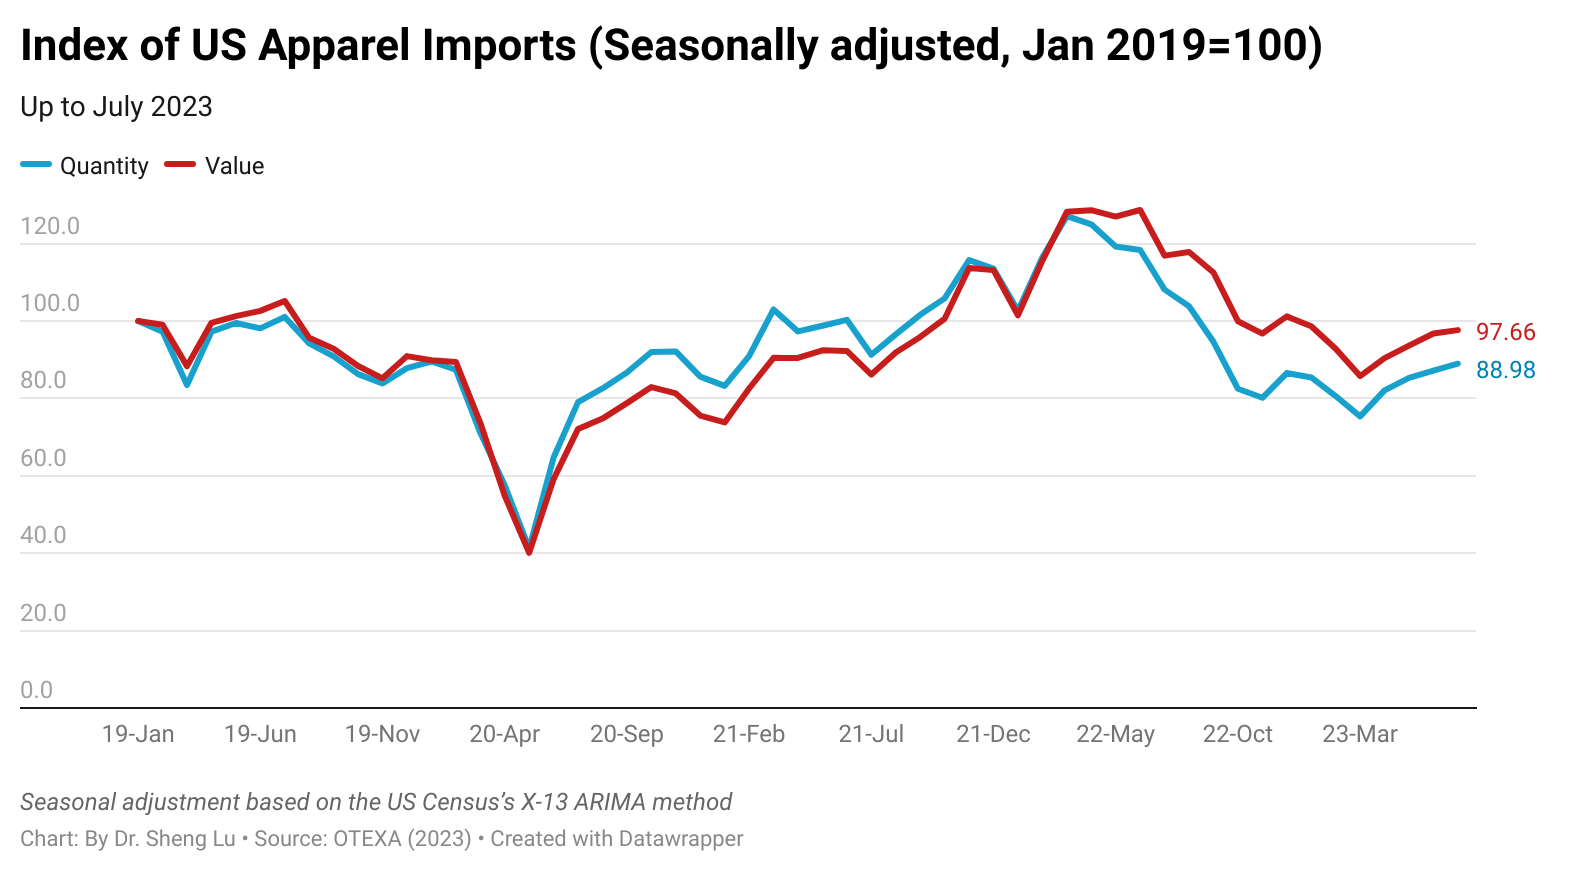

First, while US apparel imports gradually recovered, the import demand remained weak overall. For example, US apparel imports in July 2023 increased by 0.9% in value and 2% in quantity from June (seasonally adjusted). However, the trade volume still experienced a decrease of approximately 17-18% compared to the previous year. Meanwhile, the US consumer confidence index fell again in August 2023, suggesting the economic uncertainties are far from over. Notably, so far in 2023 (January to July), US apparel imports decreased by 22.3% in value and 28% in quantity from the previous year, the worst performance since the pandemic.
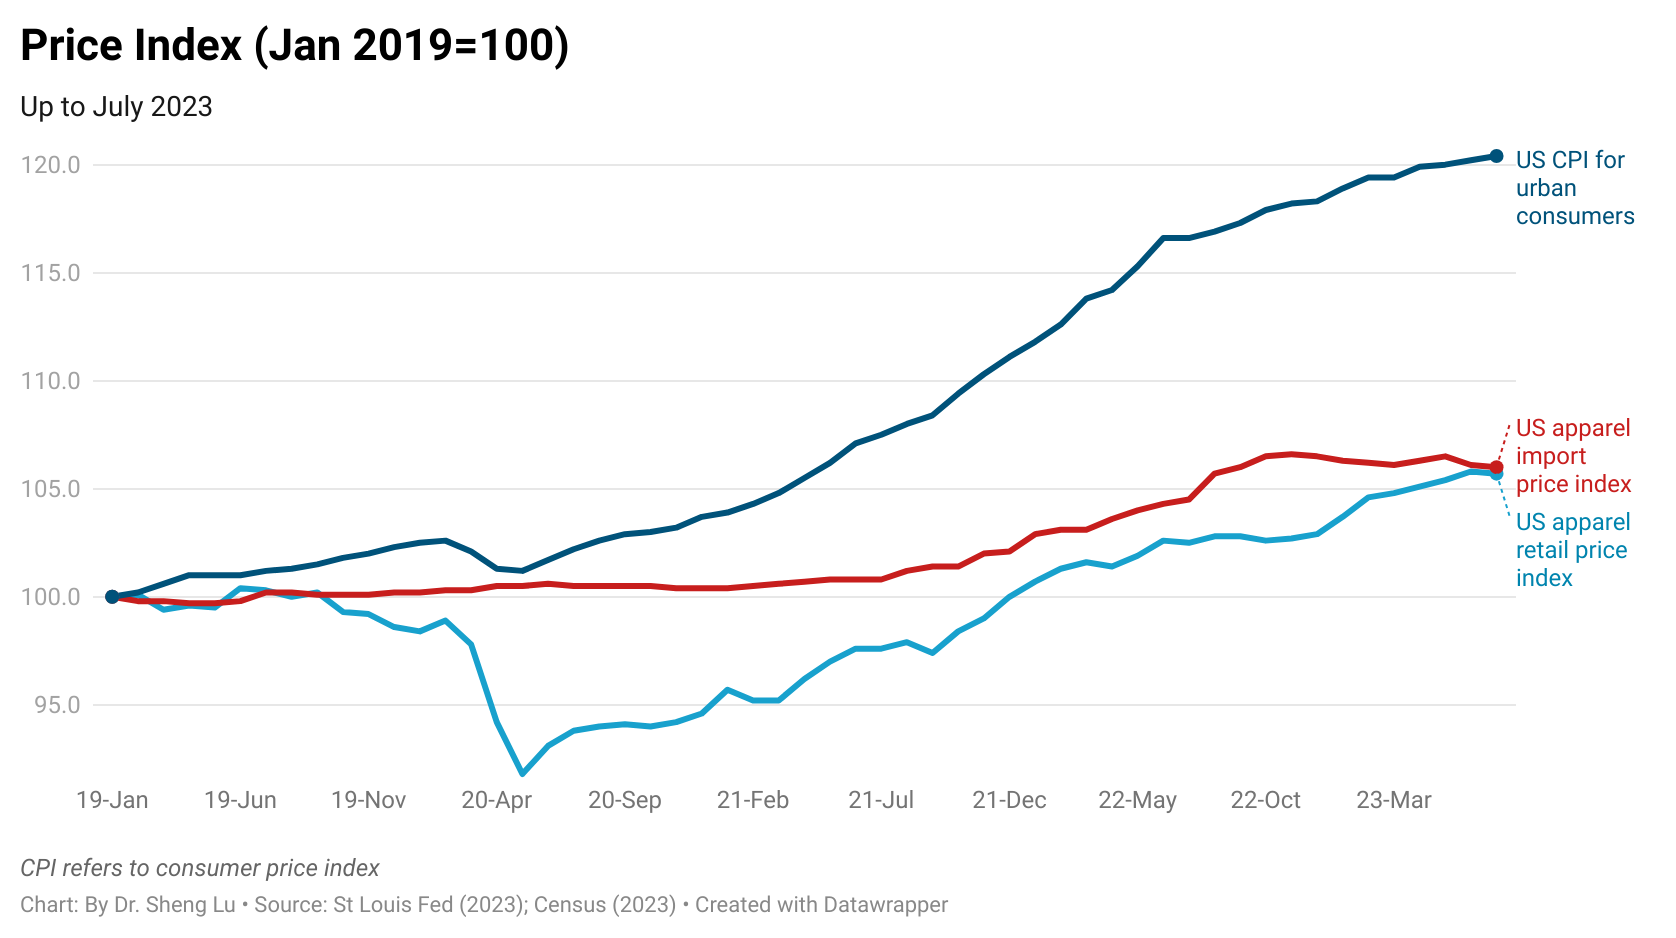
As a silver lining, the price of US apparel imports has stabilized, although inflation remains an issue for the US economy.
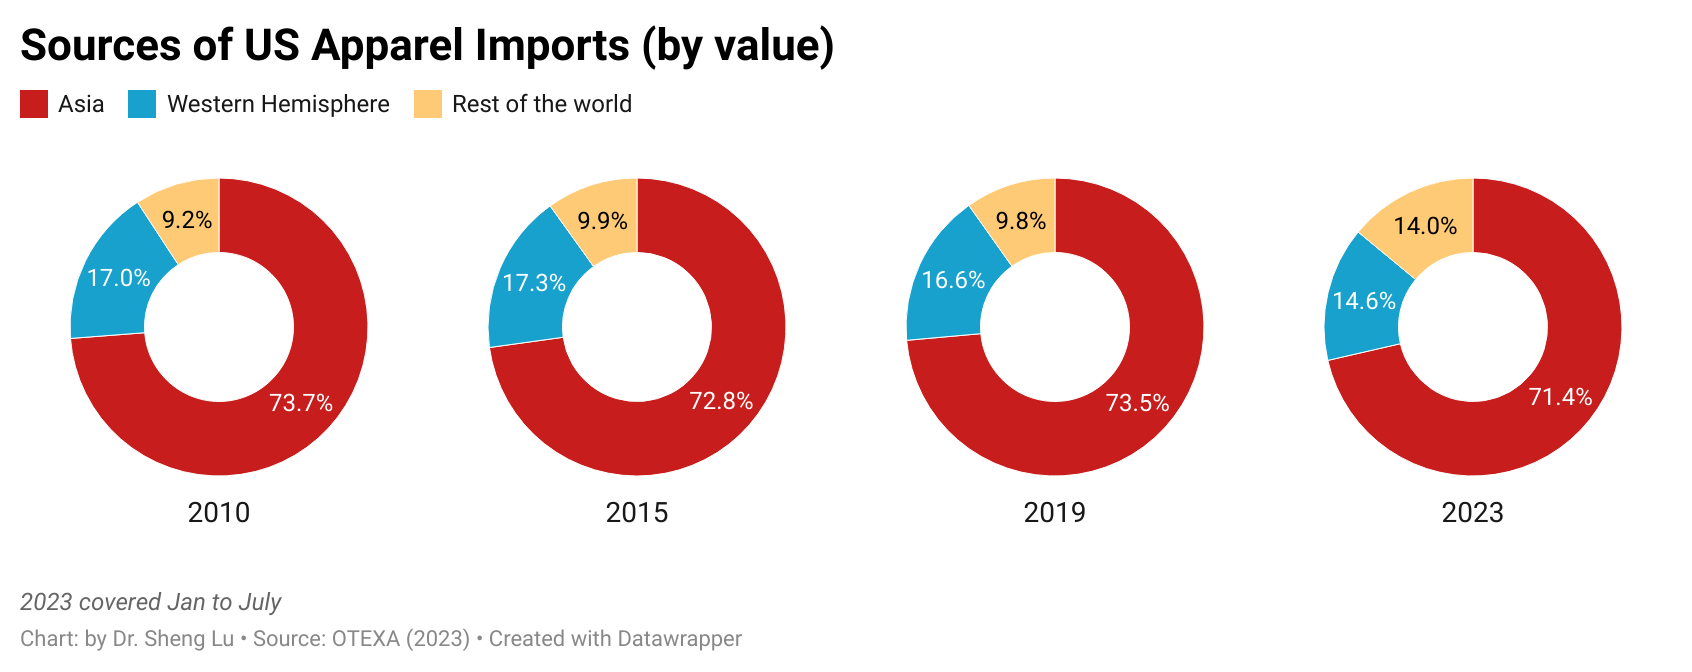
Secondly, because of the seasonal pattern, Asian countries were able to capture relatively higher market shares since June. For example, measured in value, China, ASEAN, and Bangladesh accounted for over 64% of total US apparel imports in July 2023, a notable increase from 61% in June and 58% in May 2023.
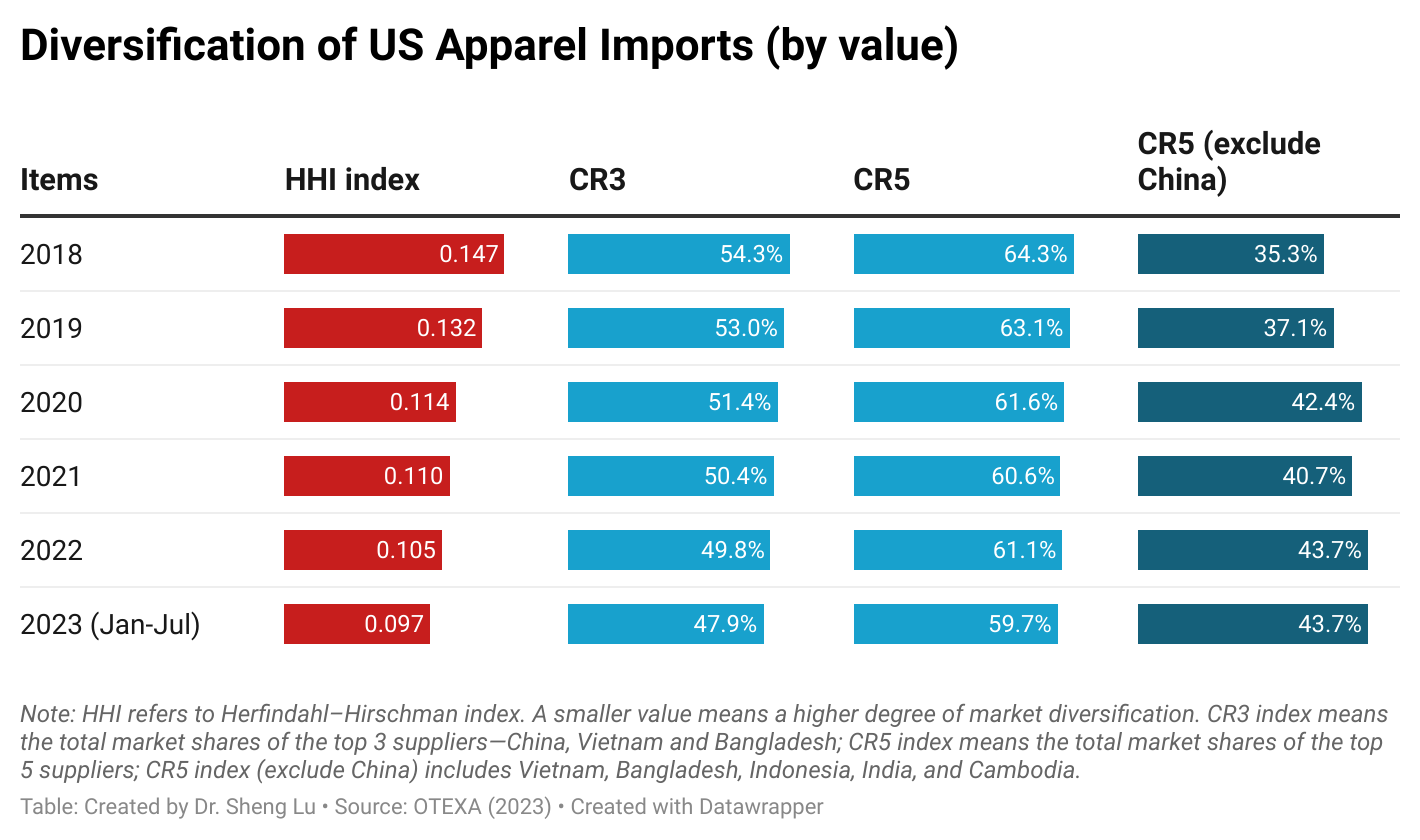
Nevertheless, US fashion companies continue diversifying their sourcing base to mitigate various supply chain risks and rising geopolitical tensions. For example, the HHI Index for US apparel imports dropped to 0.097 in the first seven months of 2023, which is lower than the 0.106 recorded in the same period the previous year (January to July 2022), indicating a greater diversity in the sources of imports.
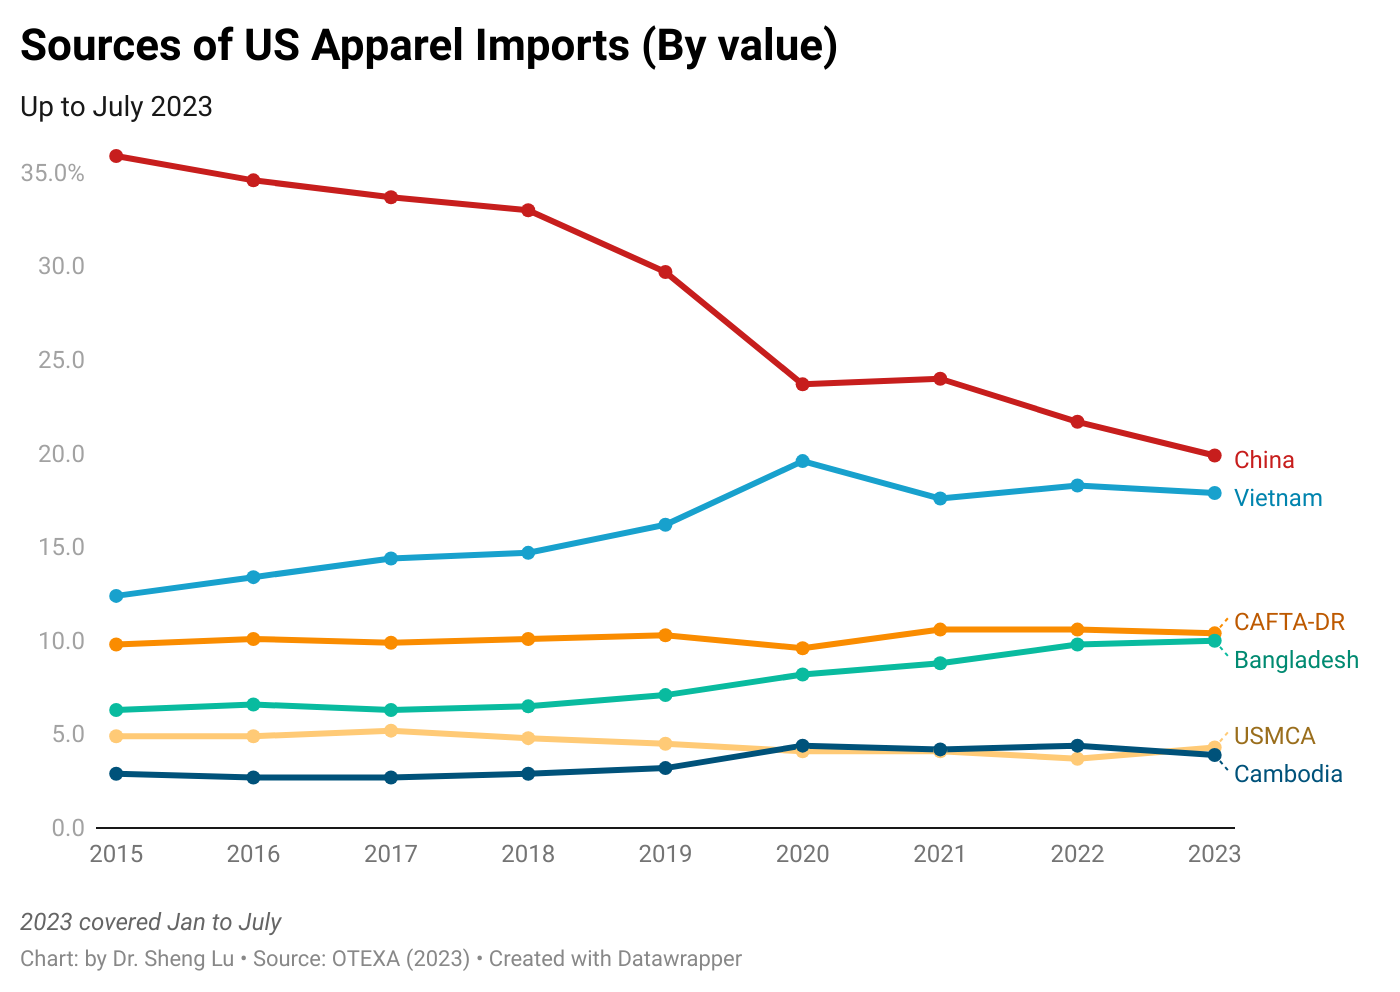
Third, despite an apparent rebound in exports to the US, China continued to experience a further decline in its market share. For instance, in July 2023, China’s market share was more than 3 percentage points lower in value (27.2% in July 2022 vs. 24.1% in July 2023) and 2.5 percentage points lower in quantity (43.1% in July 2022 vs. 40.6% in July 2023). This marked the worst performance since April 2023. In other words, consistent with recent industry surveys, US fashion companies continue to reduce their China exposure given the adverse business environment.
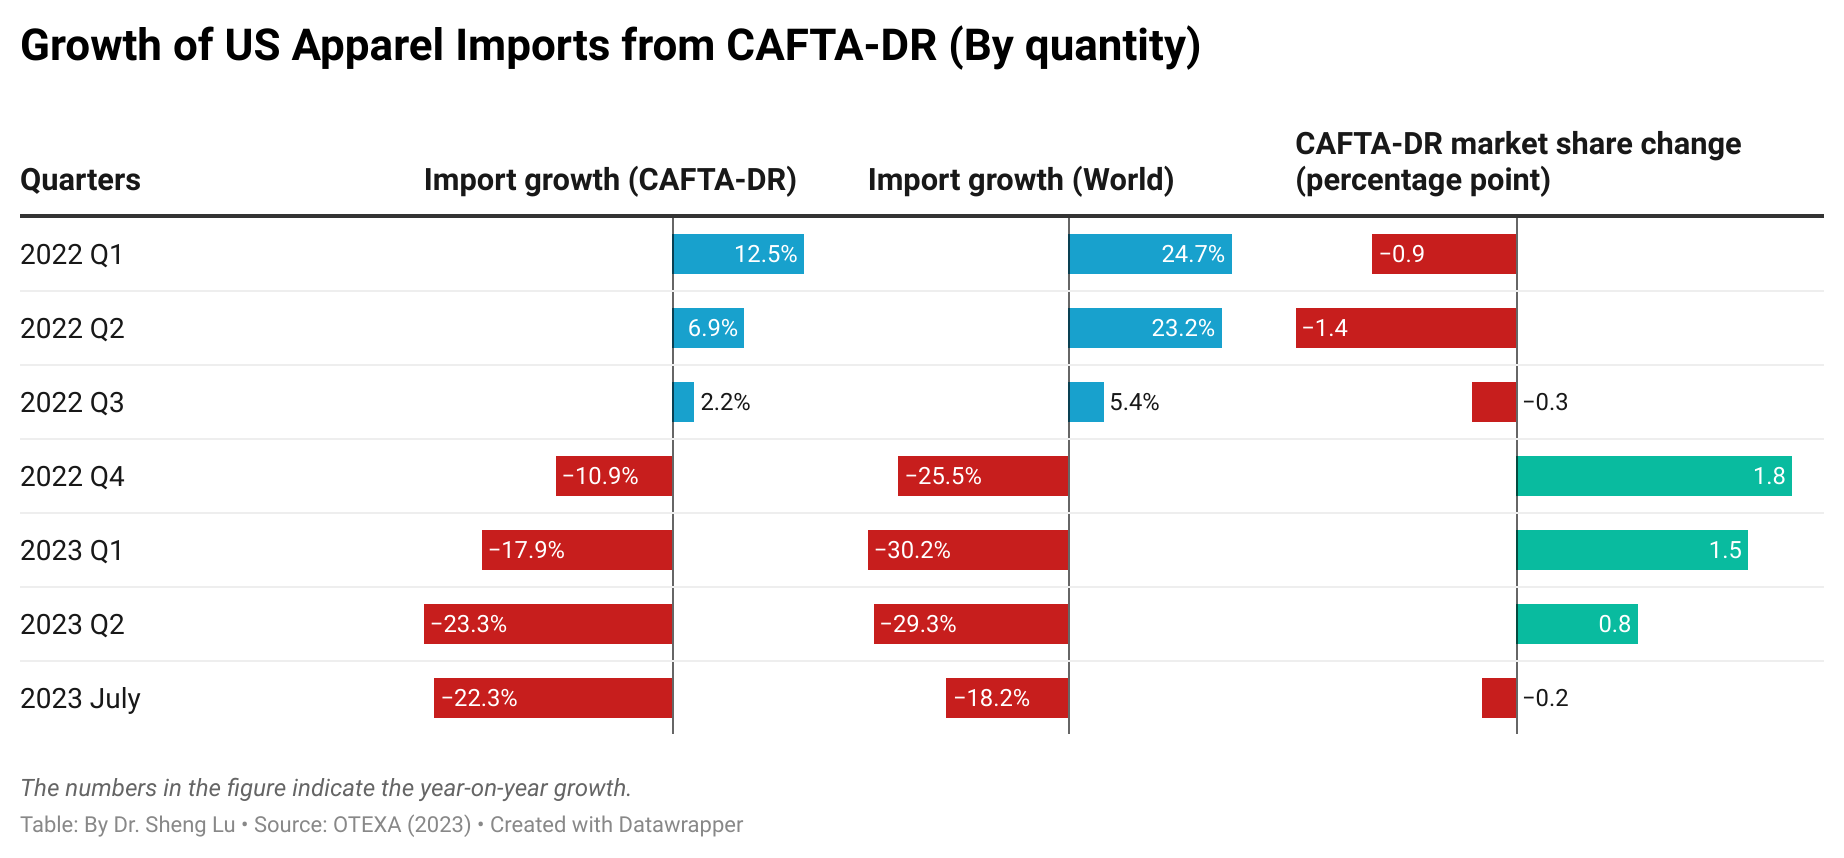
Fourth, the latest data suggests that US apparel imports from CAFTA-DR members remain stagnant, and some critical problems, such as the underutilization of the agreement, even worsened. For example, about 9.5% of US apparel imports in value and 8.5% in quantity came from CAFTA-DR members in July 2023, lower than 10.2% and 9.0% in the previous year (i.e., July 2022). In absolute terms, US apparel imports from CAFTA-DR in 2023 were about 20% lower than in 2022.
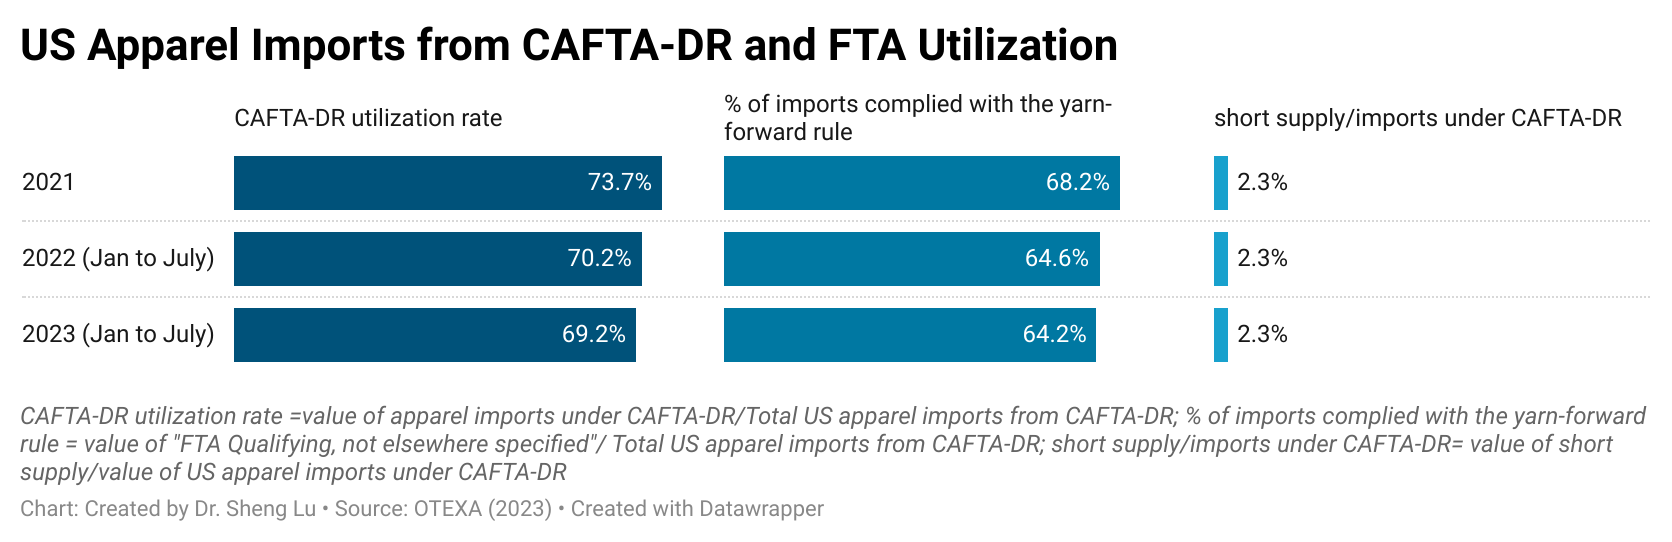
Additionally, CAFTA-DR’s utilization rate (i.e., the value of imports claiming the duty-free benefits under CAFTA-DR divided by the total value of imports from CAFTA-DR) fell from 70.2% in 2022 (Jan to July) to a new low of 69.2% in 2023 (Jan to July). Likewise, the value of imports utilizing CAFTA-DR’s short supply decreased by more than 20%. Thus, how to leverage CAFTA-DR to meaningfully encourage more US apparel imports from the region, particularly in light of US fashion companies’ eagerness to reduce their exposure to China, calls for sustained efforts and probably new strategies.
by Sheng Lu
