FASH455 Learning Activity: Exploring US Trade Patterns

(note: please click the section title to access interactive data)

Part 1: U.S. Goods Trade by Industry Sectors and Trading Partners (Source: USITC Trade Shifts 2024 Report)

  • Observe the top U.S. export and import trading partners for goods, noting any changing patterns
  • Observe the top U.S. export and import product sectors, noting any changing patterns
  • Do the trade patterns overall align with the trade theories discussed in class?
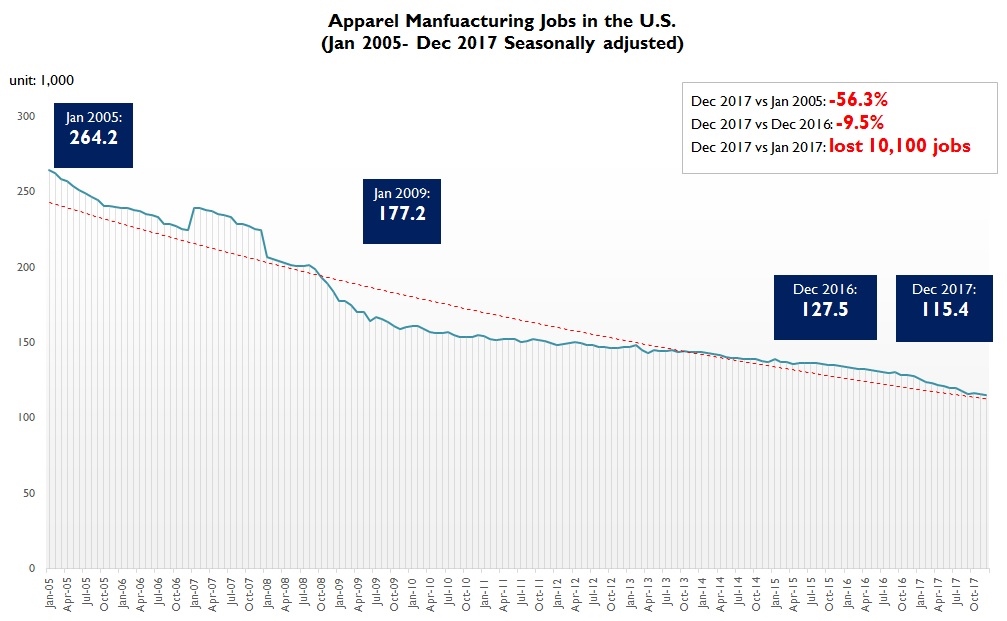
  • Should it be a concern that textiles and apparel are NOT among the top US exports of goods?

Part 2: U.S. Trade in Services (Source: USITC Recent Trends in US Services Trade 2024 Report)

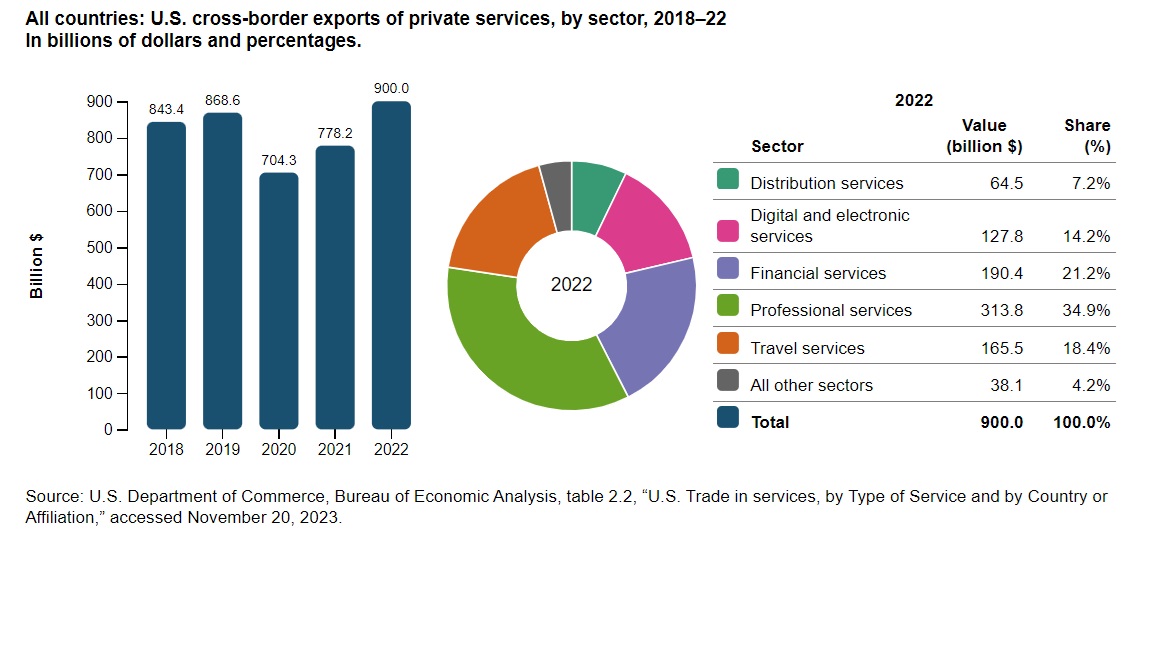
  • Observe the sectors covered by trade in services
  • Compare the value of US service exports and imports
  • Observe the trading partners of US services trade
  • Why do politicians often focus more on trade in goods rather than services? Should they?

Part 3 (Optional): Revealed Comparative Advantage Index (Source: UNCTAD)

Note: The revealed comparative advantage (RCA) index measures a country’s relative export performance of a particular product compared to the world average. It helps identify sectors in which a country holds a competitive edge in international trade. RCA =(Country’s exports of product X/Country’s total exports)/(World exports of product X/World total exports).

  • RCA > 1: A value greater than 1 indicates that the country has a revealed comparative advantage in the product, meaning the product has a higher export share in the country’s portfolio compared to the global average. This suggests the country is more competitive in exporting that product relative to the rest of the world.
  • RCA < 1: A value less than 1 means the country has a revealed comparative disadvantage in that product. It indicates that the country is less competitive in exporting that product compared to the global average.

Observe the sectors in which the U.S. enjoyed a revealed comparative advantage (i.e., RCA > 1) in 2023. How does this compare with Bangladesh? What is your explanation for the observed differences?​

Historical Benefits of Trade

Interview with Dr. Douglas A. Irwin on the historical benefits of trade

Minute 1’53s: What’s wrong with the view that trade is a zero-sum game.

Minute 4’50s: A review of the concept of comparative advantage by using the textile and apparel industry as an example.

Minute 7’30s: What is trade protectionism?

Minute 9’02s: Why did the United States brace the idea of free trade after WWII and push forward the establishment of the multilateral trading system GATT?

Minute 10’30s: what drives the U.S. trade deficit from the economic perspective?

Minute 15’57s: international trade and U.S. apparel manufacturing jobs

US Continues to Lose Textile and Apparel Manufacturing Jobs in 2017

textile

apparel

It may disappoint those who are hoping a return of textile and apparel manufacturing jobs in the United States. But according to latest statistics from the Bureau of Labor Statistics (BLS), the U.S. textile industry (NAICS 313 and 314) and apparel industry (NAICS 315) respectively lost another 4,100 and 10,100 jobs in 2017.  Between January 2005 and December 2017, 44.2% and 56.3% of jobs in the U.S. textile and apparel sectors were gone.  

From the academic perspective, a sizable return of textile and apparel manufacturing job in the United States seems to be extremely unlikely given the nature of the U.S. and the global economy in the 21st century.

Notably, the rising import is found NOT a significant factor leading to the decline in employment in the U.S. textile industry (NAICS 313). As estimated by a US International Trade Commission study in 2016, imports were found only contributed 0.4 percent of the total 7.6 percent annual employment decline in the U.S. textile industry between 1998 and 2014. Instead, more job losses in the sector were caused by: 1) the improved productivity as a result of capitalization and automation (around 4.6 percent annually); and (2) the shrinkage of domestic demand for the U.S. made textiles (around 3.5 percent annually).

And consistent with the prediction of classic trade theories, as capital and technology abundant developed country, the United States, not surprisingly, continues to lose its comparative advantage in making labor-intensive apparel. Hypothetically, apparel “Made in the USA” may come back if apparel manufacturing can be substantially automated like textile manufacturing. However, net job creation in the sector as a result of automation is hard to tell. Additionally, most U.S. apparel companies heavily rely on global sourcing and non-manufacturing activities such as branding, marketing, and design today. Few companies still regard “manufacturing” a key competitive advantage or an area of strategic importance to invest in the future.

Related reading: Creating High-Quality Jobs in the U.S. Textile and Apparel Industry (UD Biden Institute)