Patterns of Global Textile and Apparel Trade Measured by Origin of Value Added (updated October 2025)

Textiles and apparel today are produced through a global supply chain. For clothing labeled as “Made in Vietnam,” it is likely that the textile raw materials, such as yarns, fabrics, and trims, are sourced from elsewhere.

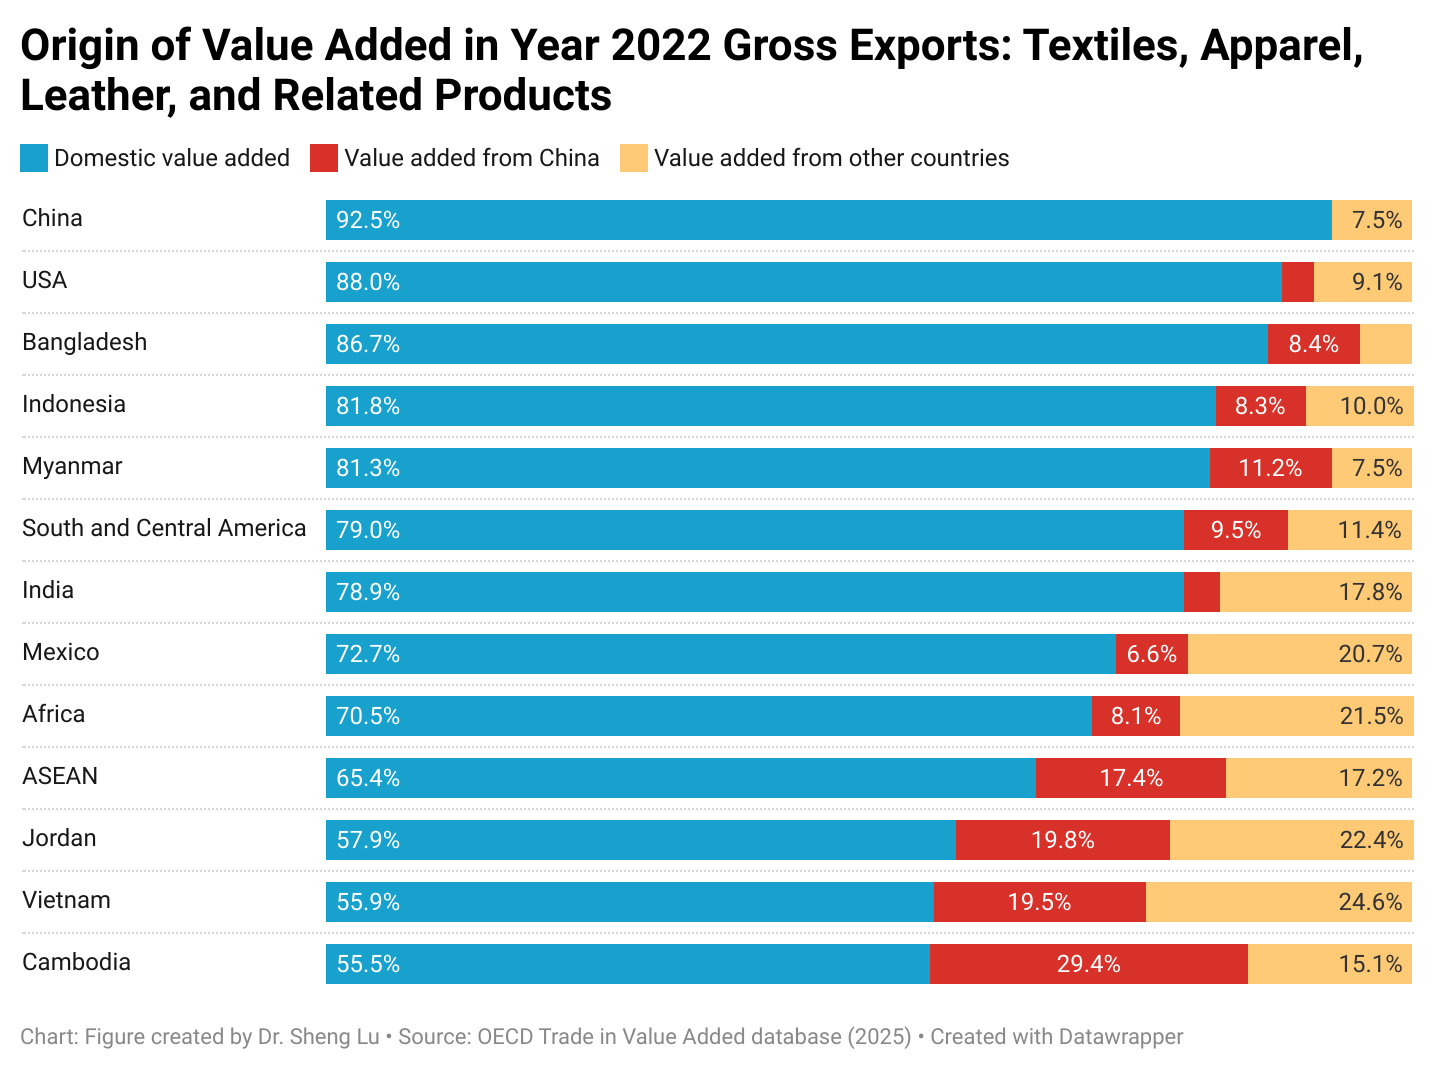
According to the newly released 2025 OECD trade in value added estimation, as of 2022, a country’s apparel exports commonly contain value added created in another country due to the use of imported textile materials and other inputs. This is the case for exports from leading apparel exporting countries in Asia, such as Vietnam (44% foreign value added), ASEAN members (35% foreign value added), Cambodia (45% foreign value added), India (21% foreign value added), and Jordan (42% foreign value added). Other emerging apparel sourcing destinations in North, South, and Central America, as well as the EU, also used substantial imported inputs for their apparel exports, such as Mexico (27.3% foreign value added), Türkiye (23.9% foreign value added), and Egypt (19.7% foreign value added). [See detailed data here]

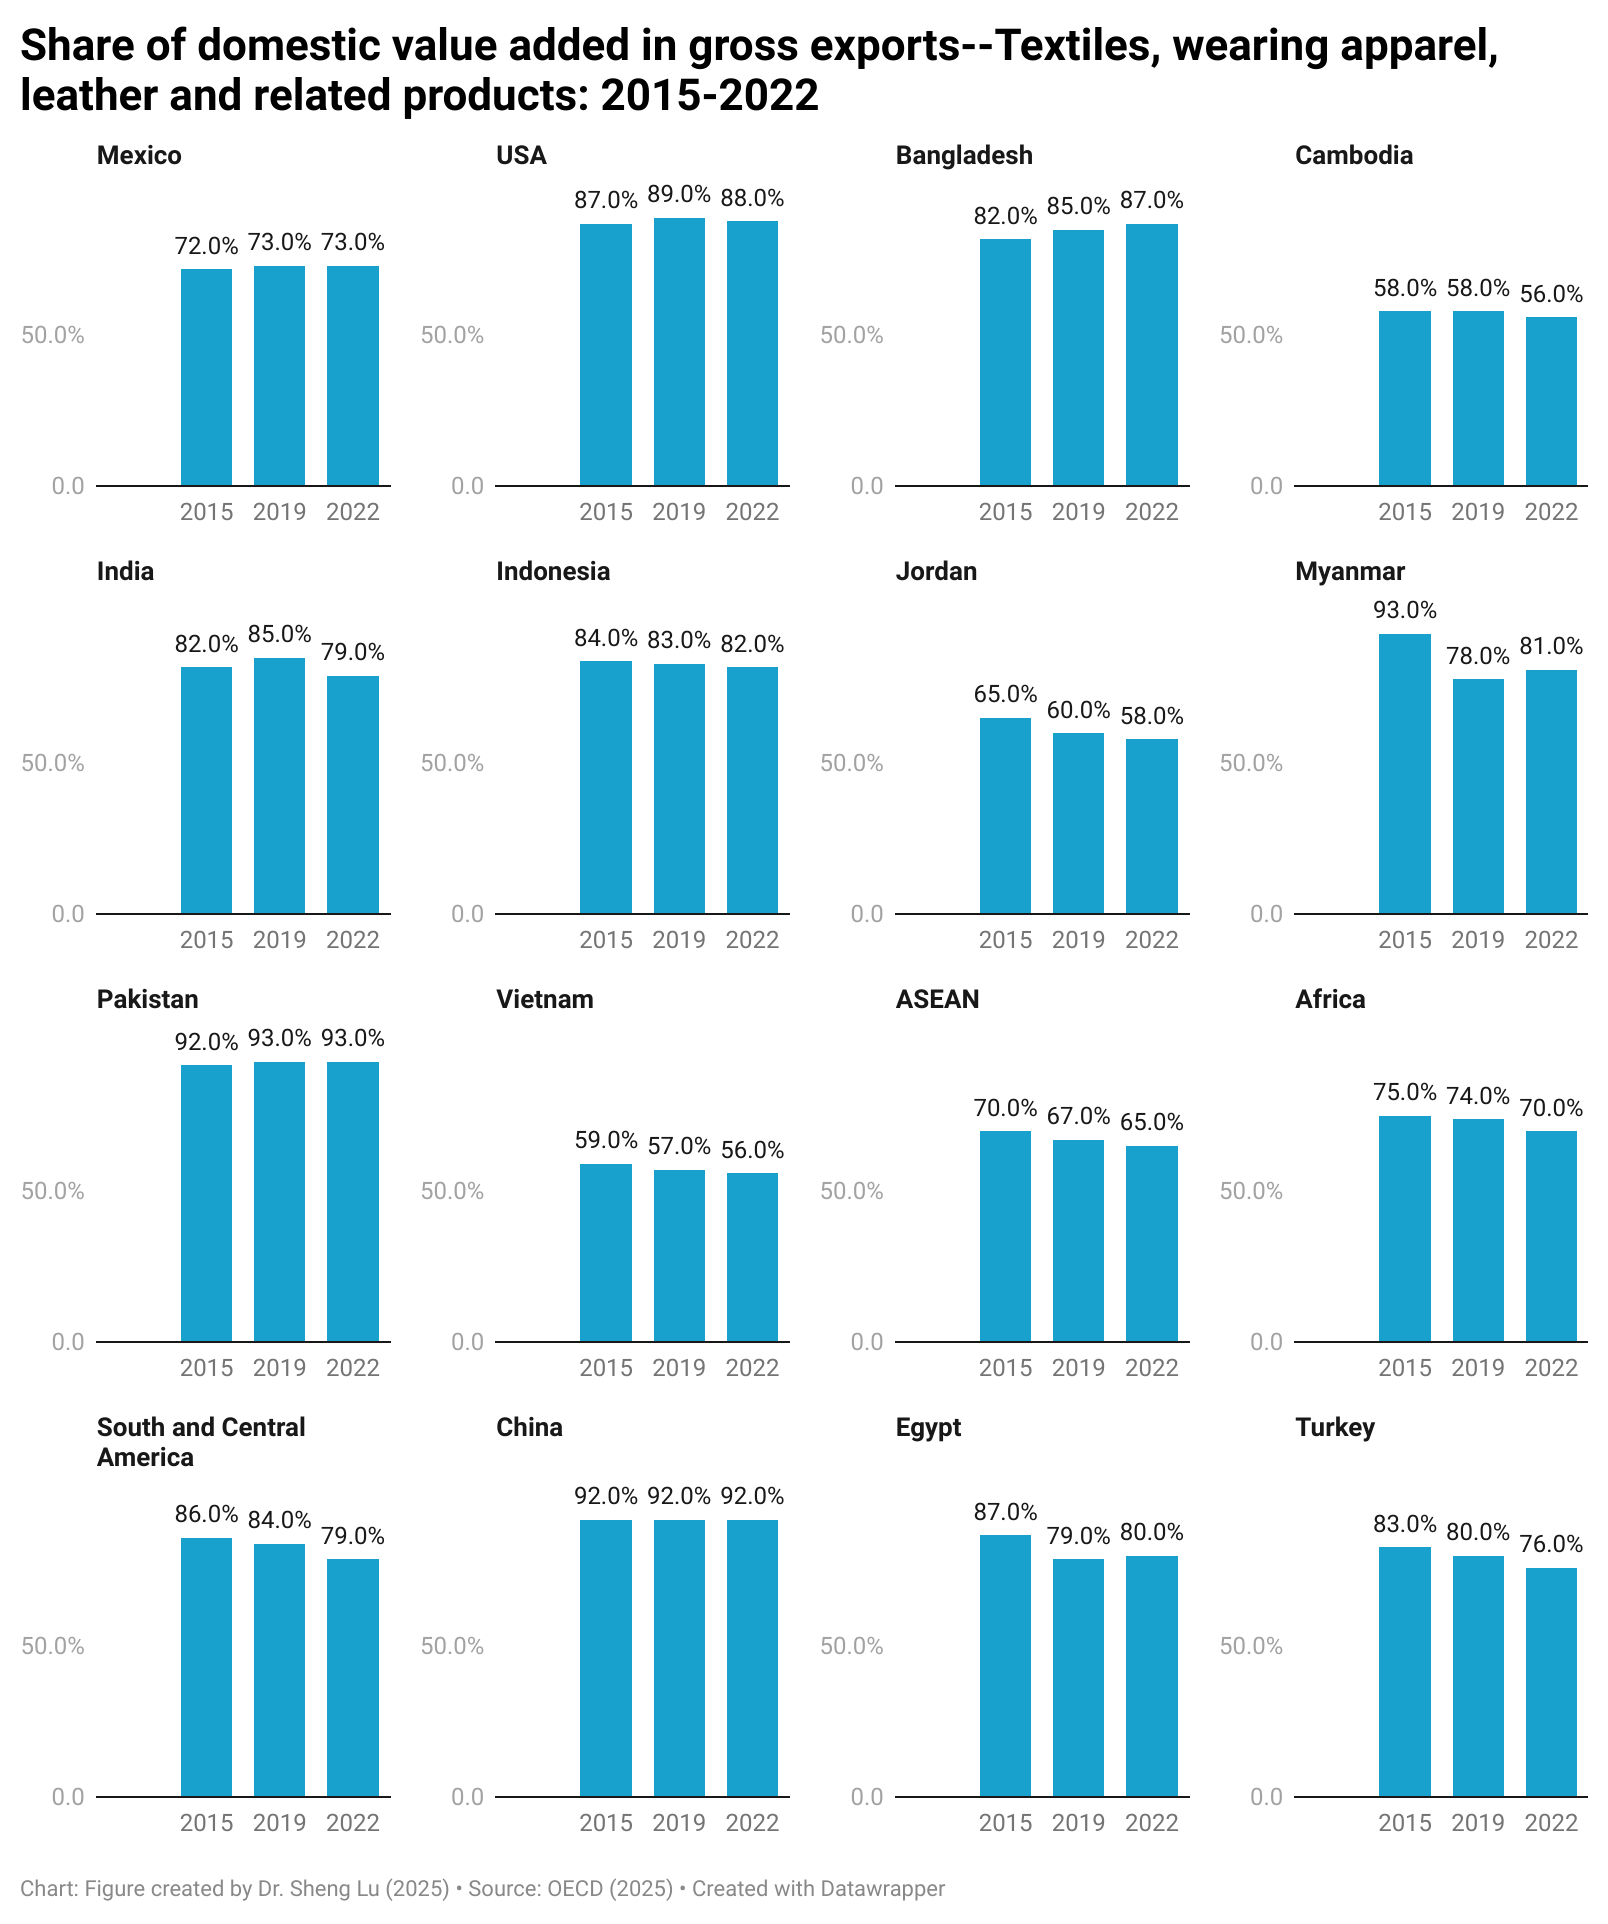
Notably, among the sixteen countries and regions examined, they mostly increased the use of non-domestic value added in textile and apparel exports between 2015 and 2022 (note: paired T-test result was statistically significant at the 99% confidence level). This suggests that co-production through regional or global supply chains, rather than 100% domestic production, has become a more prominent phenomenon in the textiles and apparel industry. [See detailed data here]

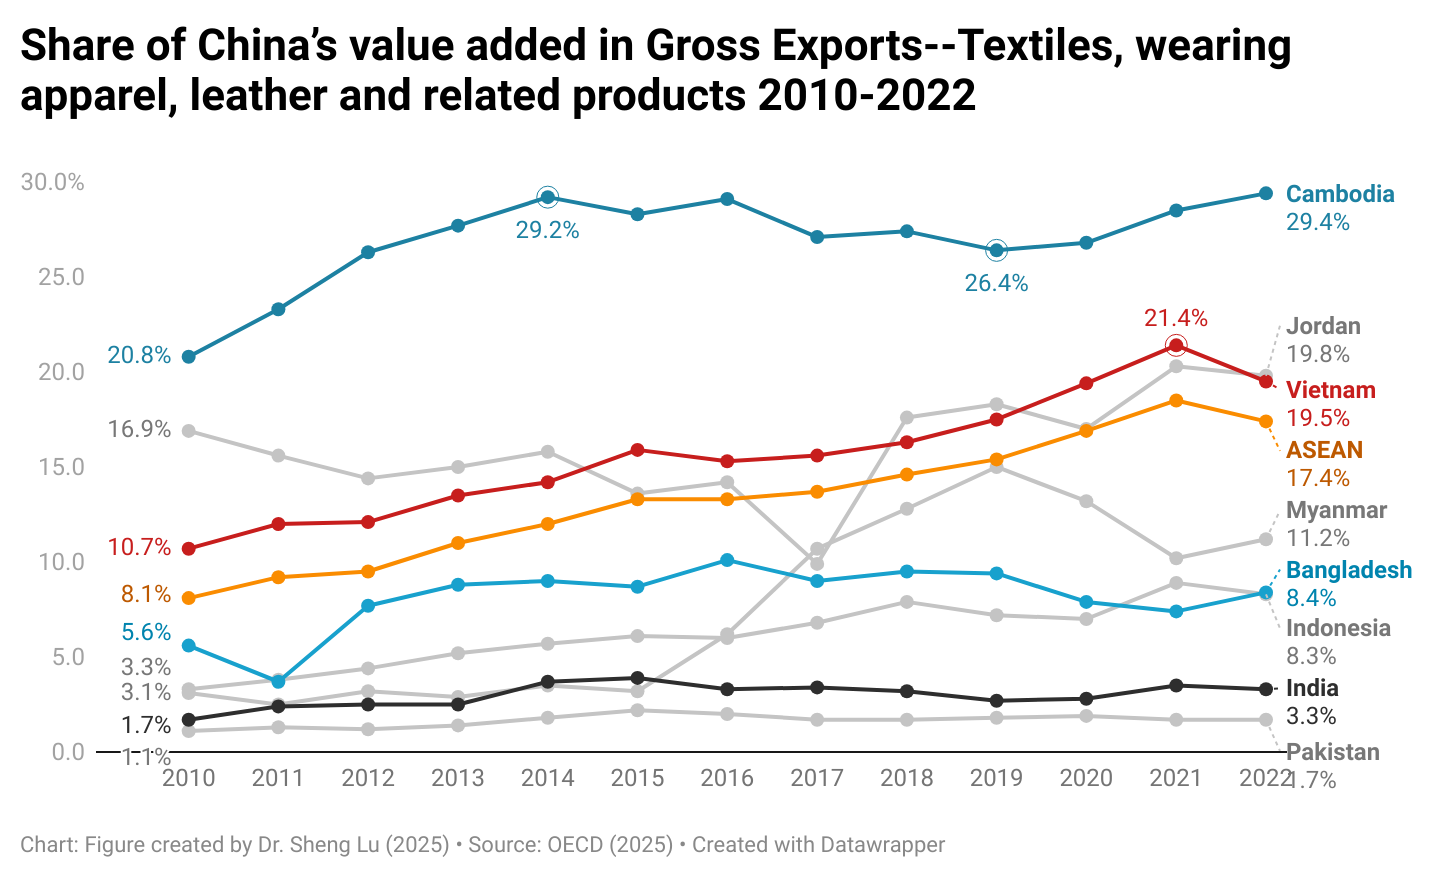
Furthermore, the value added from China appears to be increasing in the textile and apparel exports of many countries. Specifically, between 2015 and 2022, textile and apparel exports from several countries contained a higher percentage of value added from China, including not only Asian countries such as Vietnam (up 6 percentage points), ASEAN (up 4.1 percentage points) and Jordan (up 6.1 percentage points), but also those in other regions such as Egypt (up 3.3 percentage points), Mexico (up 1.7 percentage points), and South & Central America as a whole (up 4.7 percentage points). [See detailed data here] This result reflected China’s deliberate effort to expand its global economic presence through foreign direct investment, Belt and Road initiatives, and new trade agreements in recent years. 

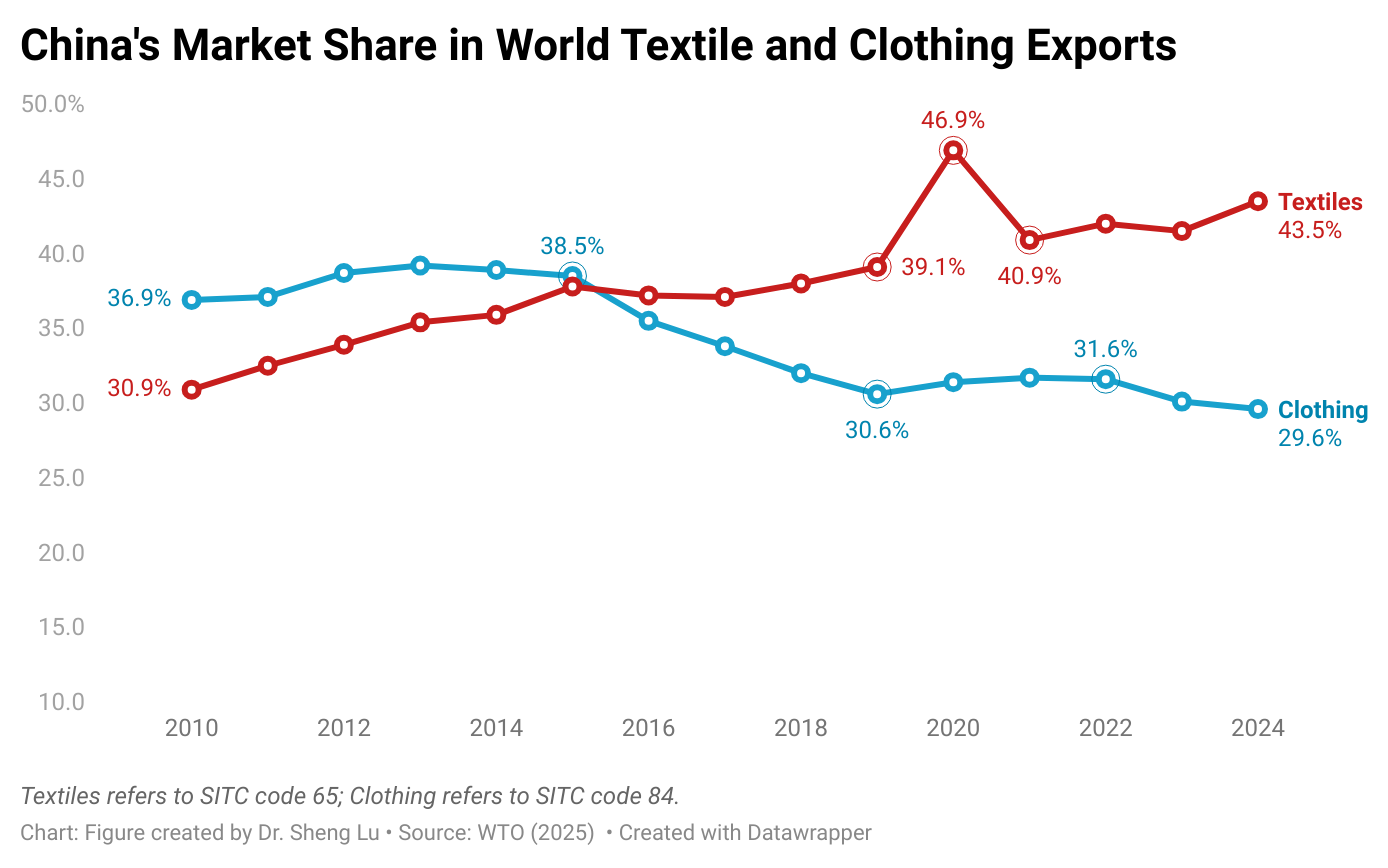
The latest data from the World Trade Organization (WTO) also shows that while China’s market share in the world clothing exports fell to 29.6% in 2024—the lowest level since 2010—China’s market share in textile exports increased to 43.3% in 2024, up from 41.5% a year earlier. In other words, consistent with the stage of development theory, China’s role as a major textile supplier to other apparel-exporting countries continues to grow, despite a decline in its finished garment exports. [See detailed data here]

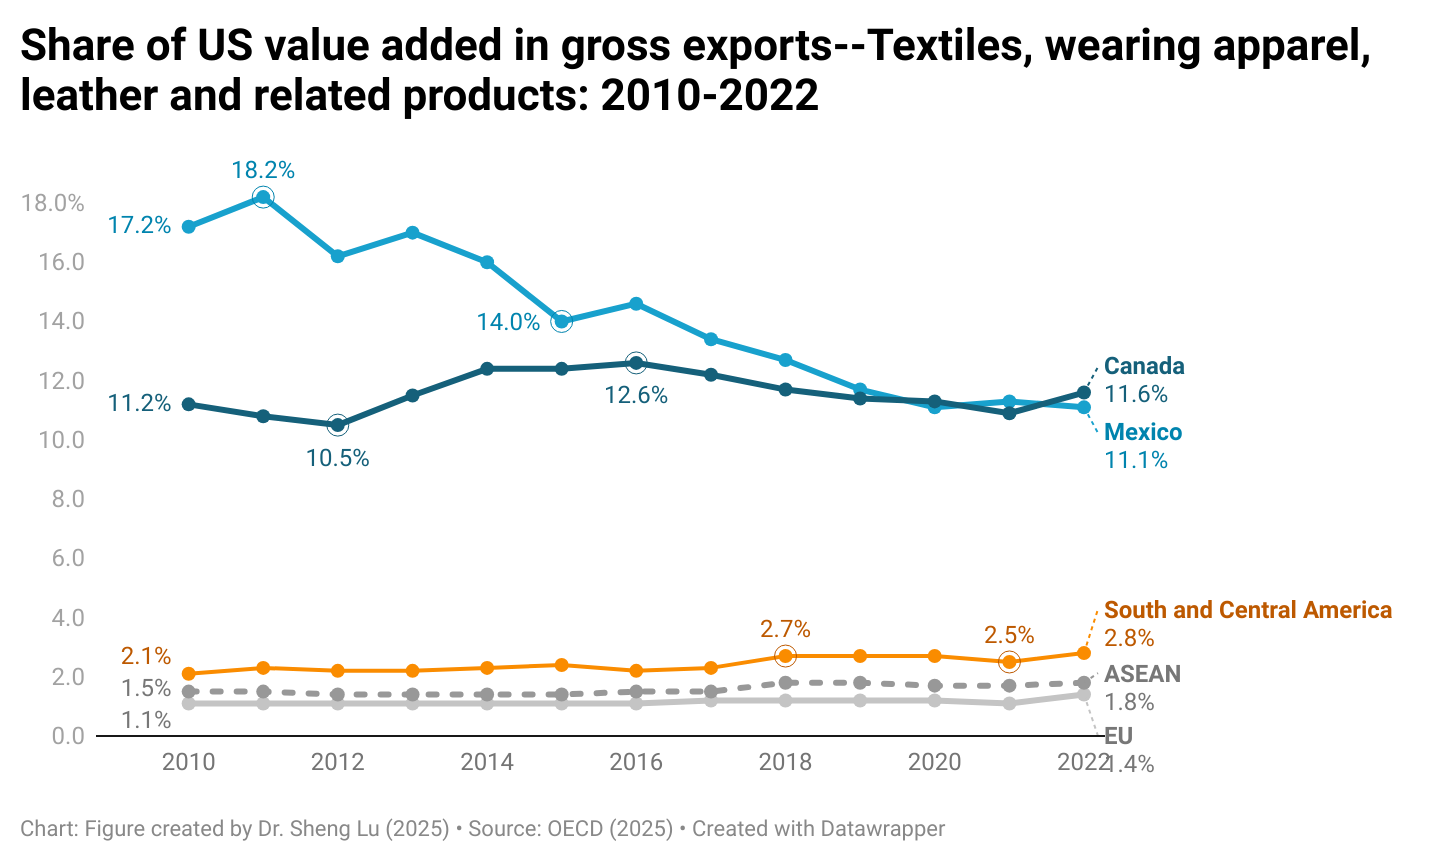
In comparison, while the United States remained an important contributor to the value added of textile and apparel exports from Mexico and Canada, its contribution slightly declined between 2015 and 2022 (i.e., from about 12%-14% to 11%). As the USMCA undergoes its mandated six-year review, it is critical to strengthen, rather than weaken, this North American co-production supply chain, which has a significant impact on the economic interests of the U.S. textile and apparel industry. This is particularly important given that supply chain collaboration between the U.S. and Asian or EU countries for textile and apparel production has been limited, with little indication of growth: According to OECD data, the U.S. value added in Asian and EU countries’ textile and apparel exports remained only around 1.5% [See detailed data here].

by Sheng Lu

(This post is not open for discussion due to its technical nature)

New OECD Study: The Role of Sustainability Certifications In Due Diligence In The Garment And Footwear Sector (February 2025)

The study was based on a content analysis of major fashion brands and retailers’ sustainability reports and a survey of stakeholders in the garment and footwear sector from August to October 2023, including 32 brands and retailers, 37 suppliers, and a few non-business respondents.  The full report is HERE.

Key findings:

Rise in sustainability certification in the garment and footwear industry

  • Certifications like GOTS (Global Organic Textile Standard) and LWG (Leather Working Group) have seen significant growth (e.g., GOTS-certified facilities increased by 154% from 2018–2023).
  • Certified textile materials still constitute a minority of global production (e.g., 27% for cotton, 39% for leather)

Sustainability certification requirements and motivations

  • Over 80% of surveyed garment and footwear brands/retailers require certifications from suppliers, driven by risk identification (92%), product tracing (81%), and compliance with regulations (72%). In general, larger brands/retailers (91% of those with >€50M turnover) are more likely to mandate certifications than smaller ones (60% of small and medium-sized enterprises, SME).
  • In contrast to brands and retailers, most surveyed garment and footwear suppliers selected market access (84%) as a key motivation for obtaining certifications, followed by reputational reasons (83%) and risk identification (68%)

Types of sustainability certification in the garment and footwear industry

The paper divides sustainability certification in the garment and footwear industry into three major categories:

  • Due diligence certification to attest that a company (e.g. brand, manufacturer) implements the 6-step risk-based due diligence framework as outlined in the OECD Due Diligence Guidance (e.g., Green Button, Oeko-Tex Responsible Business).
  • Targeted risk certifications to verify outcomes on labor, environmental, or animal welfare risks in the supply chain (e.g., Better Cotton Initiative, Cradle to Cradle, Fairtrade Cotton, Fairtrade Textiles, FSC Forest Management, Global Recycled Standard (GRS), GoodWeave, GOTS, LWG, Oekotex SteP, SA8000, Worldwide Responsible Accredited Production)
  • Certificates of origin and chain of custody to trace raw materials (e.g., cotton, wool) to specific regions or facilities (e.g., Better Cotton Traceability, GOTS transaction certificates)

Role of sustainability certification in trade and market access

  • Certifications standardize compliance, enabling suppliers to meet buyer/regulatory demands (e.g., EU due diligence laws).
  • Brands use certifications to exclude high-risk regions (e.g., cotton from areas with forced labor) and validate ethical claims (e.g., recycled content).

Challenges related to sustainability certification in the garment and footwear sector

  • As the report noted, suppliers typically bear certification costs (e.g., audits, improvements), with limited buyer support.
  • SMEs and informal suppliers struggle with eligibility criteria and costs, risking exclusion from global supply chains.
  • The paper argues that certifications are not a “safe harbor.” Instead, apparel and footwear brands and retailers must complement certification with direct assessments, grievance mechanisms, and stakeholder engagement (e.g., worker interviews). Likewise, mandatory due diligence laws (e.g., EU CSDDD) will increase certification demand, but companies must balance compliance with holistic risk management.
  • The paper emphasizes the need for further research to understand how fashion brands and retailers use sustainability certification in practice. Policymakers should also consider new guidelines that clarify how companies should communicate publicly about the elements of due diligence for which they utilize sustainability certifications.

OECD Service Trade Restrictiveness Index Shows Trade Obstacles in Emerging Economies Remain High

Untitled

According to the latest Service trade Restrictiveness Index (STRIs) released by the Organization for Economic Cooperation and Development (OECD), service trade barriers in many emerging economies remain much higher than their developed trading partners.

Specifically for the distribution service sector, which covers general wholesale and retail sales of consumer goods, the STRIs suggests the highest trade barriers are in place in Indonesia, China and India whereas Spain, Germany and Czech Republic are among the most open to foreign companies (see the figure above).  Because trade in distribution services has mainly taken place through commercial presence, and the STRI results highlight the importance of impediments on foreign ownership.

The STRIs indices take the value from 0 to 1, where 0 is completely open and 1 is completely closed. The indices are calculated based on the following five factors:

  • Restrictions on foreign ownership and other market entry conditions (30%)
  • Restrictions on the movement of people (10%)
  • Other discriminatory measures and international standards (17%)
  • Barriers to competition and public ownership (22%)
  • Regulatory transparency and administrative requirements (21%) 

Currently, the STRIs include 40 countries (34 OECD members as well as Brazil, China, India, Indonesia, Russia and South Africa) across 18 service sectors.