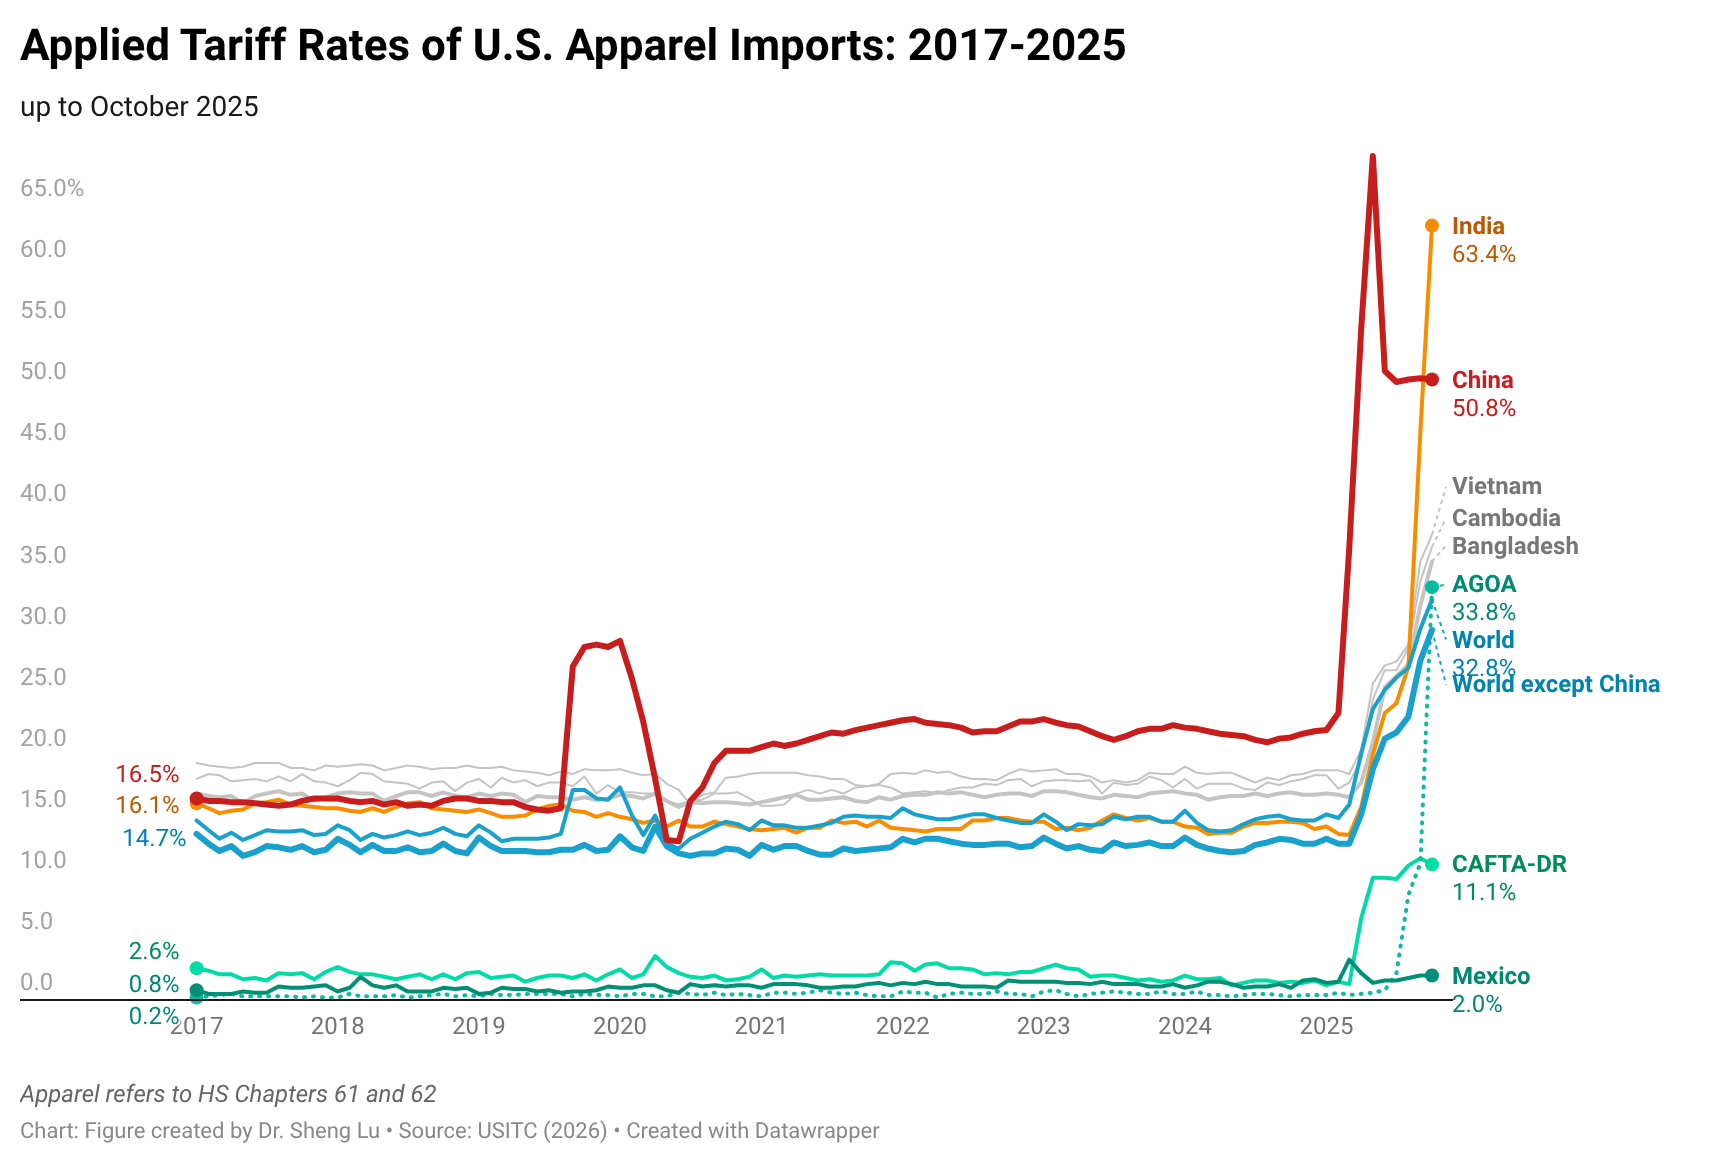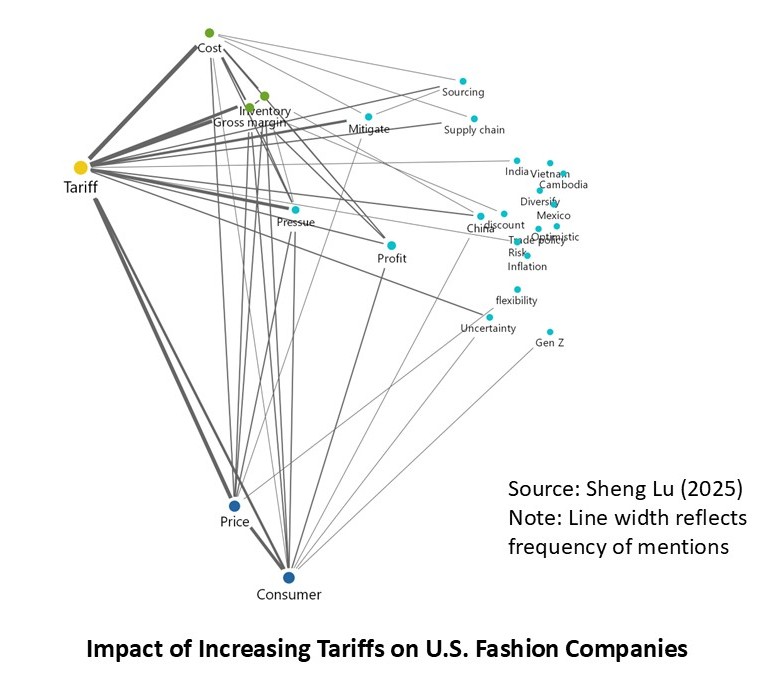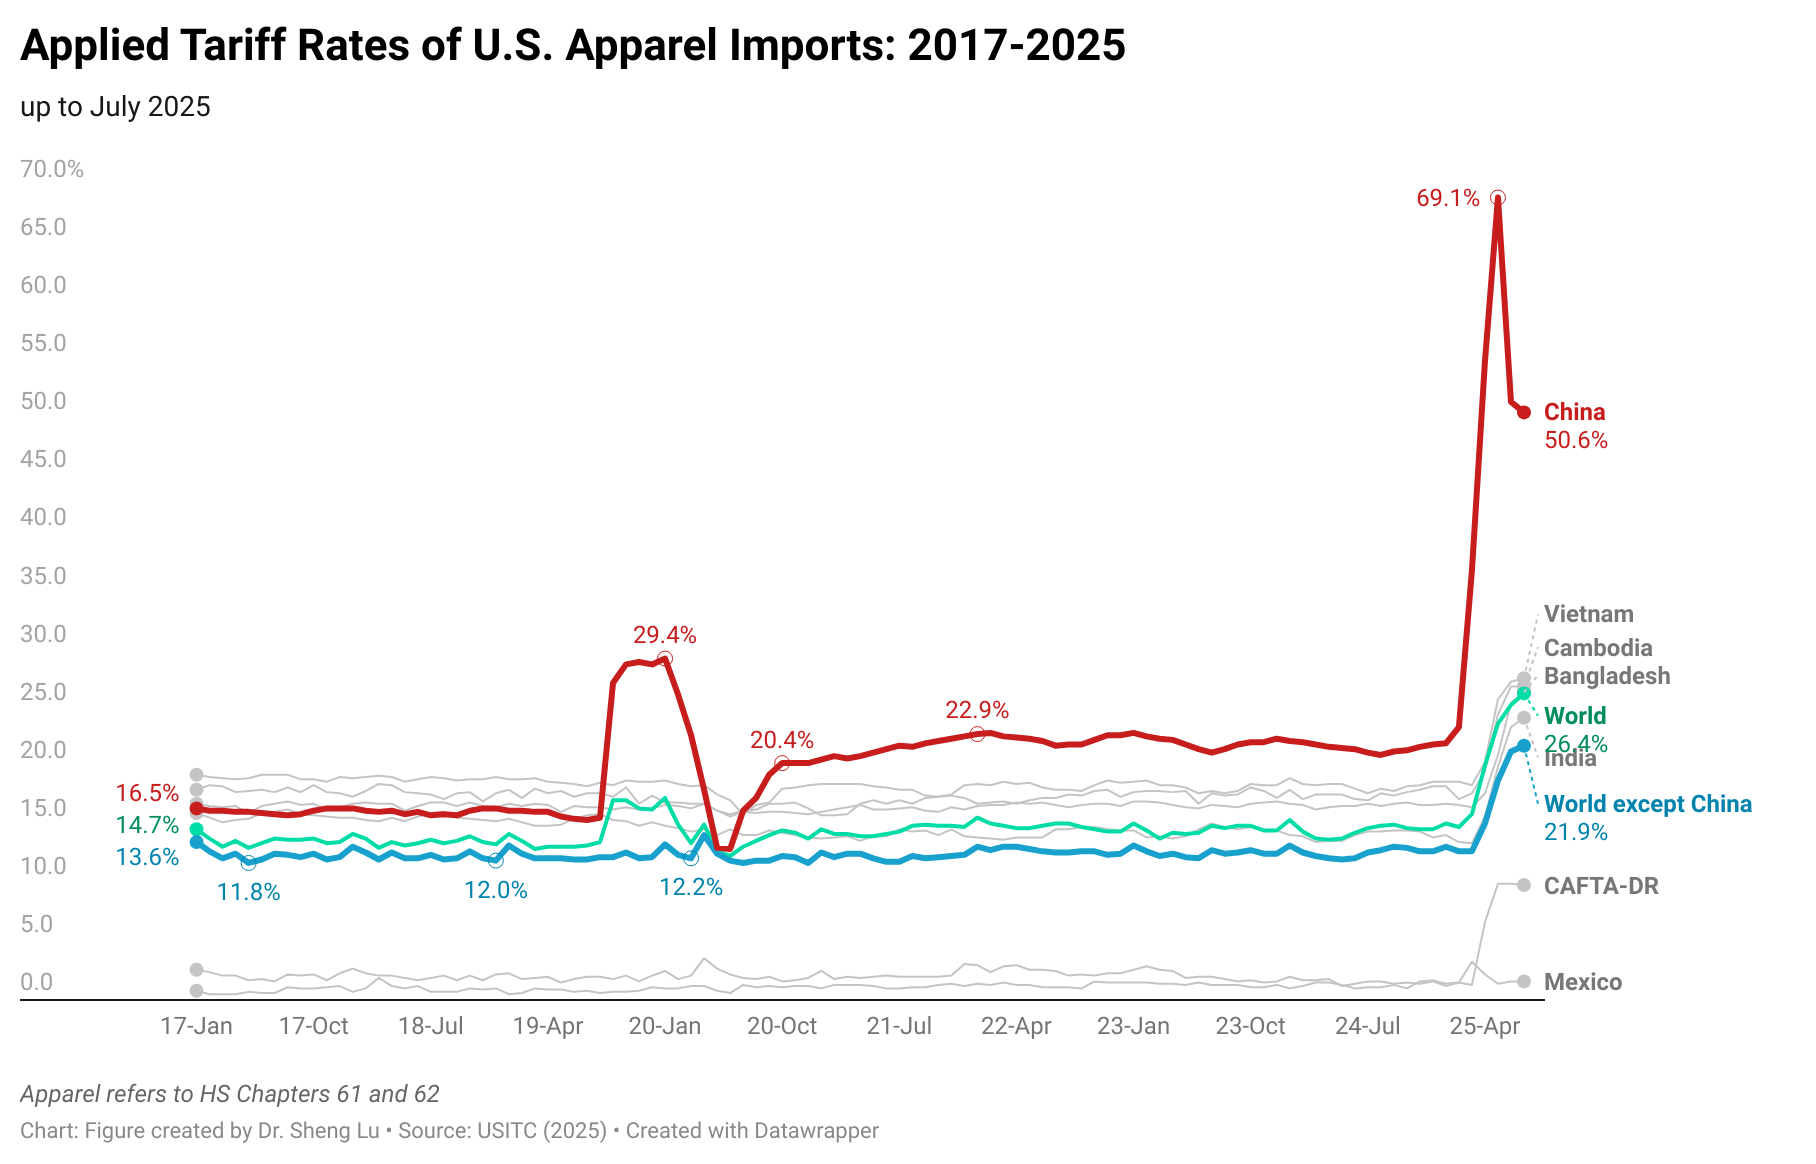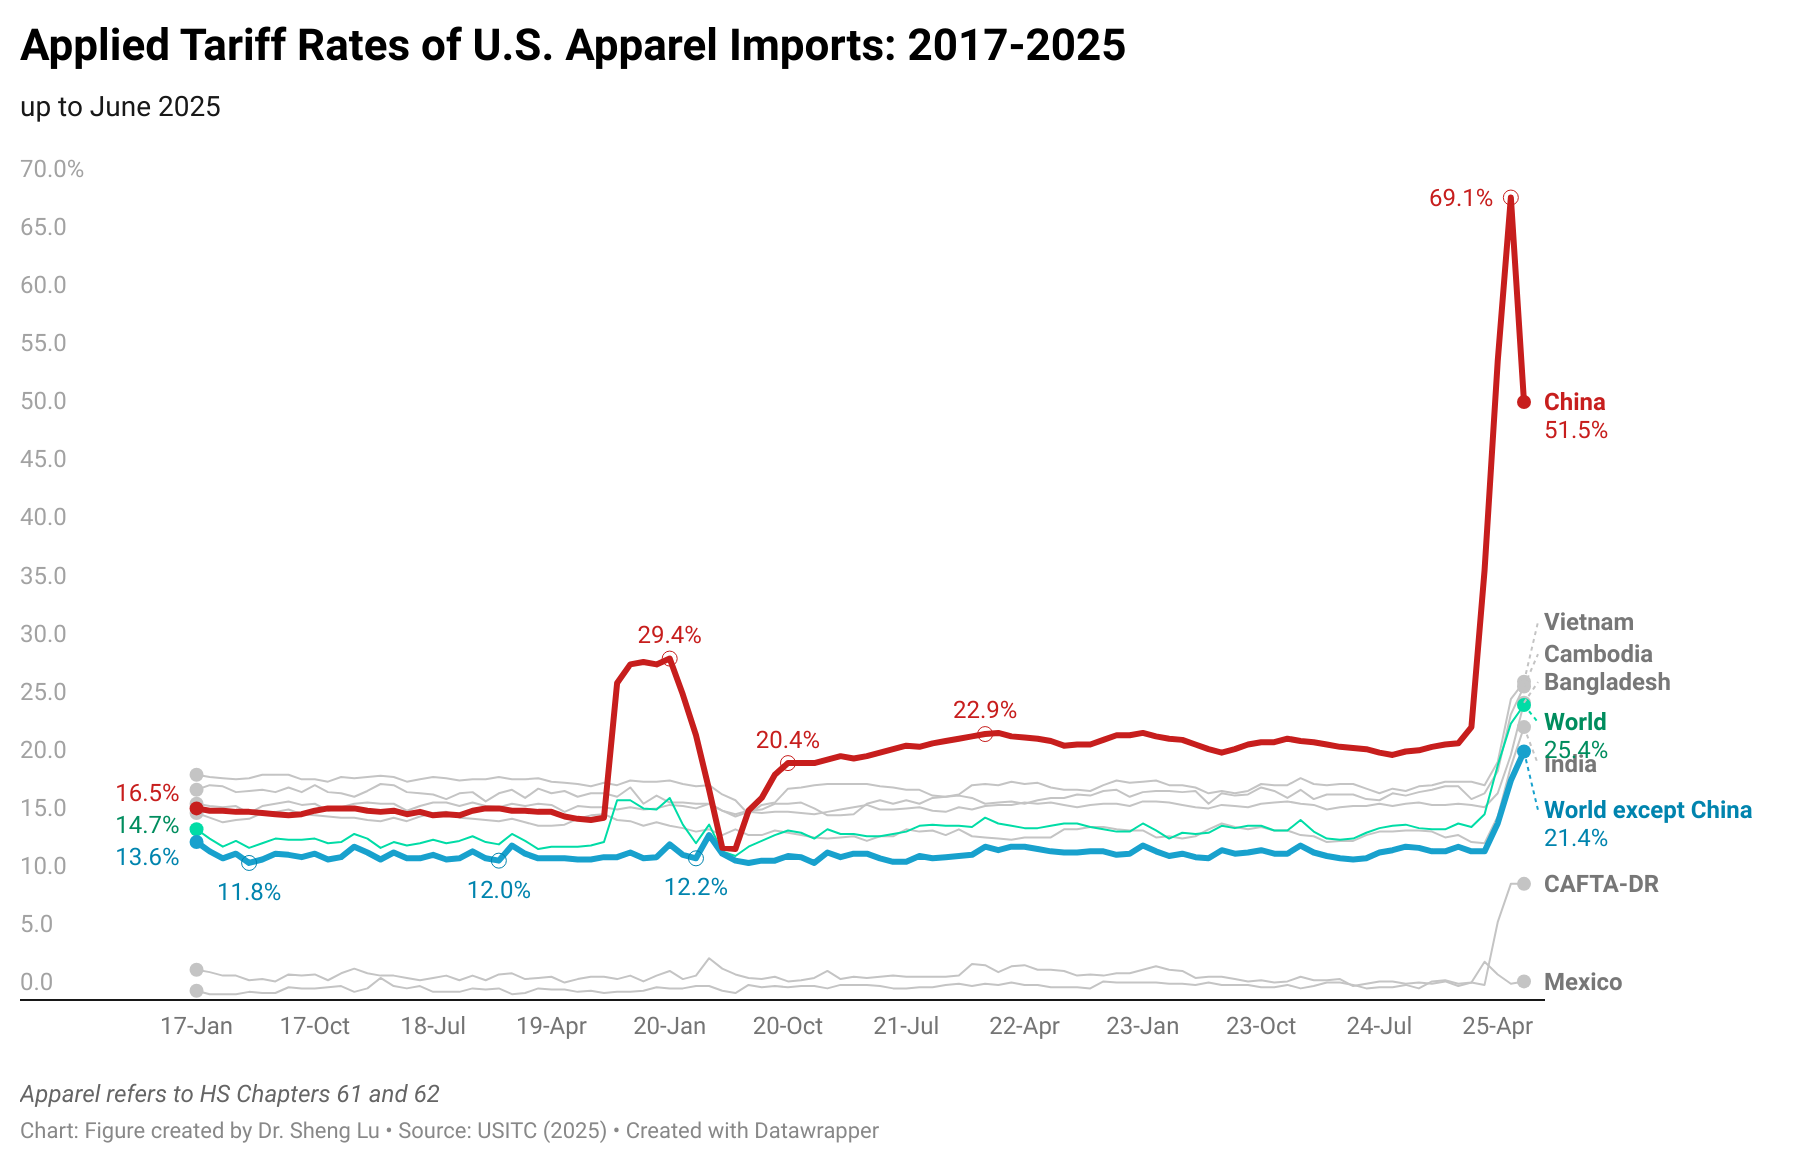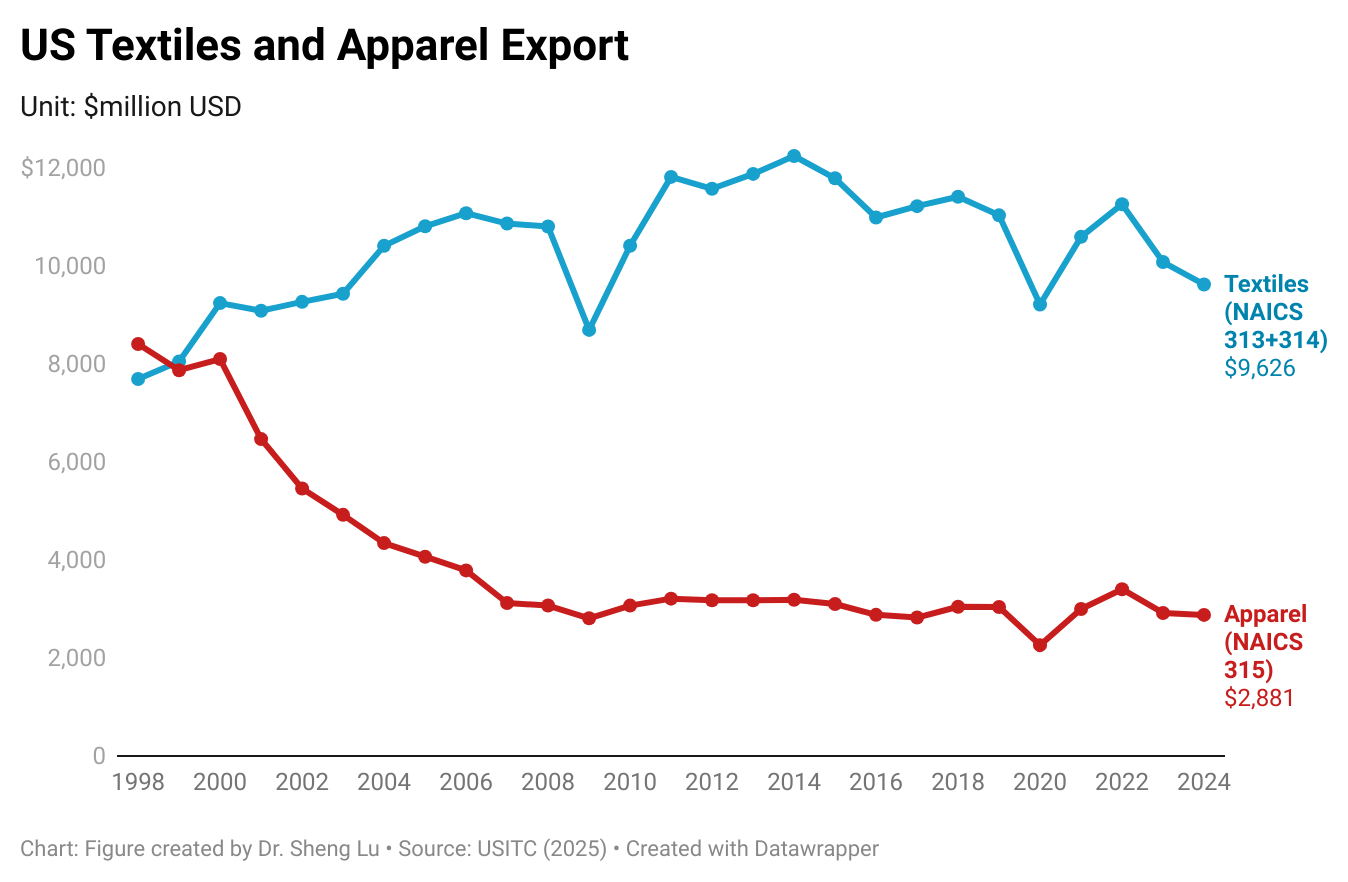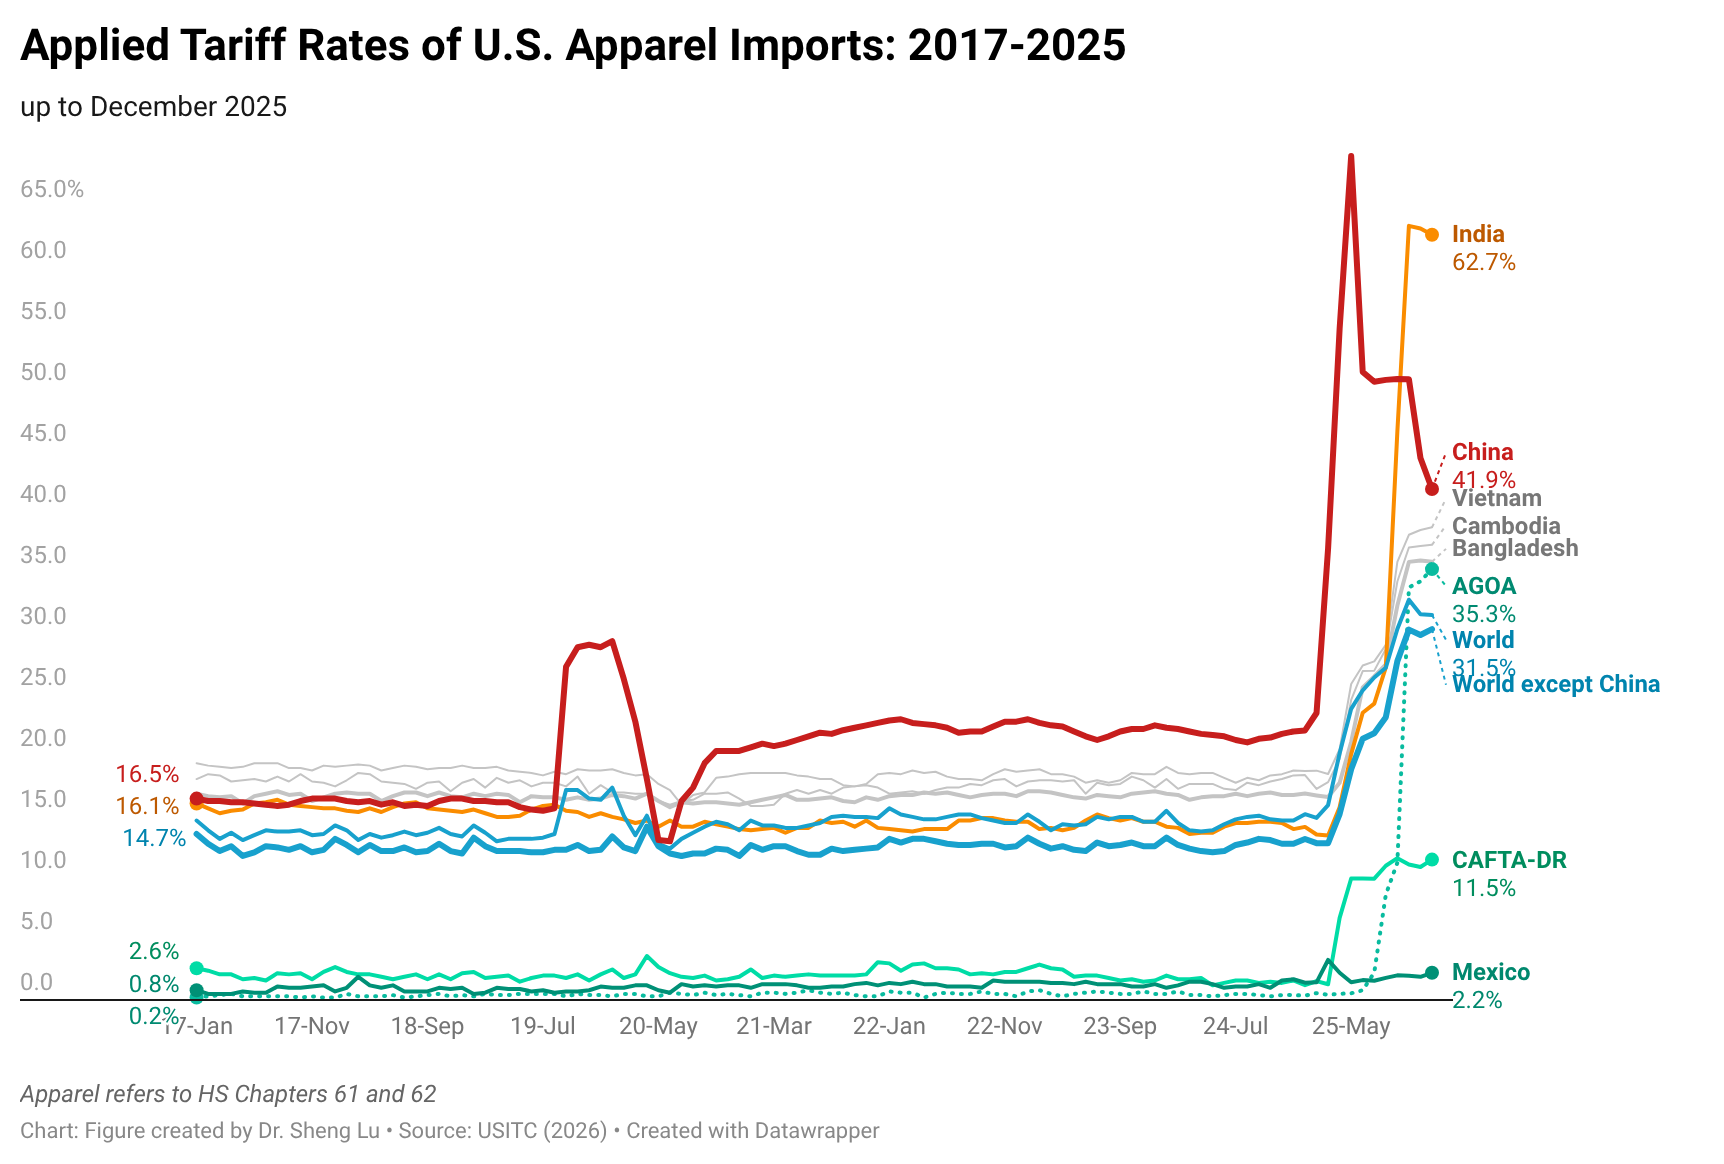
The average tariff rate for U.S. apparel imports (HS Chapters 61 and 62) reached 35.1% in December 2025, hitting a new high in decades and a sharp rise from 14.7% in January 2025, before President Trump’s second term. According to statistics from the Office of Textiles and Apparel (OTEXA), the U.S. International Trade Commission (USITC), and other government agencies, the hiking of tariffs and associated policy uncertainty has affected U.S. apparel sourcing and trade in multiple ways. [click here for detailed tariff data]
Impacts on apparel import price
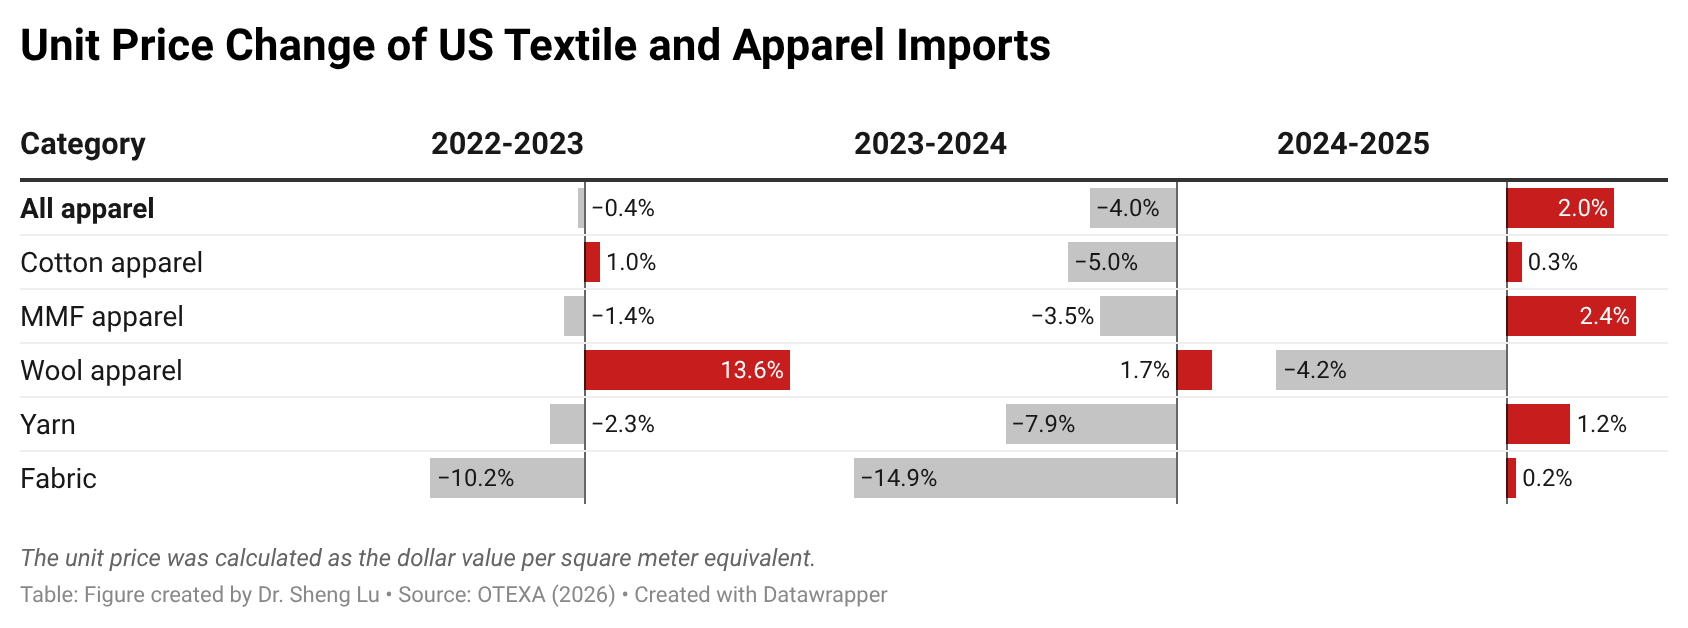
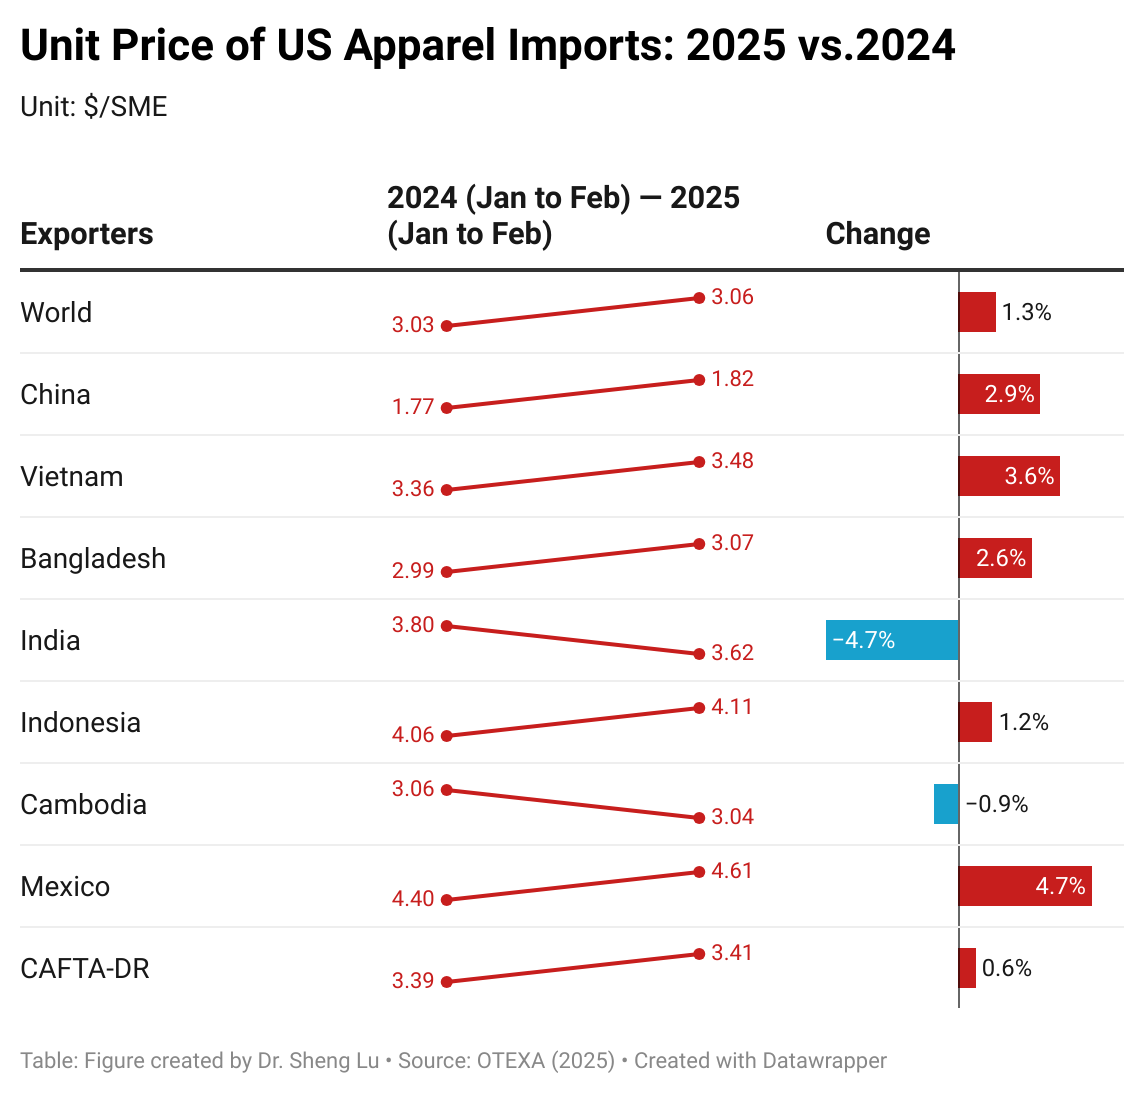
Apparel sourcing cost pressure increased in 2025, although price changes varied by fiber type. Data from OTEXA shows that, measured in dollars per square meter equivalent (SME), the unit price of US apparel imports increased from $3.08/SME in 2024 to $3.14/SME in 2025, a 2% year-over-year increase. Notably, due to an overall downward trend in world cotton prices, the unit price of US cotton apparel imports was almost flat in 2025, after a 5% decline in 2024.
In contrast, amid ongoing geopolitical tensions and rising oil prices, the unit price of US man-made fiber (MMF) apparel imports increased more noticeably by 2.4% in 2025. Still, in absolute terms, the unit price of US MMF apparel at $2.58/SME in 2025 was only about two-thirds of the price of cotton apparel at $3.59/SME.
Additionally, due to weaker demand for relatively more expensive clothing, the unit price of US wool apparel increased from $21.6/SME to only $20.68/SME, or down 4.2%.
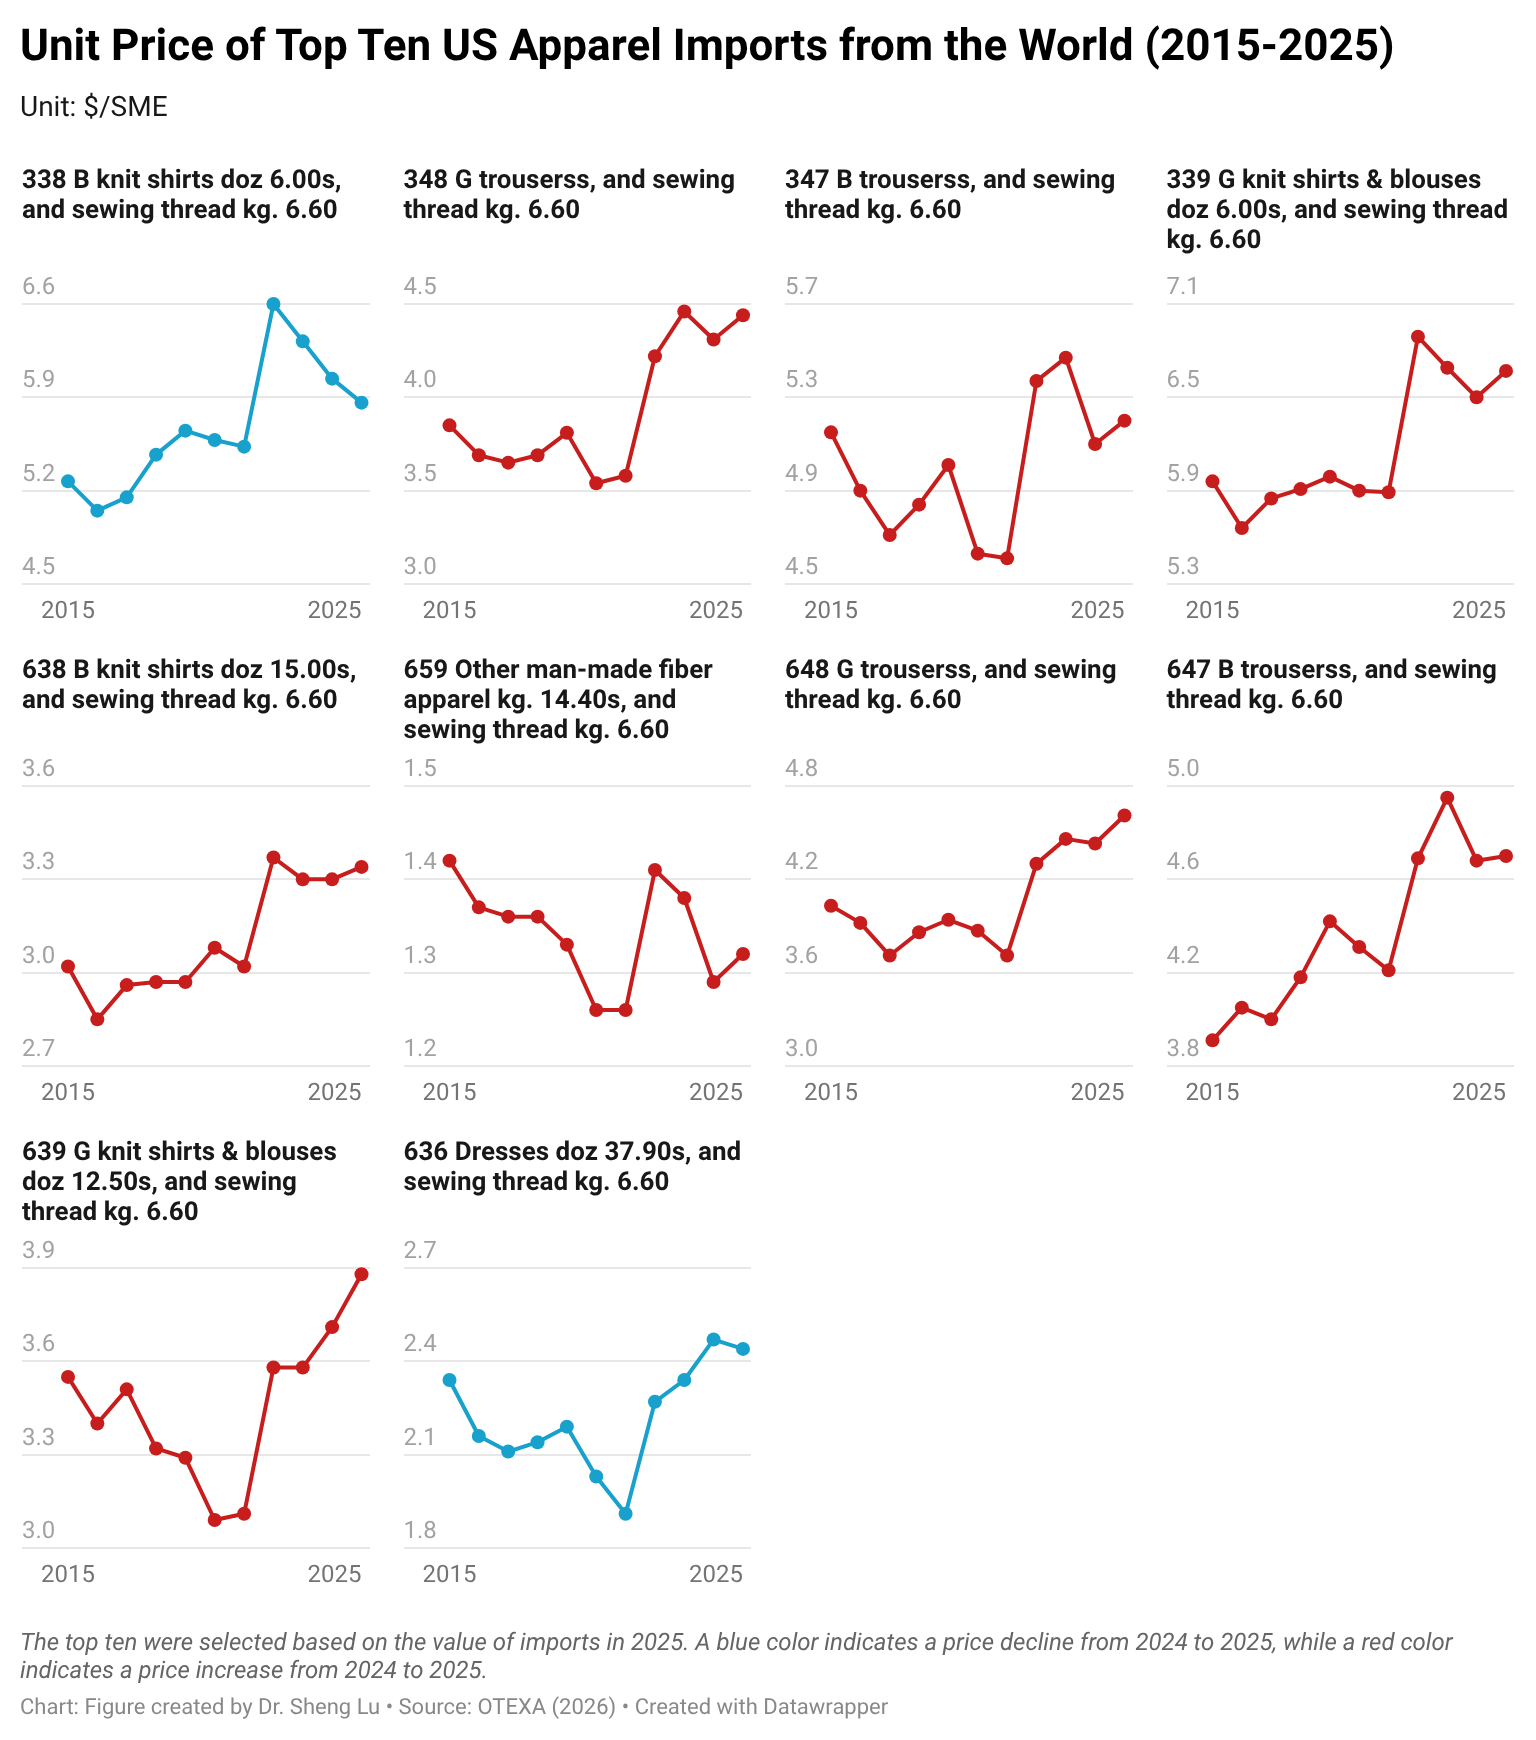
Amid higher tariffs, the unit import price for over half of the apparel import categories increased in 2025. Specifically, of the 106 apparel types categorized by OTEXA, 55 types (or 51.9%) saw a price increase between 2024 and 2025. This includes 22 categories (or 20.8%) with a price increase of more than 10 percent. Likewise, among the top ten largest apparel import categories by value in 2025, eight (80%) experienced price increases between 2024 and 2025, with an average increase of 2.5%. This result suggests that the upward price pressure was embedded in core, high-volume products rather than niche items. Particularly, as fashion companies navigate rising tariffs and policy uncertainty through more frequent adjustments to their original shipping schedules, it could increase their production and logistics costs more than usual. [Click here for detailed top ten U.S. apparel imports price data]
Impact on clothing retail price
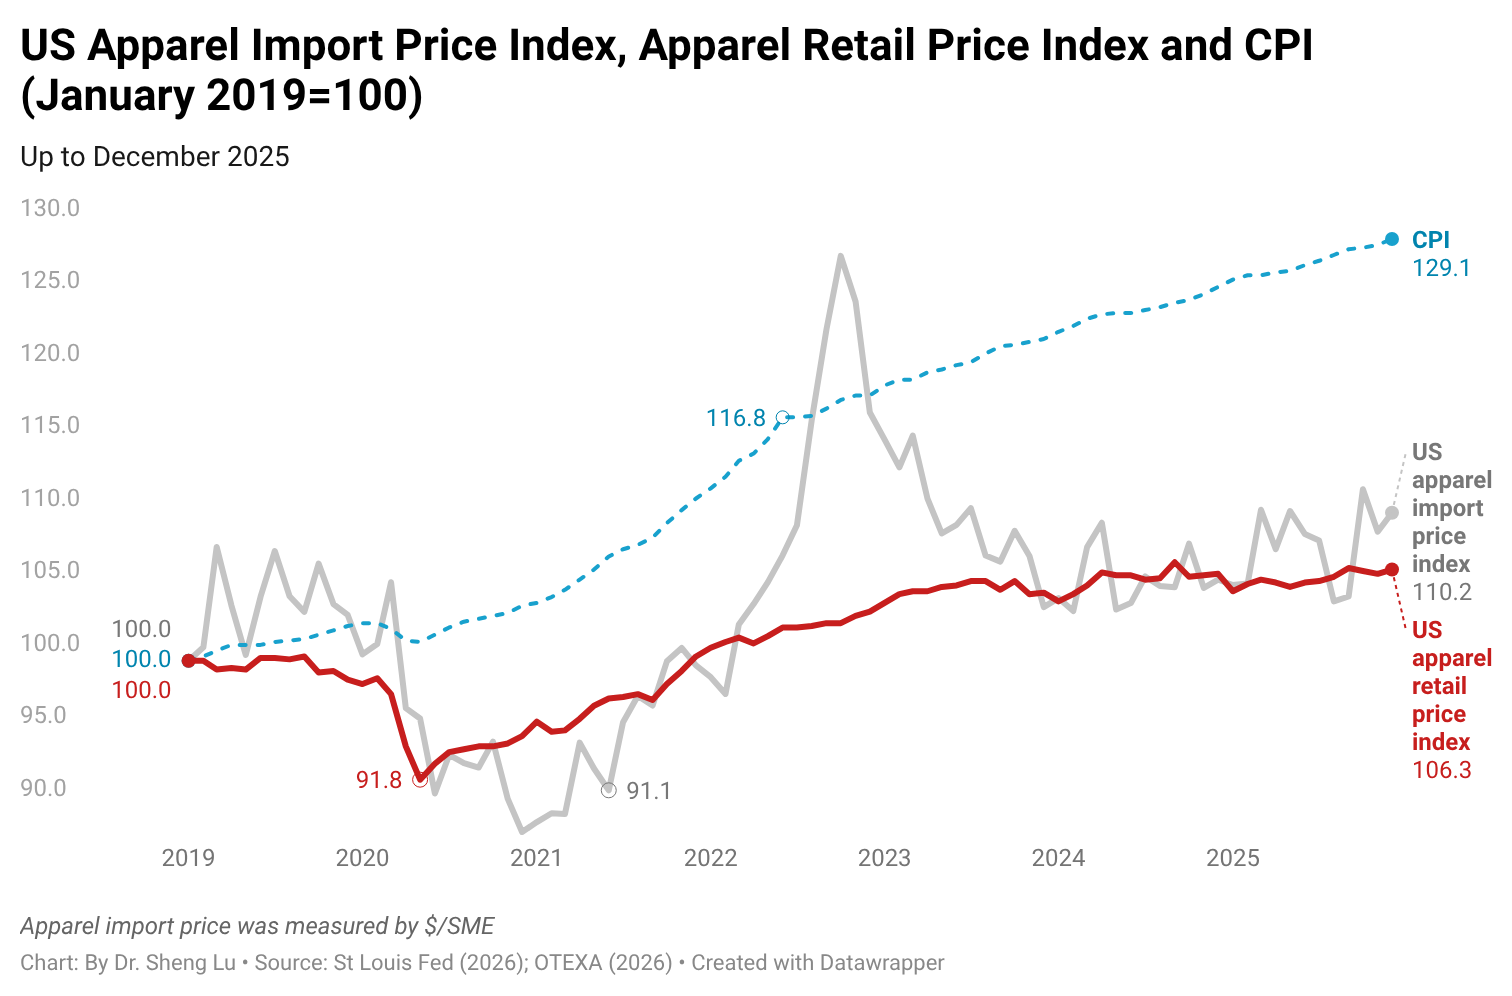
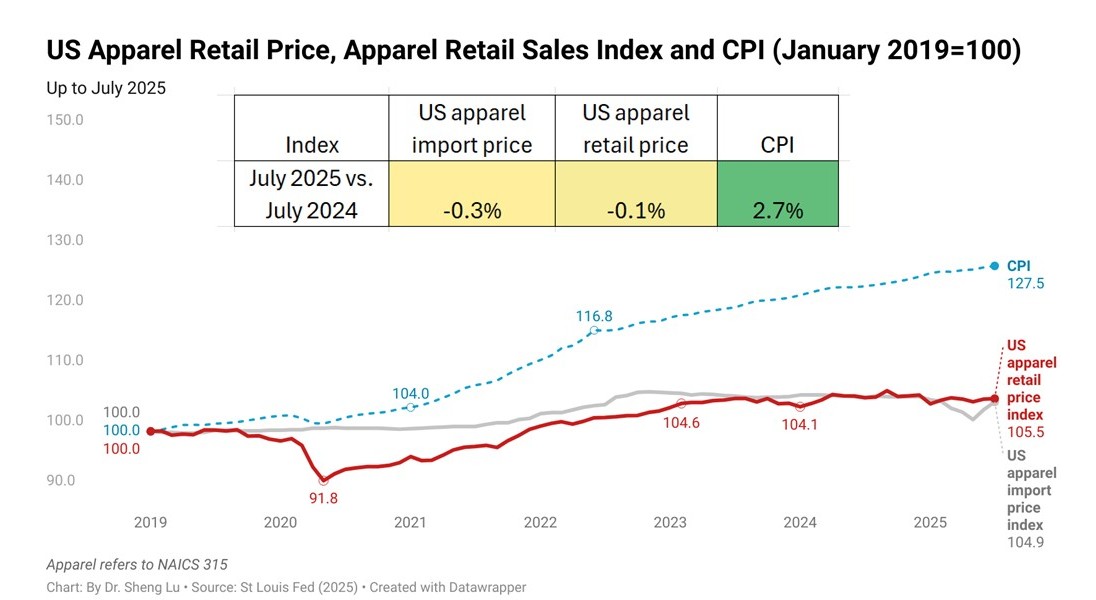
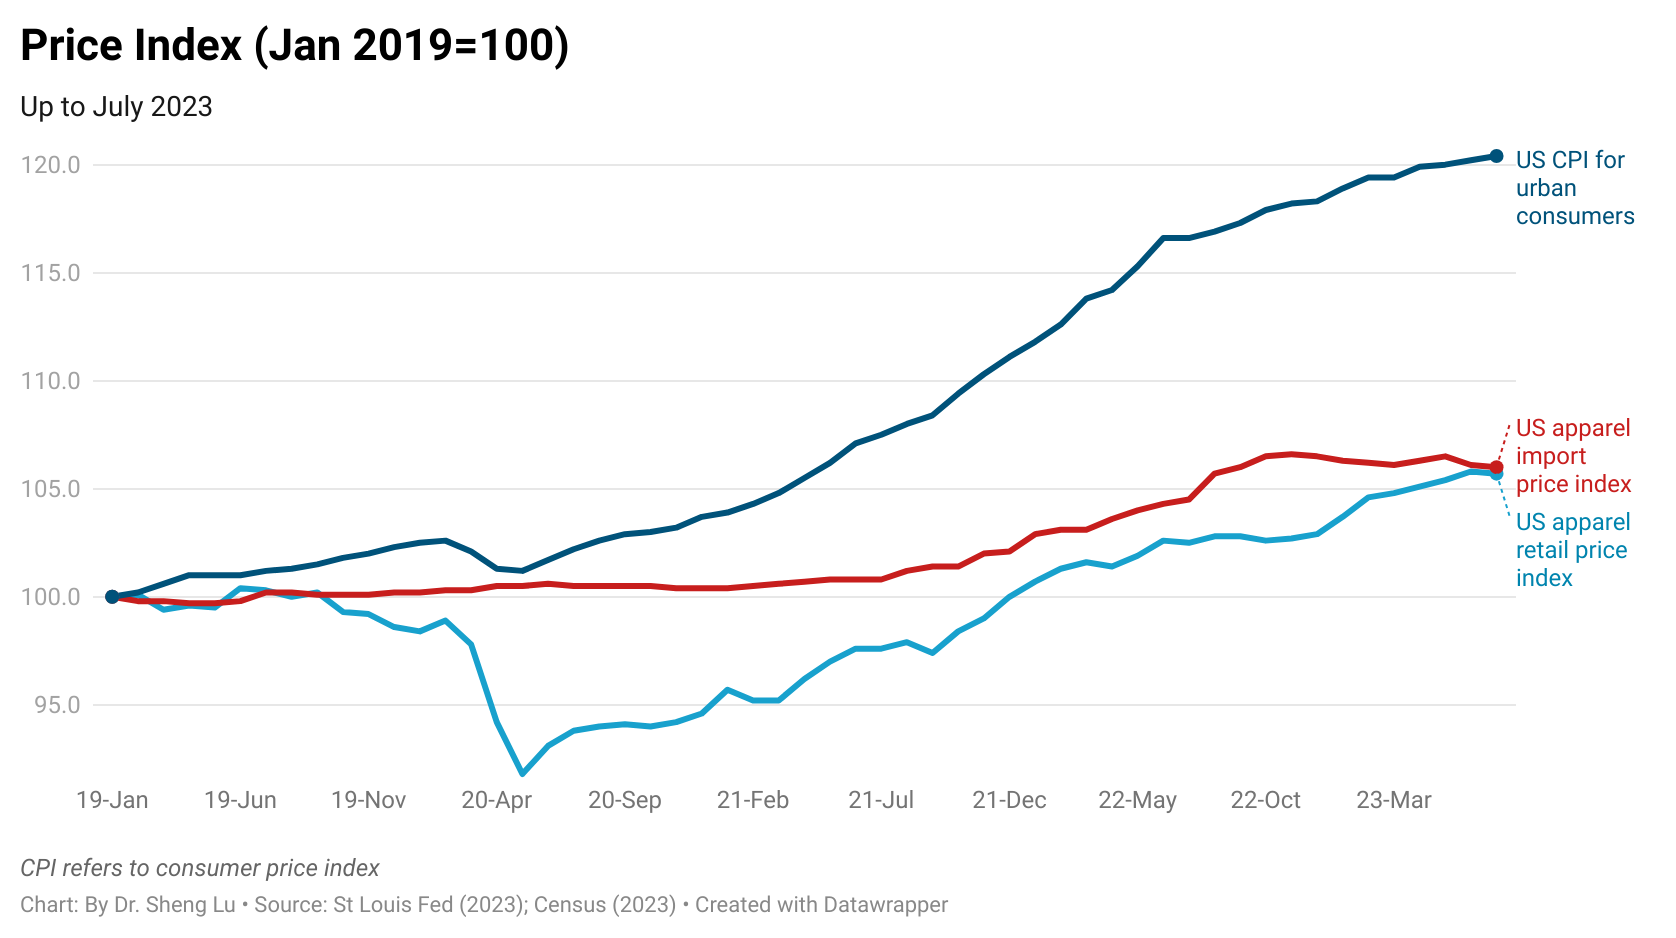
While the average U.S. apparel tariff rate rose from 14.7% in December 2024 to 31.5% in December 2025, the average U.S. clothing retail price increased only slightly by 0.3% during that time. This price rise was also much less than the 2.7% increase in the overall U.S. Consumer Price Index (CPI) during the same period. Since many apparel items are considered discretionary spending, higher inflation may lead consumers to reduce clothing purchases. [Click here for detailed U.S. apparel retail price index and CPI data]
Related, according to the Bureau of Economic Analysis (BEA), apparel accounted for 2.08% of U.S. consumers’ total personal spending in 2025, down from 2.10% in 2023 and 2.23% in 2021. As apparel retailers struggled to increase prices, younger generations, such as Gen Z, have turned to the secondhand clothing market.
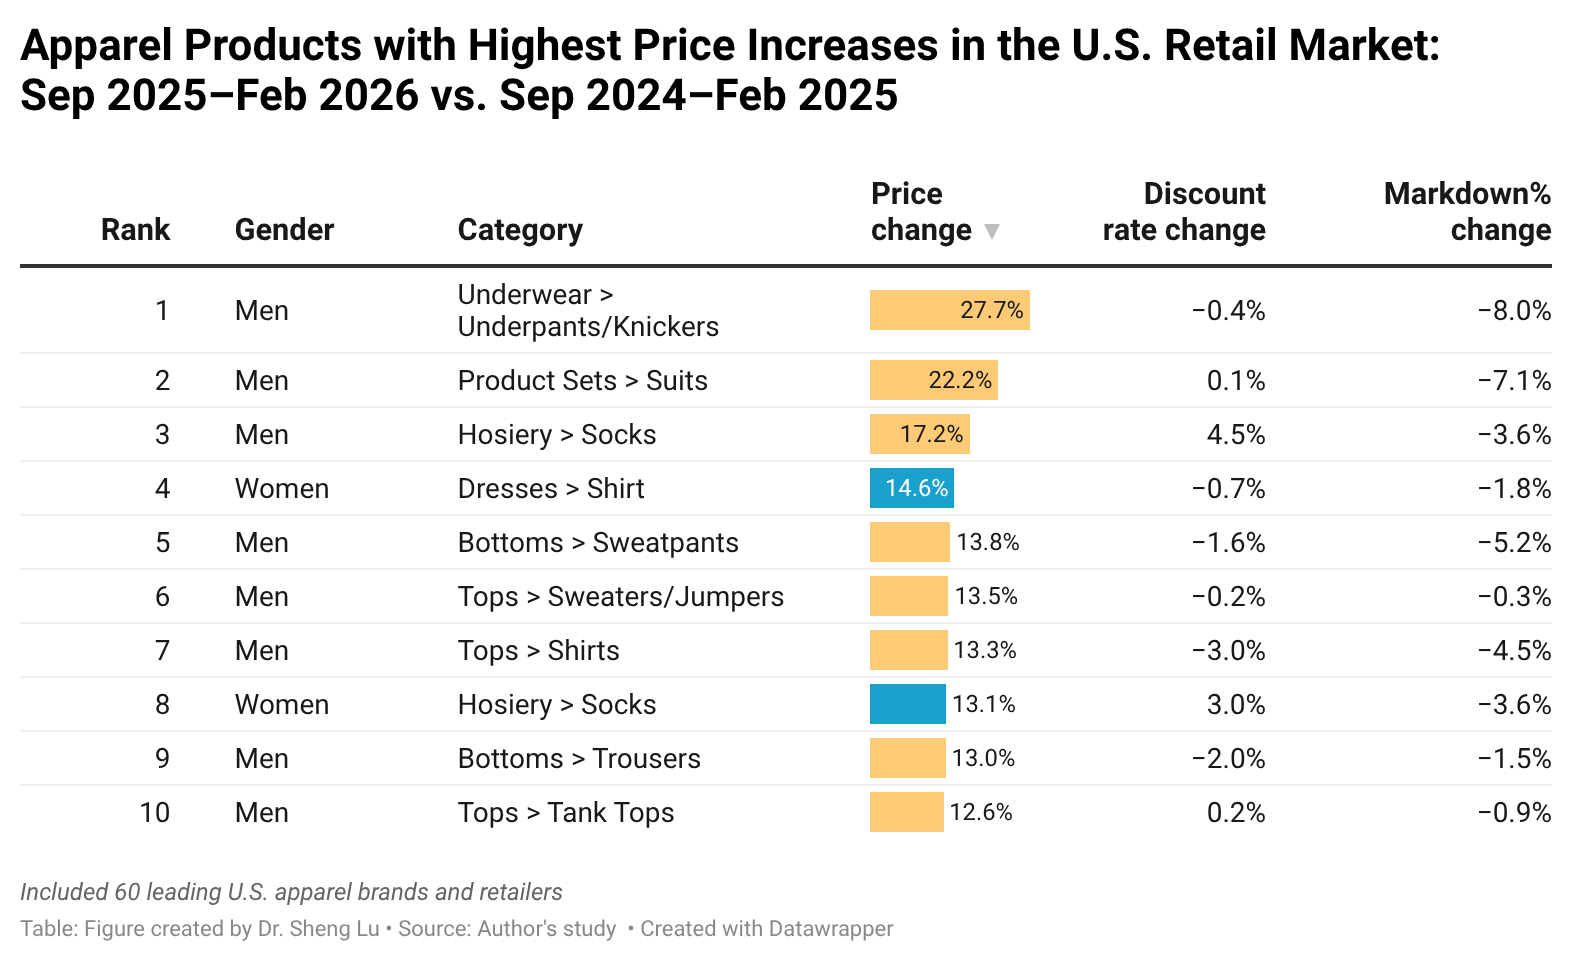
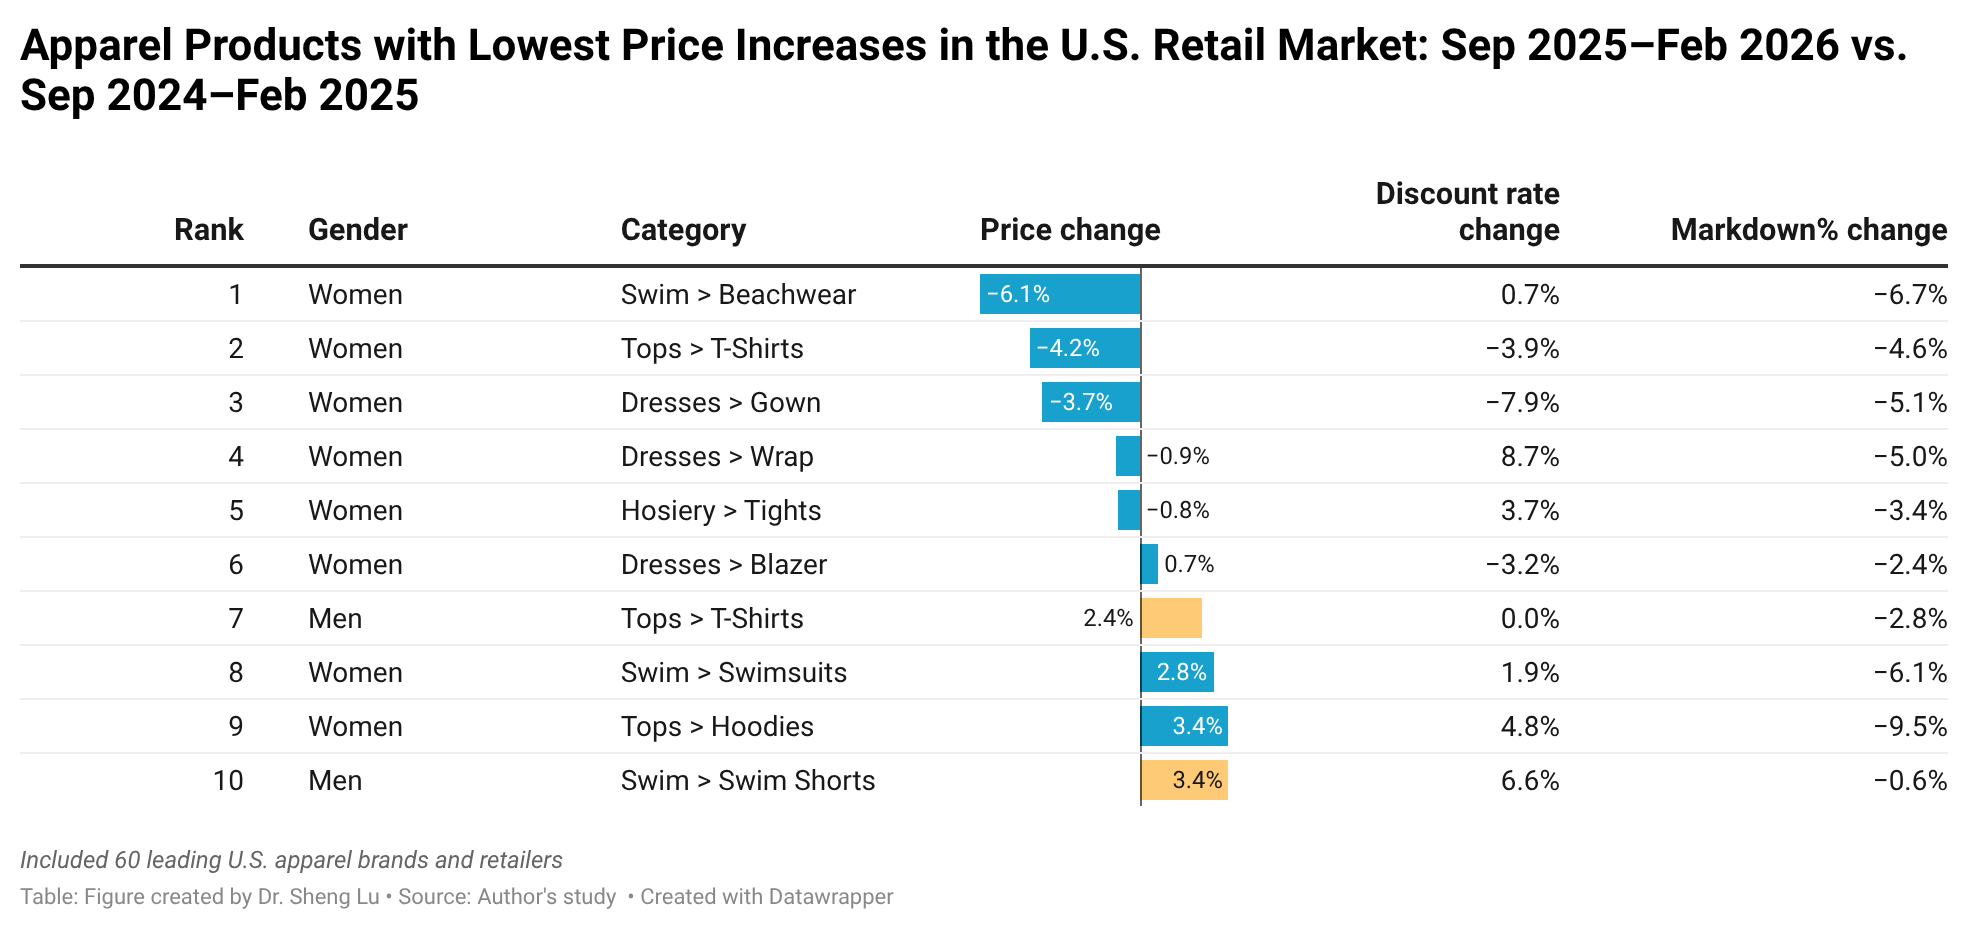
Additionally, data collected from industry sources show that the average retail price for necessities (e.g., men’s underwear) experienced the highest increase during September 2025 and February 2026 compared with the same period a year earlier (i.e., September 2024 and February 2025). In comparison, discretionary spending items such as women’s swimwear and dresses, as well as products with near-shoring opportunity (i.e., T-shirts), experienced the smallest increase over the same period.
Impact on fiber usage and sourcing base
The U.S. tariff rates not only vary by sourcing origin but also by fiber composition. Generally, apparel made with cotton fibers will face a lower tariff rate (i.e., around 8-16% Most-favored-Nation, MFN tariff rates) than apparel made only from man-made fibers (i.e., around 16-32% MFN tariff rates).
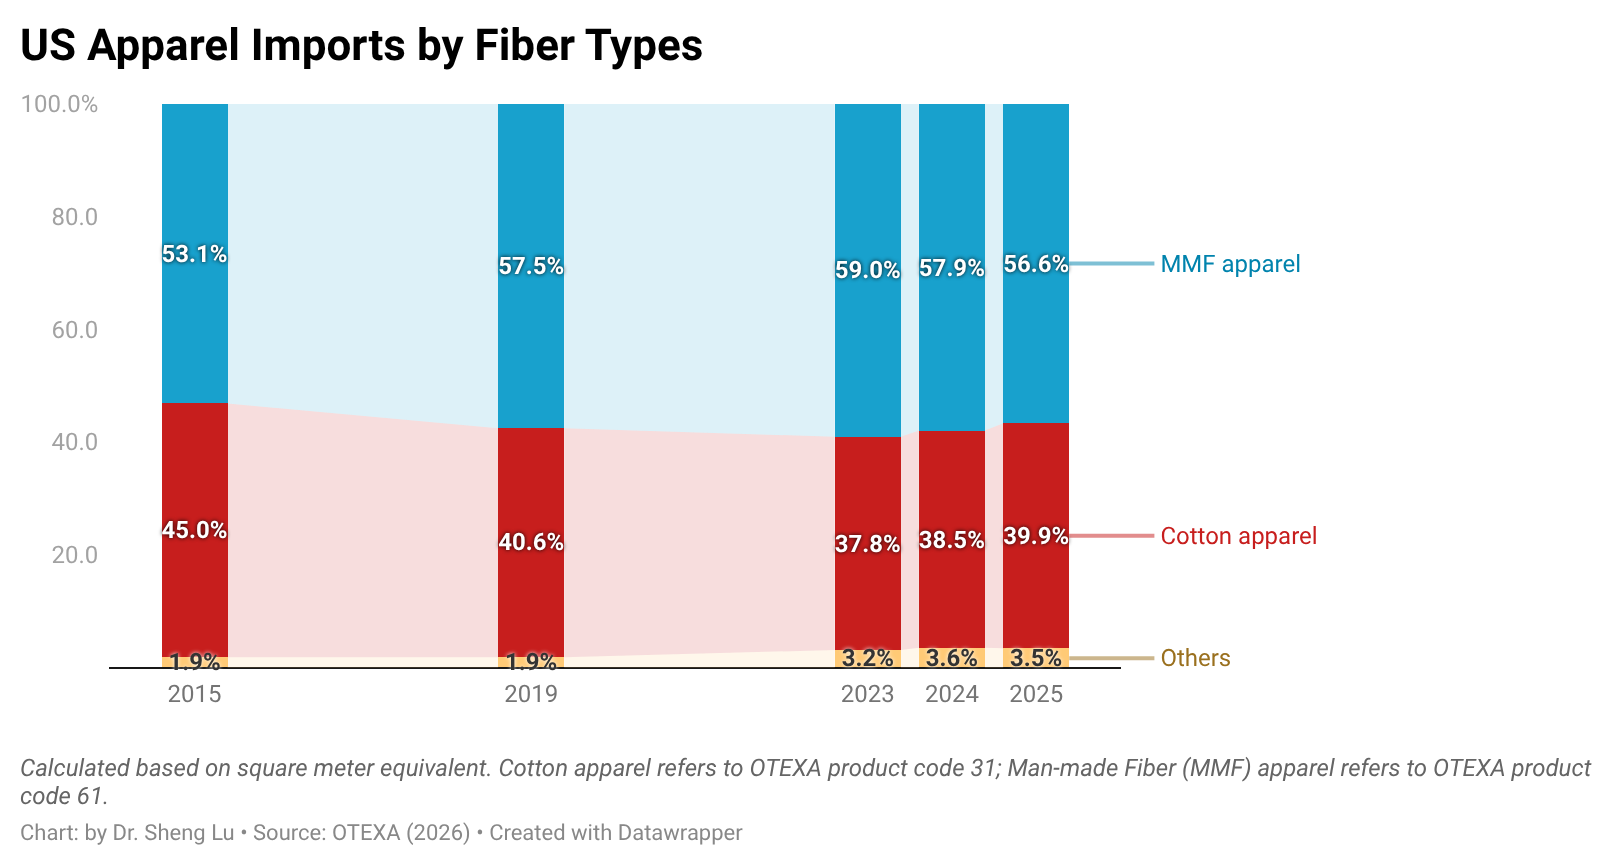
As U.S. fashion companies leverage “tariff engineering” to mitigate the import duty increase, U.S. apparel imports in 2025 included more cotton apparel and fewer of those made from man-made fiber (MMF). Specifically, measured by quantity, cotton apparel (OTEXA category 31) accounted for 39.9% of total US apparel imports in 2025, higher than 38.5% in 2024 and 37.8% in 2023. In comparison, man-made fiber (MMF) apparel accounted for 56.6% of total U.S. apparel imports in 2025, a noticeable decline from 57.9% in 2024 and 59% in 2023. [Click here for detailed U.S. apparel imports by fiber content data]
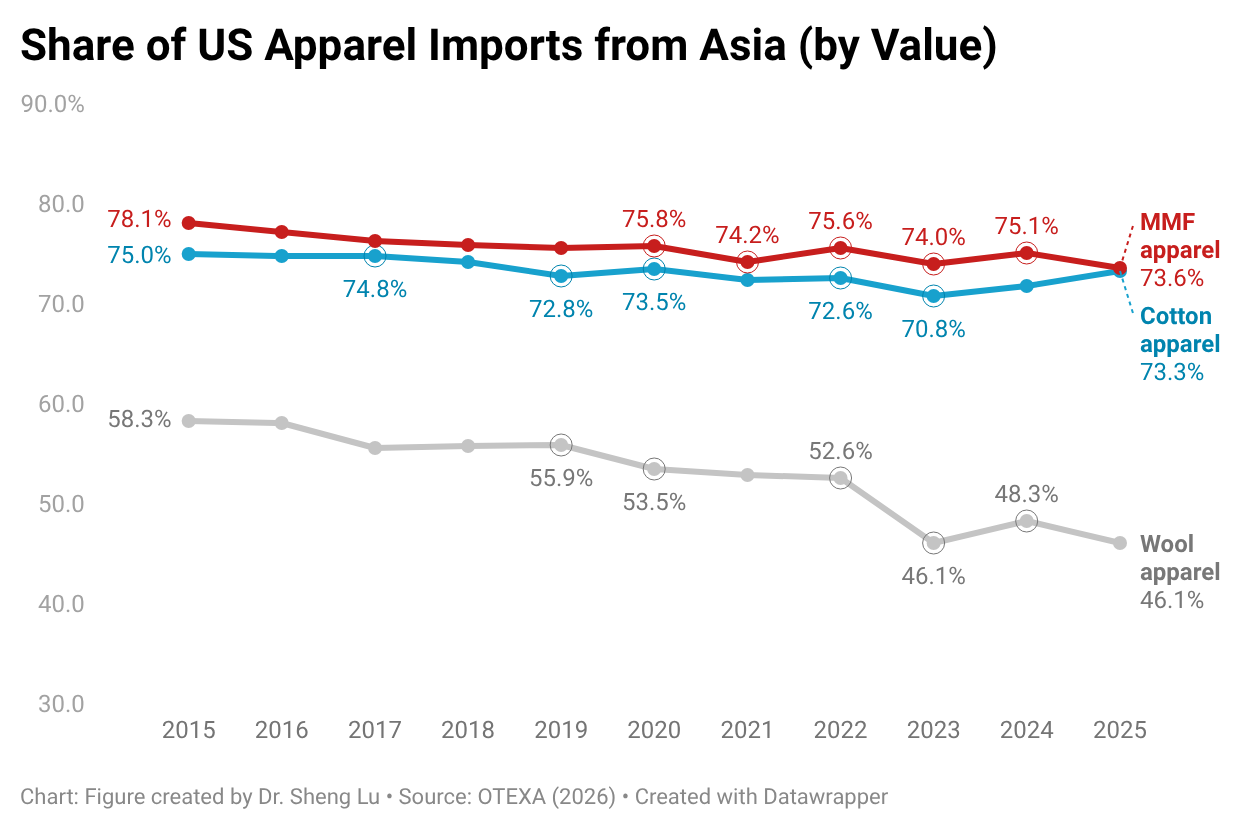
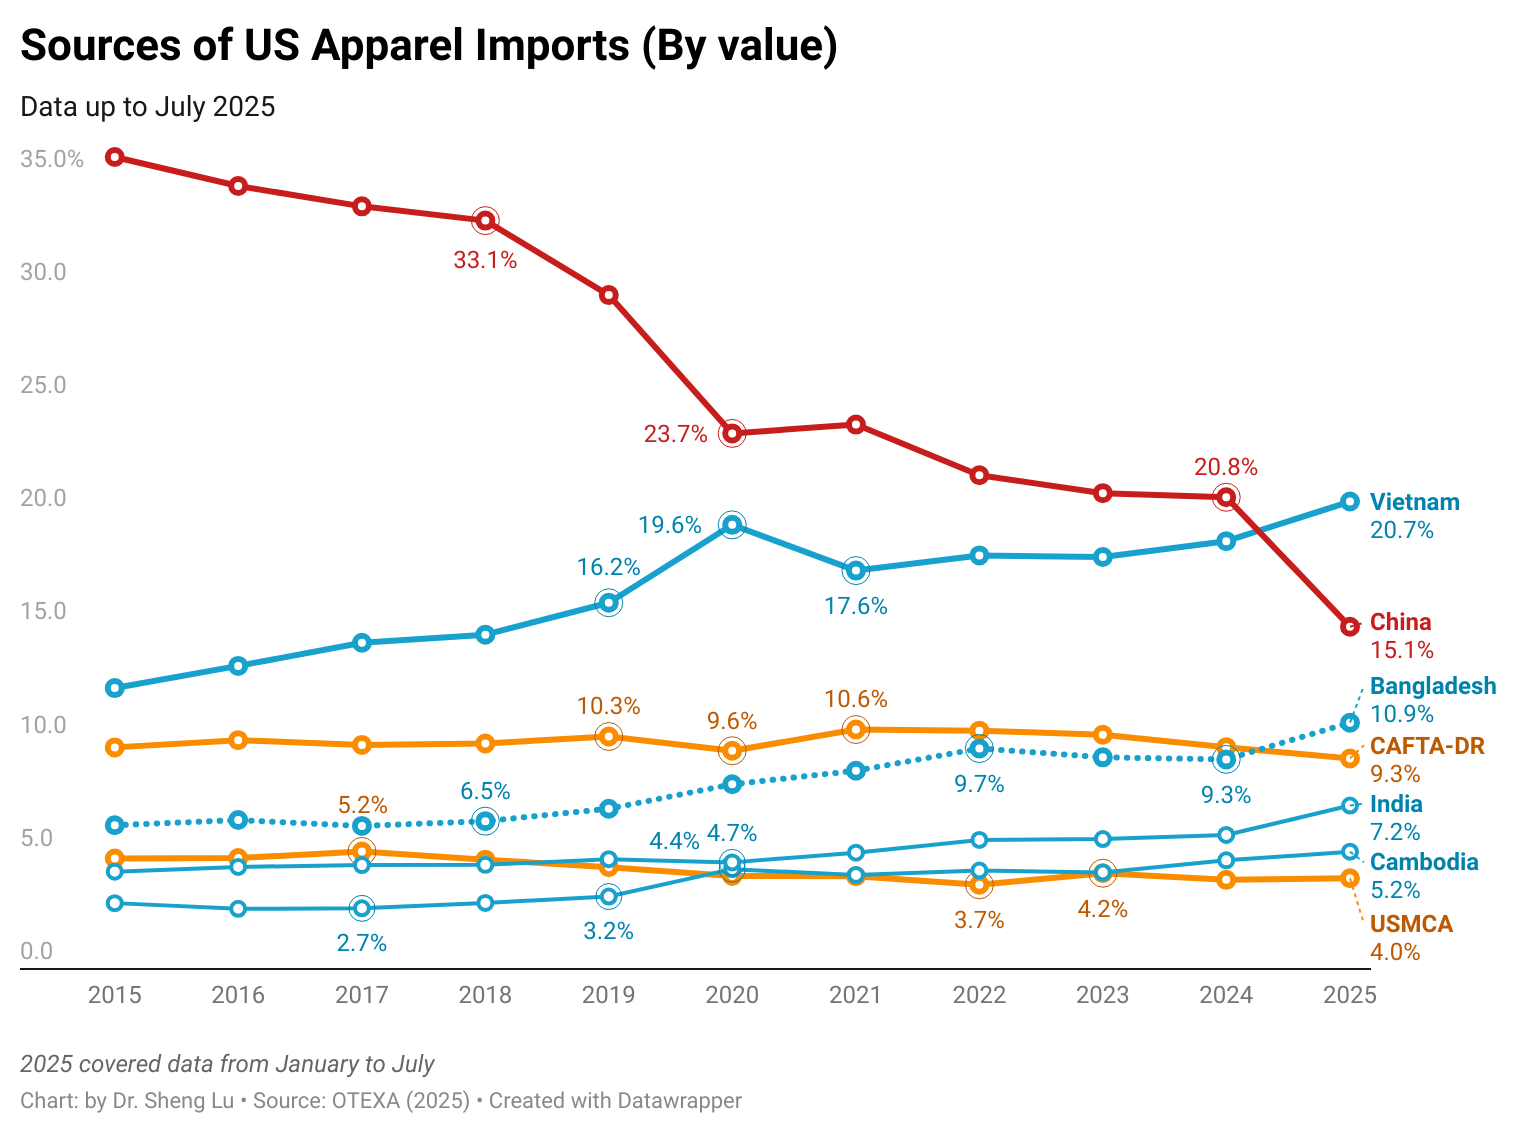
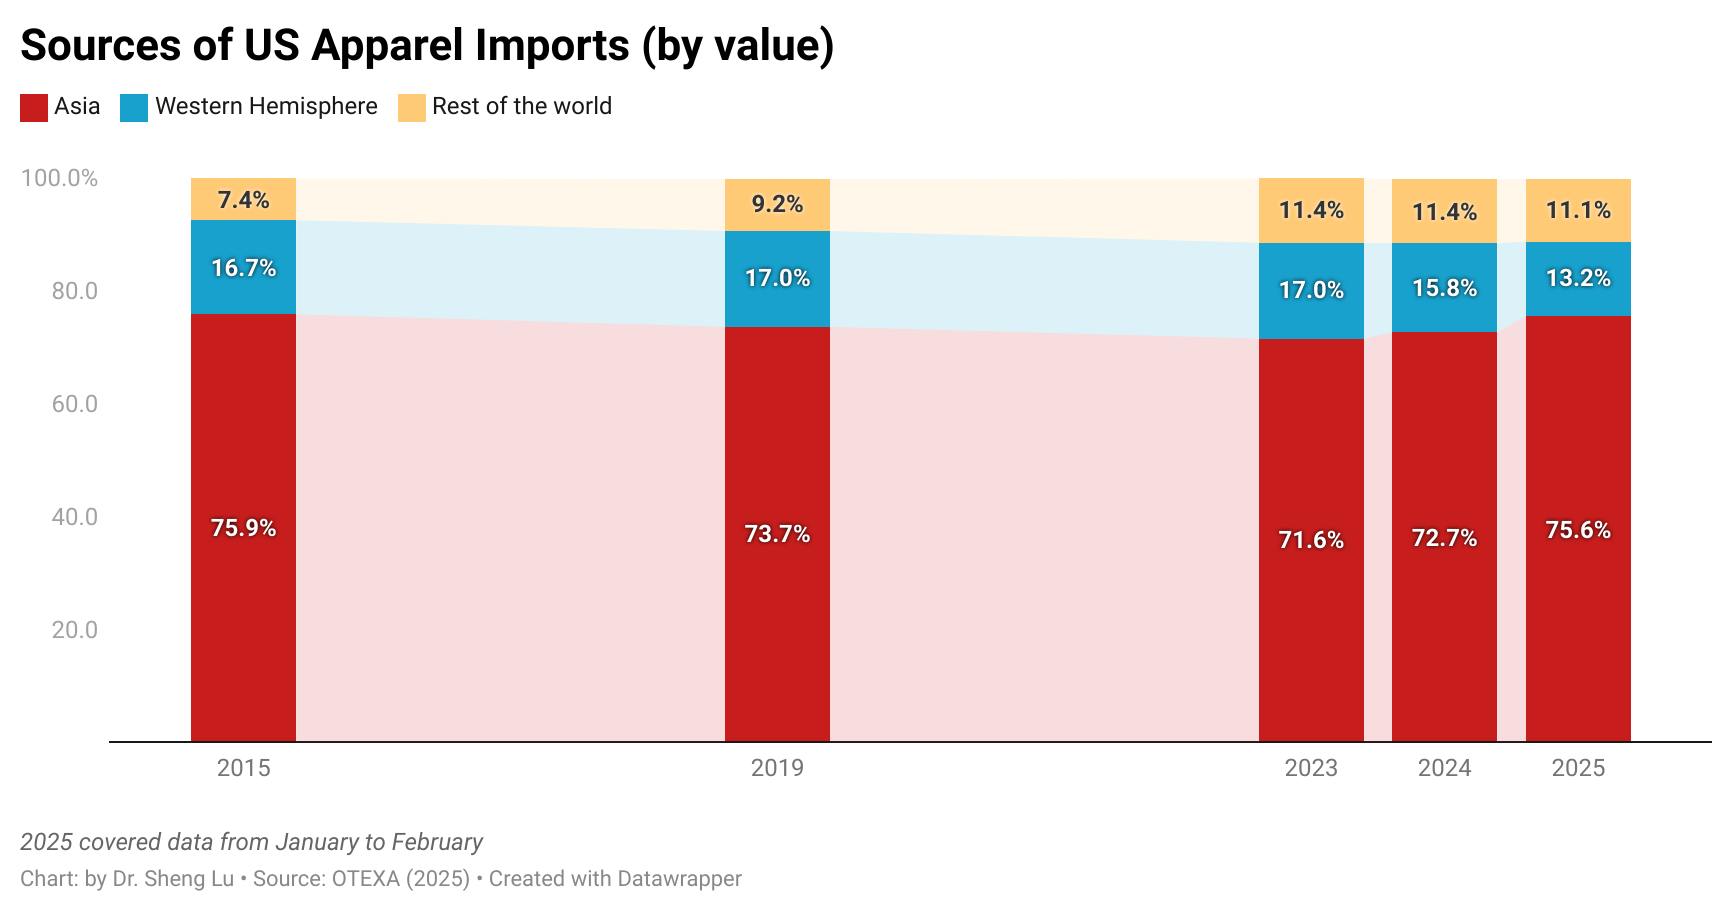
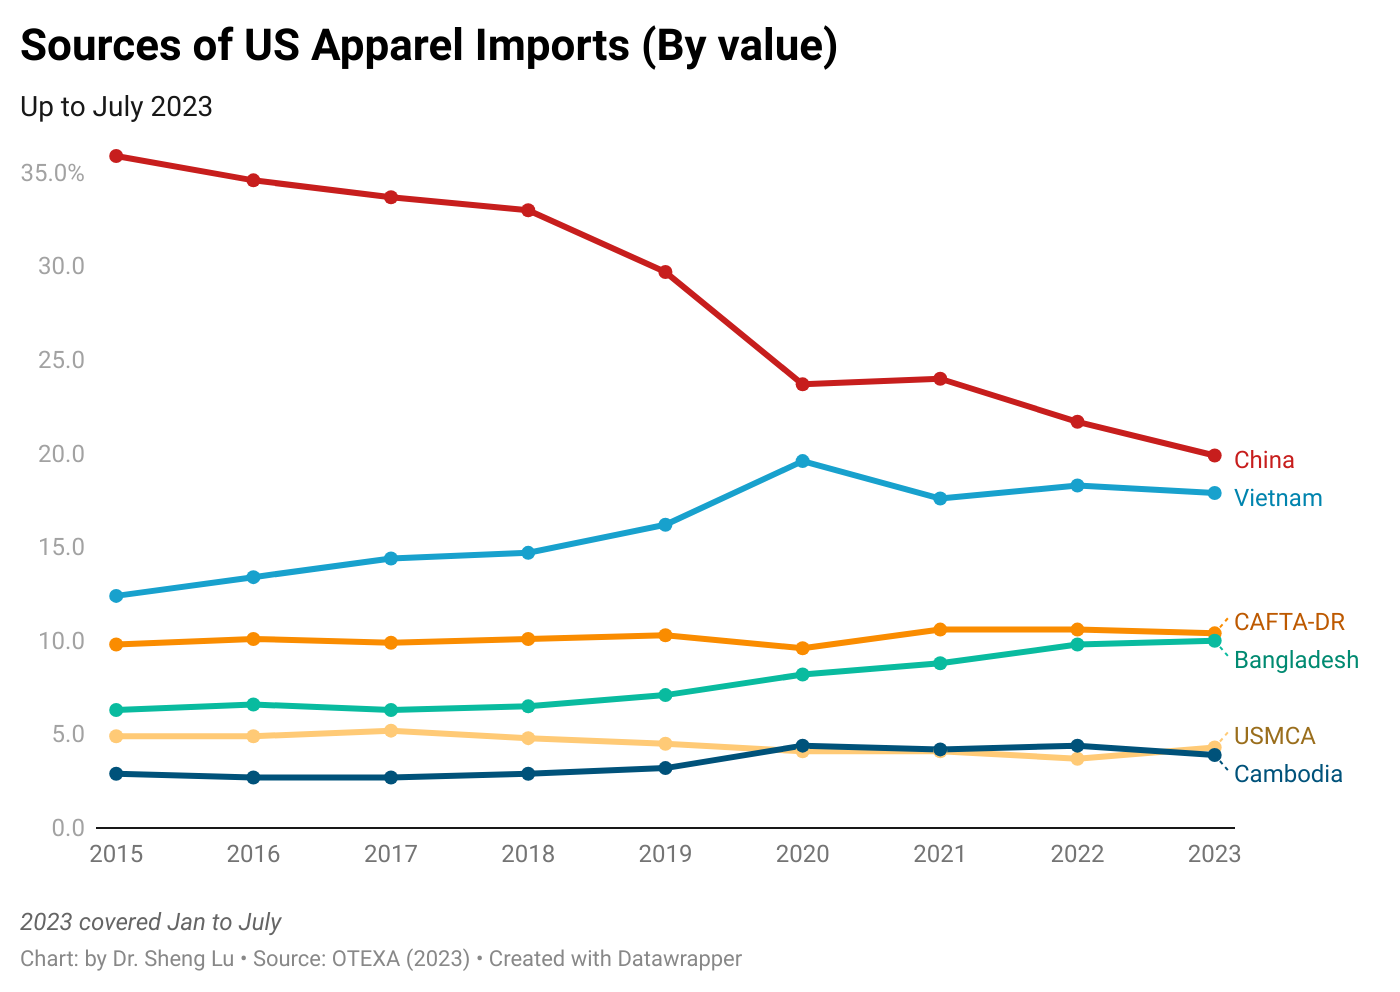
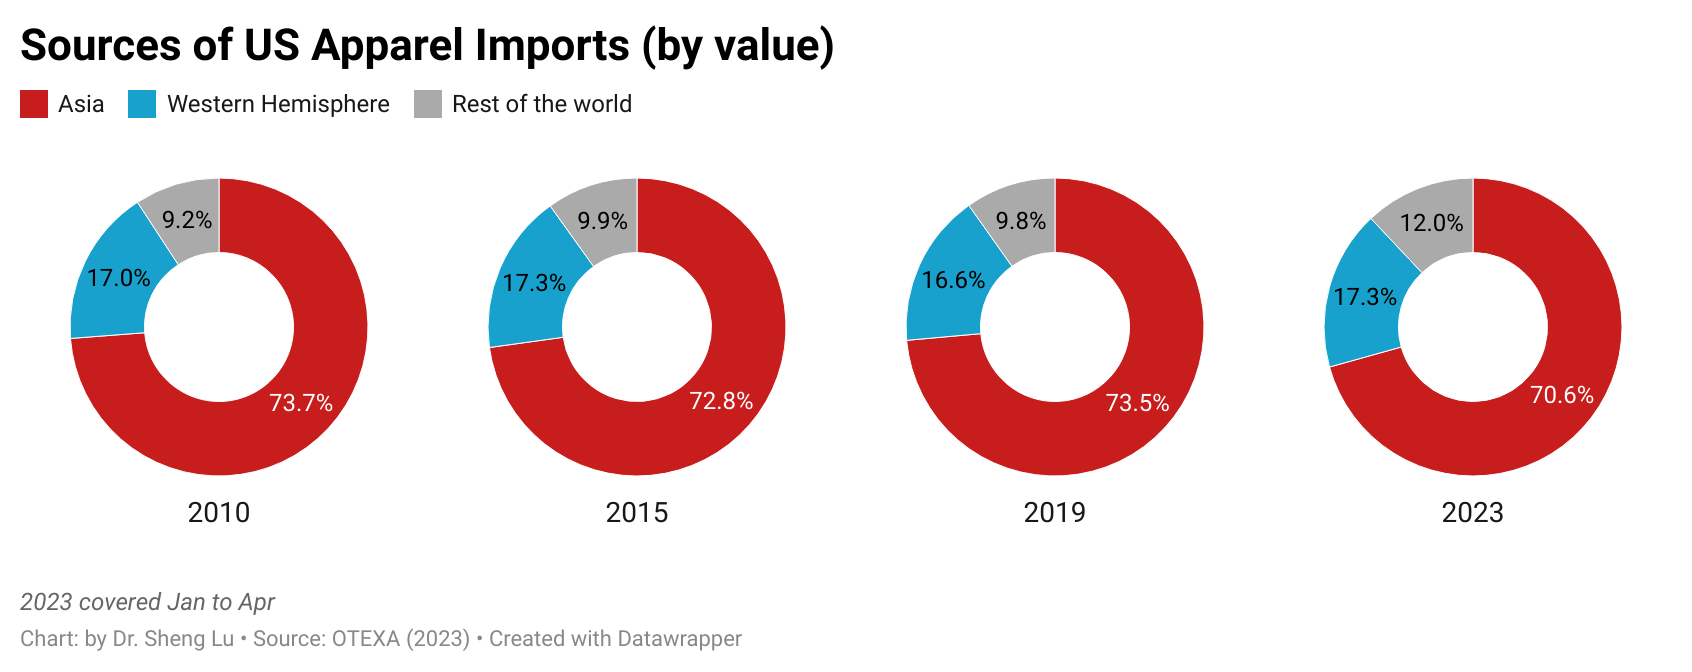
Furthermore, while Asian countries had demonstrated greater competitiveness in man-made fiber (MMF) clothing, higher tariffs on such products in 2025 led U.S. fashion companies to source fewer MMF clothing from Asia. Notably, in value terms, 73.6% of U.S. MMF clothing came from Asia in 2025, a noticeable decline from 75.1% a year earlier. In comparison, 73.1% of U.S. cotton apparel imports came from Asia in 2025, up from 71.8% in 2024. [Click here for Asia market share data]
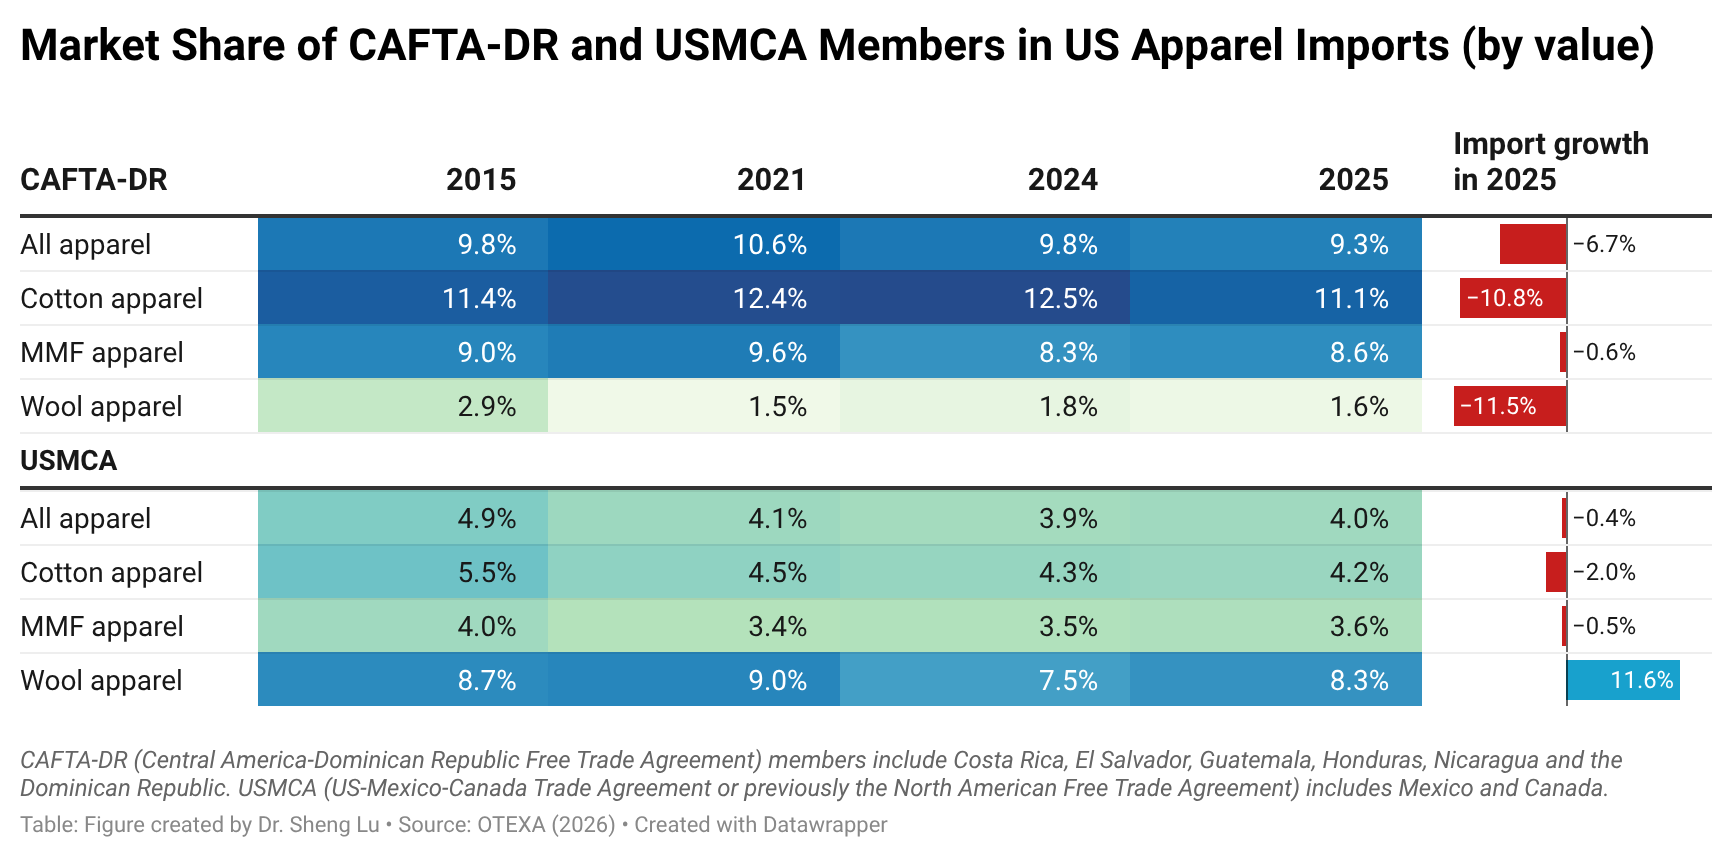
In comparison, it is interesting to note that while CAFTA-DR and USMCA members are perceived as more competitive in making and exporting cotton apparel products, due to tariff advantages, U.S. fashion companies import more man-made fiber (MMF) apparel from the regions in 2025. The same trend applied to wool apparel imports from the USMCA, which grew by 11.6%. These results suggest that if the tariff gap between U.S. apparel imports from CAFTA-DR and USMCA members and those from Asian countries continues in 2026, it may further incentivize U.S. fashion companies to explore additional MMF apparel sourcing opportunities in the Western Hemisphere. This incentive could be reinforced by the fact that, since February 2026, apparel imports from many Asian suppliers have been subject to the new Section 122 tariffs, while qualifying apparel products from CAFTA-DR and USMCA remain exempt. It may also represent a historic opportunity to expand investment in MMF textile manufacturing in CAFTA-DR and USMCA countries, thereby increasing regional production capacity and diversifying product offerings. [Click here for CAFTA-DR and USMCA market share data]
Impact on Free Trade Agreement utilization
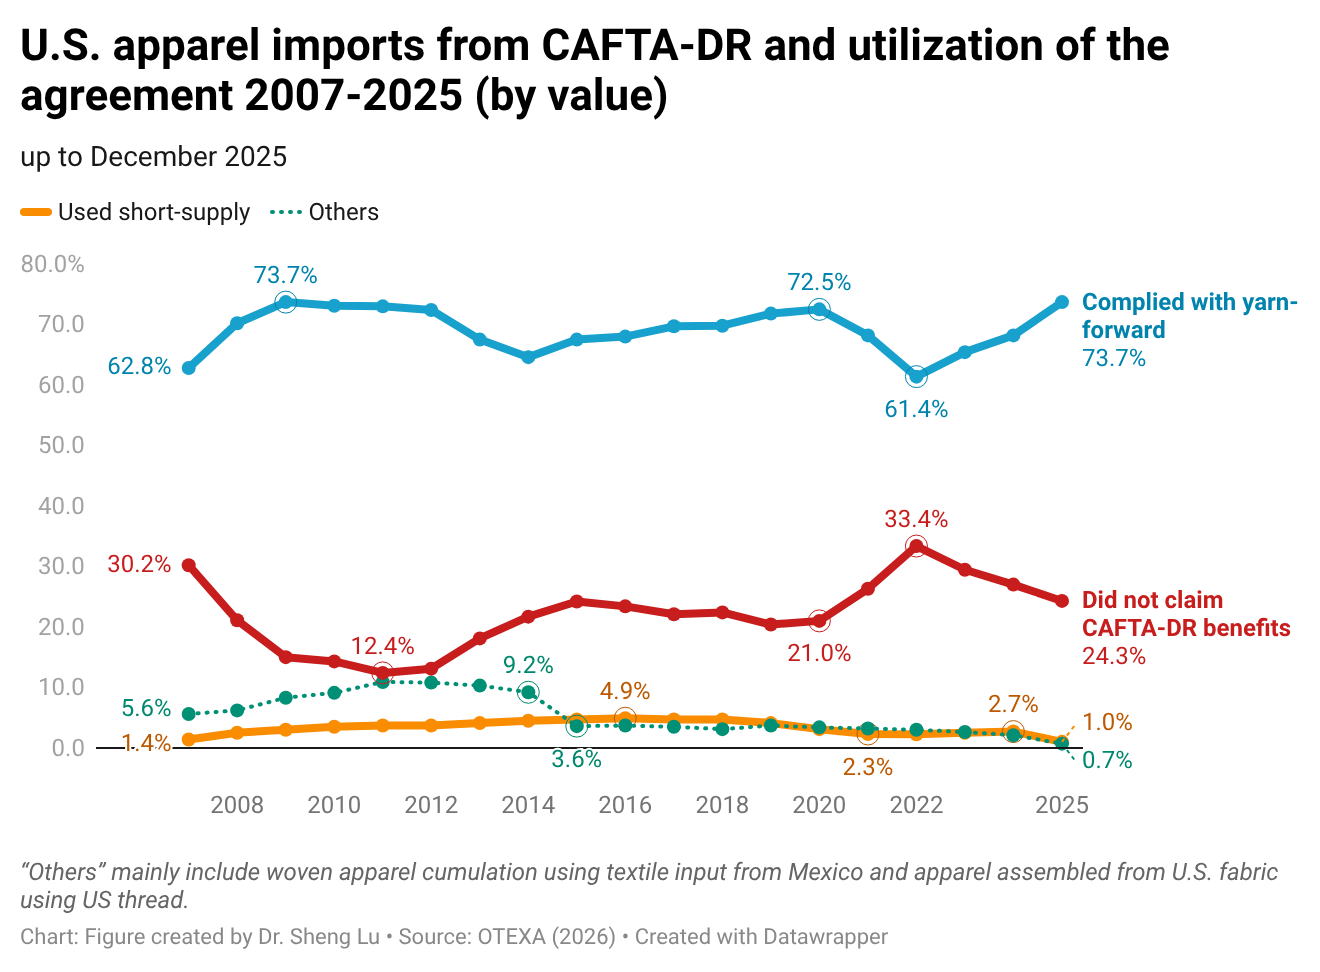
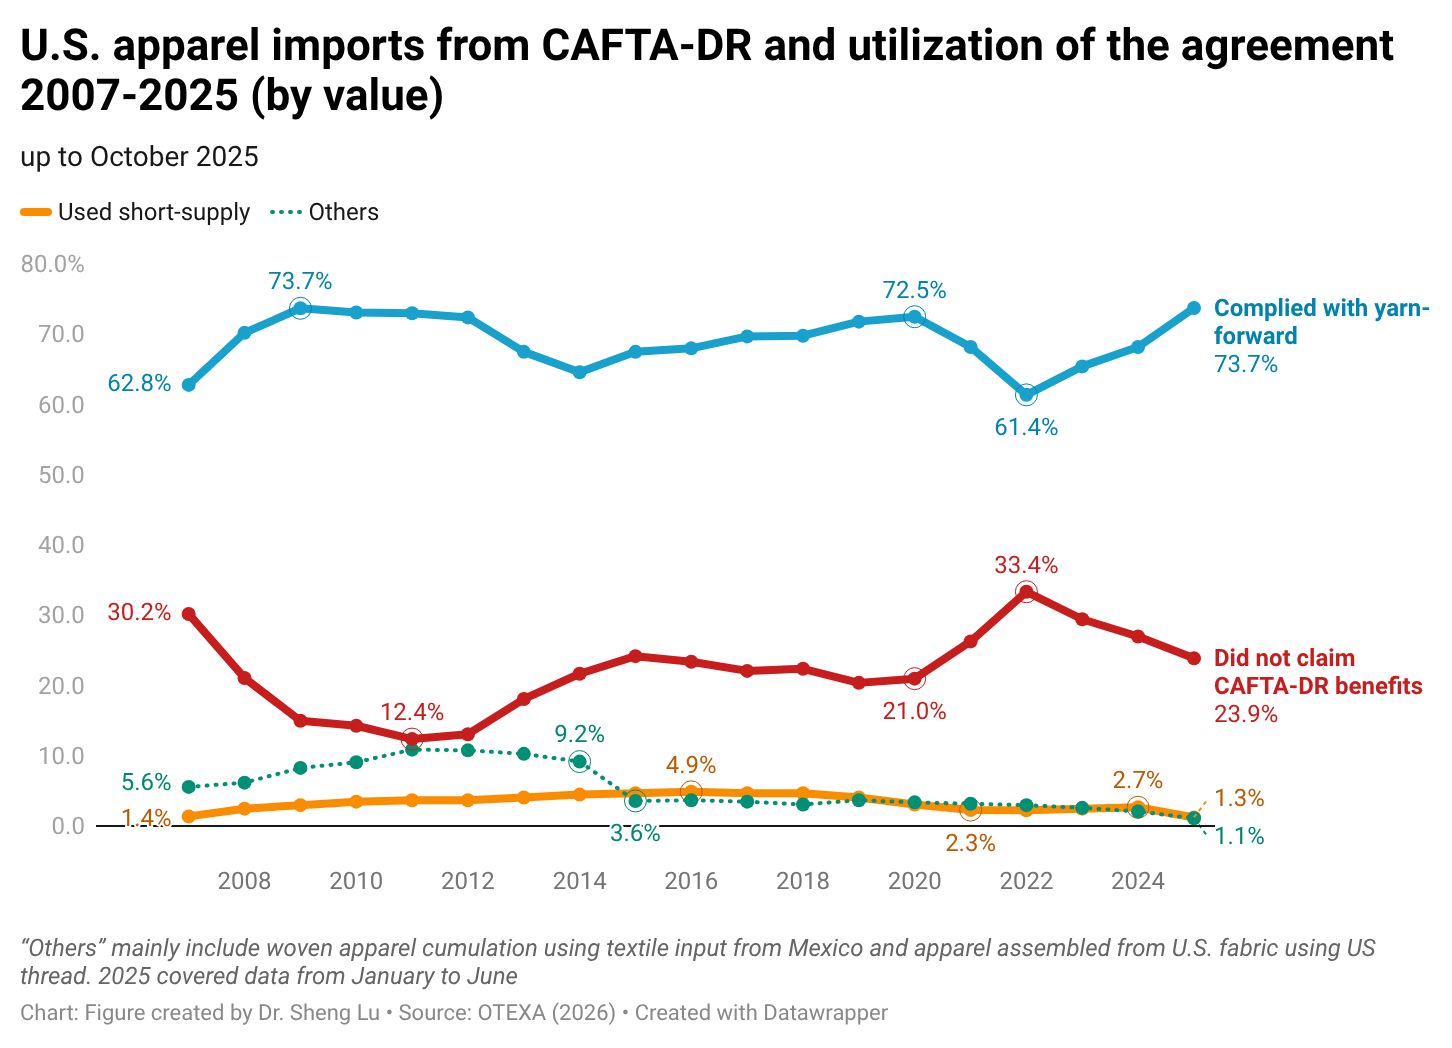
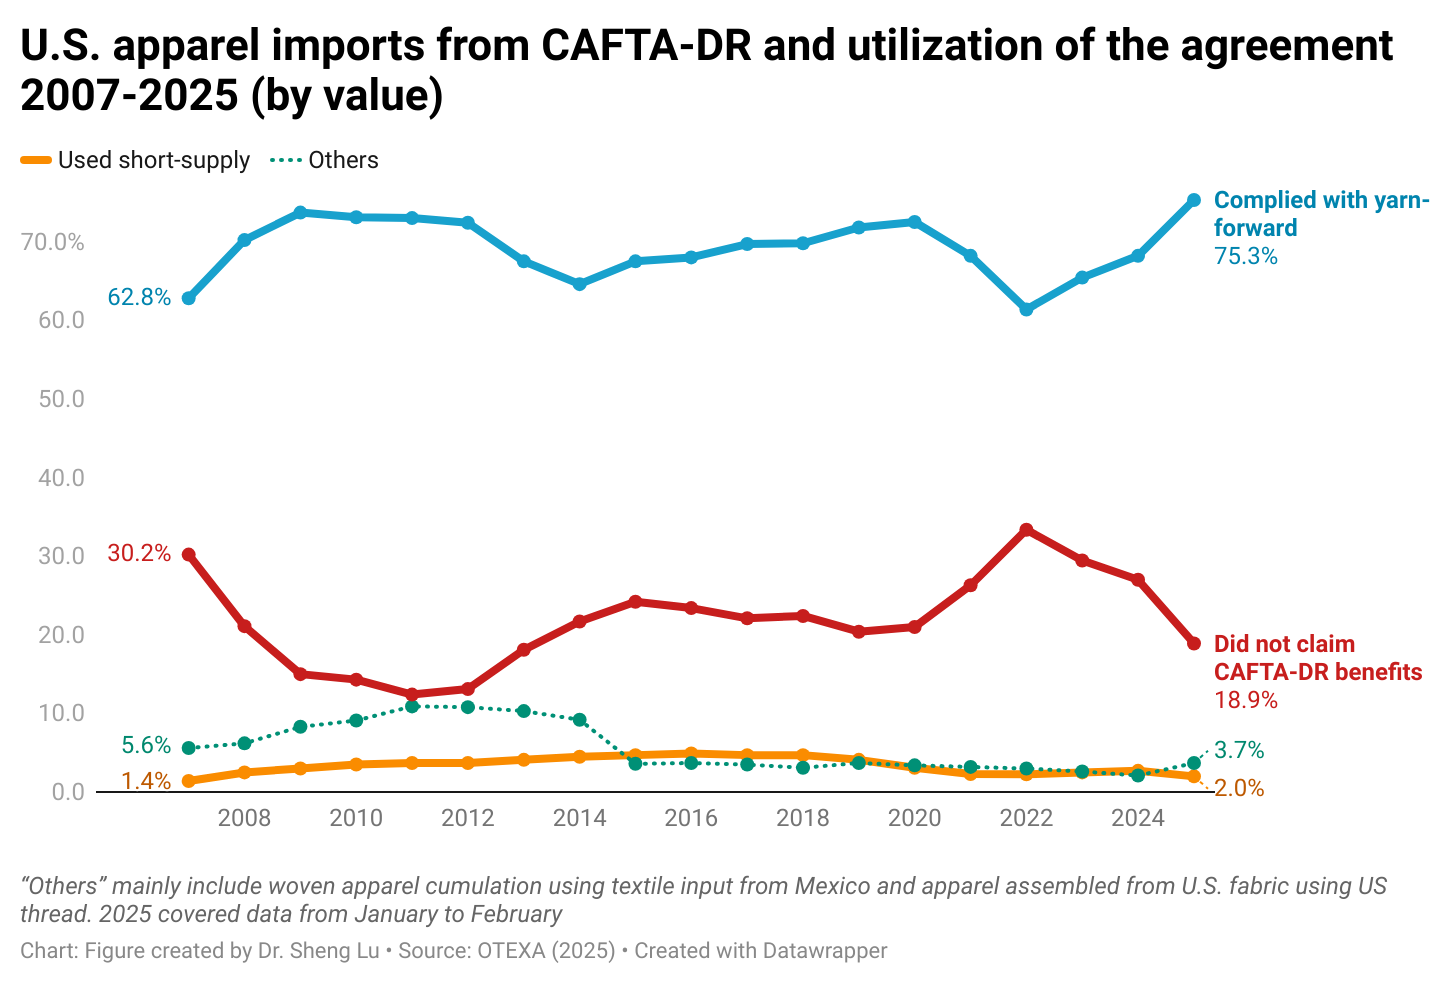
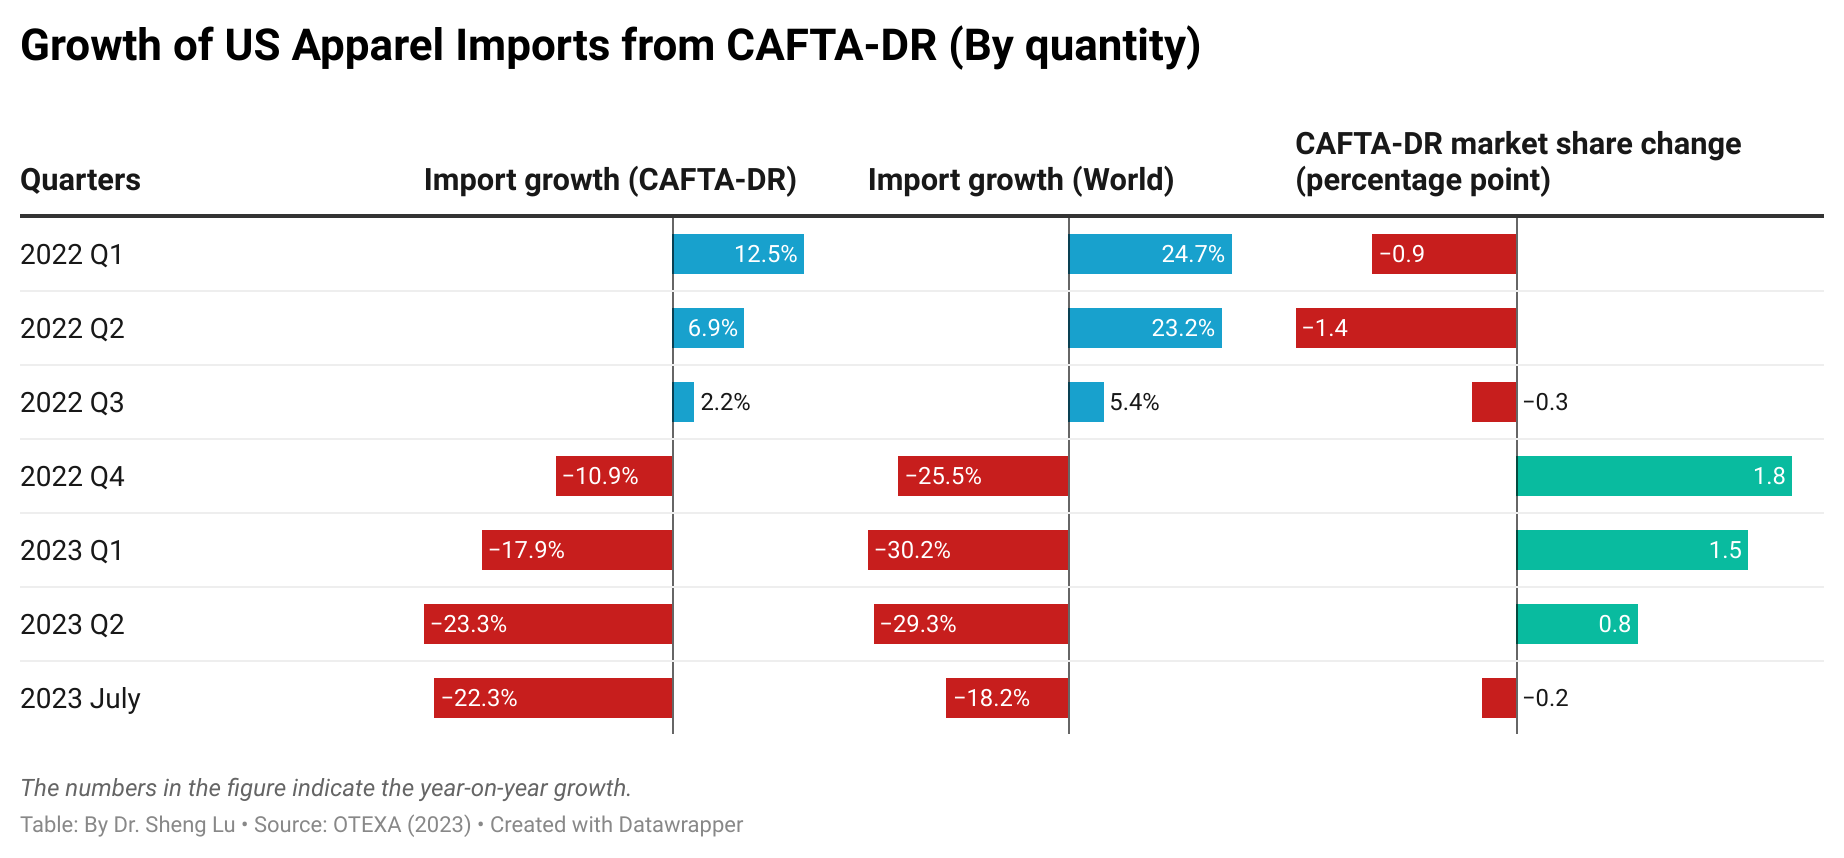
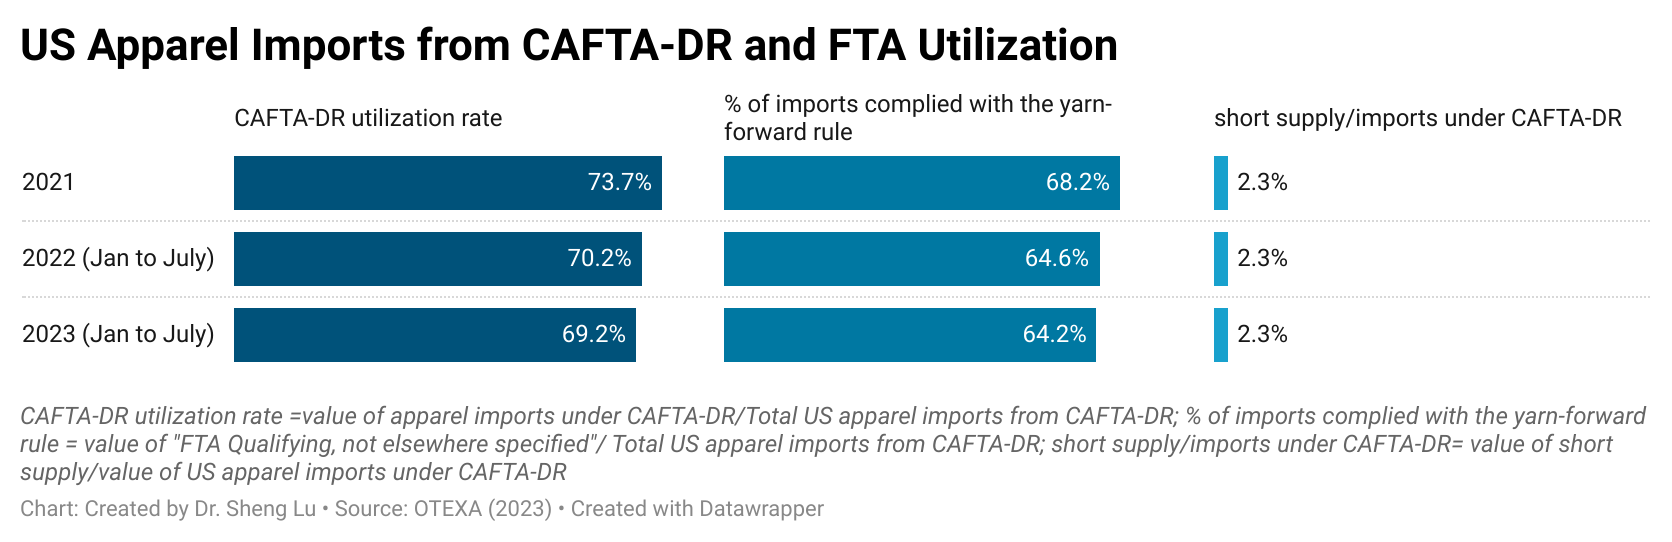
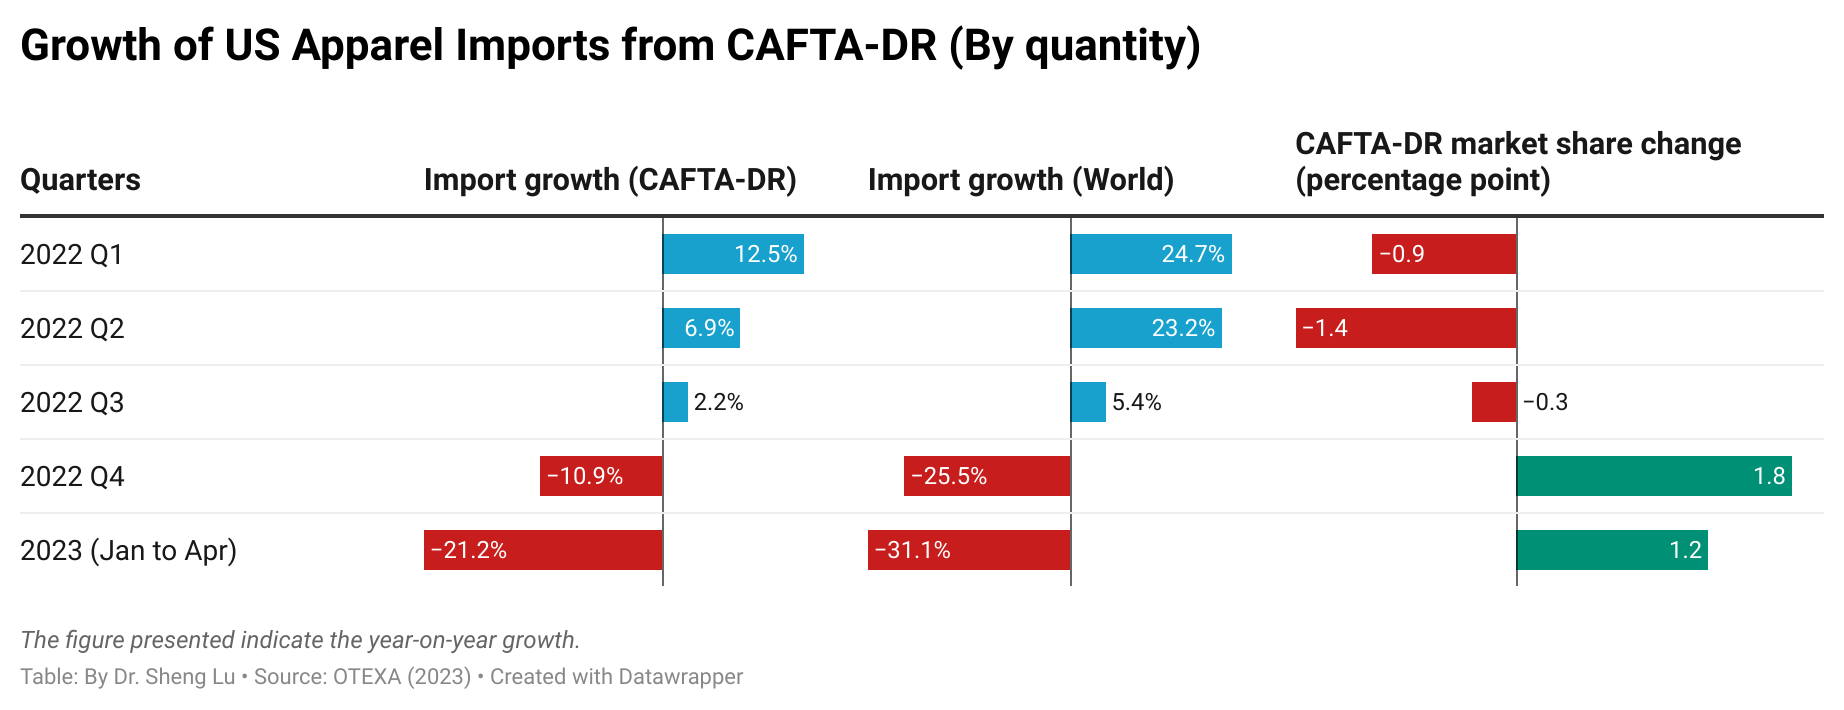
While there is no clear evidence from trade data showing that U.S. fashion companies expanded near-shoring from the Western Hemisphere in 2025, as a silver lining, the utilization of free trade agreements significantly improved. Specifically, measured in value, about 75.7% of U.S. apparel imports from members of the Dominican Republic-Central America Free Trade Agreement (CAFTA-DR) claimed duty-free benefits under the agreement, up from 73.0% in 2024 and 70.5% in 2023. Improved CAFTA-DR utilization in 2025 was driven by a higher volume of imports that met the yarn-forward rules of origin (i.e., up 1.5%). However, the utilization rate of the agreement’s short-supply mechanism decreased from 2.7% to 1.2%, despite more products being added to the list. [Click here for CAFTA-DR utilization data]
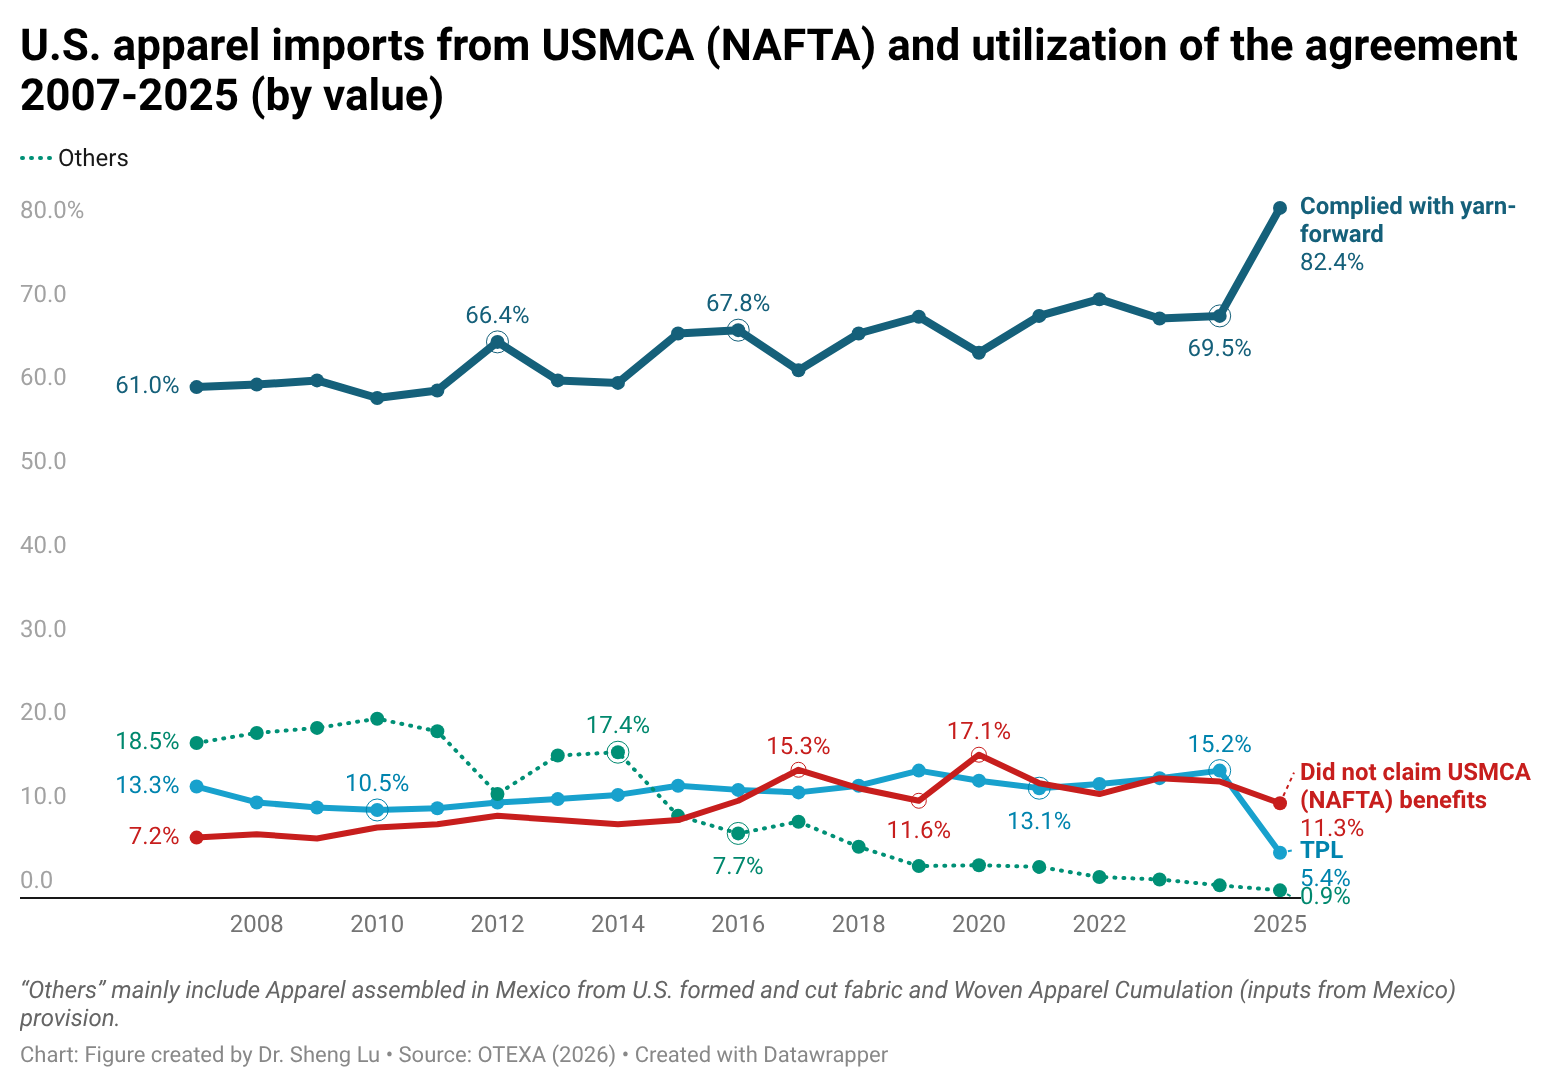
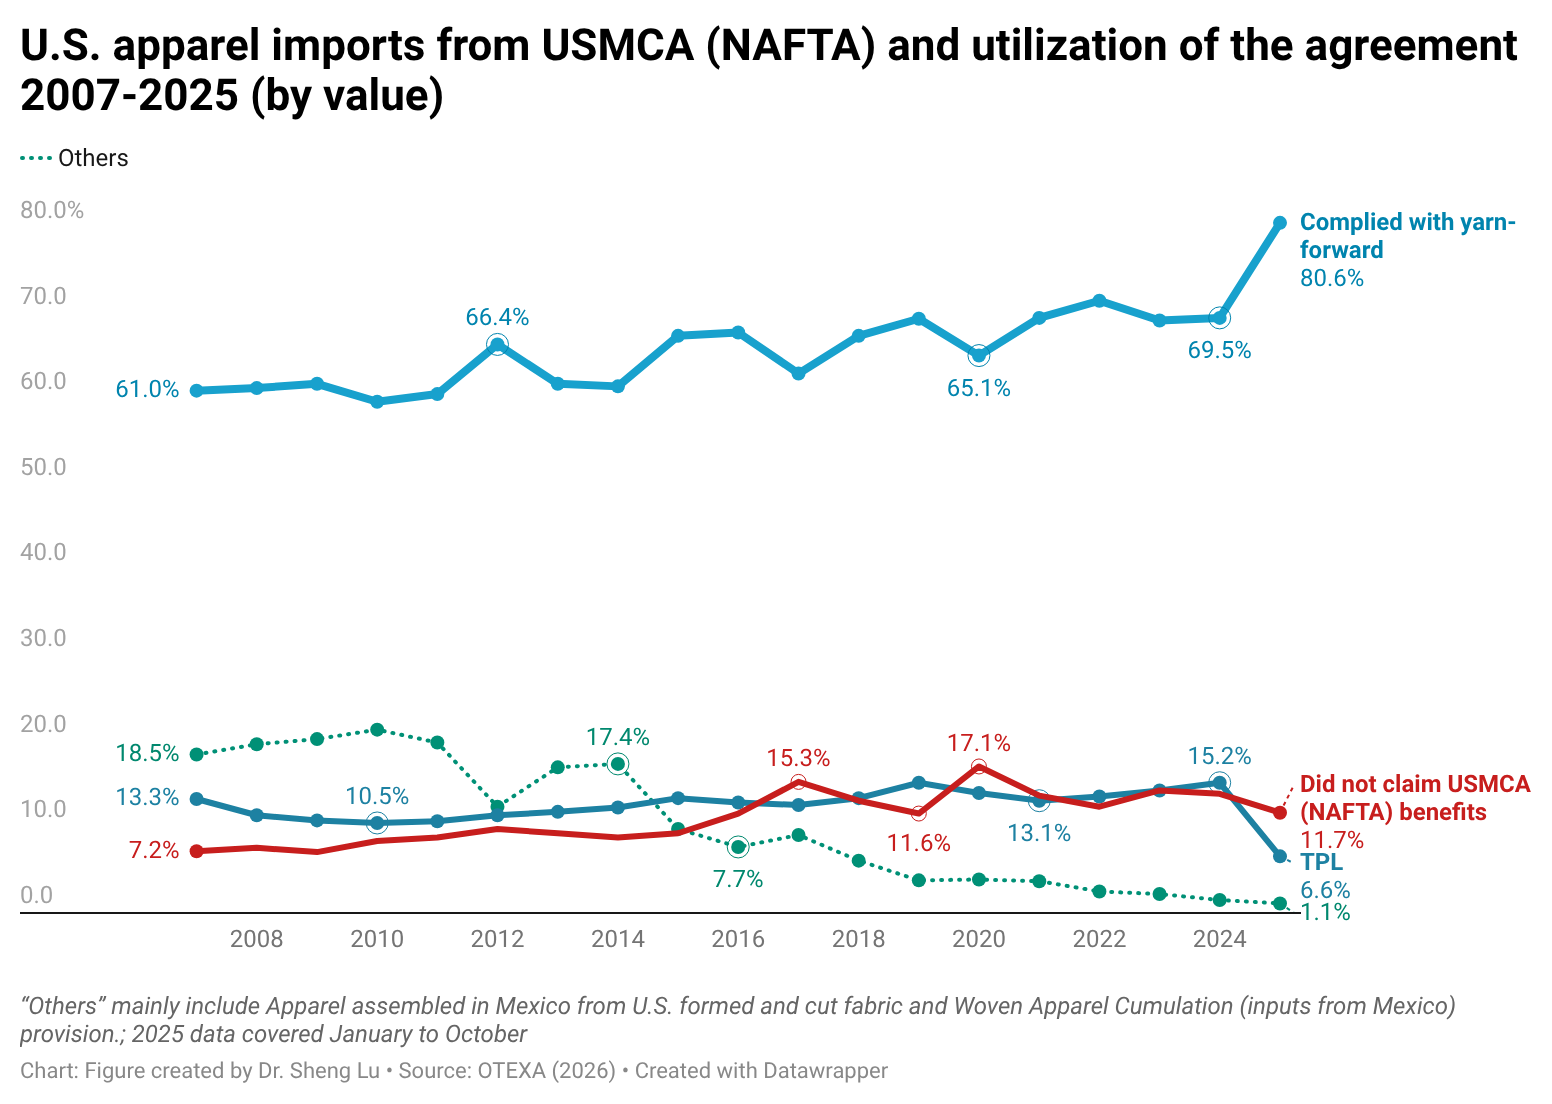
Similarly, in value, about 88.7% of U.S. apparel imports from Mexico and Canada claimed duty-free benefits under the U.S.-Mexico-Canada Agreement (USMCA), up from 86.1% in 2024 and 85.7% in 2023. Notably, in the past, only around 20% of U.S. apparel imports from Canada met the yarn-forward rules of origin; however, this percentage increased dramatically to 69.9% in 2025. Since March 2025, USMCA-qualifying products have been exempt from the “reciprocal tariffs” imposed by the Trump administration, which likely encouraged more U.S. apparel imports from Canada to take advantage of the rules. [Click here for USMCA utilization data]
By Sheng Lu
Read the full paper: Lu, Sheng (2026). US Apparel Import and Sourcing Patterns in 2025. Global Textile Academy, International Trade Centre (ITC). Geneva, Switzerland