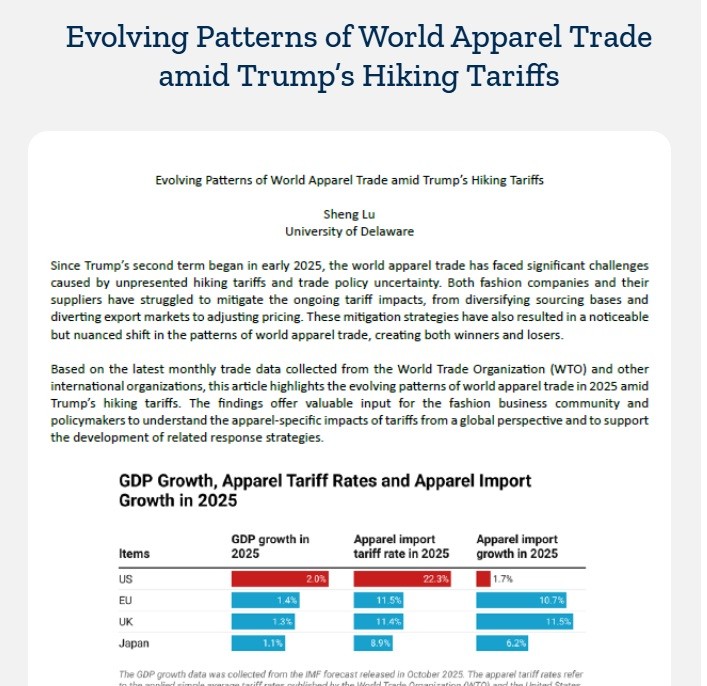
Since Trump’s second term began in early 2025, the world apparel trade has faced significant challenges caused by unprecedented high tariffs and trade policy uncertainty. Both fashion companies and their suppliers have struggled to mitigate the ongoing tariff impacts, from diversifying sourcing bases and diverting export markets to adjusting pricing. These mitigation strategies have also resulted in a noticeable but nuanced shift in the patterns of world apparel trade, creating both winners and losers.
Based on the latest monthly trade data collected from the World Trade Organization (WTO) and other international organizations, this article highlights the evolving patterns of world apparel trade in 2025 amid Trump’s hiking tariffs. The findings offer valuable input for the fashion business community and policymakers to understand the apparel-specific impacts of tariffs from a global perspective and to support the development of related response strategies.
Overall, the findings indicate that Trump’s hiking tariffs have impacted the world apparel trade far beyond the U.S. market. As high tariff rates are expected to remain in 2026, we might see trade diversion and price competition among key suppliers become more evident in the new year. On the other hand, the findings call for greater attention to the tariff’s impacts on small and medium-sized apparel exporting countries, especially those in Asia, South America, and Africa that are less competitive than established, mature suppliers. The ripple effects of the hiking tariffs could increase competition pressures on these small players, resulting in more vulnerability in their export-oriented garment sector and millions of workers.
Key findings:
Pattern 1: Trump’s hiking tariffs appeared to suppress the U.S. import demand for clothing compared with other major import markets.
Pattern 2: Facing higher tariff barriers in the U.S. market, several leading apparel-supplying countries have been diverting exports to the EU and the UK to mitigate tariff impacts.
Pattern 3: Except for the case in the U.S., China’s market share remained relatively stable in other key apparel import markets in 2025.
Pattern 4: Apparel-producing countries in Asia, South America, and Africa faced growing pressure from Chinese products in the domestic market.
Pattern 5: No evidence suggested that Trump’s hiking tariffs have benefited near-shoring.
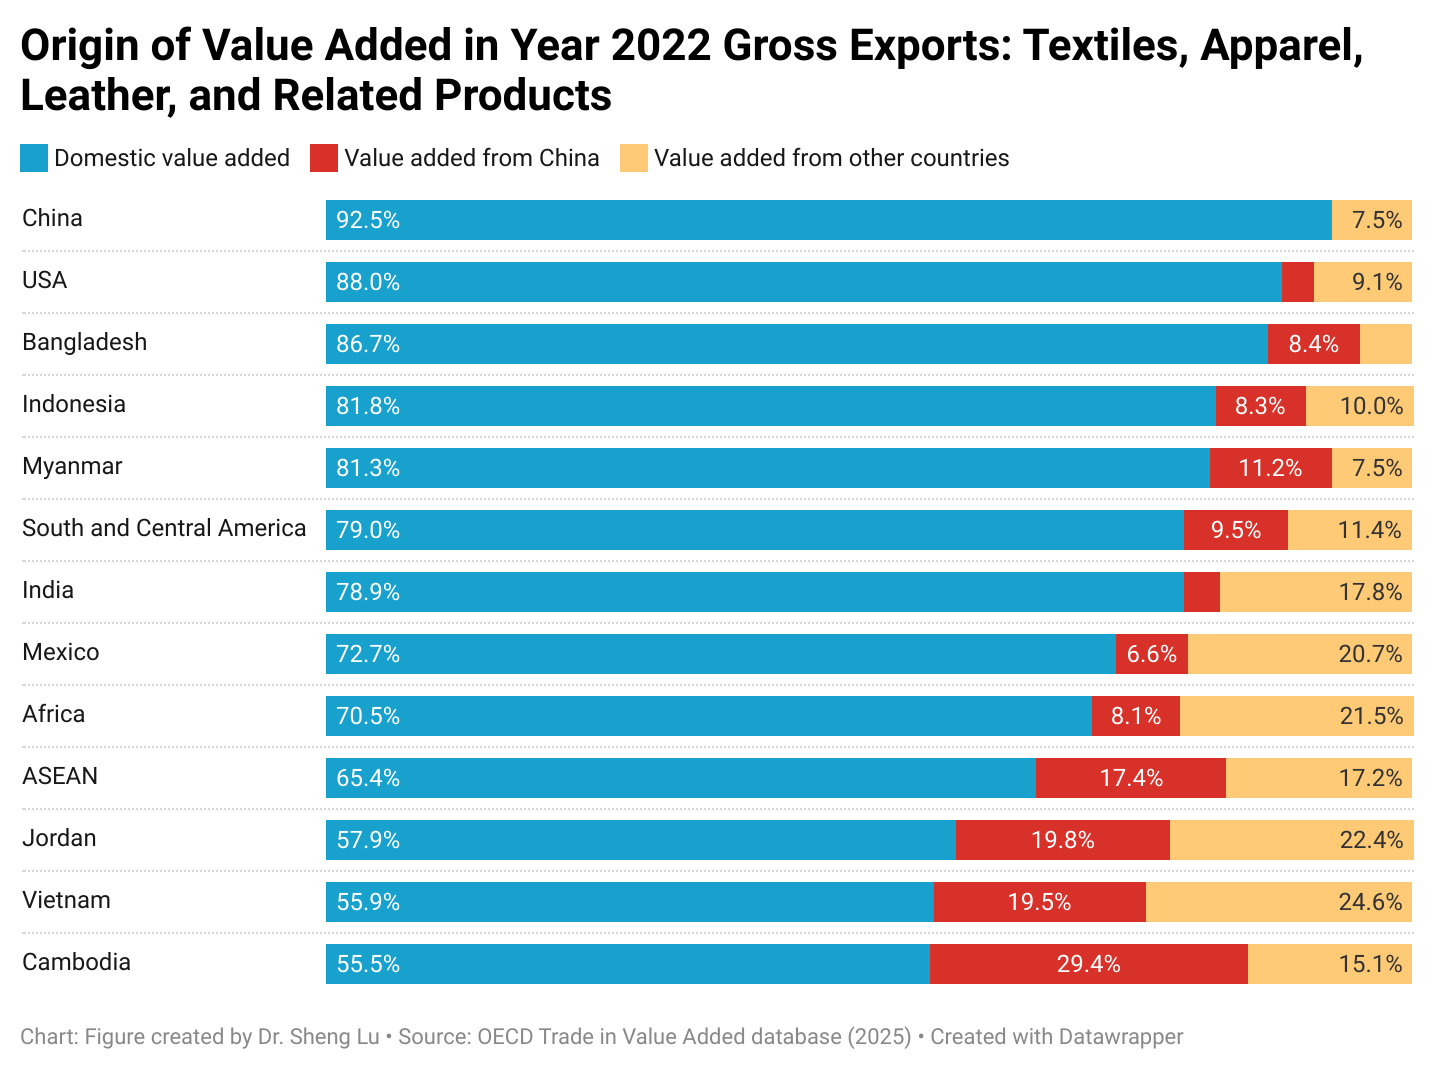
Textiles and apparel today are produced through a global supply chain. For clothing labeled as “Made in Vietnam,” it is likely that the textile raw materials, such as yarns, fabrics, and trims, are sourced from elsewhere.
According to the newly released 2025 OECD trade in value added estimation, as of 2022, a country’s apparel exports commonly contain value added created in another country due to the use of imported textile materials and other inputs. This is the case for exports from leading apparel exporting countries in Asia, such as Vietnam (44% foreign value added), ASEAN members (35% foreign value added), Cambodia (45% foreign value added), India (21% foreign value added), and Jordan (42% foreign value added). Other emerging apparel sourcing destinations in North, South, and Central America, as well as the EU, also used substantial imported inputs for their apparel exports, such as Mexico (27.3% foreign value added), Türkiye (23.9% foreign value added), and Egypt (19.7% foreign value added). [See detailed data here]
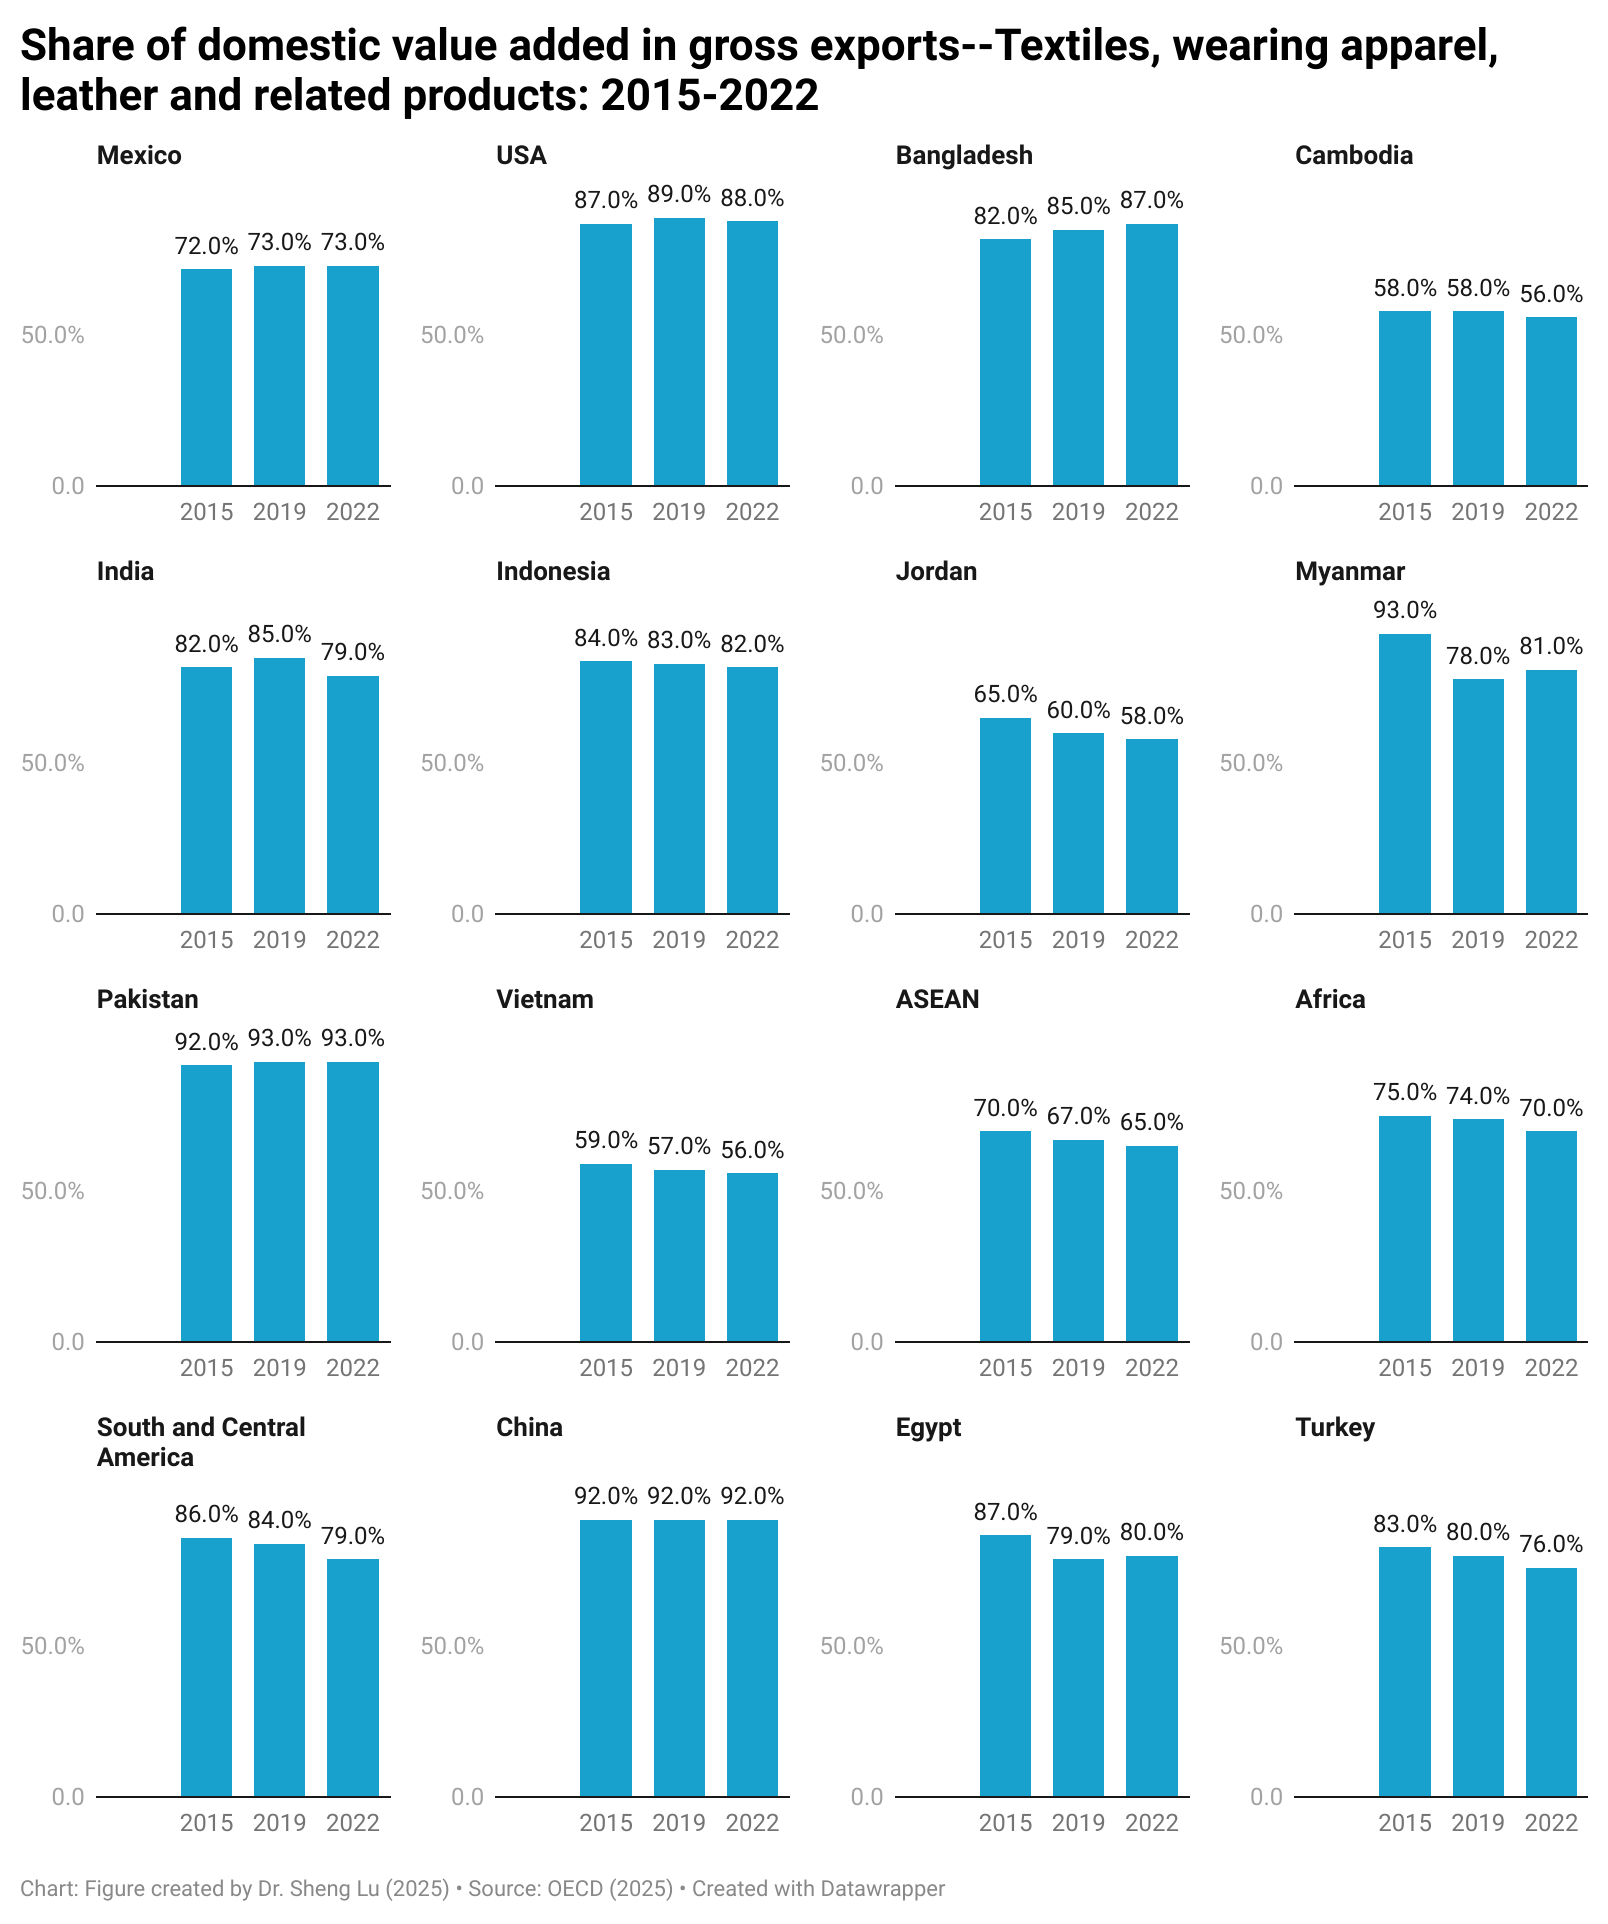
Notably, among the sixteen countries and regions examined, they mostly increased the use of non-domestic value added in textile and apparel exports between 2015 and 2022 (note: paired T-test result was statistically significant at the 99% confidence level). This suggests that co-production through regional or global supply chains, rather than 100% domestic production, has become a more prominent phenomenon in the textiles and apparel industry. [See detailed data here]
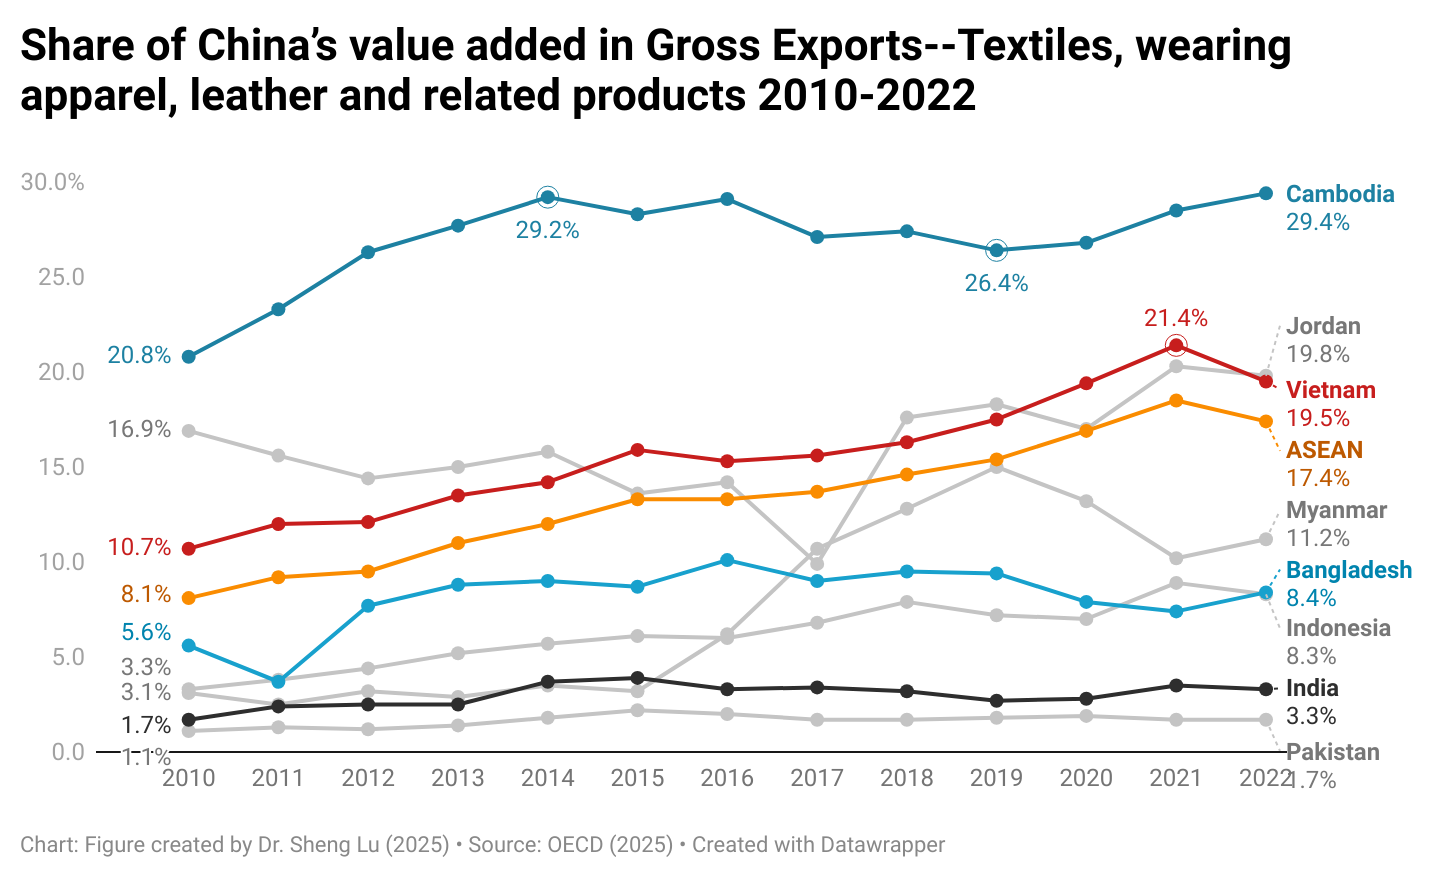
Furthermore, the value added from China appears to be increasing in the textile and apparel exports of many countries. Specifically, between 2015 and 2022, textile and apparel exports from several countries contained a higher percentage of value added from China, including not only Asian countries such as Vietnam (up 6 percentage points), ASEAN (up 4.1 percentage points) and Jordan (up 6.1 percentage points), but also those in other regions such as Egypt (up 3.3 percentage points), Mexico (up 1.7 percentage points), and South & Central America as a whole (up 4.7 percentage points). [See detailed data here] This result reflected China’s deliberate effort to expand its global economic presence through foreign direct investment, Belt and Road initiatives, and new trade agreements in recent years.
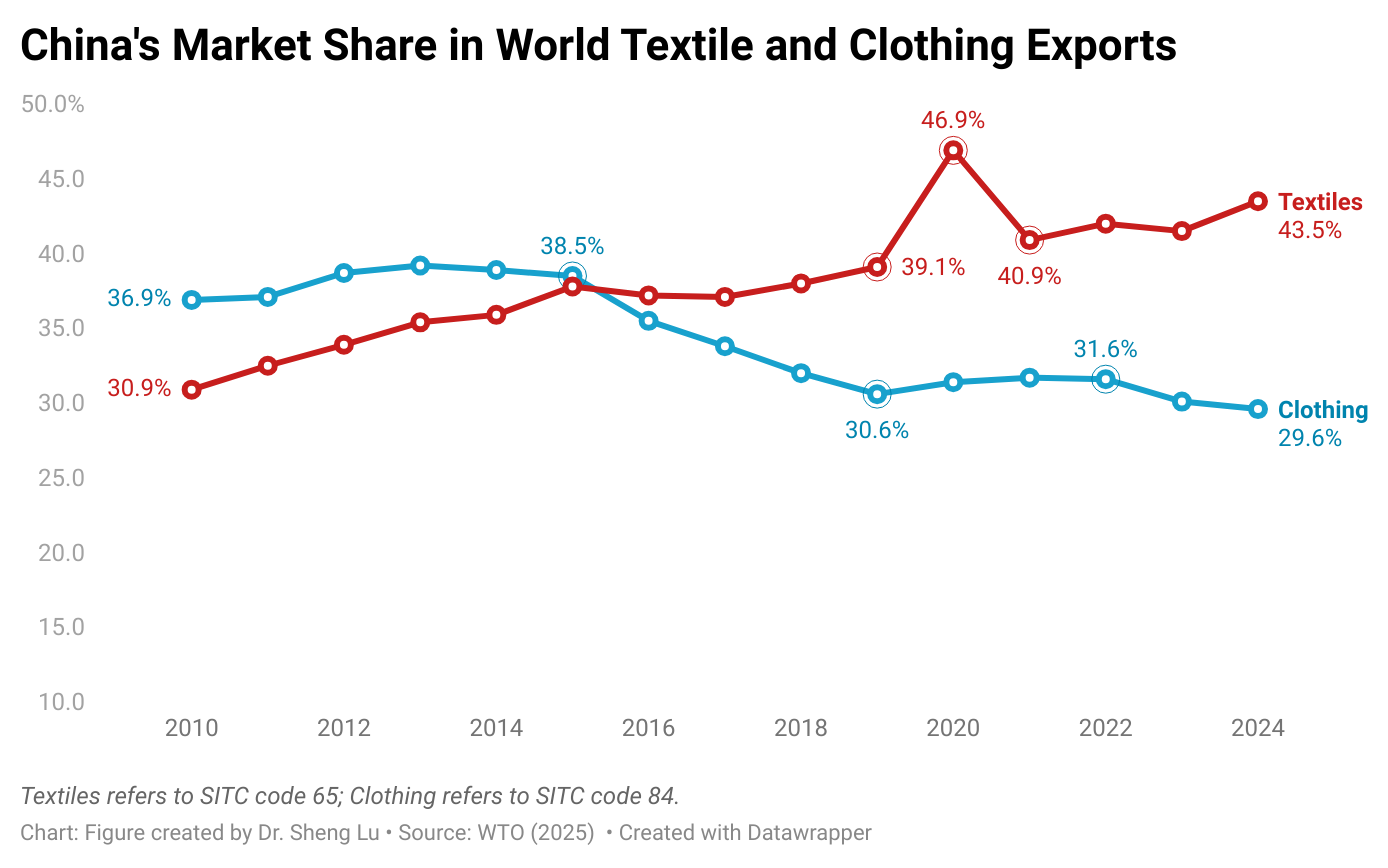
The latest data from the World Trade Organization (WTO) also shows that while China’s market share in the world clothing exports fell to 29.6% in 2024—the lowest level since 2010—China’s market share in textile exports increased to 43.3% in 2024, up from 41.5% a year earlier. In other words, consistent with the stage of development theory, China’s role as a major textile supplier to other apparel-exporting countries continues to grow, despite a decline in its finished garment exports. [See detailed data here]
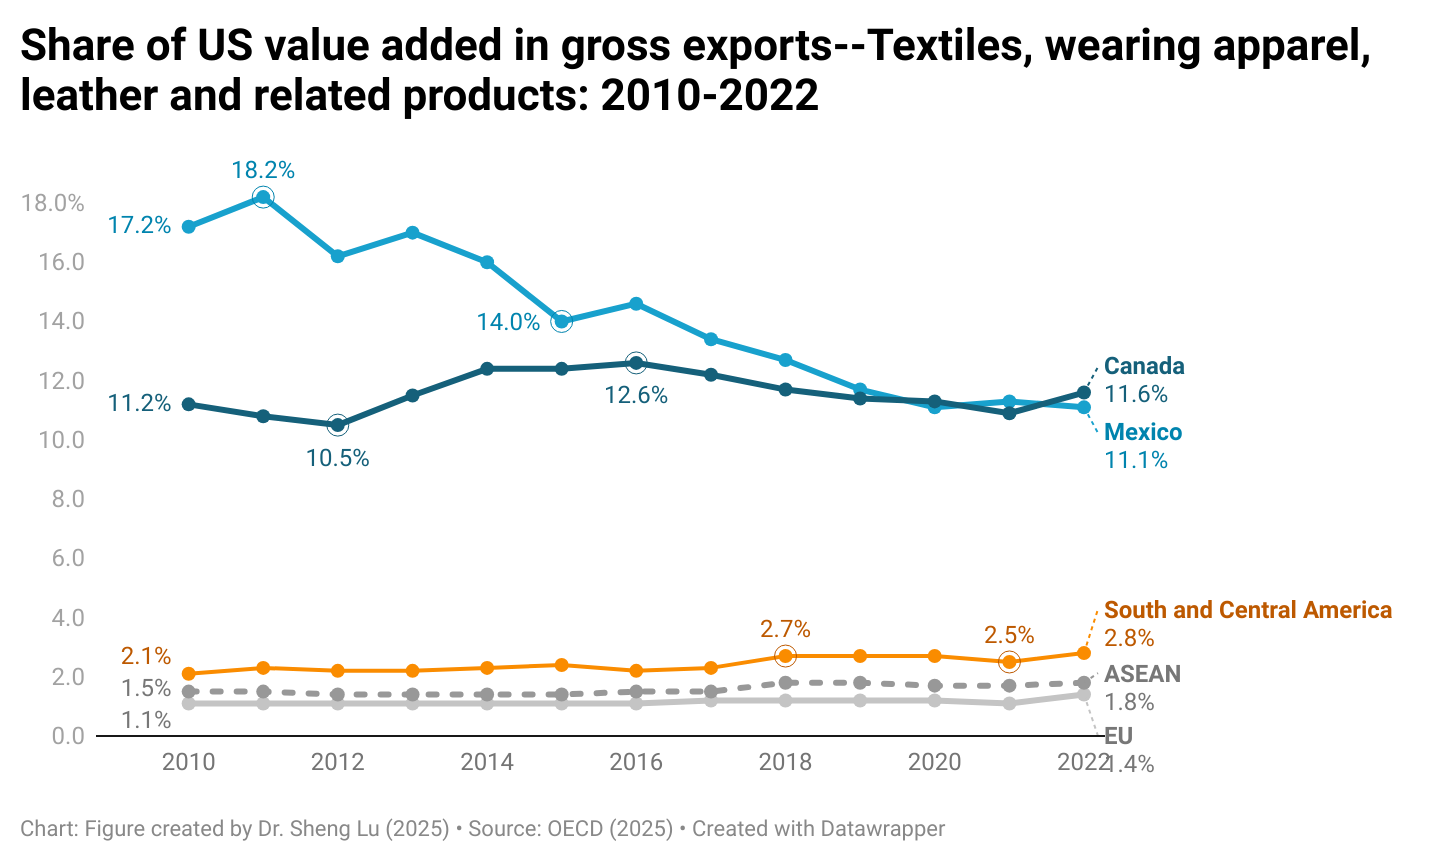
In comparison, while the United States remained an important contributor to the value added of textile and apparel exports from Mexico and Canada, its contribution slightly declined between 2015 and 2022 (i.e., from about 12%-14% to 11%). As the USMCA undergoes its mandated six-year review, it is critical to strengthen, rather than weaken, this North American co-production supply chain, which has a significant impact on the economic interests of the U.S. textile and apparel industry. This is particularly important given that supply chain collaboration between the U.S. and Asian or EU countries for textile and apparel production has been limited, with little indication of growth: According to OECD data, the U.S. value added in Asian and EU countries’ textile and apparel exports remained only around 1.5% [See detailed data here].
by Sheng Lu
(This post is not open for discussion due to its technical nature)
Speaker: Dr. Deborah Elms, Founder and Executive Director of the Asian Trade Centre and the President of the Asia Business Trade Association. The clip was part of the webinar “Asia’s Noodle Bowl Of Trade” (March 2023).
Background
The Asia-Pacific region includes several mega free trade agreements:
ASEAN (Association of Southeast Asian Nations) is a regional intergovernmental organization comprising ten countries in Southeast Asia (Brunei, Cambodia, Indonesia, Laos, Malaysia, Myanmar, the Philippines, Singapore, Thailand, and Vietnam). In 2022, ASEAN members have a combined nominal GDP of $3.6 trillion and a population of 671.6 million.
CPTPP (Comprehensive and Progressive Agreement for Trans-Pacific Partnership) is a free trade agreement signed by 11 countries in the Asia-Pacific region, including Japan, Malaysia, Vietnam, Australia, Singapore, Brunei, New Zealand, Canada, Mexico, Peru, and Chile. The CPTPP covers a market of 495 million people with a combined GDP of $13.5 trillion in 2021. The United States was originally a participant in the Trans-Pacific Partnership (TPP) negotiations, but in January 2017, former US President Trump withdrew the US from the agreement. The Biden administration has indicated no interest in rejoining CPTPP. Additionally, China is actively seeking to join CPTPP (as of March 2024).
RCEP (Regional Comprehensive Economic Partnership) is a free trade agreement signed by 15 countries in the Asia-Pacific region, including China, Japan, South Korea, Australia, New Zealand, Brunei, Cambodia, Indonesia, Laos, Malaysia, Myanmar, the Philippines, Singapore, Thailand, Vietnam. In 2021, RCEP members collectively represented a market of 2.3 billion people with a combined GDP of $26.3 trillion. India was an RCEP member but withdrew from the agreement due to concerns about import competition with China.
IPEF (Indo-Pacific Economic Framework for Prosperity) is a US-led economic cooperation framework that aims to “link major economies and emerging ones to tackle 21st-century challenges and promote fair and resilient trade for years to come.” IPEF is NOT a traditional free trade agreement, and it does not address market access issues like tariff cuts. Instead, IPEF includes four pillars: trade, supply chains, clean economy, and fair economy. IPEF members in the Asia-Pacific region include the United States, Japan, Australia, New Zealand, South Korea, India, Fiji, Brunei, Indonesia, Malaysia, the Philippines, Singapore, Thailand, and Vietnam. The IPEF is designed to be flexible, meaning that IPEF partners are not required to join all four pillars. For example, India chooses not to join the trade pillar of the framework. In 2021, IPEF countries collectively represented a market of 2.1 billion people with a combined GDP of $23.3 trillion. The potential economic impact of IPEF remains too early to tell.
Notably, ASEAN, CPTPP, RCEP, and IPEF members play significant roles in the world textile and apparel trade. Specifically:
ASEAN and RCEP members have established a highly integrated regional textile and apparel supply chain. For example, a substantial portion of ASEAN and RECP members’ textile imports came from within the region.
ASEAN and RCEP members’ supply chain connection with China has substantially strengthened over the past decade. In contrast, the US barely participated in Asia-based textile and apparel supply chains. For example, other than CPTPP, the US accounted for less than 2% of ASEAN, RCEP, and IPEF members’ textile imports in 2022.
ASEAN and RCEP members also hold significant market shares in the world textile and apparel exports (over 50%). Meanwhile, the US and EU are indispensable export markets for ASEAN and RCEP members.
Because of the inclusion of the United States, IPEF represented one of the world’s largest apparel import markets (i.e., 33.7% in 2021, measured in value). Similarly, in 2022, about 26% of US apparel imports came from current IPEF members. Should IPEF address market access issues, it could offer significant duty-saving opportunities for textile and apparel products.
Additionally, the UK’s membership in CPTPP may have a limited direct impact on the textile and apparel sector, at least in the short to medium terms. For example, current CPTPP members only accounted for about 6% of the UK’s apparel imports in 2022.
A new study released by the Hinrich Foundation in July 2023 evaluated the impact of the implementation of the Uyghur Forced Labor Prevention Act (UFLPA) on Vietnam’s textile and apparel industry.
The study’s findings were based on interviews with “senior leaders and owners of Vietnam’s garment and textile small and medium-sized enterprises (SMEs).” (Note: However, the study didn’t specify when and how many interviews were conducted.) Below are the summarized key findings:
#1: Vietnam’s textile and apparel industry heavily uses cotton imported from China. As noted in the study, in 2021, China accounted for nearly 30% of Vietnam’s cotton imports (ranked #1, $1.48 billion out of total $4.99 billion imports), surpassing the US ($1.05 billion).
#2: Vietnam’s garment exports may contain Xinjiang cotton. According to the study, “Once the cotton arrives in Vietnam, international intermediary manufacturers create finished garments from semi-finished products to export globally, often using the same materials from banned Chinese suppliers. This results in the ‘laundering’ of Xinjiang cotton.”
#3: Vietnam textile and apparel SMEs report challenges in proving the origin of cotton in fabrics. For example, one respondent says, “Differentiating between cotton products coming from different sources is challenging as they might have been blended while being transported by sea. Suppliers from China, Vietnam, Bangladesh, India, and Pakistan may engage in this practice to falsely label Xinjiang cotton as coming from other locations to circumvent this act.”
#4: Vietnam’s textile and apparel SMEs say the UFLPA implementation has negatively affected their exports to the United States.
CBP’s statistics show that (current as of July 1, 2023), since UFLPA’s implementation in June 2022, a more significant amount of Vietnam’s textiles, apparel, and footwear were affected by law enforcement than those from China (e.g., $20 million vs.$16.2 million investigated and $3.53 million vs.$1.04 million denied access).
US fashion companies are sourcing LESS from Vietnam due to forced labor concerns. According to one respondent, “My company is producing apparel products for several US-based fashion brands and uses materials from China and exports to the US. Since UFLPA was in place in June 2022, they have ordered less from us. It seems that our partners feel pressure from the regulators, so they are looking for alternative risk-free suppliers.”
The surveyed SMEs also expect MORE of Vietnam’s textile and apparel exports to be investigated under the UFLPA enforcement down the road. Some SMEs commented that “it would be hard for US firms to rapidly find alternative suppliers in a short time, therefore more checks on Vietnamese cargoes are to be expected.”
The study acknowledges that “In the worst-case scenario, Vietnamese SMEs may lose market access if their American importers are unable to verify that the supply chain is free from inputs produced via forced labor.”
#5: UFLPA also increased the trade compliance costs of “Made in Vietnam,” a significant challenge to many SMEs. One respondent commented, “Compliance with the UFLPA may pose a challenge for SMEs due to the higher costs associated with providing the necessary documentation of their supply chains. This could be due to the need to conduct additional audits, hire external consultants, or implement new tracking systems.”
Additionally, the report called for Vietnam’s textile and apparel SMEs to 1) diversify the supply chain, especially using more cotton imports from the US, India, Australia, and Brazil. 2) enhance supply chain traceability (note: how to make it happen remains a big question mark); 3) engage in dialogue with US authorities.
Suggested citation: Lu, Sheng. (2020). Textile and Apparel Products Covered by the U.S.-China Tariff War Reference List (updated December 2020). Retrieved from http://www.shenglufashion.com
On
October 16, 2018, the Trump
Administration notified U.S. Congress its intention to negotiate the
U.S.-EU Free Trade Agreement. Between
2013 and 2016, the United States and EU were also engaged in the negotiation of
a comprehensive free trade agreement– Trans-Atlantic Trade and Investment Partnership
(T-TIP) with the goal to unlock market access opportunities for
businesses on both sides of the Atlantic through the ambitious elimination of
trade and investment barriers as well as enhanced regulatory coherence. The T-TIP
negotiation was stalled since 2017, although
the Trump Administration has never officially announced to withdraw from the
agreement.
II. Negotiating Objectives
On
January 11, 2019, the Office of the U.S. Trade Representative (USTR) released
thenegotiating
objectives of the proposed U.S.-EU Free Trade Agreement after
seeking inputs from the public. Overall, the proposed agreement aims to address
both tariff and non-tariff barriers and to “achieve fairer, more balanced trade”
between the two sides.
Regarding textiles and apparel, USTR says it will secure duty-free access for U.S. textile and
apparel products and seek to improve competitive opportunities for exports of
U.S. textile and apparel products while taking into account U.S. import
sensitivities” during the negotiation. The proposed U.S.-EU free trade
agreement also will “establish origin procedures for the certification and
verification of rules of origin that promote strong enforcement, including with respect to textiles.” T-TIP
had adopted similar negotiating objectives for the textile and apparel sector.
III. Industry viewpoints on the agreement
As of
January 2019, leading trade associations
representing the U.S. apparel industry and the EU textile and apparel industries
have expressed support for the proposed U.S.-EU Free Trade Agreement. In general,
these industry associations recommend the agreement to achieve the following
goals:
First, eliminate import duties. For example:
American
Apparel and Footwear Association (AAFA): “We
support the immediate and reciprocal elimination of the high duties that both
countries maintain on textiles, travel goods, footwear, and apparel.”…” We also
support the immediate elimination of any retaliatory duties imposed by the
E.U., as well as any duties imposed by the U.S. (that led to that retaliation).
The duties impose costs on activities, including manufacturing activities in
the U.S., and undermine markets for U.S. exporters in Europe.”
European
Apparel and Textile Confederation (Euratex):“The
European Textile and Clothing sector faces high tariffs while exporting to the
US market from 11% to up to 32% for some products, namely sewing thread of
man-made filaments, suits, woven fabrics of cotton, trousers and t-shirts. Zero
customs duties while ensuring modern rules of origin will allow EU companies to
boost exports and offer more choice to American consumers and professional
buyers.”
Second, promote regulatory coherence (Harmonization). For example:
AAFA: “The E.U. and the
United States both maintain an extensive array of product safety, chemical management,
and labeling requirements regarding apparel (including legwear), footwear,
textiles, and travel goods.”…” Yet they often contain different requirements,
such as testing or certification, that greatly add compliance costs.”…” We
believe the U.S.‐E.U. trade agreement presents an important opportunity to achieve
harmonization or alignment for these regulations.”
Euratex: “Maintaining high
level of standards while eliminating unnecessary burdens, removing additional
requirements and facilitating customs procedures that impede business are top
priorities. Mutual recognition of the EU and US standards will preserve high
level of consumer protection on both sides of the Atlantic. Convergence on labelling (fibre
names, care symbols and wool labelling),
consumer safety on children products and flammability standards is key for the
T&C sector.” “EURATEX believes the EU and US standardization bodies should
cooperate on setting standards for Smart Textiles taking into account the
industry views for facilitating development and trade of such products of the
future.”
Third, adopt flexible/modern rules of origin. For example:
AAFA: “We should also support higher usage of the agreement by making sure the rules of origin reflect the realities of the industry today…”the yarn forward” rules, although theoretically promote usage of trade partner inputs, in practice they operate as significant barriers that restrict the ability of companies to use a trade agreement in many cases”…” We need to incorporate sufficient flexibilities into the rules of origin so that different supply chains –and the U.S. jobs they support – can take advantage of the agreement.”
Euratex: “Zero customs
duties while ensuring modern rules of
origin will allow EU companies to boost exports and offer more choice to
American consumers and professional buyers.”
The National Council of Textile Organizations (NCTO), which represents the U.S. textile industry, hasn’t publically stated its position on the proposed U.S.-EU Free Trade Agreement. However, NCTO had strongly urged U.S. trade negotiators to adopt a yarn-forward rule of origin in T-TIP. NCTO also opposed opening the U.S. government procurement market protected by the Berry Amendment to EU companies.
IV. Patterns of U.S.-EU textile and apparel trade
The
United States and the EU are mutually important textile and apparel (T&A)
trading partners. For example, the United States is EU’s largest extra-region
export market for textiles, and EU’s fifth largest extra-region supplier of
textiles in 2017 (Euratex, 2018).
Meanwhile,
the EU is one of the leading export markets for U.S.-made technical textiles as
well as an important source of high-end apparel products for U.S. consumers (OTEXA,
2018). Specifically, in 2017, U.S. T&A exports to the European Union
totaled $2,572 million, of which 73.2% were textile products, such as specialty
& industrial fabrics, felts & other non-woven fabrics and filament
yarns. In comparison, EU’s T&A exports to the United States totaled $4,163
million in 2017, among which textiles and apparel evenly accounted for 48.7%
and 51.3% respectively.
V. Potential economic impact of the agreement
By adopting the Global Trade Analysis Project (GTAP) model, Lu (2017) quantitatively evaluated the potential impact of a free trade agreement between the U.S. and EU on the textile and apparel sector. According to the study:
First,
the trade creation effect of the agreement will expand the EU-U.S.
intra-industry trade for textiles. Meanwhile, the agreement is likely to
significantly expand EU’s apparel exports to the United States.
Second,
the trade diversion effect of the U.S.-EU Free Trade Agreement will affect other
T&A exporters negatively, including Asia’s T&A exports to the U.S. market
and EU and Turkey’s T&A exports to the EU market.
Third, the U.S.-EU Textile and Apparel Trade might affect the intra-region T&A trade in the EU region negatively but in a limited way.
Overall, the study suggests that the EU T&A industry will benefit from the additional market access opportunities created by the U.S.-EU Free Trade Agreement.One important factor is that the U.S. and EU T&A industries do not constitute a major competing relationship. For example, the United States is no longer a major apparel producer, and EU’s apparel exports to the United States fulfill U.S. consumers’ demand for high-end luxury products. The U.S.-EU Free Trade Agreement is also likely to create additional export opportunities for EU textile companies in the U.S. market, especially in the technical textiles area, which accounted for approximately 40% of EU’s total textile exports to the United States in 2017 measured in value. Compared with traditional yarns and fabrics for apparel making purposes, technical textiles are with a greater variety in usage, which allows EU companies to be able to differentiate products and find their niche in the U.S. market.
Further, the study suggests that we shall pay more attention to the details of non-tariff barrier removal under the U.S.-EU Free Trade Agreement, which could result in bigger economic impacts than tariff elimination.


