[Please read the updated version: U.S. Continues to Lose Apparel Manufacturing Jobs in 2016]
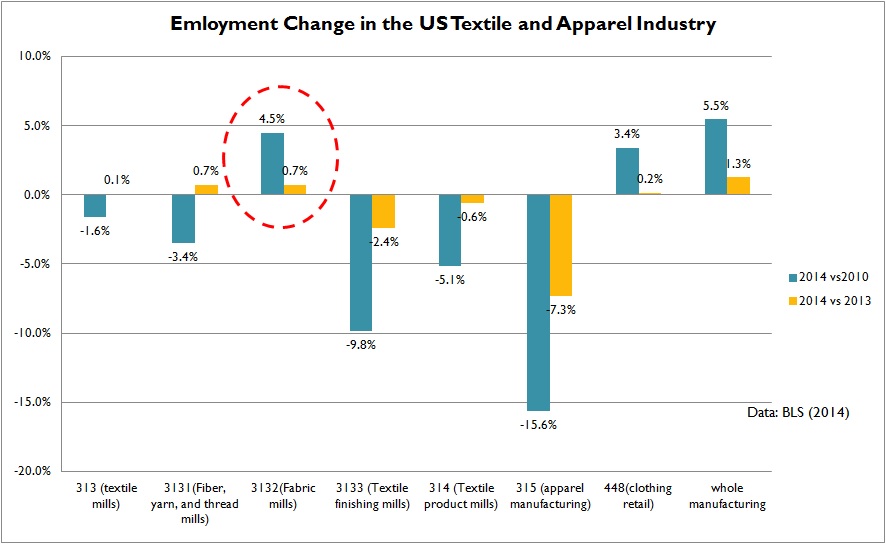
Employment in the textile sector has remained stable since 2011. From the end of 2013 to July 2014, employment in textile mills (NAICS 313) even slightly increased 0.1 percent, mostly contributed by fiber & yarn mills (NAICS 3131) and fabric mills (NAICS 3132). The data supports the argument that textile manufacturing is gradually returning back to the United States.

Employment in the apparel manufacturing sector (NAICS 315) continued to shrink. By July 2014, total employment in apparel manufacturing had declined by 15.6 percent since 2010 and went down 7.3 percent just from the end of 2013 to July 2014. Still it is getting harder and harder for US consumers to find “made in USA” apparel in the retail stores.
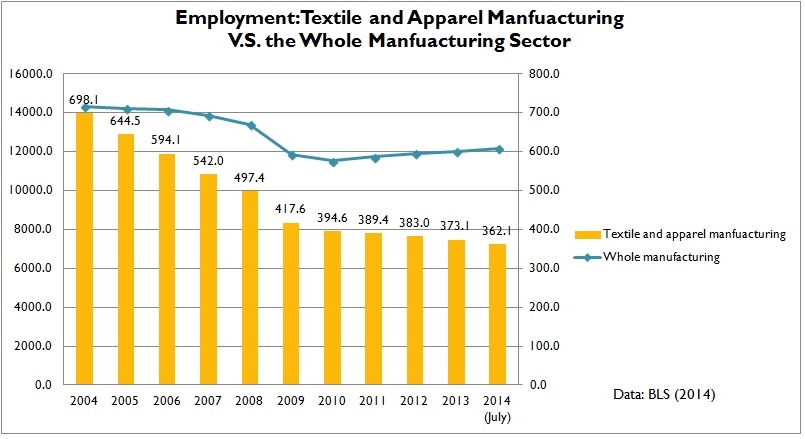
Retailers remains the leading job providers in the U.S. textile and apparel industry. By July 2014, within the total 1.76 million employment in the US textile and apparel industry (NAICS 313, 314, 315 and 448), almost 80 percent came from the retail sector (NAICS 448).

From 2010 to July 2014, employment in the US manufacturing sector as a whole enjoyed a 5.5 percent growth, much higher than the case in the textile and apparel sectors. This trend reminds us that the principal of “comparative advantage” is still working in the 21st century.
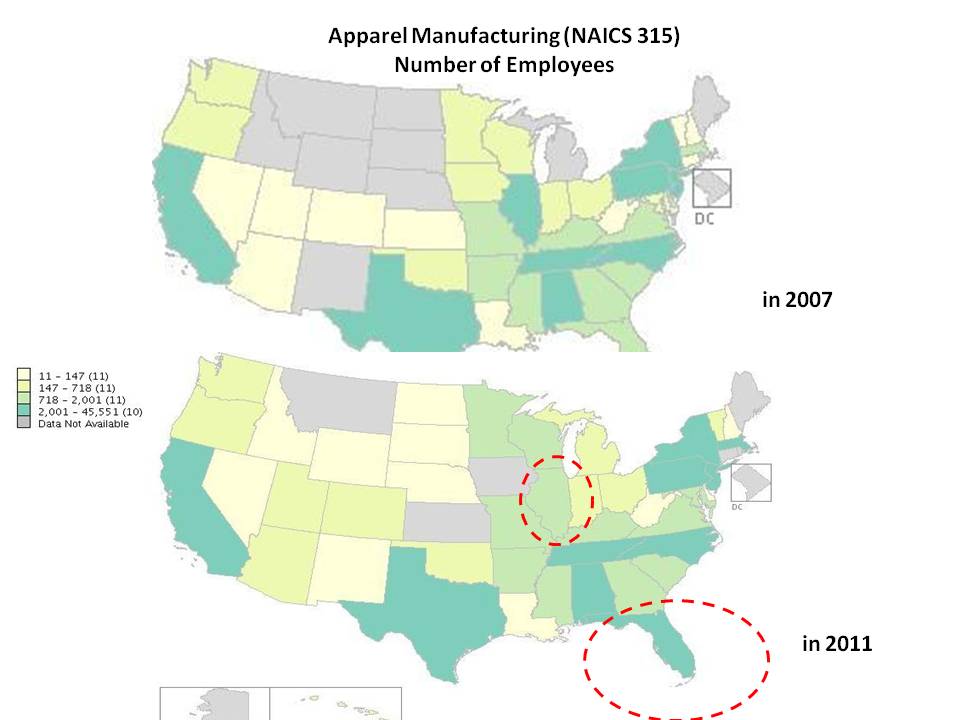
Last but not least, geographically, manufacturing jobs in the US textile and apparel industry were gradually moving from the North to the South from 2007 to 2011.


by Sheng Lu