
The following analysis is conducted based on the statistics released by the World Trade Organization on August 5, 2014.
1. Asia continues to dominate the world textile and apparel exports from 2012 to 2013.


2. Despite concerns about its rising labor cost, China continues to gain more market shares in world textile and apparel exports from 2012 to 2013.

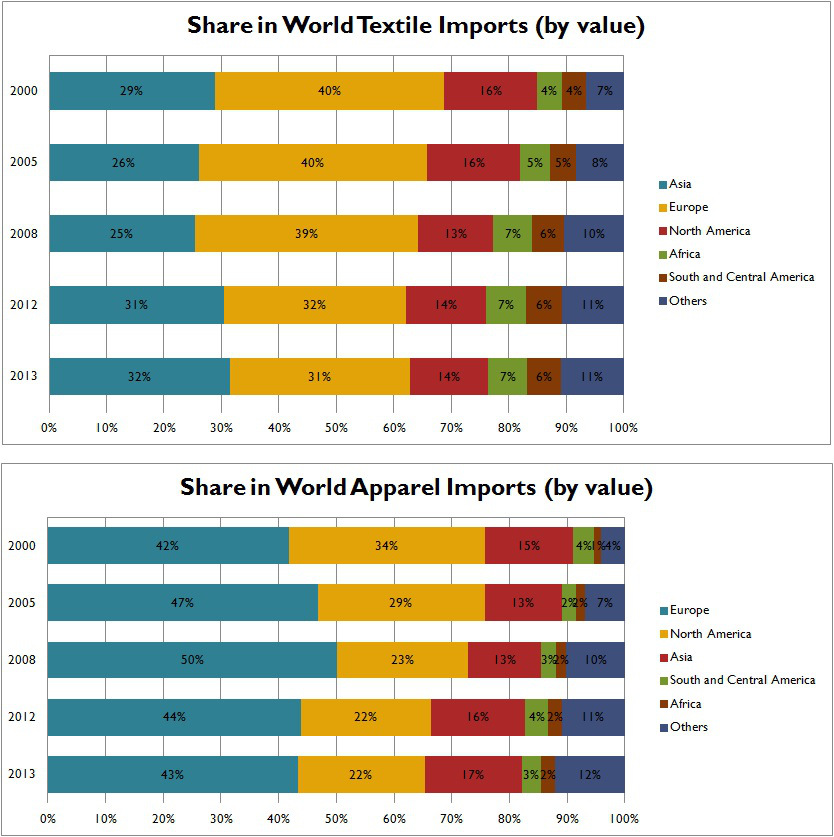
3. World market for textiles remains relatively stable from 2000 to 2013; world market for apparel is gradually shifting and diversifying. Although Europe and North America still account for lion’s shares in world apparel imports (due to their higher GDP per capita), Asia is the fast growing market.
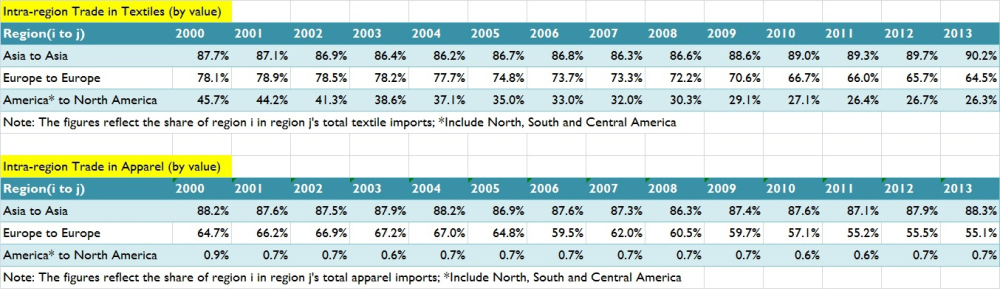
4. Intra-region trade remains a distinct pattern in world T&A trade, particularly in Asia, Europe and America. However, the pattern has become substantially weakened in Europe and America from 2000 to 2013, which could be the results of increasing number of FTAs in these regions.
5. US textile and apparel exports increased 3.3% and 4.4% respectively from 2012 to 2013. North America remains the single largest T&A export market for the United States.

by Sheng Lu

2 thoughts on “World Textile and Apparel Trade (Update: August 2014)”