
Free trade agreements (FTAs) are arrangement among two or more countries under which they agree to eliminate tariffs and non-tariff (NTB) barriers on trade among themselves (Cooper, 2014). Theoretically, companies shall be interested in increasing imports from FTA regions because of the duty-free treatment (i.e., the trade creation effect). Particularly, not paying import tariff duty can be a great cost advantage for textile and apparel (T&A) companies given the fact that the average US import tariff rate was still as high as 8% for textiles and 11.6% for apparel in 2016 (WTO, 2017).

Despite the potential benefit of using FTAs, data from the Office of Textiles and Apparel show that 85.7% of US T&A imports came from non-FTA regions in 2016. Interesting enough, although more FTAs have taken effect in the United States, T&A imported under FTA as a percent of total T&A imports dropped from 15.1% in 2008 to 14.3% in 2016.
Among the FTAs in force, the North American Free Trade Agreement (NAFTA) and the Dominican-Republic-Central America Free Trade Agreement (CAFTA-DR) altogether accounted for 75.9% of the value of total U.S. T&A imports under FTAs in 2016.

Statistics further reveal that sometimes companies did not claim duty free benefits of FTAs even though they imported T&A from the FTA region. For example, in 2016 about 29.9% of U.S. T&A imports from South Korea, 24.3% from CAFTA-DR and 16.3% from NAFTA and 12.9% from Columbia did not enjoy the duty free treatment granted by the respective FTAs.
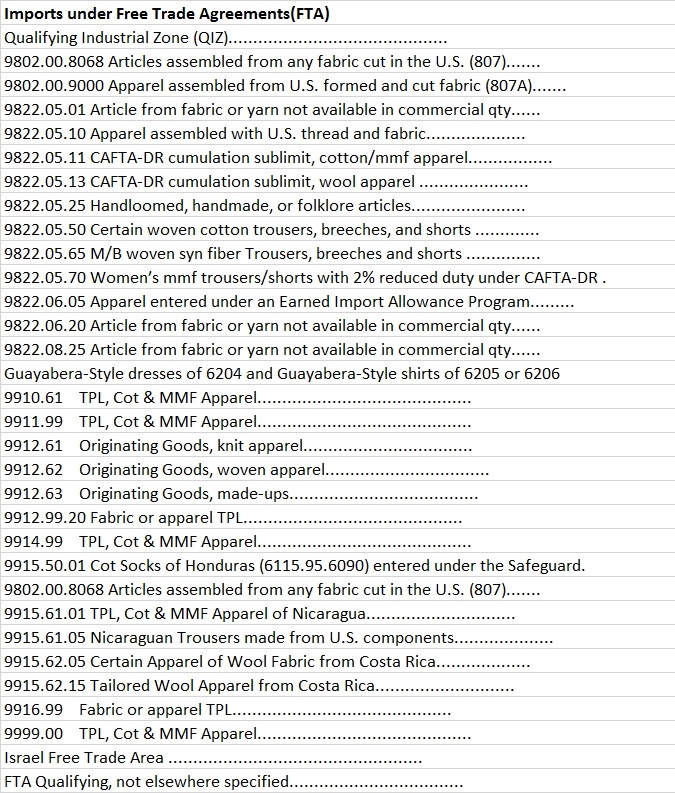
Some industry experts say the complex T&A rules of origin is a major factor why US T&A companies are not using FTAs enough. According to the Office of Textiles and Apparel (OTEXA), there are more than 20 different tariff lines dealing with various T&A rule of origin situations under respective FTAs.

Additionally, U.S. T&A importers seem to use the “short supply list” mechanism–an exception to the yarn forward rules of origin under FTAs, more actively. For example, in 2016 around 2.4% of US T&A imports under FTAs took advantage of the “short supply list” mechanism, increased from only 1.2% in 2008. Similarly, a record high of 6.2% of U.S. T&A imports under the CAFTA-DR used the short supply list in 2016.
Sheng Lu
