
In its annual release, the European Apparel and Textile Federation (Euratex) provides a skeletal statistical profile of the EU textile and apparel (T&A) in 2014. Most statistics cited in the report comes from the Eurostat.
Production
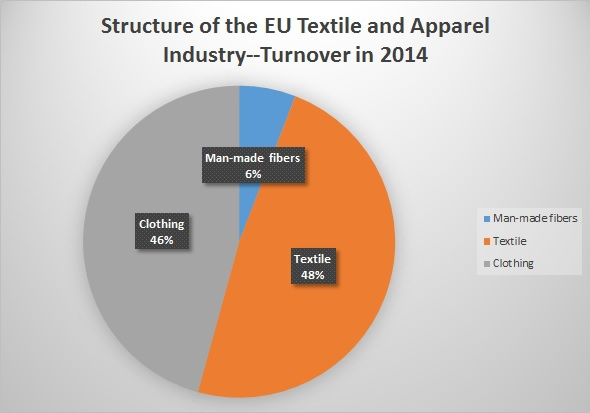
In 2014, T&A production in EU enjoyed a slight growth. Output of Man-made fiber (MMF), textile (yarns, fabrics and made-ups) and apparel went up by 2.8 percent, 2.8 percent and 1.9 percent respectively from a year earlier. In 2014, about 48 percent of T&A industry output was contributed by the textile sector, followed by the apparel sector (46 percent) and the MMF sector (6%).
Employment and productivity
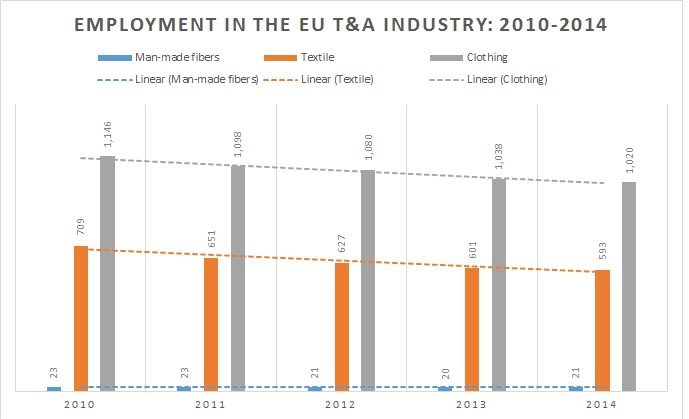
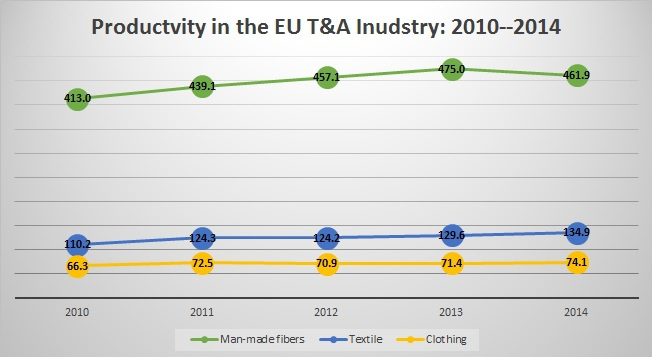
Employment in the EU T&A industry continues to move downward in size, shrinking from 1.66 million in 2013 to 1.63 million in 2014. The most significant drop happened in the apparel sector (-1.7%) and the textile sector (-1.3%), whereas employment in the MMF sector increased by 5 percent. As one important factor contributing to the job decline, productivity (measured by the value of output per person) in the EU T&A industry has constantly improved since 2010, especially in the textile sector (+22%).
Consumption
Consumption data in 2014 is not available yet. Value of T&A consumption in EU (28) stood at €483.9 billion in 2013, a slight increase of 0.2 percent from 2012.
Trade
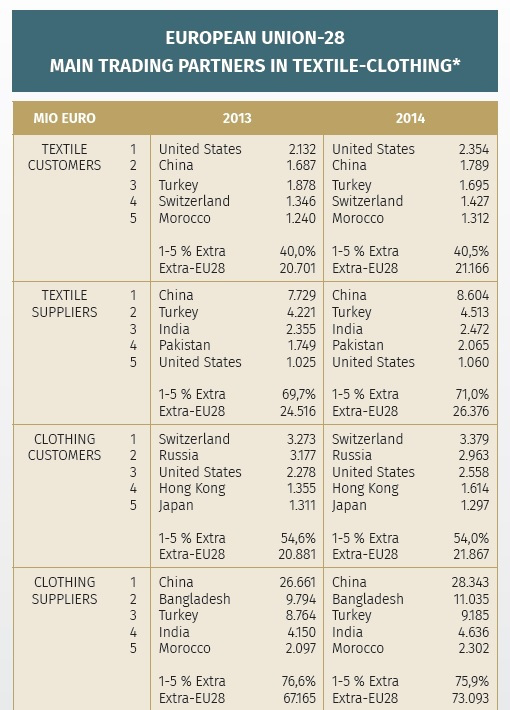
The two-way EU T&A trade enjoyed a robust growth from 2013 to 2014. Specifically, EU T&A exports increased by 3.5 percent (+2.2% for textile and +4.7% for apparel), which may attribute to the depreciation of euros against major currencies around the world. Interesting enough, EU’s T&A imports went up even faster in 2014—an overall 8.5 percent increase from 2013 (+7.6% for textile and +8.8% for apparel). With regard to EU’s key trading partners:
- China remained THE dominant external T&A supplier for EU in 2014. However. China’s market share in the EU apparel import market declined from 39.7 percent in 2013 to 38.8 in 2014, whereas China’s share in the EU textile import market went up from 31.5 percent to 32.6 percent. It seems China is gradually shifting towards more textile exports and less for apparel along with its industry adjustment in recent years.
- The United States remained the largest textile export market (11.1%) and the 5th largest apparel export market (11.7%) for EU in 2014. In the meanwhile, the United States is the 5th largest supplier of textiles to EU (however, U.S. market share declined from 4.0% in 2013 to 4.2% in 2014).
- Bangladesh’s apparel exports to EU increased by 12.7 percent from 2013 to 2014, which helped Bangladesh gained 15.1% market share, up from 14.6% a year earlier.

One thought on “Euratex Releases Key Indicators of the EU Textile and Apparel Industry in 2014”