
The updated version is available HERE
The following analysis is from the latest Just-Style Op-ed Is China Losing Its Edge as a US Apparel Supplier.
A fact-checking review of trade statistics in 2016 of a total 167 categories of T&A products categorized by the Office of Textiles and Apparel (OTEXA) suggests that textile and apparel (T&A) “Made in China” have no near competitors in the U.S. import market. Specifically, in 2016:

- Of the total 11 categories of yarn, China was the top supplier for 2 categories (or 18%);
- Of the total 34 categories of fabric, China was the top supplier for 25 categories (or 74%);
- Of the total 106 categories of apparel, China was the top supplier for 88 categories (or 83%);
- Of the total 16 categories of made-up textiles, China was the top supplier for 12 categories (or 68%);
In comparison, for those Asian T&A suppliers regarded as China’s top competitors:
- Vietnam was the top supplier for only 5 categories of apparel (less than 5% of the total);
- Bangladesh was the top supplier for only 2 categories of apparel (less than 2% of the total)
- India was the top supplier for 2 categories of fabric (9% of the total), one category of apparel (1% of the total) and 5 categories of made-up textiles (41.7% of the total)

Notably, China not only was the top supplier for many T&A products but also held a lion’s market shares. For example, in 2016:
- For the 34 categories of fabric that China was the top supplier, China’s average market shares reached 41%, 23 percentage points higher than the 2nd top suppliers for these categories
- For the 88 categories of apparel that China was the top supplier, China’s average market shares reached 53%, 38 percentage points higher than the 2nd top suppliers for these categories.
- For the 16 categories of made-up textiles that China was the top supplier, China’s average market shares reached 57%, 40 percentage points higher than the 2nd top suppliers for these categories.
It is also interesting to see that despite the reported rising labor cost, T&A “Made in China” are NOT becoming more expensive. On the contrary, the unit price of U.S. T&A imports from China in 2016 was 6.8% lower than a year earlier, whereas over the same period the unit price for U.S. T&A imports from rest of the world only declined by 2.9%.
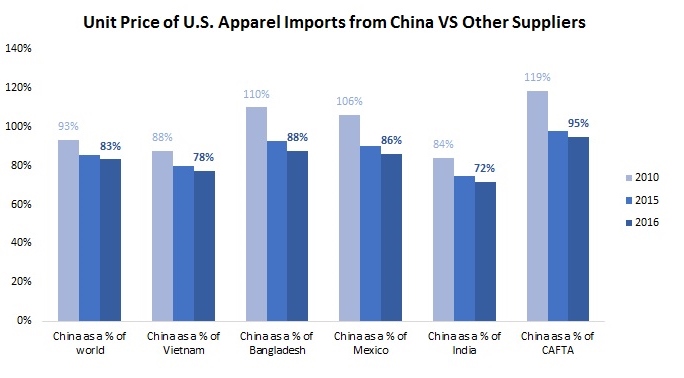
Furthermore, T&A “Made in China” are demonstrating even bigger price competitiveness compared with other suppliers to the U.S. market. For example, in 2016, the unit price of “Made China” was only 78% of the price of “Made in Vietnam” (in 2012 was 89%), 88% of “Made in Bangladesh” (in 2012 was 100%), 86% of “Made in Mexico” (in 2012 was 103%) and 72% of “Made in India” (in 2012 was 81%).
Are the results surprising? How to explain China’s demonstrated price competitiveness despite its reported rising labor cost? What’s your outlook for the future of China as a sourcing destination for U.S. fashion brands and retailers? Please feel free to share your views.
