


The value of U.S. textile imports totaled $27,461 million in 2019, down 2.3 percent from 2018. This is the first time since 2016 that U.S. textile imports incurred a negative growth, which could be related to the slowed U.S. domestic textile and apparel production. Meanwhile, the value of U.S. apparel imports reached $83,822 million in 2019, up 1.2 percent from a year earlier but was substantially lower than a 3.4% growth between 2017 and 2018. Despite the trade uncertainties, the U.S. apparel imports overall still mirror the trend of apparel retail sales in the U.S. market.
Looking ahead, while the reaching of the “phase one” U.S.-China trade deal was a relief to U.S. fashion companies, the unexpected outbreak of the coronavirus in China since January and its fast spread had cast a new shadow on the outlook of the world economy. U.S. Fed Chairman Jerome Powell recently cited the prospect of a hit to tourism, exports and financial markets as ways the coronavirus could dent U.S. economic growth. As a consequence, the value of U.S. textile and apparel imports in 2020 could grow at a more modest rate than previously expected.

Because the United States is no longer a major apparel manufacturer but one of the largest apparel consumption markets in the world, apparel products accounted for 75.3 percent of total U.S. textile and apparel imports in 2019, followed by made-up textiles (17.9 percent), fabrics (5.6 percent) and yarns (1.2 percent). This structure has remained quite stable over the past decade.
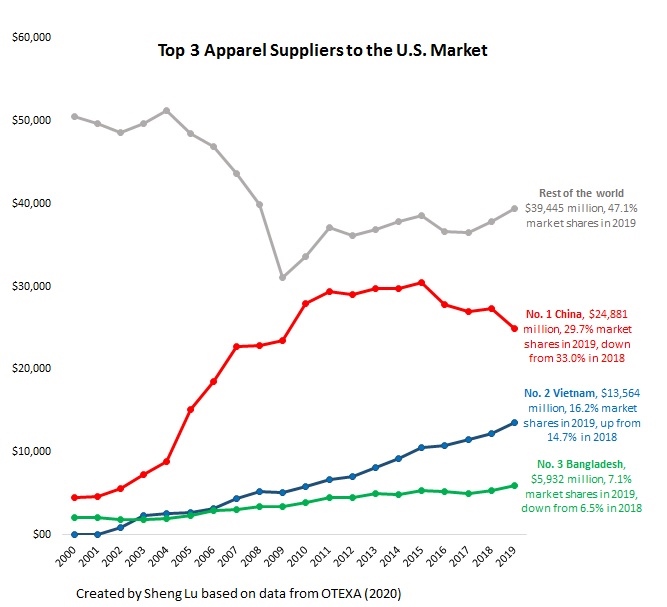
The U.S. imported apparel from more than 150 countries in 2019. Meanwhile, the Herfindahl index declined from 0.269 in 2010 to 0.253 in 2019, suggesting that overall the U.S. apparel import market is becoming less concentrated. This result is consistent with some recent studies, which show that U.S. fashion brands and retailers continue to diversify their sourcing bases gradually. Reducing the dependence on sourcing from China, catering to the increasing demand for speed to market and fulfilling the market expansion needs were among the top-cited reasons for companies’ sourcing diversification strategy.
Specifically, all top apparel suppliers to the United States in 2019 (by value) were developing countries and most of them were located in Asia, including China (29.7%, down from 33.0% in 2018), Vietnam (16.2%, up from 14.7% in 2018), Bangladesh (7.1%, up from 6.5%), Indonesia (5.3%, down from 5.4% in 2018), India (4.8%, up from 4.6% in 2018) and Mexico (3.7%, down from 4.0% in 2018).
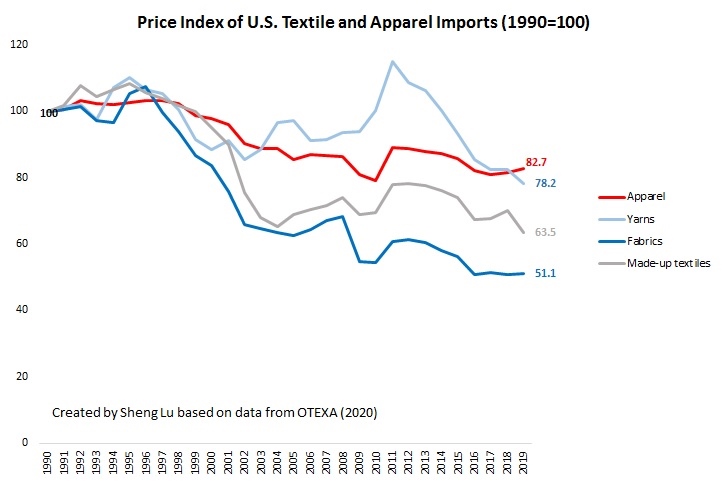
Except for China, the average unit price of U.S. apparel imports from other major sources all went up in 2019, including Vietnam (up 4.6%), Bangladesh (up 5.6%), Indonesia (up 2.1%), India (up 3.1%), Cambodia (up 7.5%) and CAFTA-DR members (up 4.4%). The results suggest that U.S. fashion brands and retailers had to pay a higher price when they move their sourcing orders from China to other alternatives, due to much smaller production capacity and more costly raw material supply there.
Additional reading: US apparel Sourcing Patterns are Changing. Here is How (by Sheng Lu, on just-style). Key findings:
- Consumption demand remains the most significant factor in shaping the volume of U.S. apparel imports. Between 2010 and 2019, the value of U.S. apparel retail sales always stayed at around three times as much as the value of U.S. apparel imports. Over the same period, the amount of U.S. apparel retail sales and apparel imports also changed in the same direction, and both enjoyed a roughly 3.0% annual growth on average. Such a synchronized move reminds us about the buyer-driven nature of the apparel business today and explains why this industry is so sensitive towards the health of the national economy.
- The U.S.-China tariff war had resulted in a change of the seasonal patterns for apparel sourcing and shipment. While July to October used to be the busiest time for U.S. fashion brands and retailers to receive their sourcing orders from China, in 2019 the peak season started earlier in June and ended in September–mostly because U.S. fashion companies tried to avoid the hit of the proposed 15% Section 301 punitive tariffs on Tranche 4A products, which covered most apparel items. For the same reason, U.S. apparel imports from China in November and December 2019 were much lighter than usual.
- U.S. fashion brands and retailers continue to diversify their sourcing base, yet the options available remain limited. The lack of qualified alternatives to “Made in China” is one big challenge. Despite the hundreds of apparel exporting countries in the world, only nine of them met the following two criteria: 1) enjoyed a 5% or higher growth of their apparel exports to the U.S. for two consecutive years since 2017; 2) achieved a minimum 1% market share as of 2019. Of these nine countries, only Vietnam, Bangladesh, and Cambodia ranked the top 10 apparel suppliers for the U.S. market in 2019.
- U.S. fashion brands and apparel retailers increasingly source both from Asia and the Western Hemisphere, but for different purposes. Notably, the value of export similarity index (ESI) between China and the Western Hemisphere was as low as 40.8 in 2015 and went down further to only 39.6 in 2019, suggesting their export product structure had turned even more heterogeneous. In contrast, between 2015 and 2019, China, ASEAN (whose members include leading apparel exporting countries such as Vietnam, Indonesia, Cambodia, Malaysia, and Thailand) and Bangladesh appear to export increasingly similar products to the United States. This explained why Asian suppliers rather than NAFTA and CAFTA-DR members saw their apparel exports to the United States increased in 2019 as a result of the U.S.-China tariff war.

Very interesting article and very well researched. Enjoyed reading!