USITC Reports the Economic Impacts of U.S. Free Trade Agreements

In June 2021, the U.S. International Trade Commission (USITC) released the 2021 Economic Impact of Trade Agreements Implemented under Trade Authorities Procedures report. By using both qualitative and quantitative methods, USITC assessed the impact of trade agreements on U.S. industries, including workers, since 2016. Below are the key findings related to the textile and apparel sector:

First, free trade agreements enacted in the U.S. have had a small but positive effect on the U.S. economy and trade. As of January 1, 2021, the United States has 14 free trade agreements (FTAs) with 20 countries in force. In the year 2017 (the base year), they led to an estimated increase in U.S. real Gross Domestic Product (GDP) of $88.8 billion (0.5 percent), and in aggregate U.S. employment of 485,000 full-time equivalent (FTE) jobs (0.3 percent). Real wages increased by 0.3 percent. Further, U.S. exports increased by $37.4 billion (1.6 percent), and imports increased by $95.2 billion (3.4 percent) because of these FTAs.

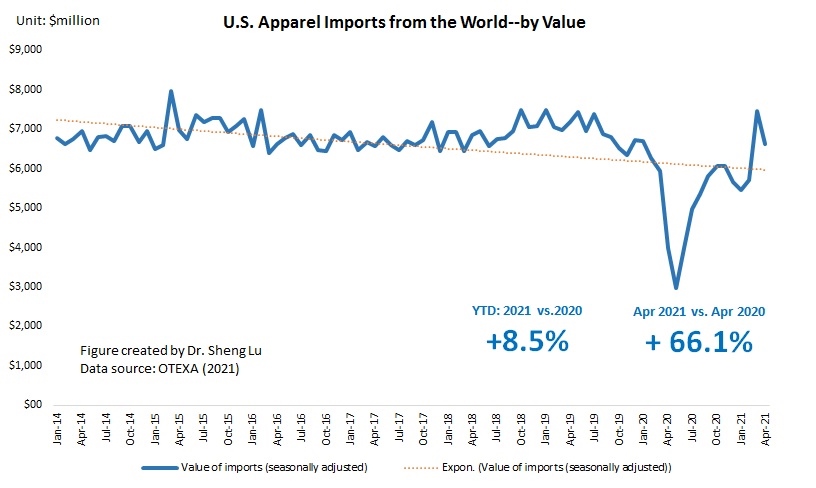
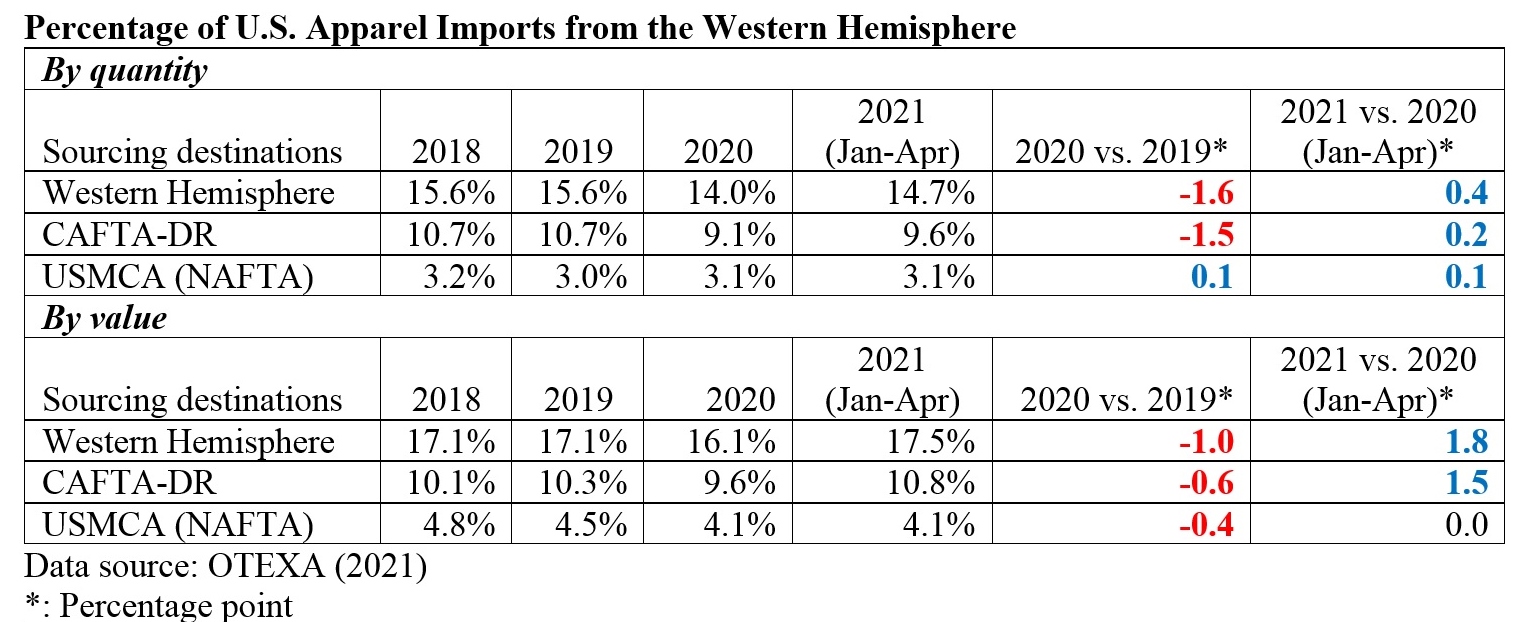
Second, USITC estimates that U.S.-free trade agreements have expanded the U.S. textile industry but hurt U.S. domestic apparel production. Thanks to the North American Free Trade Agreement (NAFTA, now the U.S.-Mexico-Canada Trade Agreement, USMCA) and the Dominican Republic-Central America Free Trade Agreement (CAFTA-DR), the Western Hemisphere has become the single largest export market for U.S. textile producers. However, U.S. apparel manufacturers have to face intensified import competition.

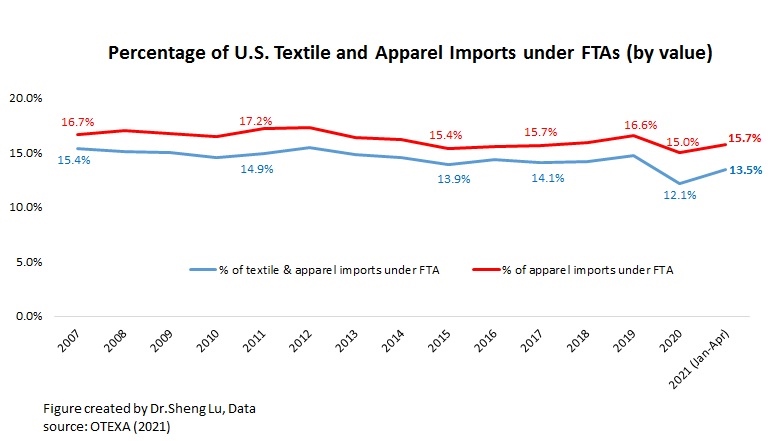
Third, the textile and apparel-specific rules in U.S. free trade agreements are complicated and often hinder the usage of the trade agreements. As noted by USITC, the U.S. duty on imported textile and, especially, apparel goods are among the highest of all product categories. Despite the duty-saving incentives, only 12.1% of U.S. textile and apparel imports came in under FTAs in 2020, even lower than 16.7% in 2007 when fewer FTAs were in force.

The complexity of the textile and apparel-specific rules of origins (ROOs) is a significant cause of the low FTA utilization rate. As USITC noted, “No two FTAs using the tariff shift model contain the same ROOs for apparel goodsfor some importers, the strict preference rules of origins (ROOs), along with the record-keeping and documentation requirements the rules entail, make the cost of compliance too great to take full advantage of the duty-free opportunities.” According to the annual USFIA fashion industry benchmarking study, the surveyed U.S. fashion companies consistently expressed the same concerns about the too restrictive ROOs in U.S. FTAs.

Related, the USITC report noted, “some U.S. domestic textile industry representatives state that the existing FTA rules follow a simple template designed to benefit upstream manufacturers in the textile and apparel supply chain.” Having to use more expensive domestic-made fibers and yarns reduces the price competitiveness of U.S. fabrics and home textiles in the export market.

Further, the USITC report explains the history of the “Short supply” and “Tariff-preference level, TPL” mechanisms in U.S. free trade agreements. However, the report does not provide an assessment of their trade impacts.

Trade statistics show that these exceptions to the restrictive “yarn-forward” rules of origin are critical for U.S. apparel sourcing from certain FTA partners. For example, more than 60% of U.S. apparel imports from Canada claimed duty-free benefits by using the TPL mechanism rather than complying with the USMCA/NAFTA “yarn-forward” rules in 2020.  Around 8% of U.S. apparel imports from Mexico did the same. Likewise, in 2020, approximately 4% of U.S. apparel imports from CAFTA-DR members used the “short supply” mechanism, and the other 4% used the “cumulation” mechanism.

COVID-19 and U.S. Apparel Imports: Key Trends (Updated: June 2021)

First, thanks to consumers’ resumed demand and a more optimistic outlook for the U.S. economy, U.S. apparel imports continue to rebound. However, uncertainties remain. On the one hand, mirroring retail sales patterns, the value of U.S. apparel imports in April 2021 went up by 66% from a year ago, a new record high since the pandemic. The absolute value of U.S. apparel imports so far in 2021 (January –April) also recovered to around 88% of the pre-Covid level (i.e., January to April 2019). However, the value of U.S. apparel imports in April 2021 was 11.2% lower than in March 2021 (seasonally adjusted), suggesting that the market environment is far from stable yet as the COVID situation in the U.S. and other parts of the world continue to evolve.

Second, data indicates that Asia as a whole remains the single largest sourcing base for U.S. fashion companies, stably accounting for around 72-75% of the import value. Studies show that two factors, in particular, contribute to Asia’s competitiveness as a preferred apparel sourcing base—price and flexibility & agility.  Asia’s highly integrated regional supply chains and its vast production capacity shape its competitiveness in these two aspects.

However, the recent surge of COVID cases in India and its neighboring Southeast Asian countries has raised new worries about the potential sourcing risks and supply chain disruptions for U.S. fashion companies currently sourcing from there.  

Third, as the direction of the US-China relations becomes ever more concerning, U.S. fashion companies seem to accelerate diversifying sourcing from China. Even China remains the top apparel supplier for the U.S. market, from January to April 2021, China’s market shares fell to 32.1% in quantity (was 36.6% in 2020) and 20.2% in value (was 23.7% in 2020).  Also, the HHI index and market concentration ratios (CR3 and CR5) suggest that US fashion companies are increasingly moving their apparel sourcing orders from China to other Asian countries. For example, according to a leading U.S. fashion corporation in its latest annual report, “in response to the recent tariffs imposed by the current US administration, the Company has reduced the amount of goods being produced in China.”

Further, the latest data suggests that the concerns about the alleged forced labor in Xinjiang hurt China’s prospect as an apparel sourcing destination, BOTH for cotton and non-cotton items. Measured by value, only 11.9% of U.S. cotton apparel came from China in April 2021, a new record low since implementing the CBP WROs, which impose a regional ban on any cotton and cotton apparel made in the Xinjiang region. The latest data also suggests that China is quickly losing market shares for non-cotton textile and apparel items.

Fourth, U.S. apparel sourcing from CAFTA-DR members gains new momentum, reflecting the strong interest in sourcing more from the region from the business community and policymakers. For example, 17.5% of U.S. apparel imports came from the Western Hemisphere in 2021 (Jan-Apr), higher than 16.1% in 2020 and 17.1% before the pandemic. Notably, CAFTA-DR members’ market shares increased to 10.8% in 2021 (Jan-Apr) from 9.6% in 2020. The value of U.S. apparel imports from CAFTA-DR also enjoyed a 25.8% growth in 2021 (Jan-Apr) from a year ago, one of the highest among all sourcing destinations. The imports from El Salvador (up 29.2%), Honduras (up 28.0%), and Guatemala (27.0%) had grown particularly fast in 2021.

Meanwhile, U.S. apparel imports from USMCA members stayed stable overall. CAFTA-DR and USMCA members currently account for around 60% and 25% of U.S. apparel imports from the Western Hemisphere. They are also the single largest export market for U.S. textile products (around 70%). The Biden administration has signaled its strong interest in strengthening the western hemisphere textile and apparel supply chain by leveraging CAFTA-DR along with other trade policy tools.

by Sheng Lu