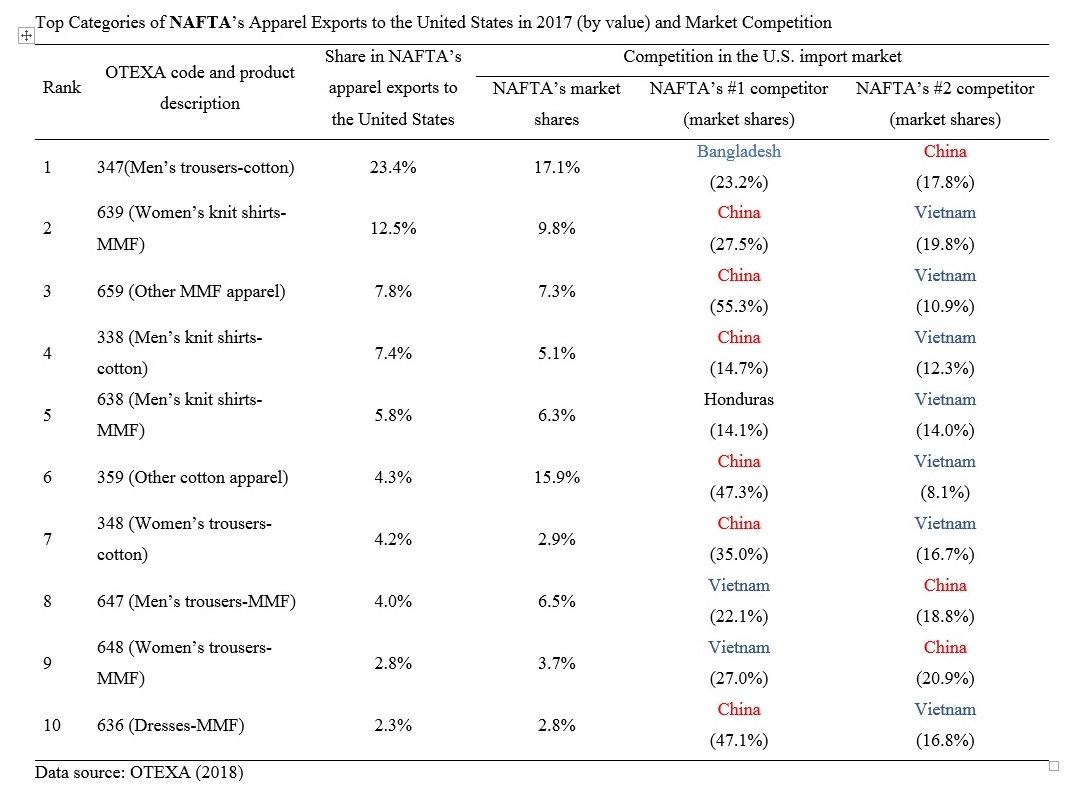
Competition in the U.S. Apparel Import Market (Updated March 2018)
FASH455 Global Apparel & Textile Trade and Sourcing
Copyright© 2012-2026 Dr. Sheng Lu, Professor, Department of Fashion & Apparel Studies, University of Delaware


The latest Just-Style State of Sourcing Survey suggests a few trends of apparel sourcing in 2018:
First, apparel companies are attaching greater importance to speed-to-market in their sourcing decisions. According to the result, the need for a faster, more responsive supply chain is being driven by consumers’ increasing demands for immediacy and constant newness, as well as the speed with which social media can spread new trends.
Second, respondents say the rising sourcing and production cost remains one of their top business challenges in the New Year. Key drivers of cost increase include wage of production workers, raw material price and the social and environmental compliance cost. Notably, almost half expect their sourcing budget to go up, with 15.3% seeing an increase of more than 5%, and 32.8% anticipating a rise of between 1% and 5%. A further 32.1% see their budgets staying the same in the year ahead.
Third, the survey result confirms that China’s dominance of global apparel manufacturing is unlikely to change anytime soon. Asked about their China sourcing plans in 2018, 21.1% of respondents said they would buy more here over the next 12 months, some 30.5% expect their China sourcing to remain roughly the same year-on-year, and 28.9% expect to source less. Respondents say that “no other country can match China regarding the size of its supply base, its range of skills, its quality levels, its product variety and the completeness of its supply chain. The country also continues to lead the way when it comes to efficiency and infrastructure.” Meanwhile, Bangladesh and Vietnam continue to be seen as the two sourcing markets most likely to grow in importance in the next five years.
Fourth, respondents also expressed concerns about uncertainty over trade agreements (64.5%), particularly how the Trump Administration may do with the North American Free Trade Agreement (NAFTA). However, the impact of uncertainty created by Brexit seems to be limited.
Speakers:
Discussion questions:
Panel:
Topic discussed
State of Vietnam’s Textile and Clothing Industry
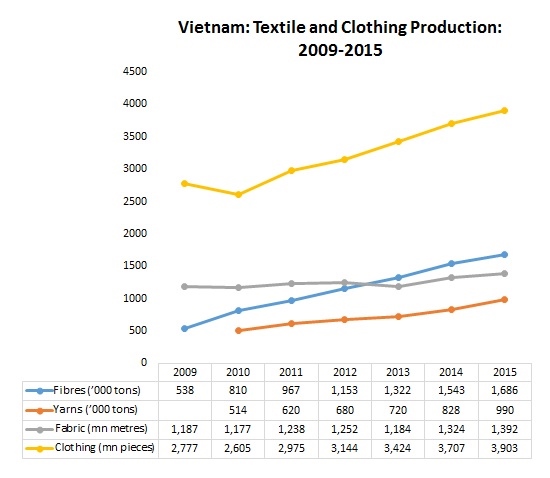
Vietnam has a substantial textile and clothing industry comprising around 4,000 enterprises, of which the majority were located in the country’s two principal population centers—Ho Chi Minh City and Hanoi. Around 70% of these enterprises were involved in the manufacture of clothing. A further 17% were involved in the fabric sector, 6% in the yarn sector, 4% in the dyeing sector and 3% in the accessories sector.
It is estimated that around 70% of Vietnam’s textile and clothing production is dependent on the cut and trims operations, using imported textiles and other inputs predominantly from China. This problem is not limited to a single category as the country needs to import man-made fibers, yarns, fabrics, and accessories as well as raw cotton.
The dyeing and finishing segments of the supply chain remain fairly underdeveloped. In the past, the Vietnamese government has issued tightly controlled permits for these operations. Also, there has been a deficiency of investment in these segments because of unclear regulations, and this has resulted in a bottleneck in the supply chain.
Similarly, high added-value design and “downstream” activities rely on the input of foreign companies are also underdeveloped. Consequently, in carrying out these activities, the industry relies heavily on the help or participation of foreign companies.
State of Vietnam’s Textile and Apparel Export
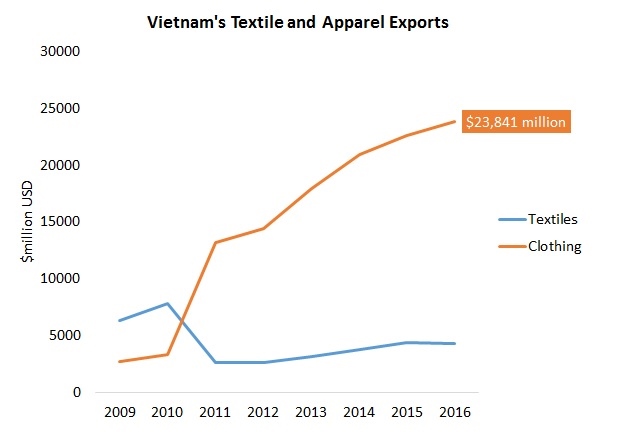
Vietnamese textile and clothing exports began to gain momentum in 2001 when trading relationships were established with Western countries (e.g., the US-Vietnam Textile Agreement). The industry’s exports received a further boost after Vietnam joined the World Trade Organization (WTO) at the start of 2007, and the quotas which had been restricting imports of Vietnamese goods in the US market were eliminated.
In 2016, Vietnam’s textile and clothing exports totaled $28 billion (84% were clothing), which represented 16.0% of Vietnam’s total merchandise exports. Globally, Vietnam was the world’s third largest apparel exporter in 2015, after China and Bangladesh (WTO, 2016).
The Vietnam Textile & Apparel Association (VITAS) expects Vietnam’s textile and clothing exports to enjoy an average 15% annual growth in the next four years and exceed $50 billion USD by 2020.
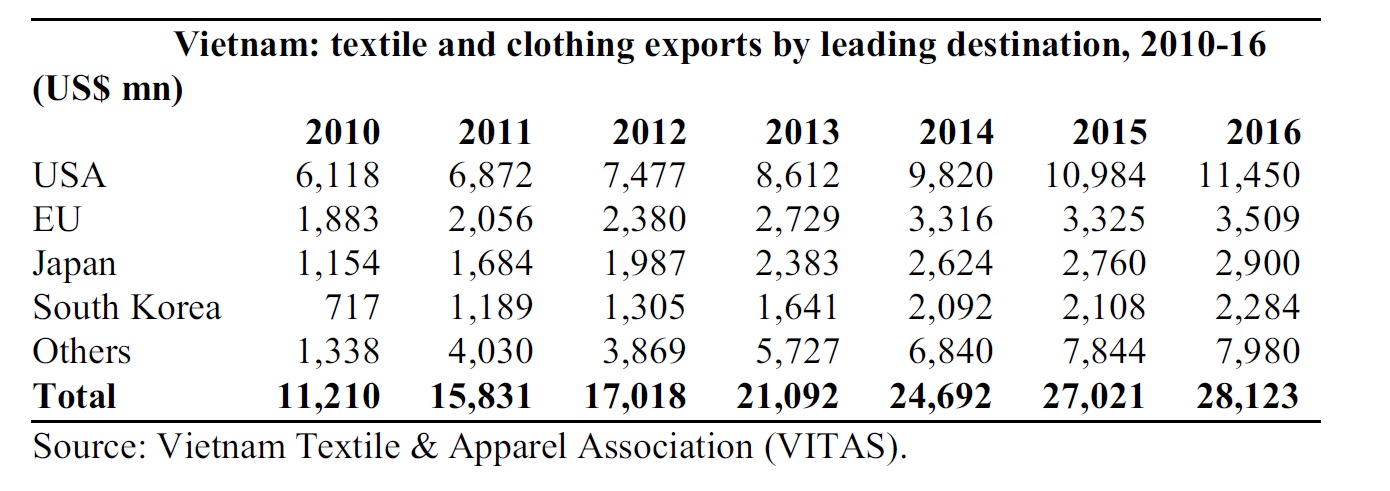
Vietnam’s textile and clothing exports went to around 180 countries. The United States is Vietnam’s top export market (around 40%), followed by the EU (around 12.5%), Japan (10.3%) and South Korea (8.1%).
Outlook of Sourcing from Vietnam by US Fashion Companies
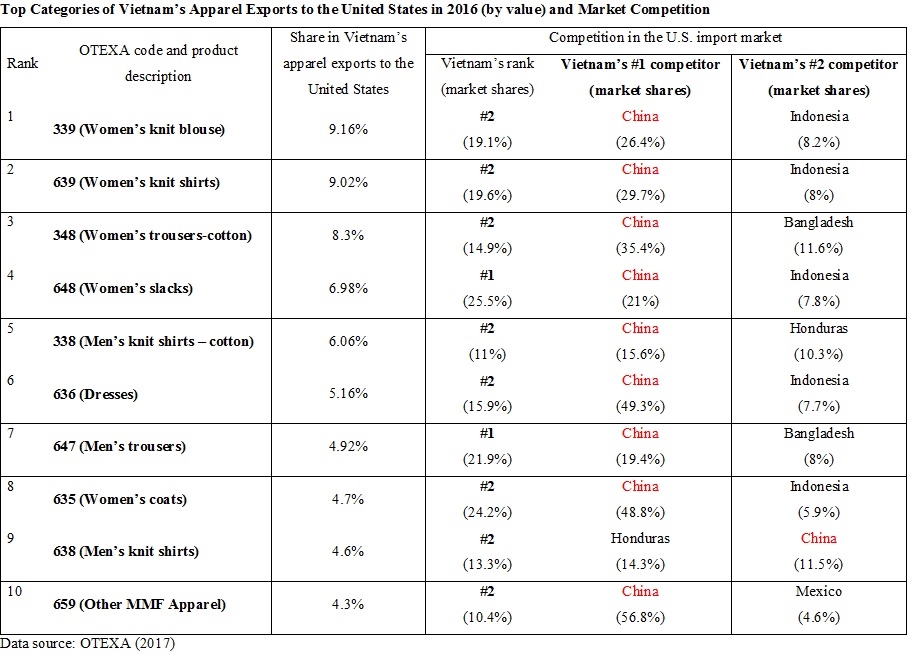
According to the 2017 US Fashion Industry Benchmarking Study, Vietnam is the 2nd most used sourcing destination by respondents. Particularly, the most commonly adopted sourcing model is shifting from “China Plus Many” to “China Plus Vietnam Plus Many”:
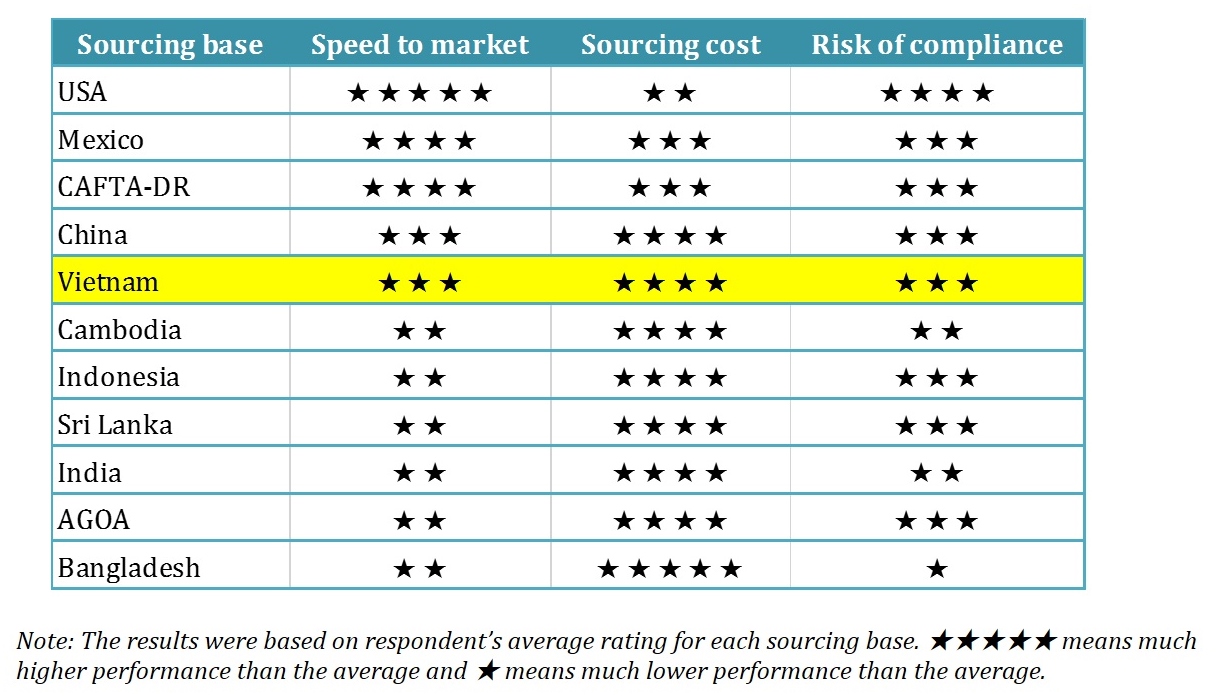
Respondents also see Vietnam overall a balanced sourcing destination, regarding “speed to market”, “sourcing cost” and “compliance risk”.
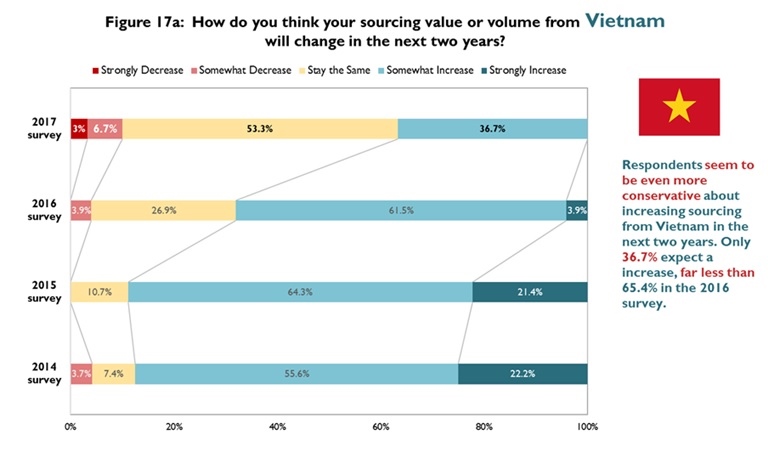
Additionally, U.S. fashion companies intend to source more from Vietnam through 2019, but imports may grow at a relatively slow pace, possibly due to the United States’ withdrawal from the Trans-Pacific Partnership (TPP) and the increasing labor costs in the country.
References:Textile Outlook International (2017); WTO (2017); UN Comtrade (2017)
The 2018 U.S. Fashion Industry Benchmarking Study is now available. 
The report can be downloaded from HERE
Key findings of the study:
While the majority of respondents remain confident about the five-year outlook for the U.S. fashion industry, the percentage of those who are “optimistic” or “somewhat optimistic” dropped to a record low since we began conducting this study in 2014. This change could be due to concerns about the “protectionist trade policy agenda in the United States” and “market competition in the United States from e-commerce,” the top two concerns this year.
Although U.S. fashion companies continue to seek alternatives to “Made in China,” China’s position as the top sourcing destination remains unshakable. Meanwhile, sourcing from Vietnam and Bangladesh may continue to grow over the next two years, but at a relatively slow pace.
U.S. fashion companies continue to maintain truly global supply chains.
Today, ethical sourcing and sustainability are given more weight in U.S. fashion companies’ sourcing decisions. Respondents also see unmet compliance (factory, social and/or environmental) standards as the top supply chain risk.
Free trade agreements (FTAs) and trade preference programs remain underutilized, and several FTAs, including CAFTA-DR, are utilized even less this year than in previous years.
Respondents unanimously oppose the U.S. border adjustment tax (BAT) proposal and call for the further removal of trade barriers, including restrictive rules of origin and high tariffs.
The benchmarking studies from 2014 to 2016 can be downloaded from https://www.usfashionindustry.com/resources/industry-benchmarking-study

U.S. textile and apparel imports enjoy steady growth from 2000 to 2015. Specifically, the value of U.S. textile imports reached $26,763 million in 2015, up 4.2 percent from 2014 and 85.1 percent from 2000. The value of U.S. apparel imports reached $85,165 million in 2015, up 4.1 percent from 2014 and 48.8 percent from 2000. It is forecasted that the value of U.S. textile and apparel imports could reach $27,355 million (up 2.2 percent) and $85,719 million (up 0.7 percent) respectively in 2016.

Because the United States is no longer a major apparel manufacturer but one of the largest apparel consumption markets in the world, apparel products accounted for 76.1 percent of total U.S. textile and apparel imports in 2015, followed by made-up textiles (16.9 percent), fabrics (5.8 percent) and yarns (1.3 percent).

In terms of source of products, U.S. imported apparel from as many as 150 countries in 2015. However, Herfindahl index reached 0.15 for knitted apparel (HS chapter 61) and 0.18 for woven apparel (HS chapter 62) in 2015, suggesting this is a market with a high concentration of supplying countries. Specifically, all top apparel suppliers to the United States in 2015 (by value) are developing countries and most of them are located in Asia, including China (35.9 percent), Vietnam (12.4 percent), Bangladesh (6.3 percent), Indonesia (5.8 percent), India (4.3 percent) and Mexico (4.2 percent).
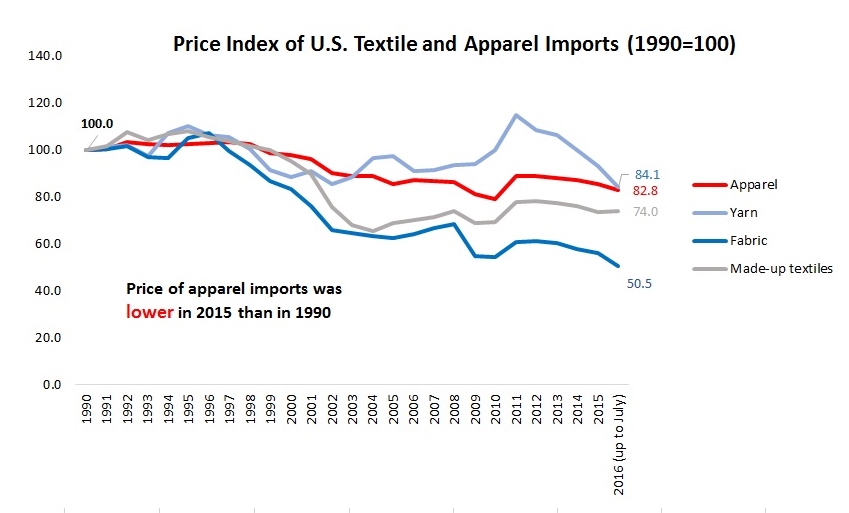
U.S. textile and apparel imports are also becoming even cheaper. For example, U.S. apparel imports in 2015 on average was only 85.7 percent of the price in 1990 and the price of imported fabrics cut almost by half over the same period.

From 2013 to 2015, the fastest growing textile and apparel import categories unusually include several fabric products, such as blue denim (OTEXA code 225, up 74.8%), Cheesecloths (OTEXA code 226, up 74.3%) and woven fabrics (OTEXA code 611, up 49.3%). It is likely that the growing business of apparel “Made in USA” has led to an increased demand for imported fabrics.
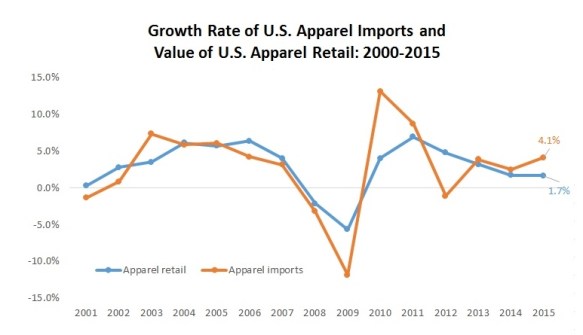
Additionally, U.S. apparel imports overall mirror the pattern of apparel retail sales in the U.S. market. This reflects the fact that the performance of the U.S. economy is the leading factor shaping the size of demand for imported apparel. It is also interesting to note that the value of U.S. apparel imports grew at a faster rate than the value of U.S. apparel retail sales in 2015 (4.1 percent v.s. 1.7 percent), suggesting import penetration ratio (i.e. the percentage of apparel consumed in the United States that is supplied by imports) continues to rise.
Data source: Office of Textiles and Apparel (OTEXA), U.S. Department of Commerce
by Sheng Lu
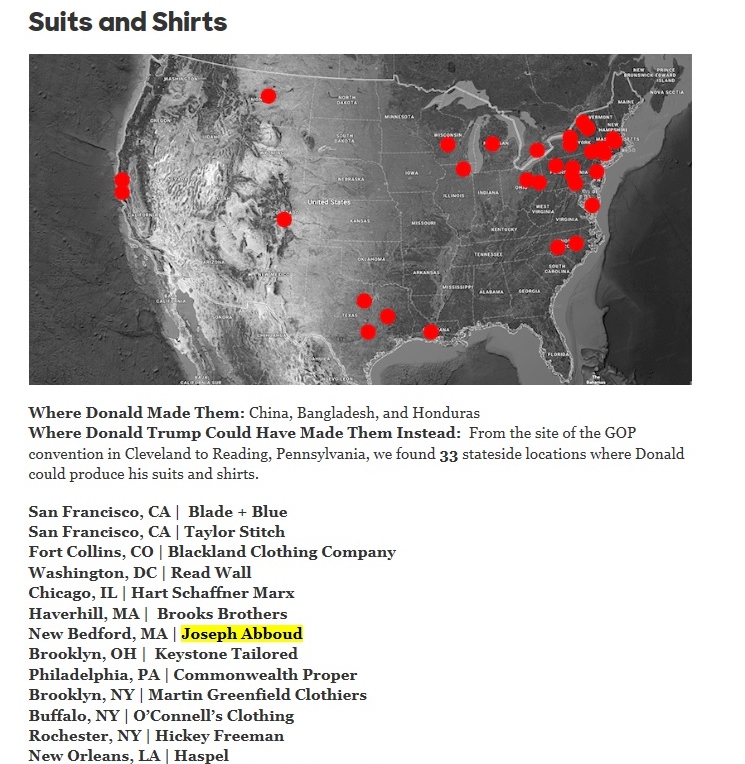
Presidential candidate Hillary Clinton recently launched a new website “Made In America: A Buyer’s Guide for Donald Trump”, which highlighted hundreds of U.S. manufacturers for products ranging from men’s ties, suits to furniture.
Joseph Abboud is one of the companies highlighted by the website for making “Made in America” suites and shirts. But does “Made in America” mean a Joseph Abboud branded suit or shirt is 100% made in the United States from yarns, fabrics to the cut-and-sew process? Not necessarily!

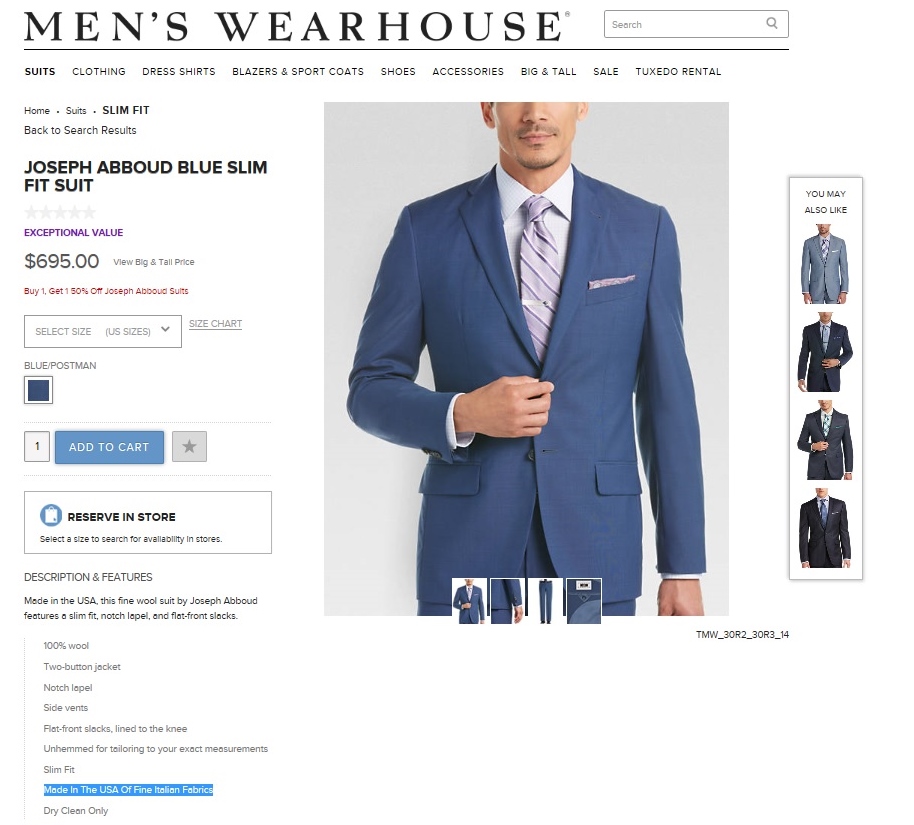
According to information submitted by Joseph Abboud to the “Made in USA” database managed by the Office of Textiles and Apparel under the U.S. Department of Commerce, some of its products actually are “partially made in U.S.A. with imported fabrics”.
This is evidenced both by Joseph Abboud’s product label and information provided by some retailers which sell Joseph Abboud’s branded products (See pictures below).

Hamilton Shirts of Houston is another company highlighted by Clinton’s “Made in USA” website. But similar as the case of Joseph Abboud, a Hamilton branded shirt priced at $215-$245 is typically “Hand cut and sewn in the USA. 100% cotton Italian fabric.”

Actually, Joseph Abboud is a brand owned by JA Holding, Inc., which was acquired by Tailored Brands for $94.9 million on August 6, 2013. As of June 2016, Tailored Brands also owns the Men’s Wearhouse and Jos. A. Bank.
Like most other US apparel companies/fashion brands today, Tailored Brands commits to global sourcing. In fiscal year 2015, the company “sourced approximately 60% of direct sourced merchandise from Asia (36% from China) while 13% was sourced in the U.S., 12% in Mexico, and 15% was sourced in other regions.” (Source: Tailored Brands Annual Report, 2015)
Tailored Brands uses the factory in New Bedford, MA (the one highlighted by Clinton’s website) to make tailored clothing under the Joseph Abboud label, including designer suits, tuxedos, sport coats and slacks which they sell in Men’s Wearhouse stores as well as Joseph Abboud’s flagship store. Tailor Brands also sells Joseph Abboud branded products in Moores stores, which are made in Canada by a third party.
Related article: Clothing Label Reveals the Global Nature of the Textile and Apparel Industry
Disclaimer: All blog posts on this site are for FASH455 educational purposes only and they are nonpolitical and nonpartisan in nature. No blog post has the intention to favor or oppose any particular presidential candidate, nor shall be interpreted in that way.
Before the 2016 Source Africa Trade event in June 2016, CNBC interviewed Tim Armstrong, Investment Promotion Director for the Textile Development Unit at the Ministry of Industry and Trade in Tanzania. Three questions were discussed during the interview:
What is your view on these issues?
The 2018 U.S. Fashion Industry Benchmarking Study is now available.
The report can be downloaded from HERE
Key Findings of the study:
I. Business environment and outlook in the U.S. Fashion Industry
II. Sourcing practices in the U.S. fashion industry
III. Trade policy and the U.S. fashion industry
The benchmarking study was conducted between March 2016 and April 2016 based on a survey of 30 executives from leading U.S. fashion and apparel brands, retailers, importers, and wholesalers. In terms of business size, 92 percent of respondents report having more than 500 employees in their companies, while 84 percent of respondents report having more than 1,000 employees, suggesting that the findings well reflect the views of the most influential players in the U.S. fashion industry.
For the benchmarking studies in 2014 and 2015, please visit: https://www.usfashionindustry.com/resources/industry-benchmarking-study
(In the video: Gail Strickler, former Assistant US Trade Representative for Textiles, highlights the immense opportunities created by the renewal of AGOA for duty-free access to the massive US market for African textile and apparel producers.)
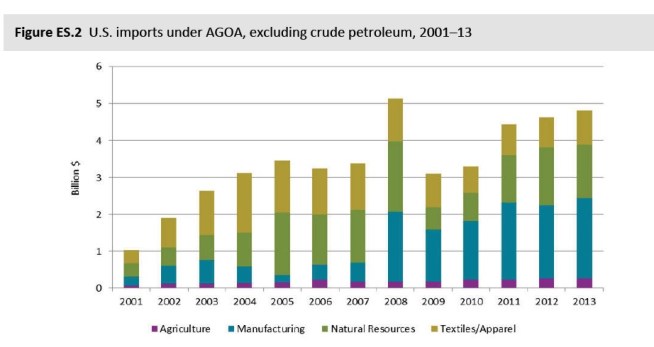
The African Growth and Opportunity Act (AGOA) is a non-reciprocal trade agreement enacted in 2000 that provides duty-free treatment to U.S. imports of certain products from eligible sub-Saharan African (SSA) countries. AGOA intends to promote market-led economic growth and development in SSA and deepen U.S. trade and investment ties with the region. (note: non-reciprocal means SSA countries do not need to offer equivalent benefits to imports from the United States.)
Because apparel production plays a dominant role in many SSA countries’ economic development, apparel has become one of the top exports for many SSA countries under AGOA. Like many trade agreements and trade preference programs, AGOA also set unique rules of origin for textile and apparel (T&A):
First, to enjoy the duty-free and quota-free treatment in the US market, eligible T&A products made in qualifying AGOA countries need to be one of the following categories:
Second, under a special rule called “third-country fabric” provision, AGOA countries with lesser-developed countries (LDBC) status can further enjoy duty-free access in the US market for apparel made from yarns and fabric originating anywhere in the world (such as China, South Korea, and Taiwan). This special rule is deemed as critical because most SSA countries still have no capacity in producing capital and technology-intensive textile products. [Note: Although the US imports of apparel made with third-country fabric are subject to a cap, the cap has never been reached].
According to a 2014 comprehensive study conducted by the USITC, the “third-country fabric” provision has three major benefits to the AGOA members:
1) Increase exports of apparel. This can be evidenced by the fact that most US apparel imports under AGOA came from those countries that are eligible for the “third-country fabric” provision, such as Lesotho, Kenya, Mauritius, and Swaziland. In comparison, because South Africa is not eligible for the “third-country fabric” provision, its apparel exports to the United States had significantly dropped since 2003 and only accounted for 0.6% among AGOA countries in 2013.
2) Encourage foreign investment. From 2003 to 2013, a total 21 T&A FDI projects were made in SSA, among which 18 projects (or 85.7%) were greenfield FDI. The third-country fabric provision is the main driver for these FDI projects. For example, many Chinese and Taiwanese investors had opened apparel factories in Ghana, Kenya, Lesotho, Madagascar, Malawi, Mauritius, Namibia, Nigeria and Tanzania as a source of exports to the United States and the EU.
3) Enhance trade diversification. Theoretically, relaxing rules of origin (RoO) such as the third-fabric provision can free up companies’ resources and allow them to expand export product lines. As observed by a few empirical studies, AGOA’s third-country fabric provision helped related countries increase the varieties of apparel exports between 39 and 61 percent.
AGOA receives new authorization in 2015, which will last for 10 years until 2025 (including the 3rd country fabric provision). This ten-year renewal of AGOA is regarded as critical and necessary to encourage more long-term investment in the region. As put by Florizelle Liser, Assistant US Trade Representative for Africa “What we know is that African producers of apparel, like producers of apparel all around the world, need to have the flexibility to source their input from wherever of those can be produced most effectively, cost effectively for the products that they are sewing. So we want through the “third country fabric” provision to give the African producers of apparel that flexibility. We do know in terms of establishing textiles business on the ground producing those inputs right there in Africa and that more of that indeed is going to happen. The reason is that as U.S. buyers of apparel and this is an enormous market for apparel… as U.S. buyers of apparel source more of their apparel from Africa, then investors in textile mills, which are very expensive, will be incentivized and are being incentivized to actually establish those fabric mills right there in Africa, and then be able to save time, in terms of getting those inputs that are needed for the clothing that is being produced. So we see that happening already: it’s happening in Kenya, it’s happening in Ethiopia and around the continent. And that is what we need to have more of as we go forward in this ten-year extension of AGOA.”


Latest statistics released by the American Apparel and Footwear Association (AAFA) indicate several trends in the U.S. apparel industry:
Appendix: Facts on the US Apparel Market in 2012
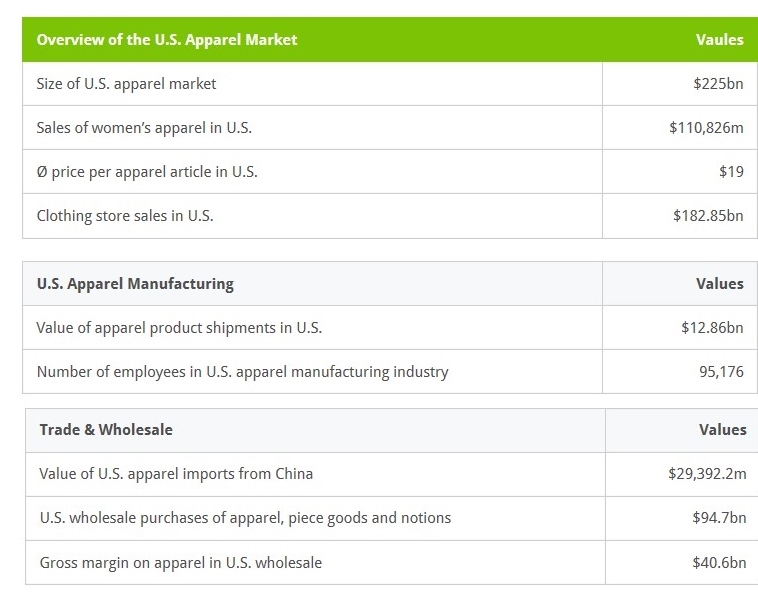
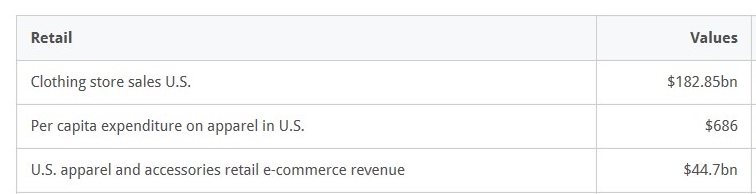
Data Source: http://www.statista.com/
 Key Findings
About the Benchmarking Study
The 2014 USFIA benchmarking study is conducted based on a survey of 29 executives at 29 leading U.S. fashion companies from March to April 2014. The study incorporates a balanced mix of respondents representing various business types in the U.S. fashion industry, including retailers, importers, wholesalers, and manufacturers. The survey asked respondents about the business outlook, sourcing practices, utilization of Free Trade Agreements and preference programs, and views on trade policy.
The full study can be downloaded from HERE.
In the year ahead, the following issues are suggested to watch for the apparel industry according to the latest just style management briefing:
Responsible sourcing: a variety of different themes inclusive of sustainability, compliance, chemical safety and product safety. In the past, the apparel industry has been very reactive in these areas, and efforts have accelerated to move to a more proactive model in 2014.
Demand for greater supply chain visibility: a higher level focus and a lot more time will be required to look at the supply chains from end to end, especially for tier 2 and 3 component suppliers. Apparel industry needs to be focused on preparing to be more transparent on what goes into making its products and the carbon and water footprint it leaves behind. There will also be a stronger emphasis on quality, and more intelligence and agility in the supply chain, including how to achieve global flexibility in supply to maximize advantages and benefits offered by different regions.
Adjust to the industry “new normal”: speed, efficiency and cost management. ‘Quick response’ or ‘fast fashion’ is no longer a catch phrase, it’s a business reality. Speed is king. Retailers have learned to manage with smaller inventories and to quickly react to consumer needs. Additionally, there are no more low cost countries (with capability and capacity) to tap into, which requires more efficient cost control through supply chain design and management.
Internet and omni-channel retailing. The internet continues to upend the apparel industry. Brick and mortar companies are still struggling to figure out how to harness the power of the internet – and struggling to figure out how big of a threat pure-play internet companies are. Meanwhile, the proliferation of internet-only companies continues, increasing the competitive pressure on everyone (including the older internet-only companies!). All of this will end up resulting in a much stronger industry overall – but in the meantime there will be a lot of hand-wringing and heartache.
Economic outlook. Overall, 2014 will be a year better off than 2013. The US economy continues to improve, the Eurozone recession has stabilised and there is the huge opportunity Asia offers.
Country risk. Whatever happens in the real economy, political tensions throughout developing countries (except possibly China and Vietnam) are growing. They are about more than working conditions in garment factories – and we cannot expect the garment industry to remain immune from them.
International market expansion. Global vertical retailers and brands need to balance the efficiency of global assortments with being able to cater to a broad range of consumer purchasing preferences across cultural groups. Winners manage to preserve their brand identity while offering attractive choices to this diverse customer group.
Trade policy and trade politics. 2014 is an election year for US Congress. It will only be tougher to find bipartisan consensus. Things to watch include whether the Obama Administration is going to finalize the Trans-Pacific Partnership (TPP) during 2014, whether the Trade Promotion Authority (TPA) can get passed as well as the renewal of the Generalized system of Preferences (GSP) and African Growth and Opportunity Act (AGOA).
China’s role in the global apparel supply chain. China’s productivity miracle has been the single major influence on global sourcing over the past five years. While this cannot go on forever it is hard to see a significant change in its share in 2014. China’s dominance of upstream textile production (spinning, weaving and knitting) is under greater threat. Its main operators are making substantial overseas investment, and while the timing of major upstream projects means this will have little impact on fabric and yarn manufacture in 2014, the subject will preoccupy observers. Onshore garment development in Japan, Germany, the UK and US will continue to create much publicity, but limited amounts of garments. Nearshoring continued to lose market share in the EU and US during 2013, though many buyers express growing interest, and there are signs of growth in some categories. It will be surprising if it shows any significant increase in 2014.
(This study was presented at the 2013 International Textile and Apparel Association Annual Conference)
By
Sheng Lu (University of Rhode Island) and Jessica Ridgeway (University of Missouri)
China’s soaring labor cost in recent years has triggered heated discussions on the future of “made in China” and its implication for U.S. consumers who rely heavily on “made in China” products (Rein, 2012). This is particularly the case in the U.S. apparel retail market, where over 98% of consumptions are supplied by imports and nearly 40% of them come from China in value (AAFA, 2012). Although numerous studies have been conducted to evaluate the relationship between imports and the U.S. domestic apparel production or employment (Martin, 2007), the direct linkage between the price of imports and the U.S. apparel retail price has seldom been explored. Because such a price linkage is the key to understand the implication of a more expensive “Made in China” for U.S. consumers, this study tries to fulfill the research gap and specifically investigate to which extent the U.S. apparel retail price is influenced by the price of U.S. apparel imports from China.
Through investigating the impact of the average unit price of U.S. apparel imports from China, the average unit price of U.S. apparel imports from sources other than China and the annual U.S. apparel retail sales on the annual U.S. consumer price index from 2001 to 2011 based on a revised Armington model, this study finds that:
First, for menswear, more expensive “made in China” will result in a higher retail price in the U.S. market. Specifically, the U.S. retail price is suggested to change by 0.137% in the same direction given a 1% change of the price of U.S. imports from China. Second, for womenswear, there is no evidence showing that the price of U.S. imports from China has statistically significant impact on the U.S. retail price Third, the U.S. apparel imports from China and from rest of the world are suggested to constitute higher degree of price elasticity of substitution for womenswear than for menswear.
Findings of this study contribute to the understanding of the direct price linkage between the U.S. apparel import market and the U.S. apparel retail market and have several important implications:
First, the results imply that when “made in China” becomes more expensive, U.S. consumers may not have to pay more, largely because of increased substitution supply from other apparel exporters. Second, the results suggest that the U.S. apparel market is highly competitive and suppliers may not own much market power in price determination despite their large market shares.Third, the results imply that although “made in China” may lose market share in the U.S. market when it becomes more expensive, the magnitude could vary by product categories.
References:
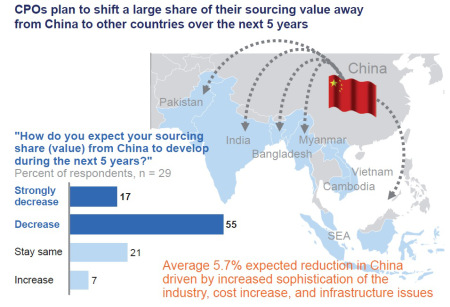
Mackenzie & Co., a well-known consulting firm, recently released their latest report on the global apparel sourcing map. The report is drafted based on a 2013 summer survey with 29 chief purchasing officers (CPOs) in Europe and the U.S. who were responsible for an annual total sourcing value of $39 billion USD. According to the report:
First, the global apparel sourcing cost is expected to rise modestly in the next 12 months (1.7% increase on average). Labor cost is tagged as the No.1 driving force of the rising sourcing cost.
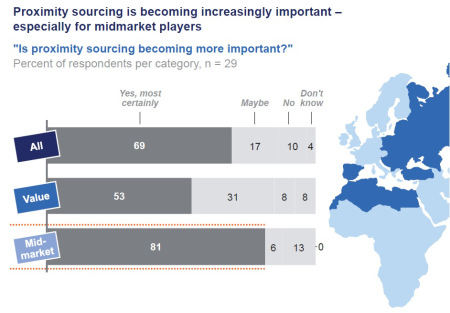
Second, companies are sourcing less apparel from China, but they move in a very cautious way. In the meanwhile, Asia is still seen as the world hub for apparel manufacturing & exports in the years to come. Such a pattern reflects the exact criteria for sourcing decisions: a balance of price, quality, capacity, speed and risk. Particularly, “proximity sourcing” is becoming increasingly important according to the surveyed CPOs. This rule shall also apply to China which has emerged as one of the world’s fastest growing apparel retail markets.
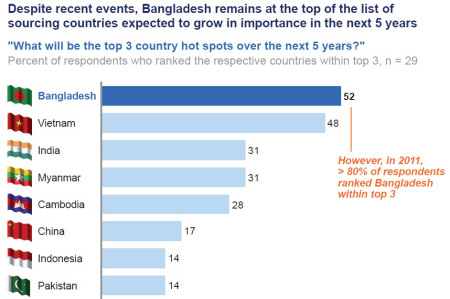
Third, despite the frequent reported corporate social responsibility problems, a combined consideration of labor cost advantage, free trade agreement benefits and capacity make Bangladesh remain the No. 1 hot pot for apparel sourcing for the next 5 years. 83% of surveyed CPOs plans an increase of apparel sourcing from Bangladesh in the years ahead.
Overall, sourcing will continue to be one of the most critical success factors for the global apparel industry. The survey results reflect a more structural shift in the industry, while the traditional apparel company “caravan journey” becomes more complex.