
Last week in class, we discussed what globalization means and why international trade happens. This latest research report released by the U.S.-China Business Council (USCBC) on the U.S.-China commercial relationships provides latest evidence showing how the world two largest economies are interdependent with each other and mutually benefit from such a close trade partnership. The report also highlights several key facts about the U.S.-China trade relationship, which often time is misunderstood by the general public.
Full text of the report is available at:
https://www.uschina.org/info/trade-agenda/2013/uscbc-trade-agenda-report.pdf

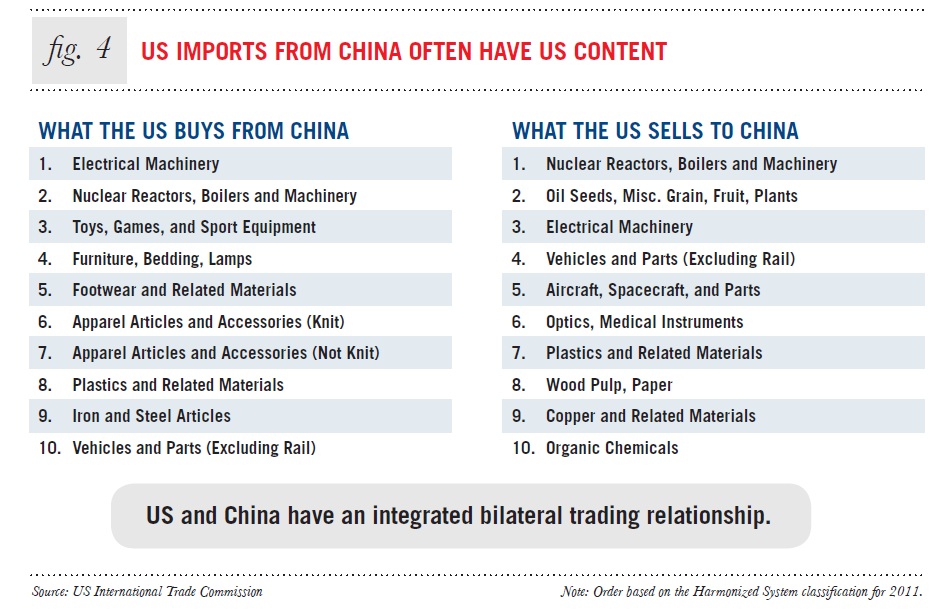
Figure 4 is a great representation of the Factor Pro proportions theory. I would definitely suggest using it in future PowerPoint presentations. It gives a great visual which allows me to easily wrap my mind about the theory beyond the “clothing and airplanes” example. It clearly states which industries are labor intensive versus which are capital intensive. It also states that this theory applies to many sectors of trade.
thank you for your good advice, I will take it:) I am also glad that the figure makes sense to you now after taking the course~
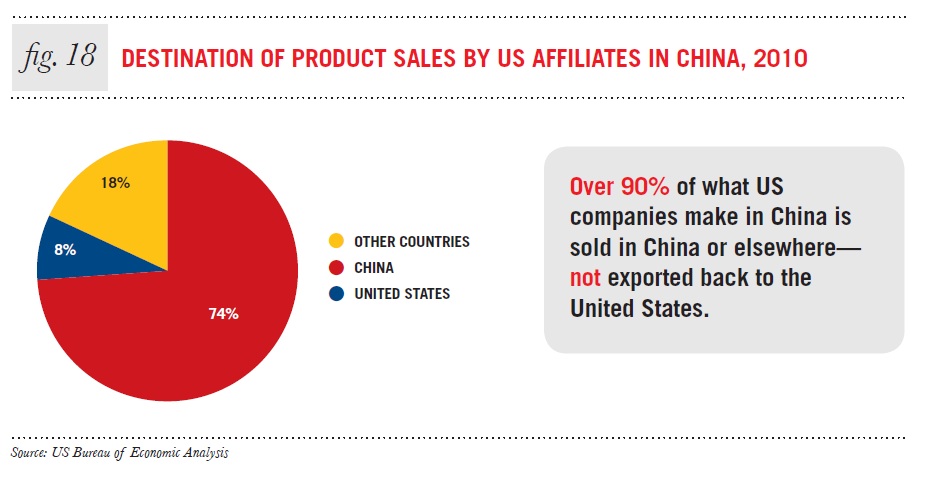
It is always better to see a visual of statistics as opposed to just reading them on a piece of paper. I feel as though these figures show the best representation of what we have learned throughout this semester in class. Figure 18 is especially intriguing to me because China is such a large country it is interesting to see where the majority of their exports actually go. And when looking at the graph you see just how much of it actually stays in China as opposed to being shipped to other countries at higher prices.
Before taking this class I never realized how much of a balanced relationship the US and China has through trading. I always made the assumption that the US only relied on China for clothing and that was it; I never thought about the machinery, aircrafts, and metal scraps that the US exports to China. This segment of charts really helps me gain a full understanding of the phenomenon of globalization, and demonstrates that this is truly how business, as a whole, is going to be conducted from now on.
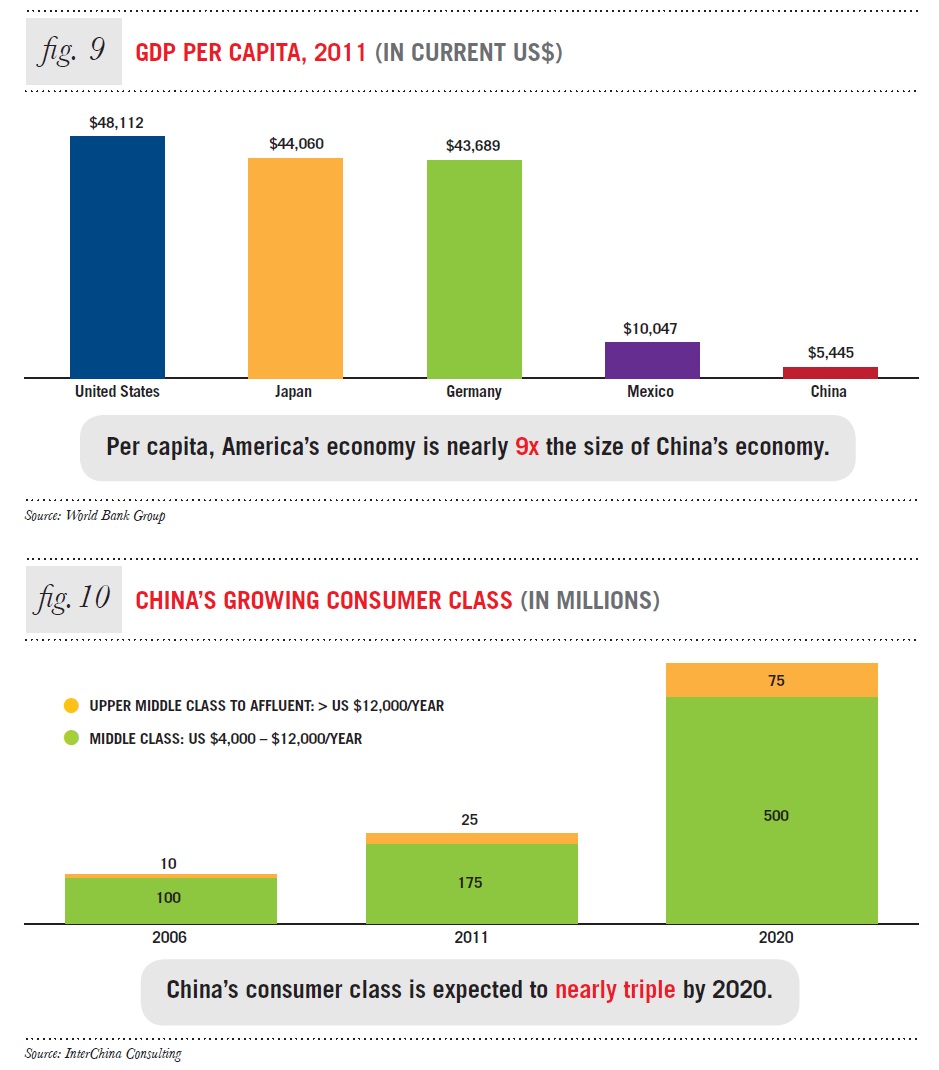
Most of these figures were pretty surprising to me. I thought figure 10, was very interesting to see the growth rate of the Chinese middle and upper classes. I would assume most of this is probably from the business the US gives China with so much of its production. Figure 18 was also really interesting because I thought that when we outsourced to China, the majority of that product was exported back to us after, but its not. It is so surprising that most of it stays in China after it is manufactured because it must get sold at a cheap price in China so then I feel like America would not be making as much profit as we would think.
Figure 4 is a great example of how the United States and China benefit from each other. It’s a great visual of how trade agreements between two countries can be beneficial for both parties involved. Figure 18 was surprising because I always thought that U.S. exported to China and then imported it back to the U.S. but that is clearly not true after looking at this chart. I had no idea that only 8% was exported back to the United States. It was also surprising at how bad China economy is. The fact that 500 million people receive a salary of less than $12,000 yet the country is so important to the U.S trading.