
A fact-checking review of trade statistics in 2017 of a total 167 categories of textile and apparel (T&A) products categorized by the Office of Textiles and Apparel (OTEXA) suggests that T&A products “Made in China” still have no near competitors in the U.S. import market. Specifically, in 2017:
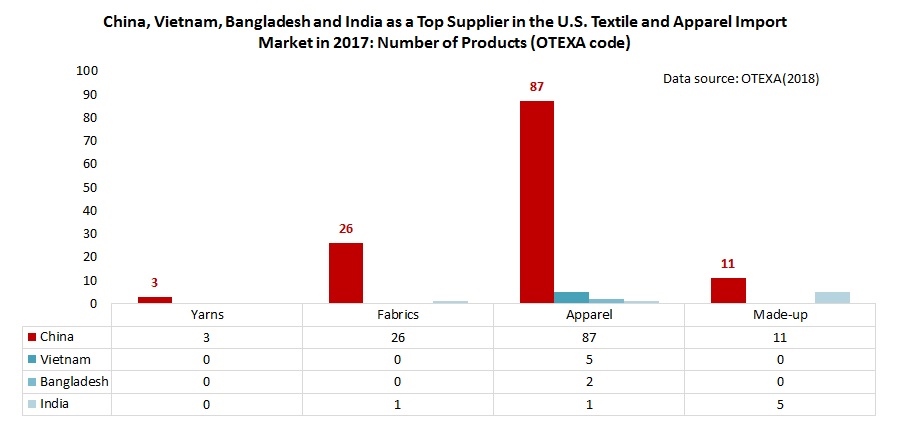
- Of the total 11 categories of yarn, China was the top supplier for 3 categories (or 27.3%);
- Of the total 34 categories of fabric, China was the top supplier for 26 categories (or 76.5%);
- Of the total 106 categories of apparel, China was the top supplier for 87 categories (or 82.1%);
- Of the total 16 categories of made-up textiles, China was the top supplier for 11 categories (or 68.8%);
In comparison, for those Asian T&A suppliers regarded as China’s top competitors:
- Vietnam was the top supplier for only 5 categories of apparel (less than 5% of the total);
- Bangladesh was the top supplier for only 2 categories of apparel (less than 2% of the total)
- India was the top supplier for 1 category of fabric (2.9% of the total), 1 category of apparel (1% of the total) and 5 categories of made-up textiles (41.7% of the total)
Notably, China not only was the top supplier for many T&A products but also held a lion’s market shares. For example, in 2017:

- For the 26 categories of fabric that China was the top supplier, China’s average market shares reached 40.5%, 22 percentage points higher than the 2nd top suppliers for these categories
- For the 87 categories of apparel that China was the top supplier, China’s average market shares reached 52.4%, 36 percentage points higher than the 2nd top suppliers for these categories.
- For the 11 categories of made-up textiles that China was the top supplier, China’s average market shares reached 58%, 43 percentage points higher than the 2nd top suppliers for these categories.
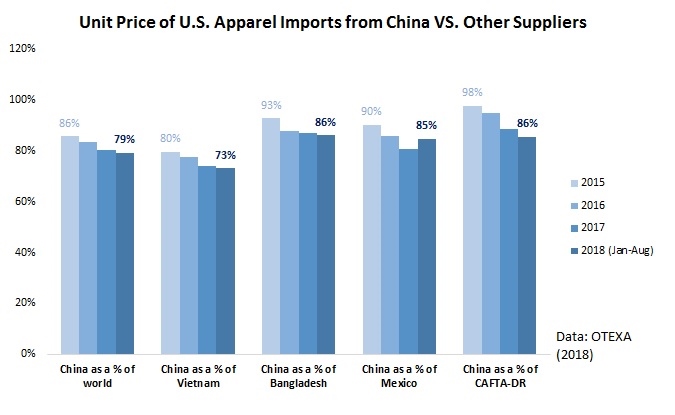
Furthermore, T&A “Made in China” are demonstrating even bigger price competitiveness compared to other suppliers in the U.S. market. For example, in 2017, the unit price of apparel “Made China” was only 74% of the price of “Made in Vietnam” (in 2015 was 80%), 86% of “Made in Bangladesh” (in 2015 was 93%), 85% of “Made in Mexico” (in 2015 was 90%) and 86% of products by members of CAFTA-DR (in 2012 was 98%).

Last but not least, the U.S.-China tariff war apparently has NOT affected China’s textile and apparel exports to the United States significantly. From January to August this year, China’s apparel exports to the U.S. declined by 1% in value and 0.3% in quantity from a year earlier, but China’s textile exports to the U.S. increased by 12.3% in value and 7.2% in quantity. China’s market shares in the U.S. market also remains overall stable.
Are the results surprising? How to explain China’s increasing price competitiveness despite its reported rising labor cost? What’s your outlook for the future of China as a sourcing destination for U.S. fashion brands and retailers? Please feel free to share your views.
Suggested citation: Lu, Sheng. (2018). Are Textile and Apparel “Made in China” Losing Competitiveness in the U.S. Market? (updated October 2018). Retrieved from https://shenglufashion.com/2018/10/28/are-textile-and-apparel-made-in-china-losing-competitiveness-in-the-u-s-market-updated-october-2018/
