


This study intends to explore how has the U.S.-China trade tension since 2017 affected the competitiveness of China’s textile and apparel (T&A) exports to the U.S. market. The findings of the study will shed new light on the mega-trend of T&A sourcing from China in the medium term, and support T&A companies’ sourcing decision making in the current uncertain business environment.
Data for the analysis were collected from the Office of Textiles and Apparel (OTEXA) under the U.S. Department of Commerce, including the value of U.S. imports from China between 2016 (i.e., the year before the U.S. launched the section 301 investigation against China) and October 2019 (the latest data available) for a total of 167 categories of T&A products.
Specifically, based on the constant market share (CMS) model, a commonly adopted international trade analysis tool, this study decomposed the value of U.S. T&A imports from China into the following four factors:
- Market growth effect: changes in China’s T&A exports to the U.S. due to the growth of total U.S. import demand for T&A
- Commodity structural effect: changes in China’s T&A exports to the U.S. due to the shifting product structure of China’s T&A exports
- General competitive effect: changes in China’s T&A exports to the U.S. due to the shifting competitiveness of Chinese T&A products in the U.S. market (measured by China’s market shares)
- Product competitive effect: changes in China’s T&A exports to the U.S. due to the joint effect of the product structure of China’s T&A exports and the shifting competitiveness of Chinese T&A products in the U.S. market (measured by China’s market shares)
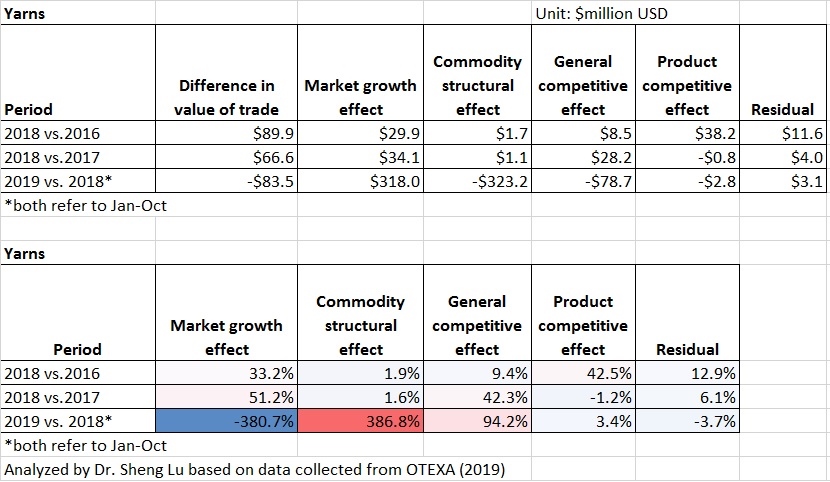
Four findings are of note:
First, the U.S.-China trade tension has affected China’s T&A exports to the U.S. negatively. Even though Section 301 tariffs on the majority of apparel products didn’t start until September 2019, China’s T&A exports to the U.S. had suffered a significant drop. This result, however, was at odds with the overall trend of China’s T&A exports to the U.S. in recent years. Notably, except apparel, China’s yarns, fabrics and made-up textile exports to the U.S. all enjoyed a steady and positive growth between 2016 and 2018. The impact of the tariff war is real.
Second, the increased U.S. import demand has partially mitigated the negative impact of trade tension on China’s T&A exports to the U.S. market. Results of the CMS model indicate that expanded total U.S. import demand for T&A driven by the booming U.S. economy had avoided an even worse decline of U.S. T&A imports from China. In other words, without such a market growth, China’s T&A exports to the U.S. would have been $2,065 million less in 2018 (including $528 million for apparel) and $878 million less (including $613 million for apparel) in the first ten months of 2019 than their current level.
Third, China’s export competitiveness is shifting from apparel to textiles. Results of the CMS model show that even before the tariff war, the competitiveness of China’s apparel exports has been weakening steadily, which was the most significant contributing factor to the decline of $530 million U.S. apparel imports from China between 2016 and 2018. In comparison, China is exporting more yarns and fabrics to the U.S. in recent years. Data from OTEXA shows that between 2016 and 2018, China’s yarn and fabric exports to the U.S. enjoyed a 13.1% and 2.6% compound annual growth, respectively, compared with a 0.6% decline of apparel. The CMS model further suggests that China’s improved export competitiveness can explain the majority of these increased exports.
Fourth, China is adjusting its T&A export structure to mitigate the negative impact of the tariff war. As estimated, through targeting those product categories with higher growth in import demand, China was able to achieve an additional $36.7 million apparel export to the U.S. in the first ten months of 2019. Likewise, the commodity structural effect also favored China’s made-up textile exports to the U.S. market in 2019, resulting in $148.7 million more exports than otherwise.
By Sheng Lu
