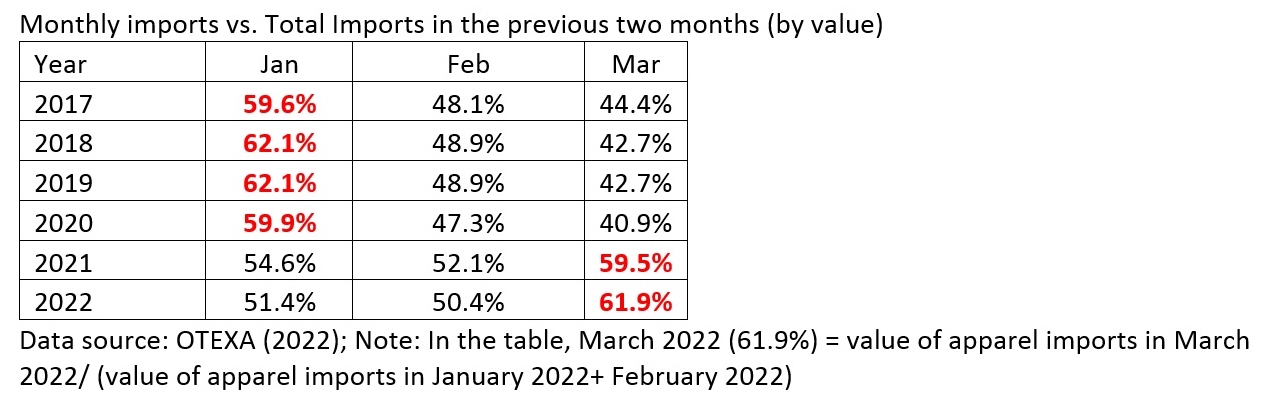
The latest data from the Office of Textiles and Apparel (OTEXA) and the United States International Trade Commission (USITC) suggested several key patterns of US apparel imports in 2023.

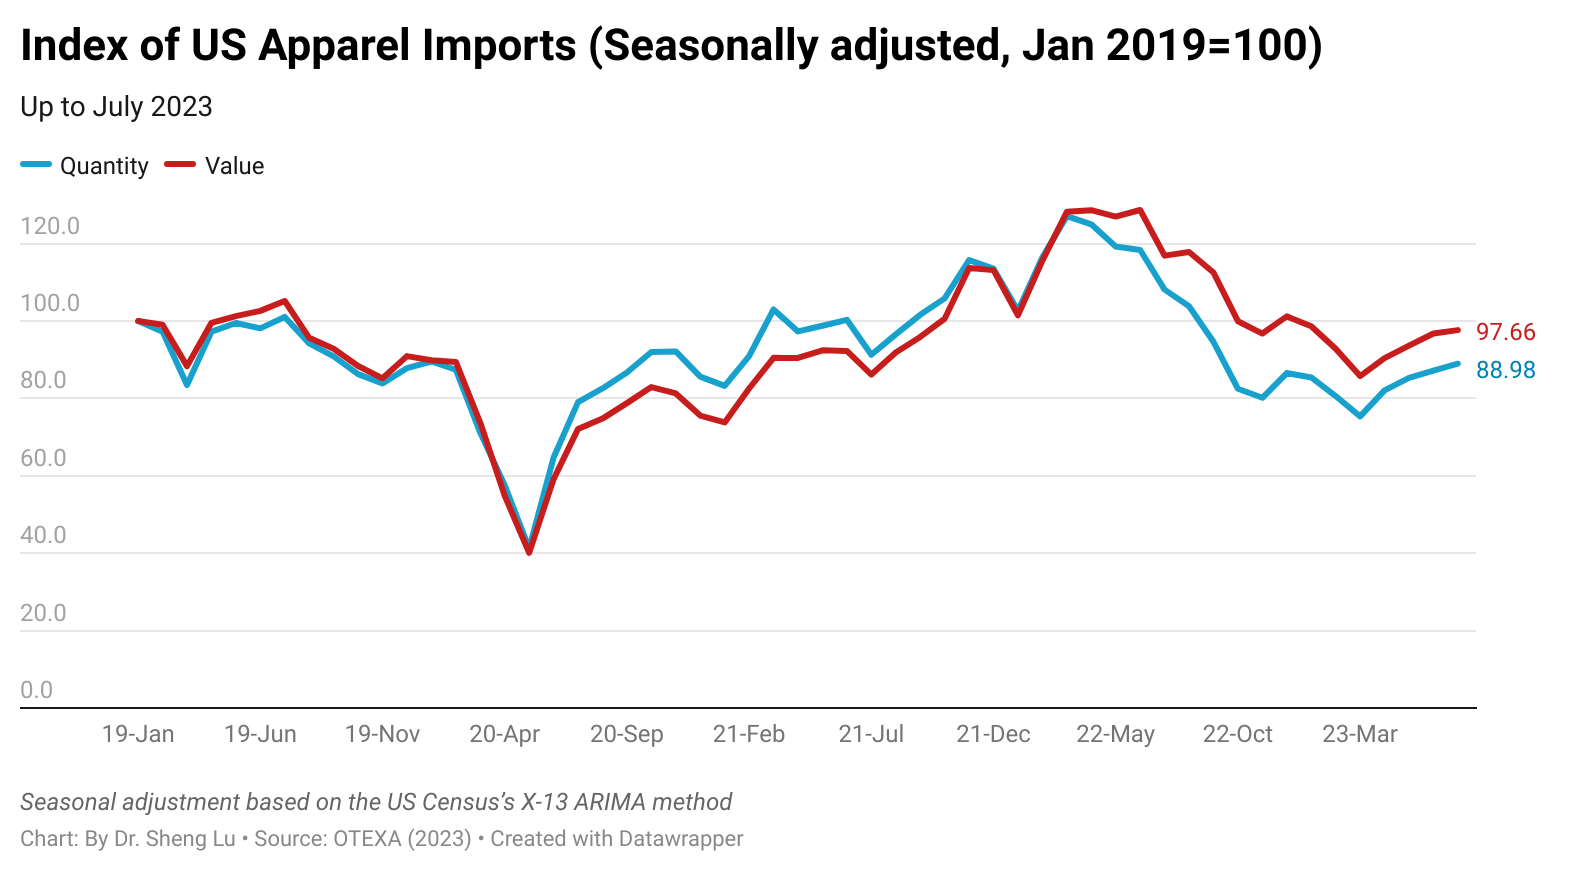
First, affected by the macro economy, US apparel import volume in 2023 suffered the most significant decline since the pandemic. Specifically, US apparel imports decreased by 22% in quantity and value in 2023 compared to 2022, with none of the top ten suppliers experiencing positive growth.
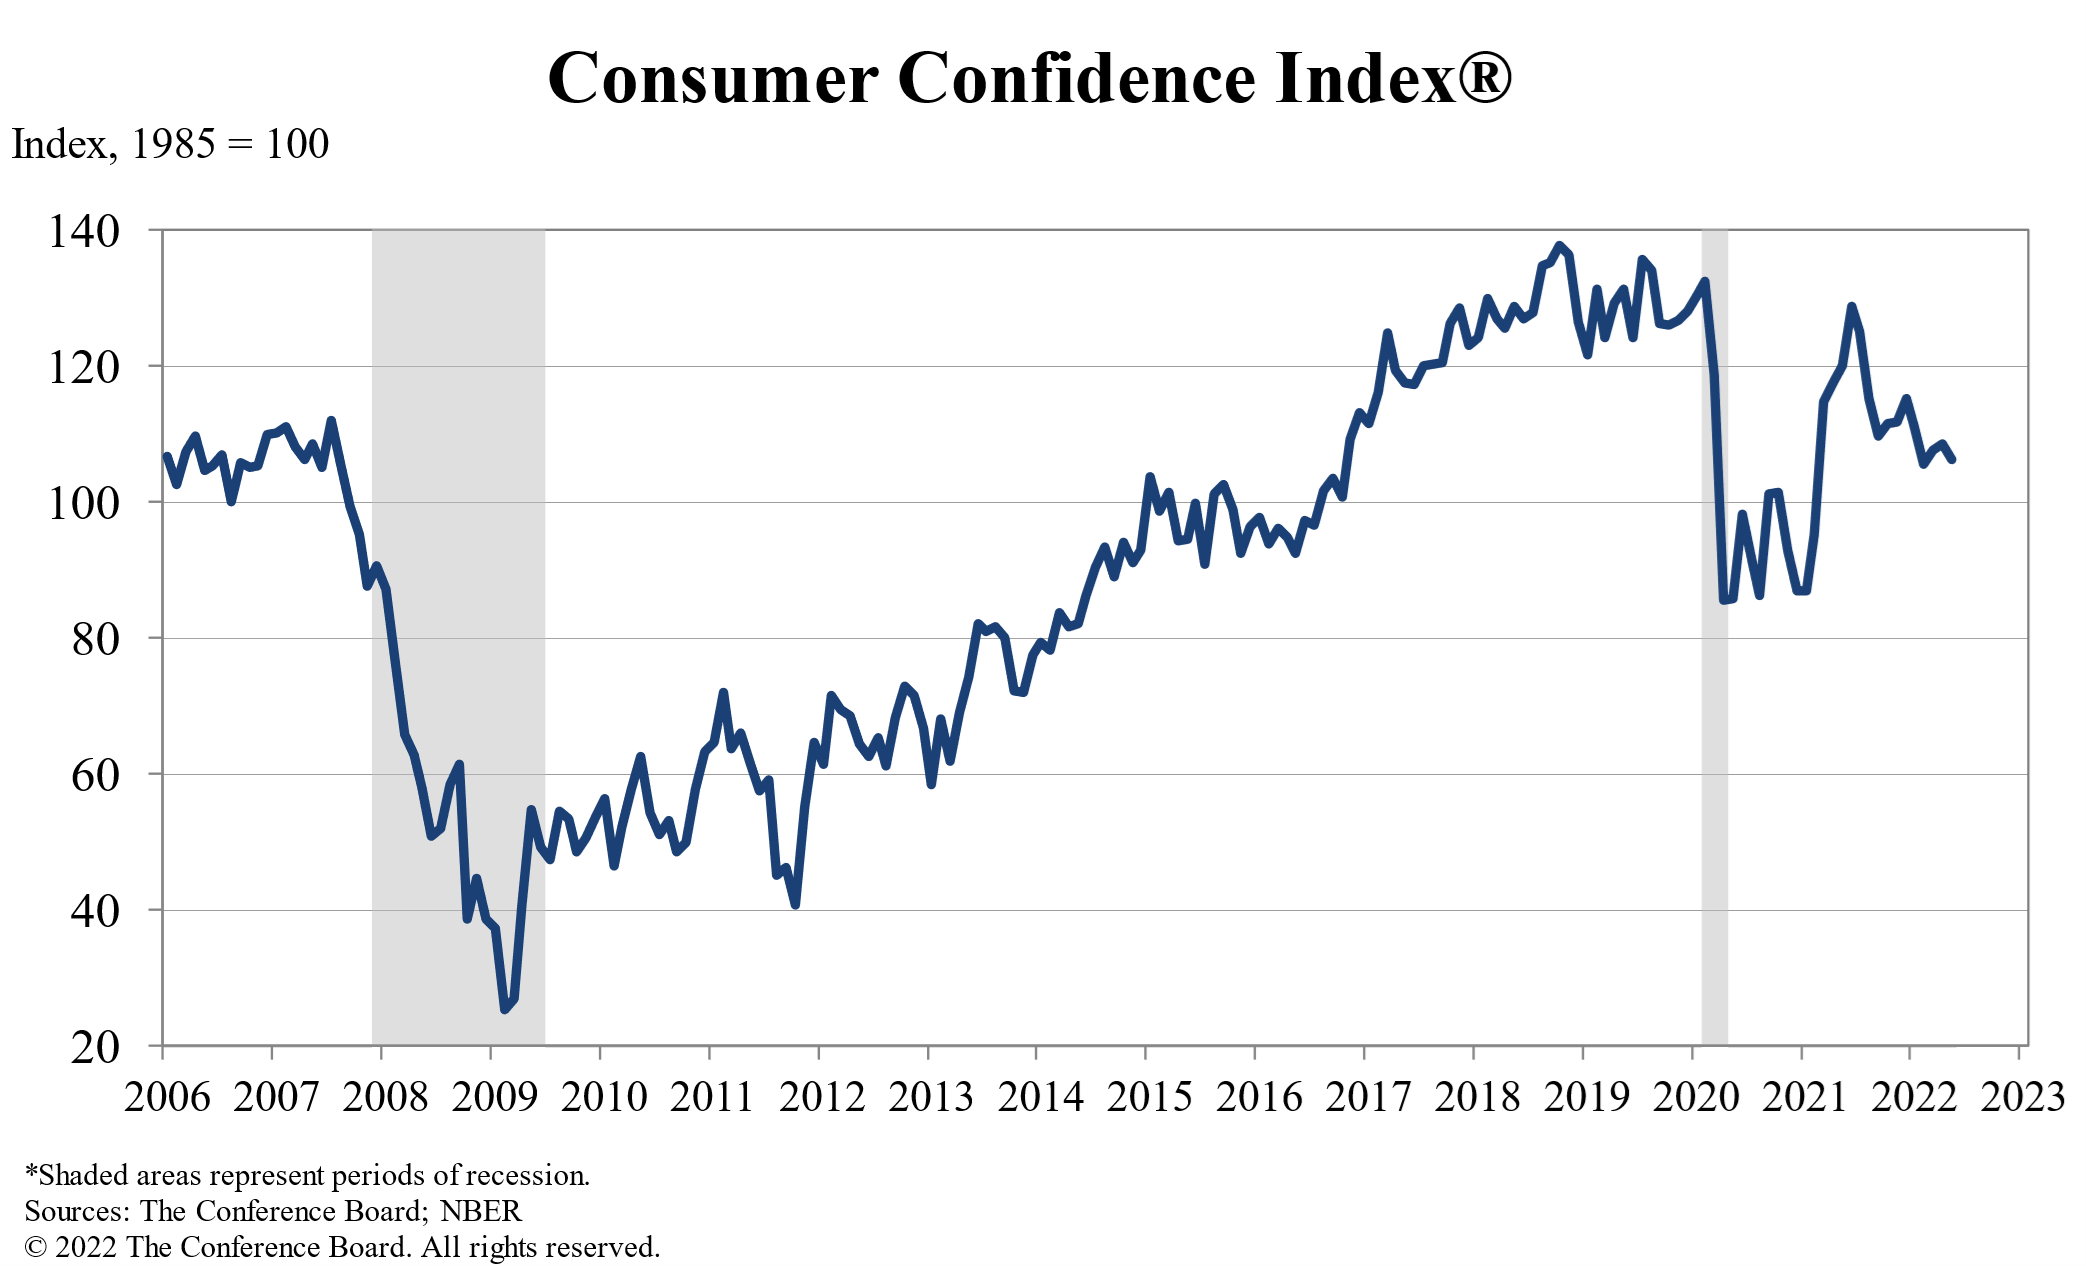
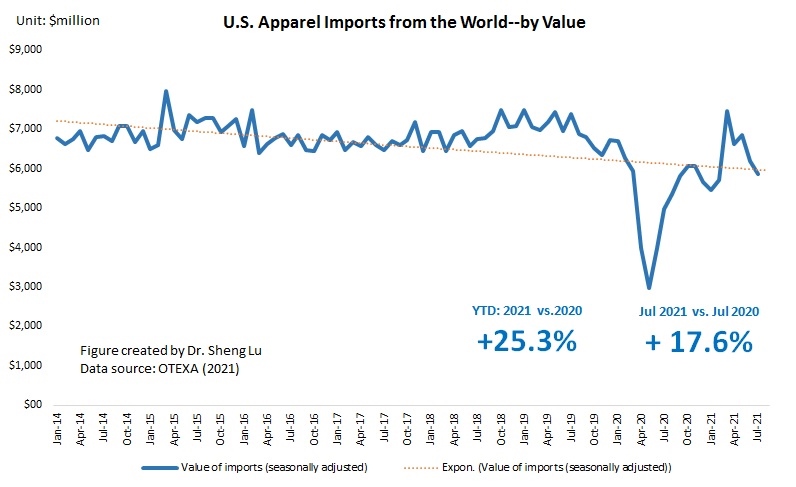
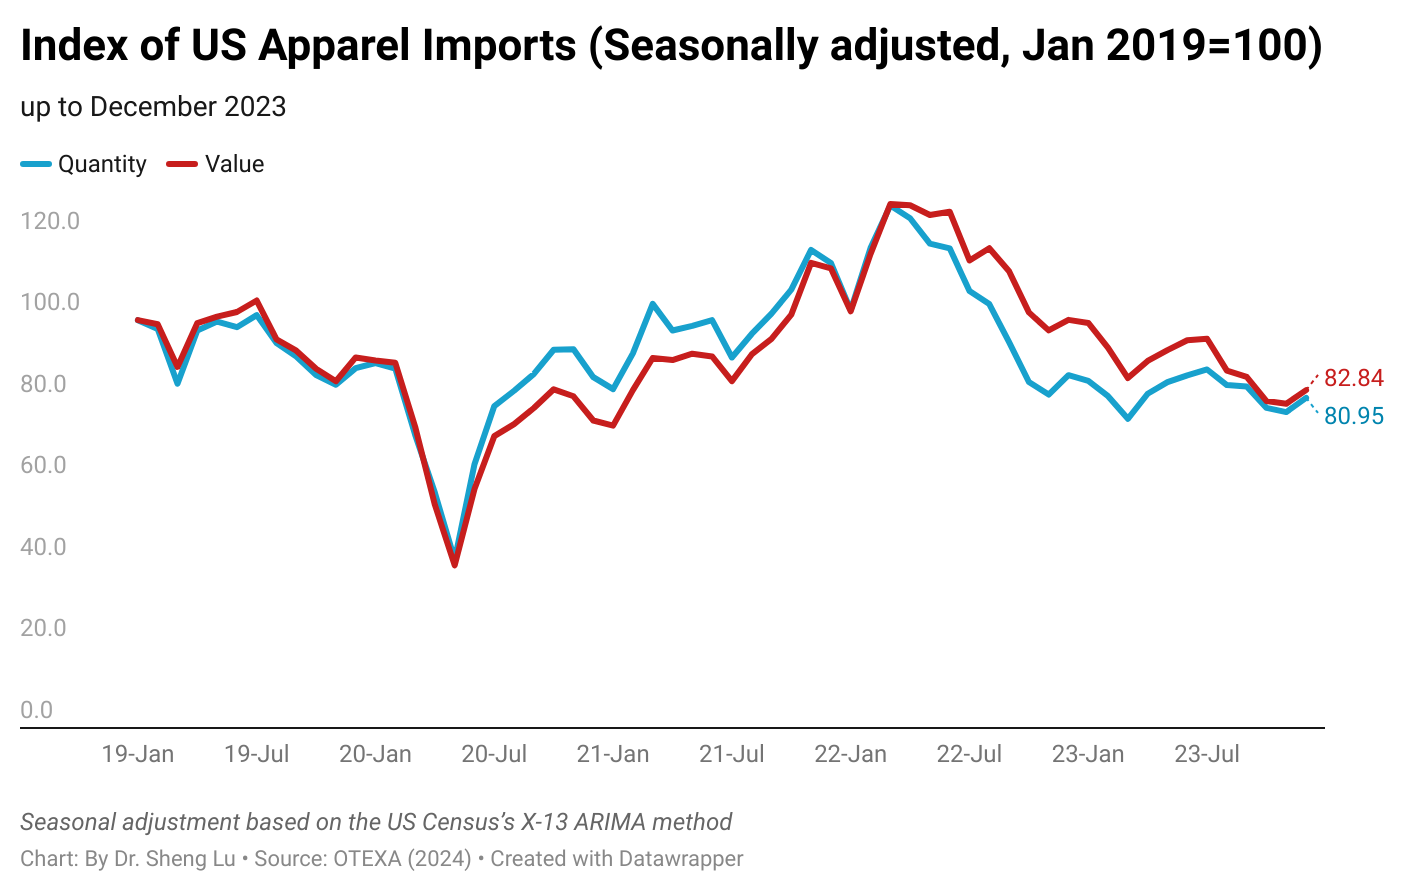
Nevertheless, after several months of straight decline, US apparel imports finally bounced back in December 2023. Thanks to the holiday season and a gradual improvement of the US economy, seasonally adjusted US apparel imports in December 2023 were about 4.5% higher in quantity and 4.2% higher in value than the previous month. Highly consistent with trends, the US Consumer Confidence Index (CCI) increased from 67.2 in November to 76.4 in December (January 2019=100), suggesting US households turned more confident about their financial outlook and willing to spend. That being said, the latest January 2024 International Monetary Fund (IMF) forecasts still predicted the US GDP growth would slow down from 2.5% in 2023 to 2.1% in 2024. Thus, whether the US apparel import volume could continue to maintain growth after the holiday season remains a big question mark.

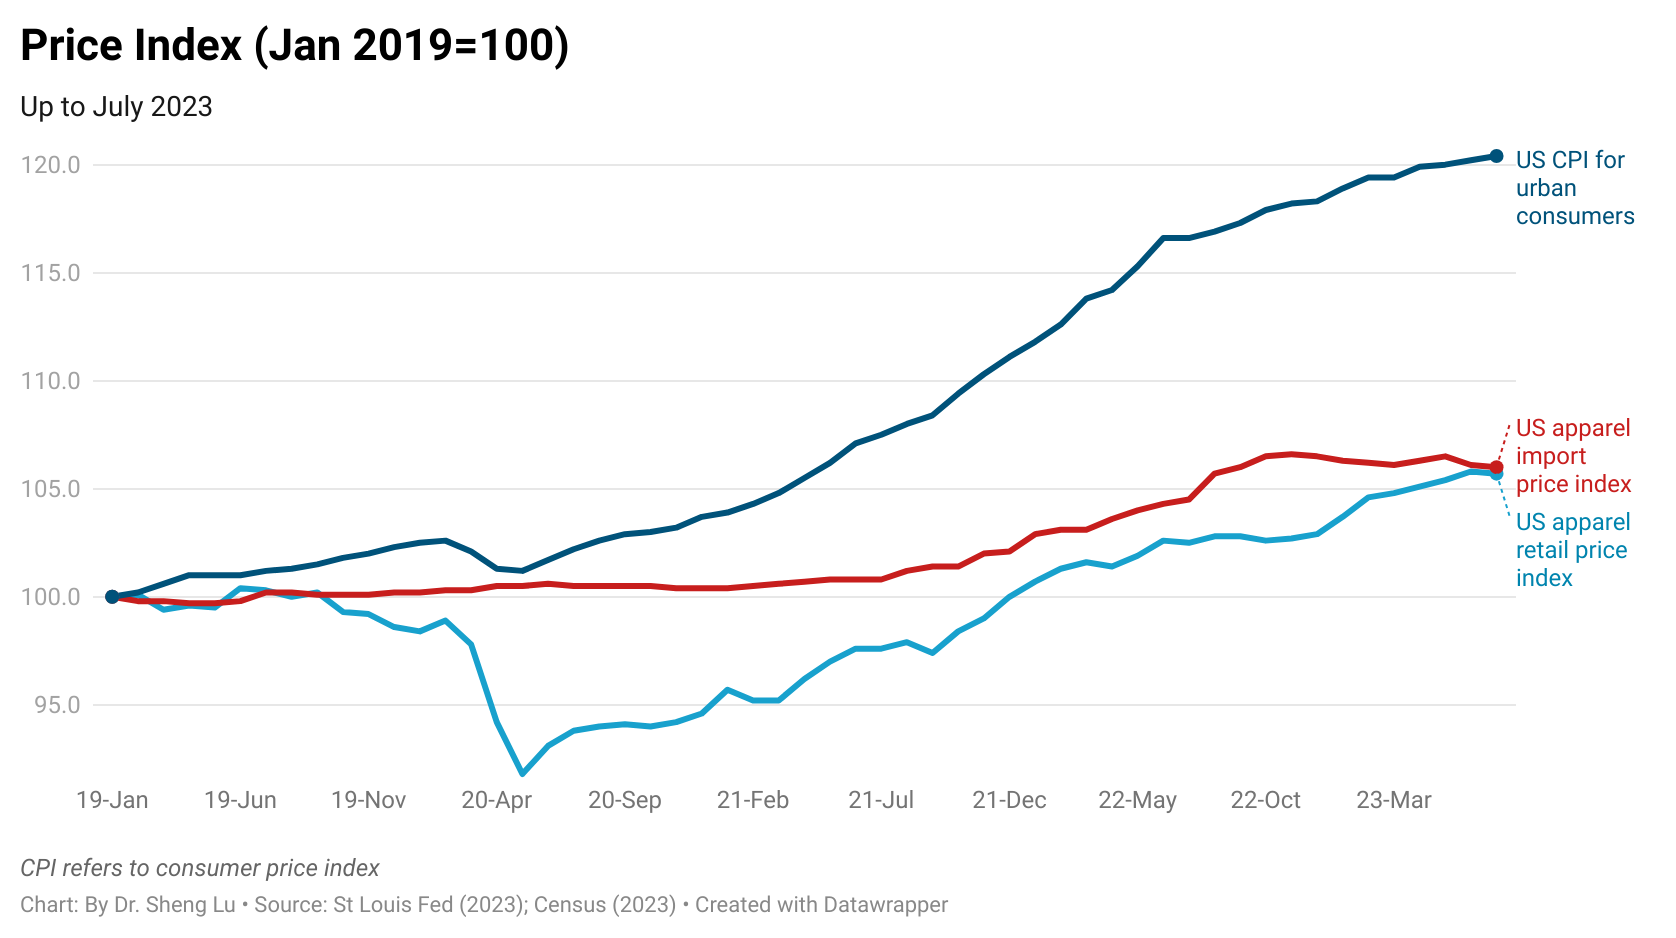
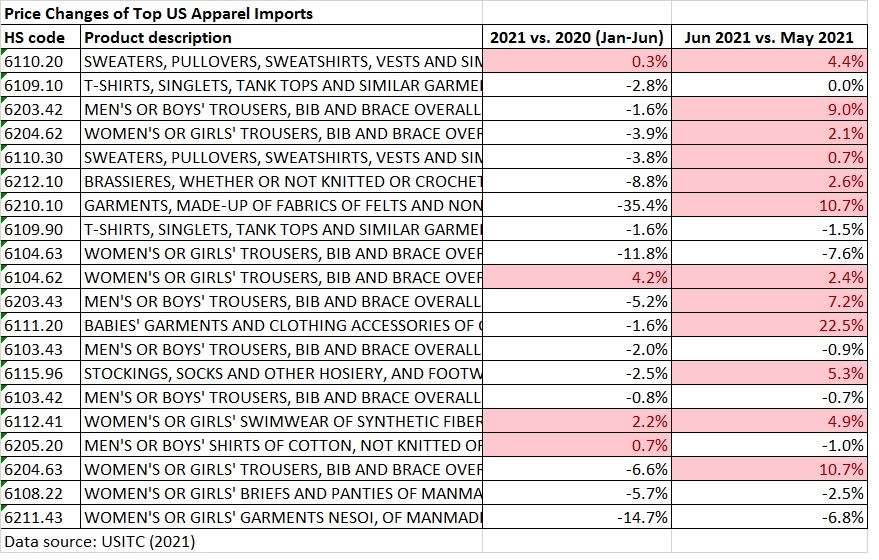
Second, while the pace of sourcing cost increases has slowed, the costs and financial pressure facing US fashion companies are far from over. Specifically, as of December 2023, the price index of US apparel imports stood at 106 (January 2019=100), almost no change from January 2023. However, two emerging trends are worth watching. One is the declining US apparel retail price index since August 2023, which means US fashion companies may have to sacrifice their profits to attract consumers to the store. The second trend is the surging shipping costs as a result of the recent Red Sea shipping crisis, which were not reflected in the December price data. According to J.P. Morgan, during the week of January 25, 2024, the container shipping rates from China to the US West Coast and East Coast saw a significant spike of around 140% and 120% from November 2023, respectively. Even worse, there is no sign that the Red Sea crisis will soon be solved. Therefore, 2024 could pose another year of financial challenges for many US fashion companies.

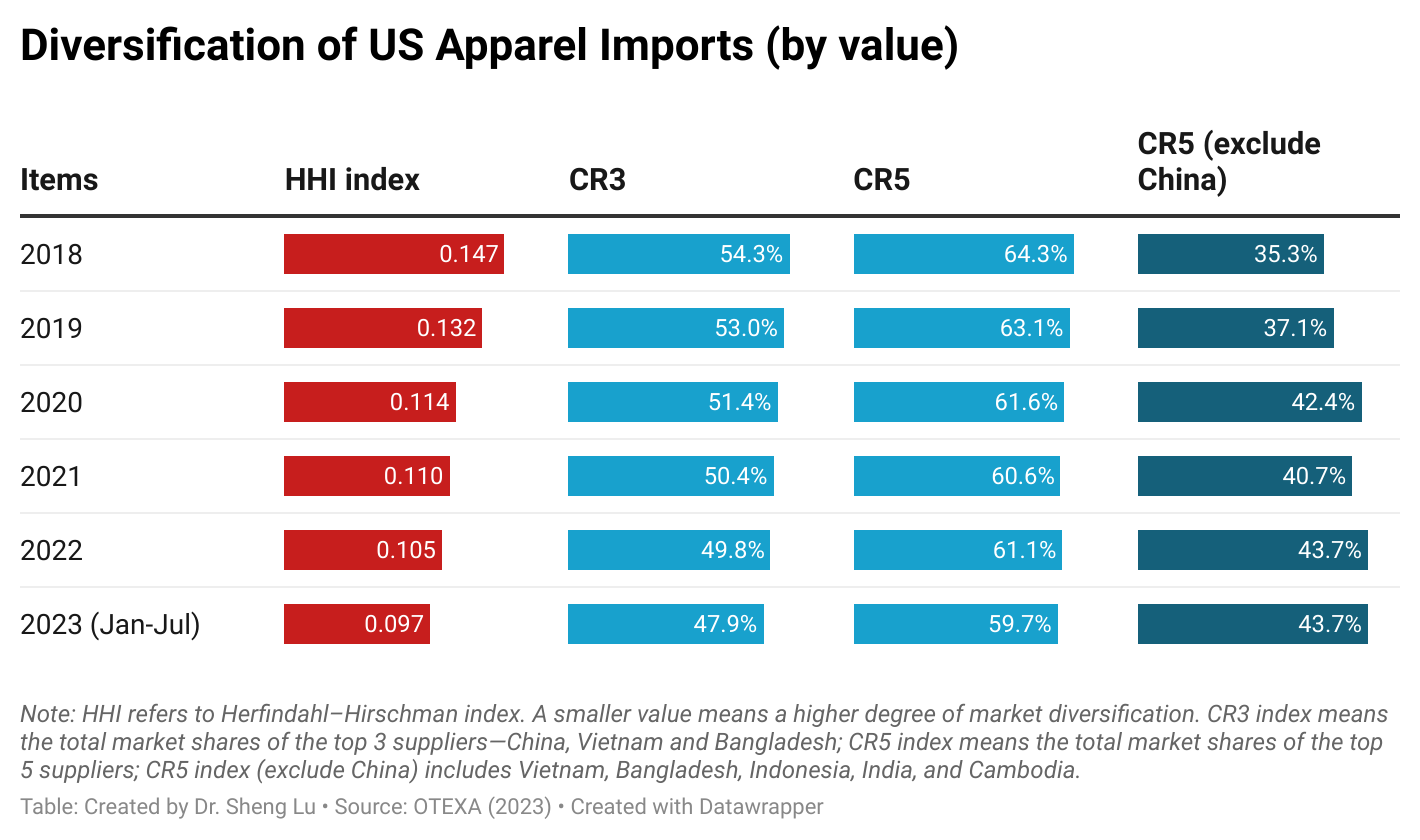
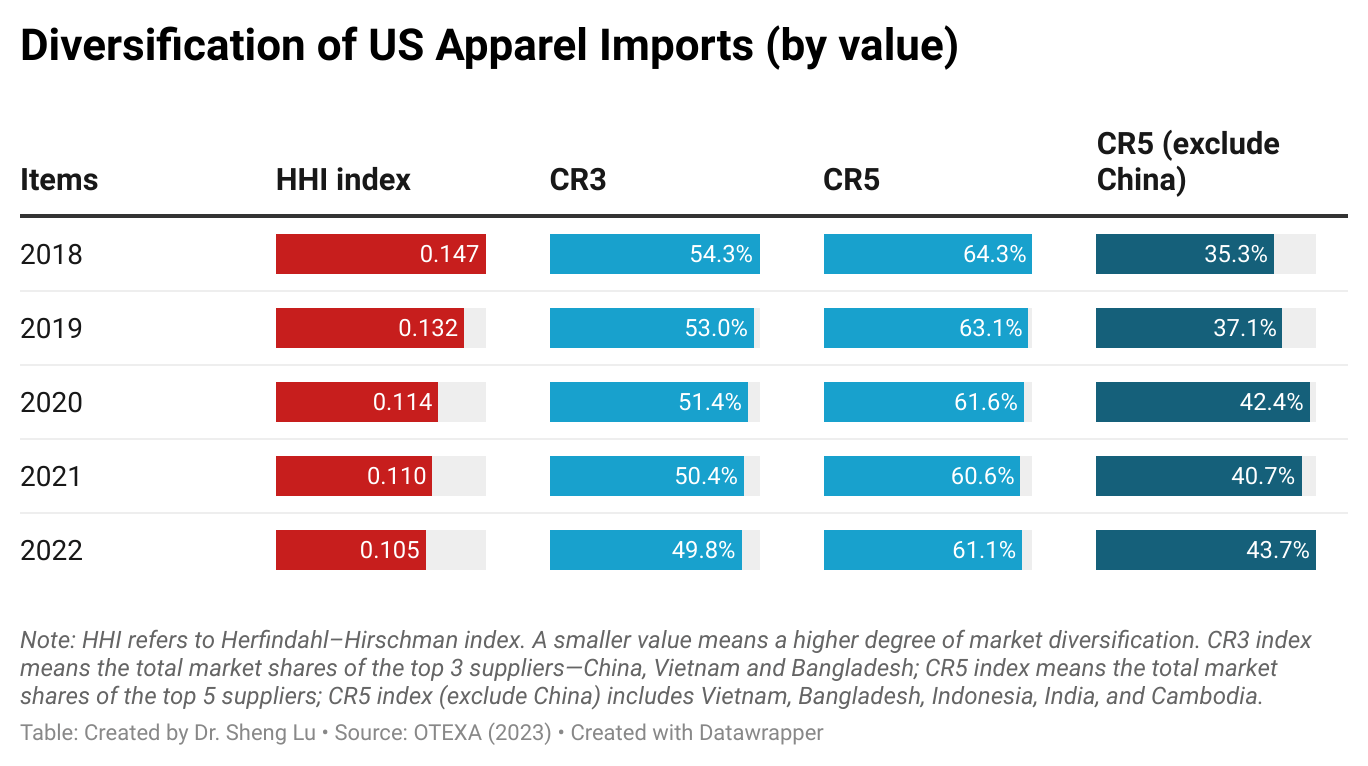
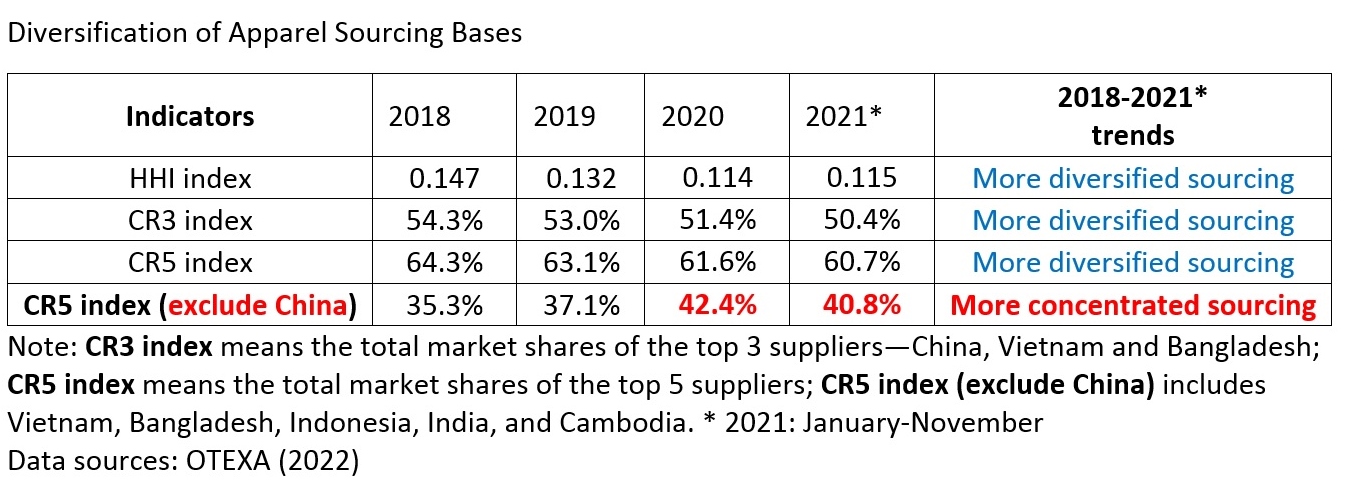
Third, diversification remained a pivotal trend in US fashion companies’ sourcing strategy in 2023. For example, the Herfindahl–Hirschman index (HHI), a commonly used measurement of market concentration, went down from 0.105 in 2022 to 0.101 in 2022, suggesting that US apparel imports came from even more diverse sources.

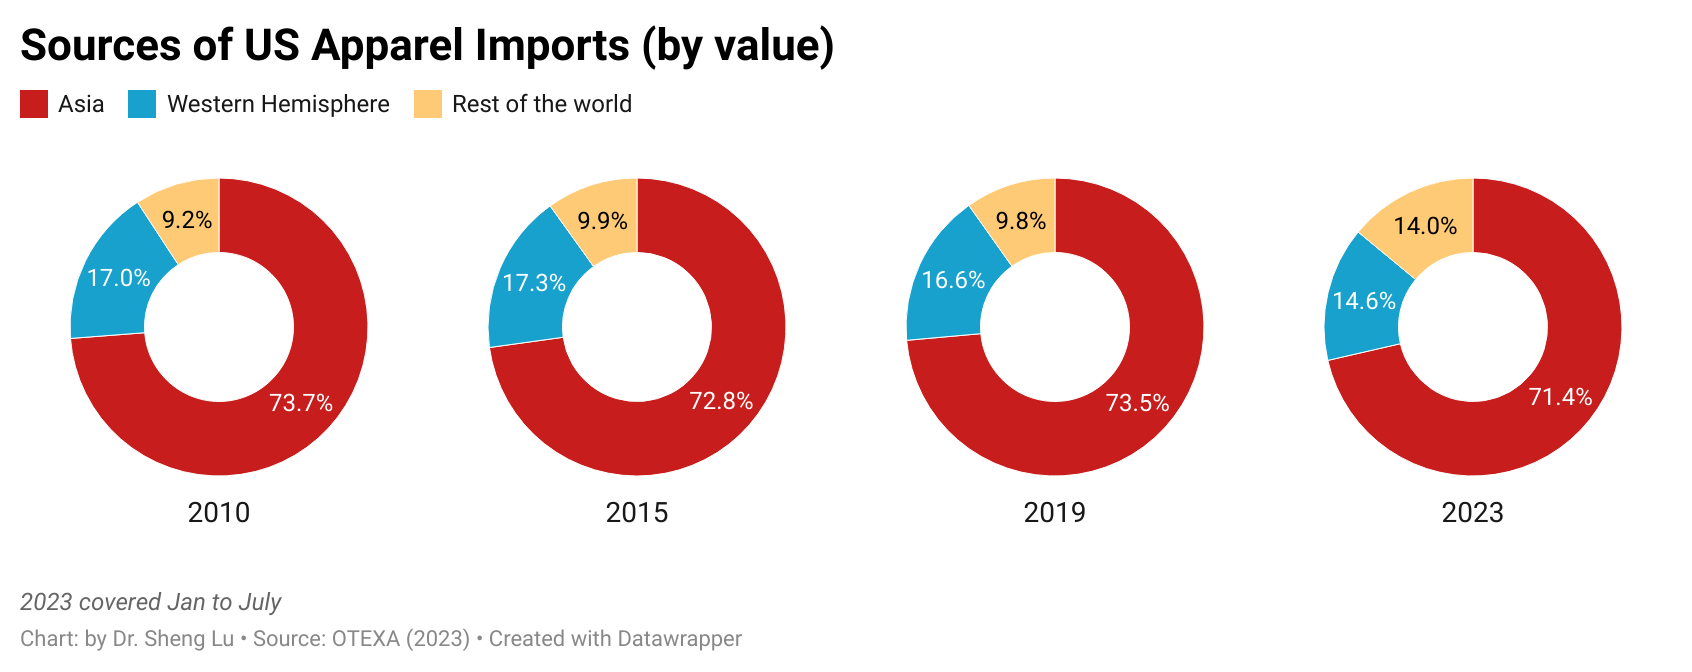
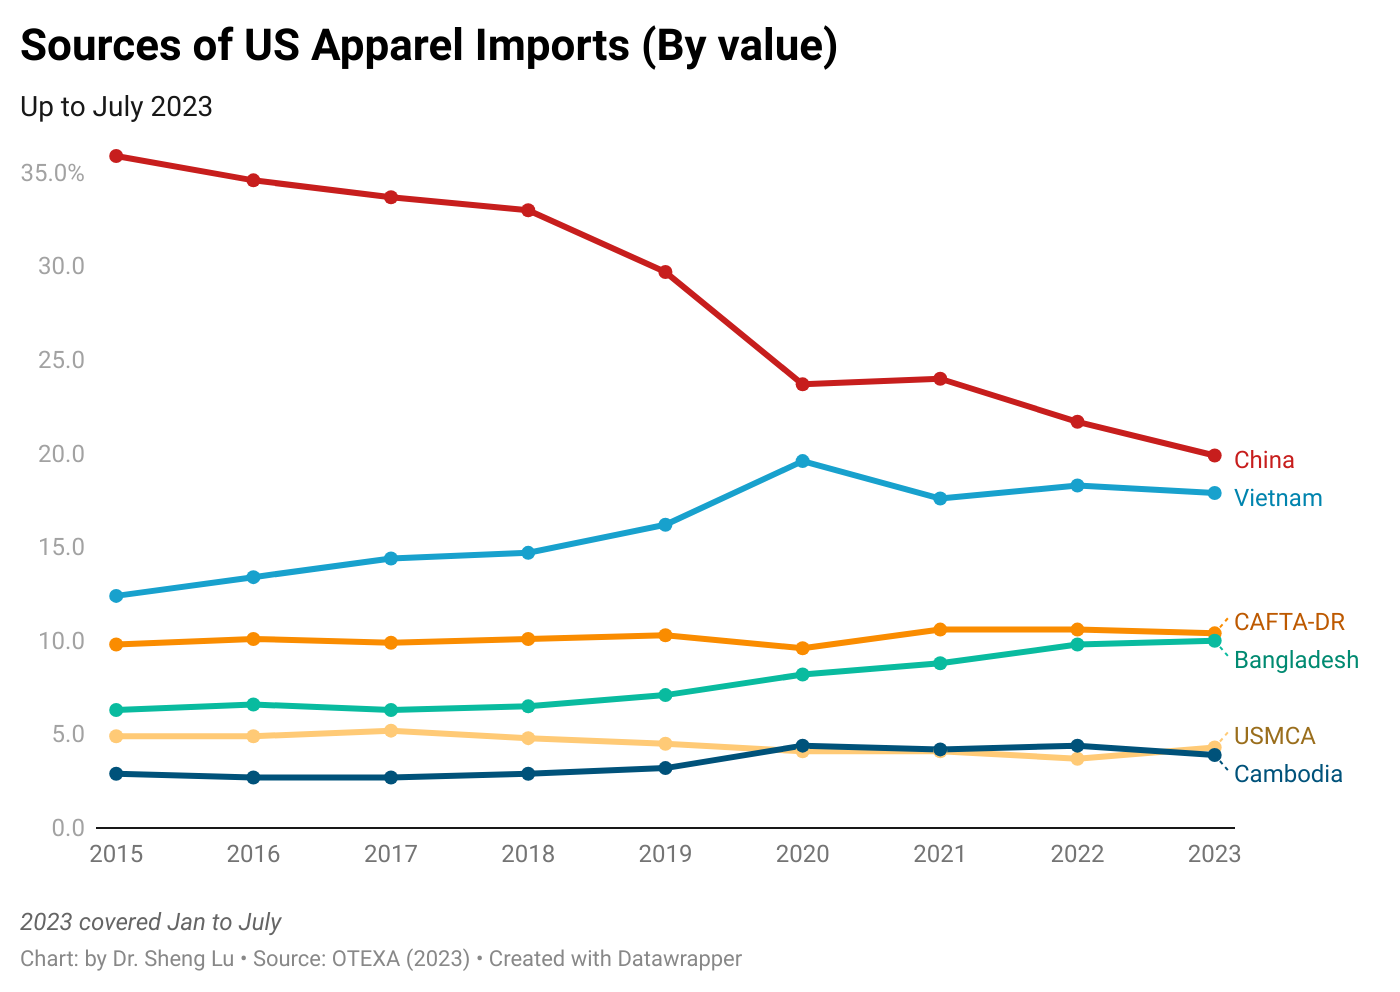
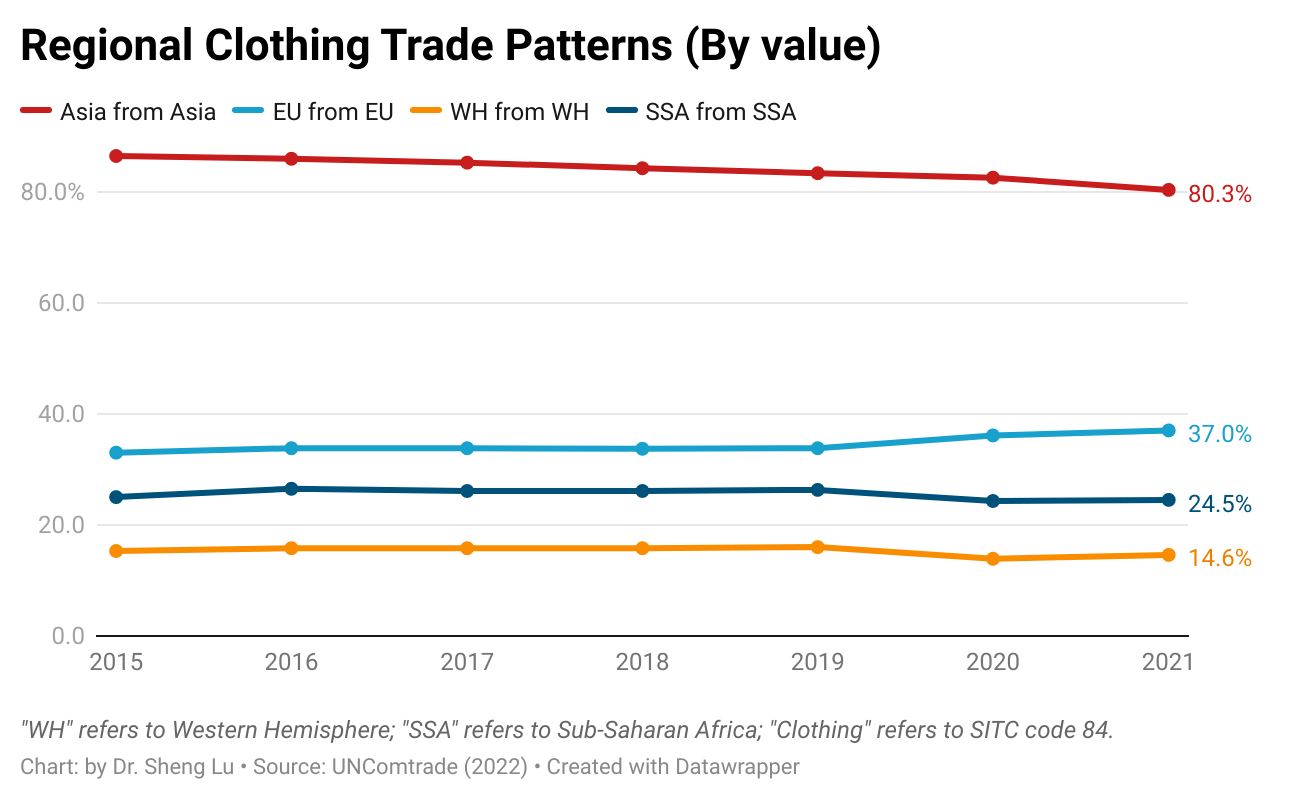
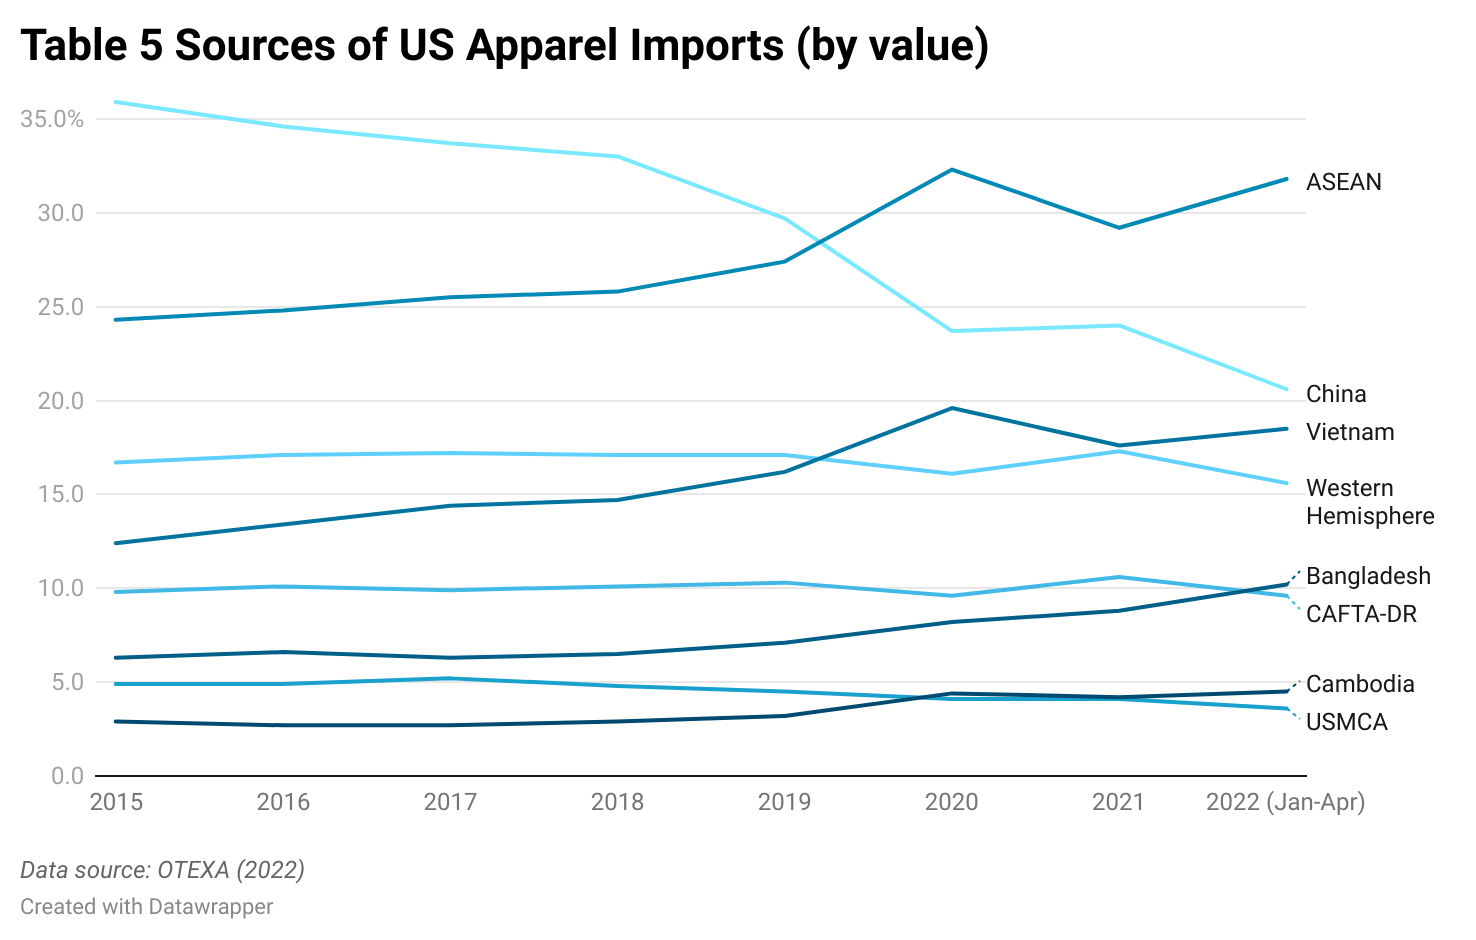
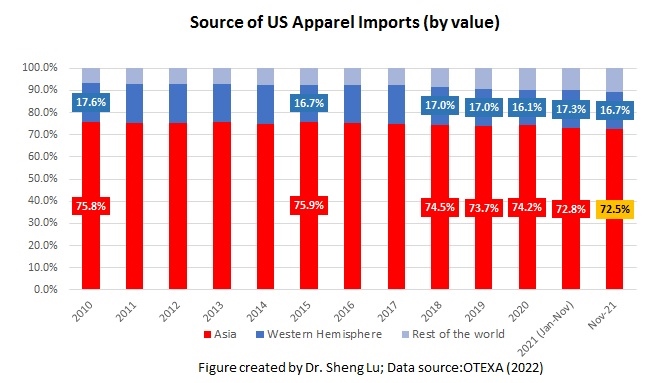
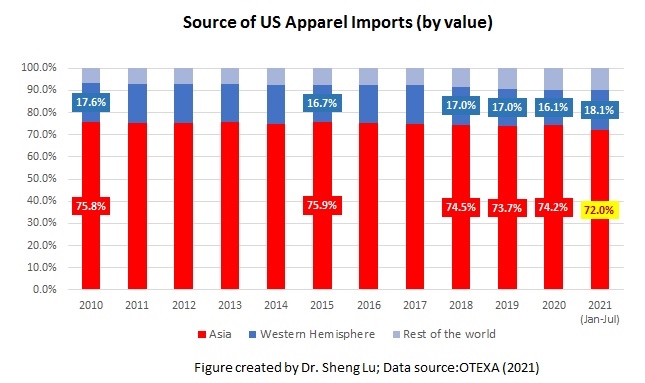
Notably, measured in value, only 71.6% of US apparel imports came from Asia in 2023, the lowest in five years. Highly consistent with the US Fashion Industry Association’s Benchmarking Survey results, OTEXA’s data reflected companies’ intention to diversify their sourcing away from Asia due to increasing geopolitical concerns, particularly the rising US-China strategic competition.
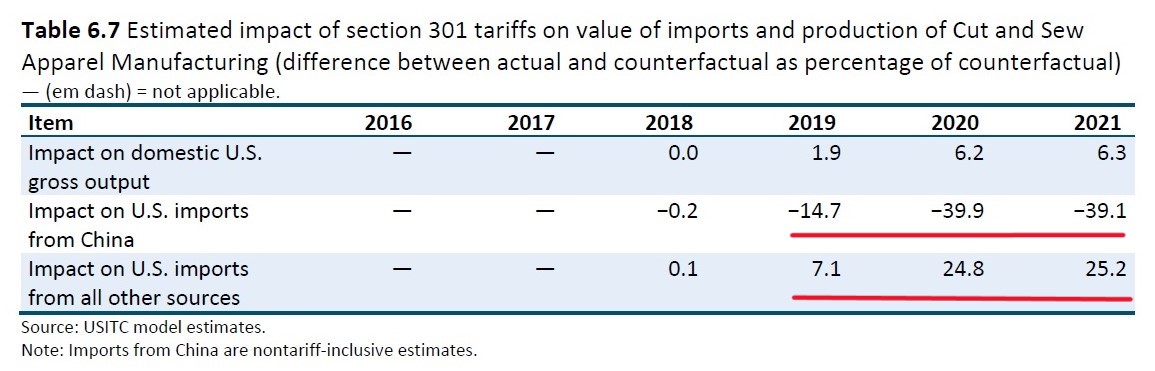
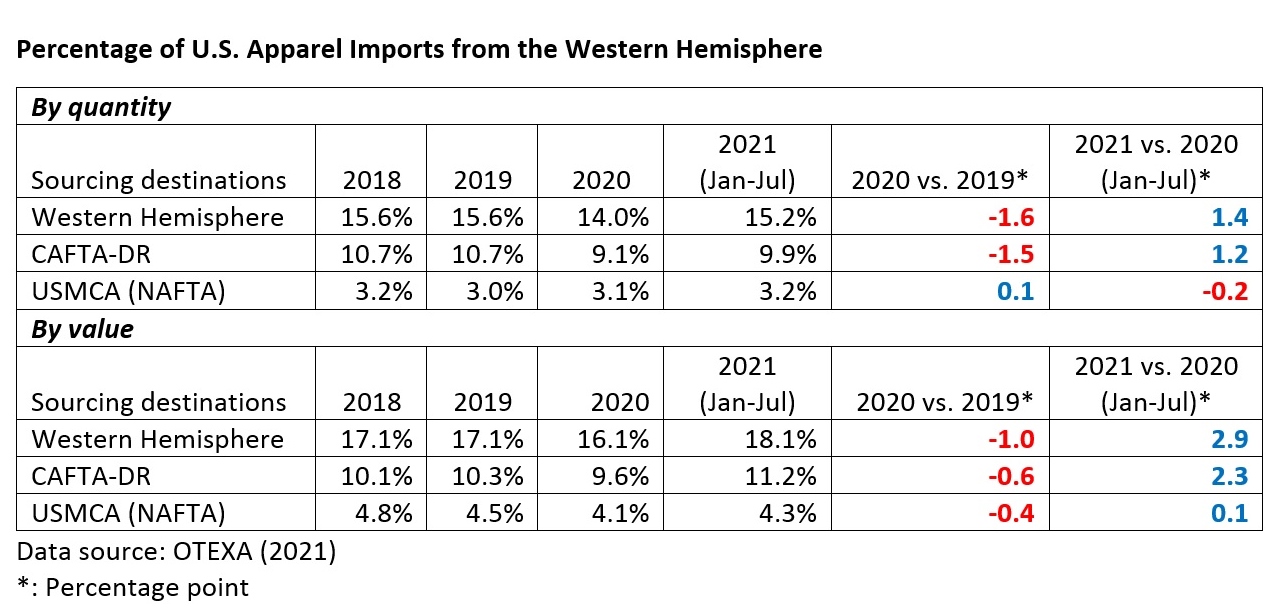
However, it should be noted that Asia’s reduced market share did not benefit “near-shoring” from the Western hemisphere much. For example, in 2023, approximately 14.6% of US apparel imports originated from USMCA and CAFTA-DR members, nearly the same as the 14.3% recorded in 2022. Instead, US apparel imports outside Asia and the Western Hemisphere jumped to 11.4% in 2023 from 9.8% a year ago. Some emerging EU and African suppliers, such as Turkey, Romania, Morocco, and Tunisia, performed relatively well in the US market in 2023, although their market shares remained small. We could highly expect the sourcing diversification strategy to continue in 2024 as many companies regard the strategy as the most effective to mitigate various market uncertainties and sourcing risks.

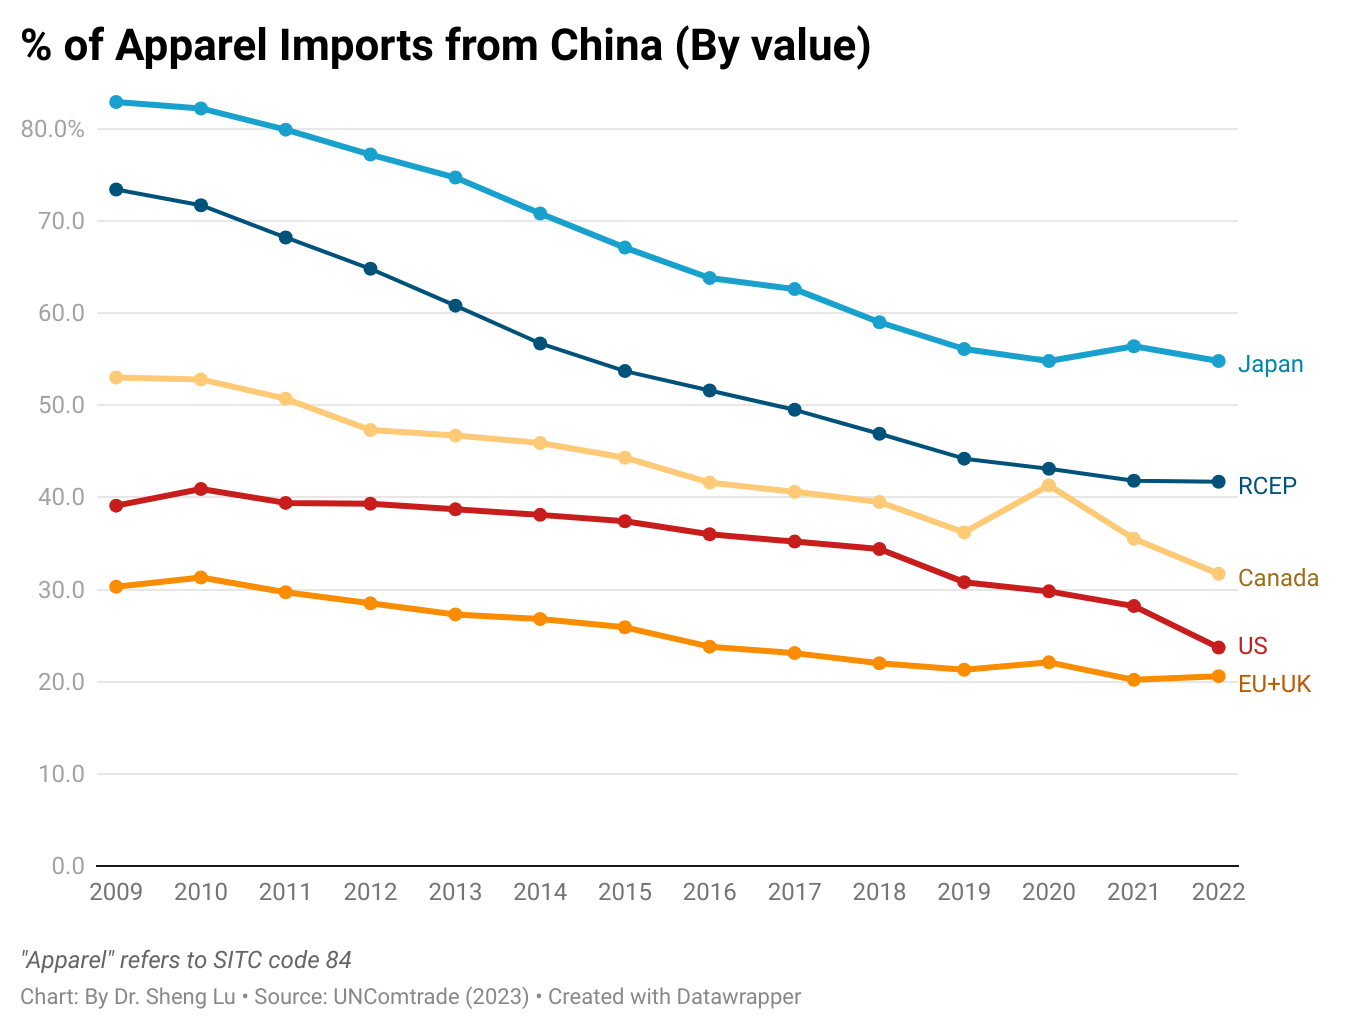
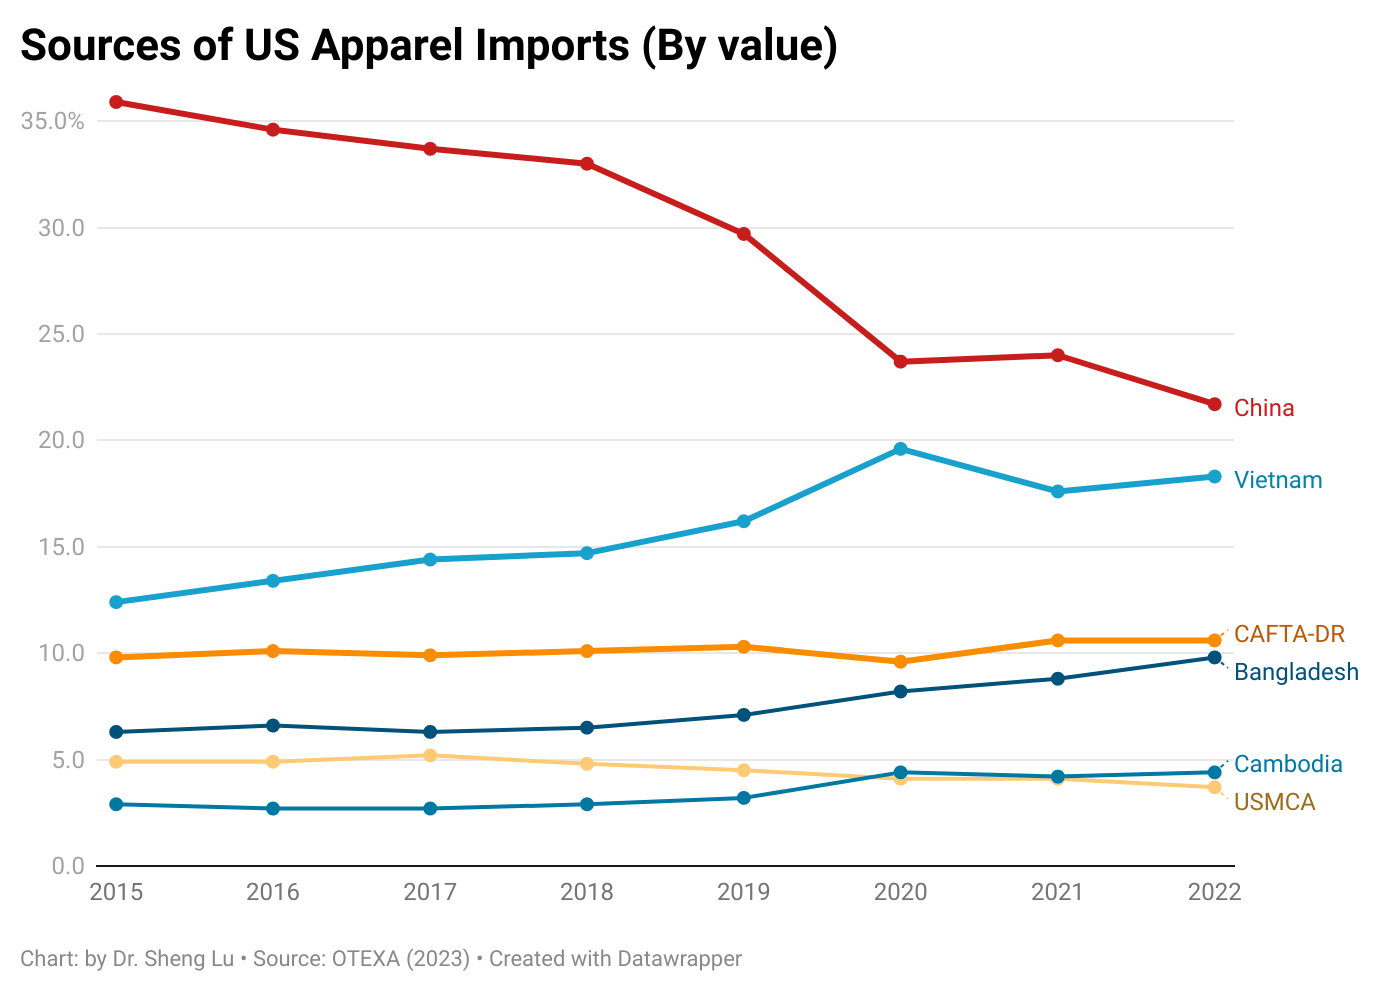
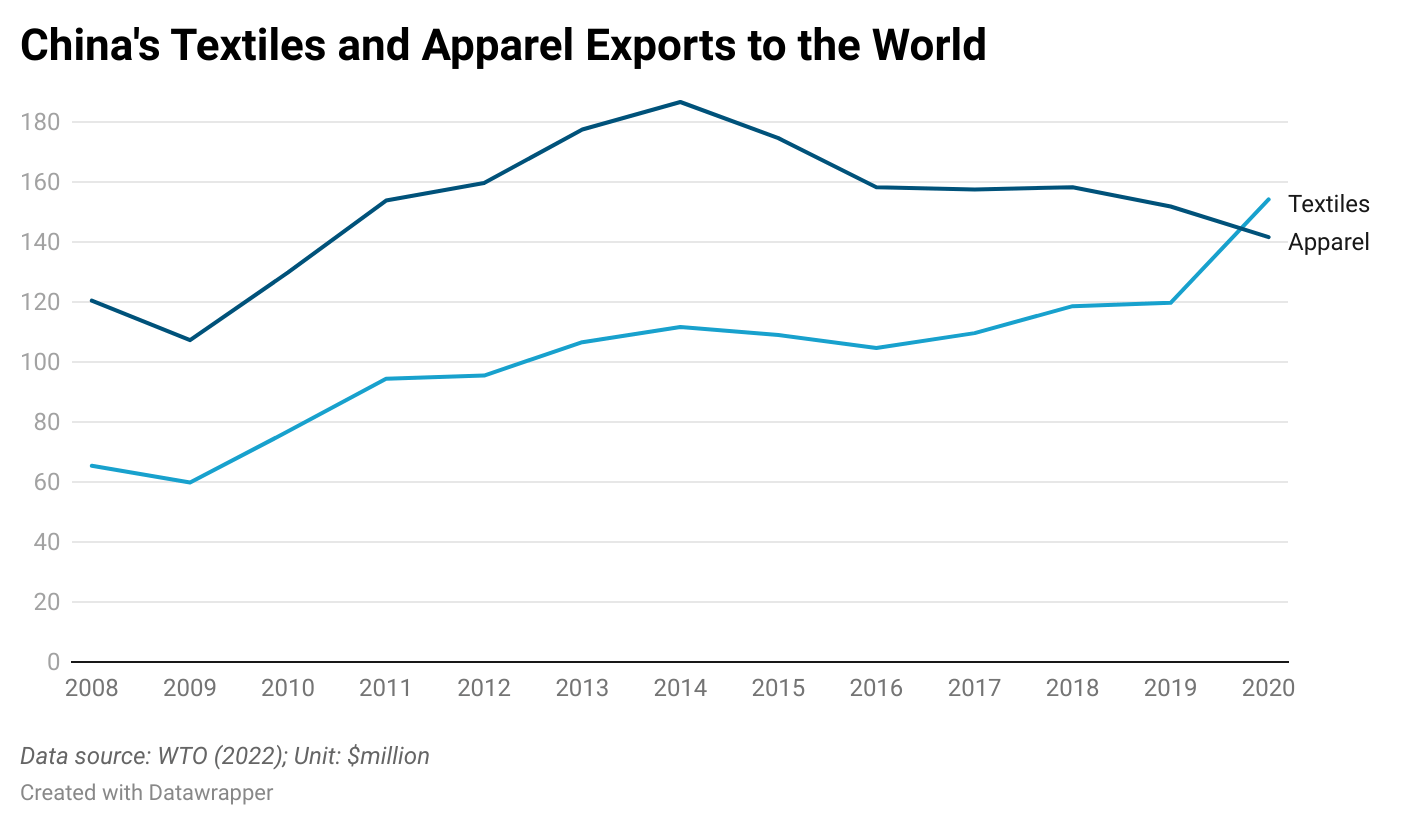
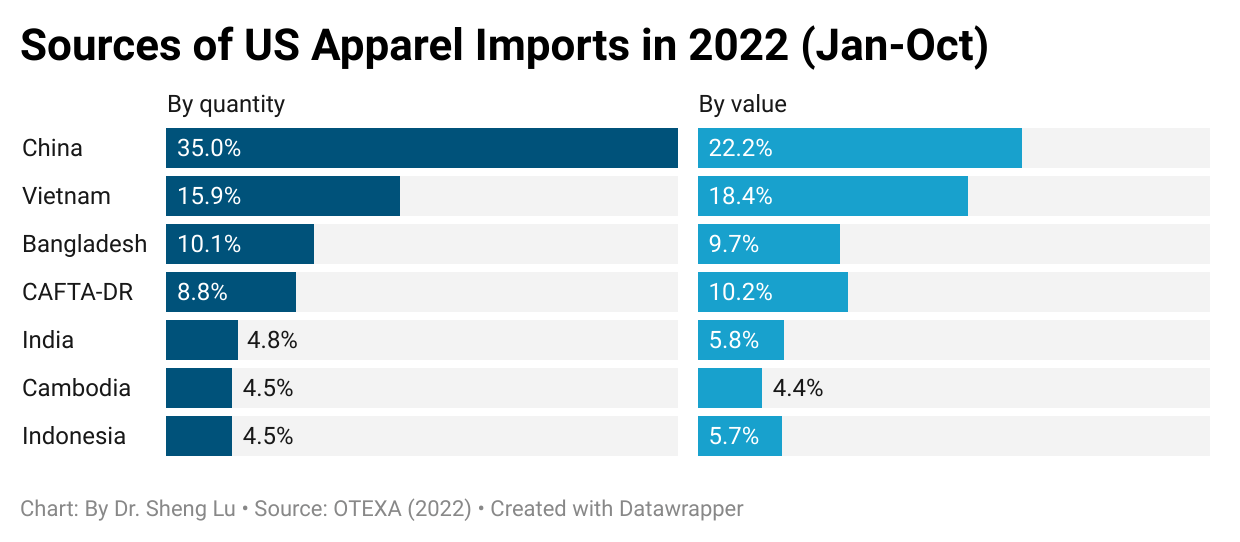
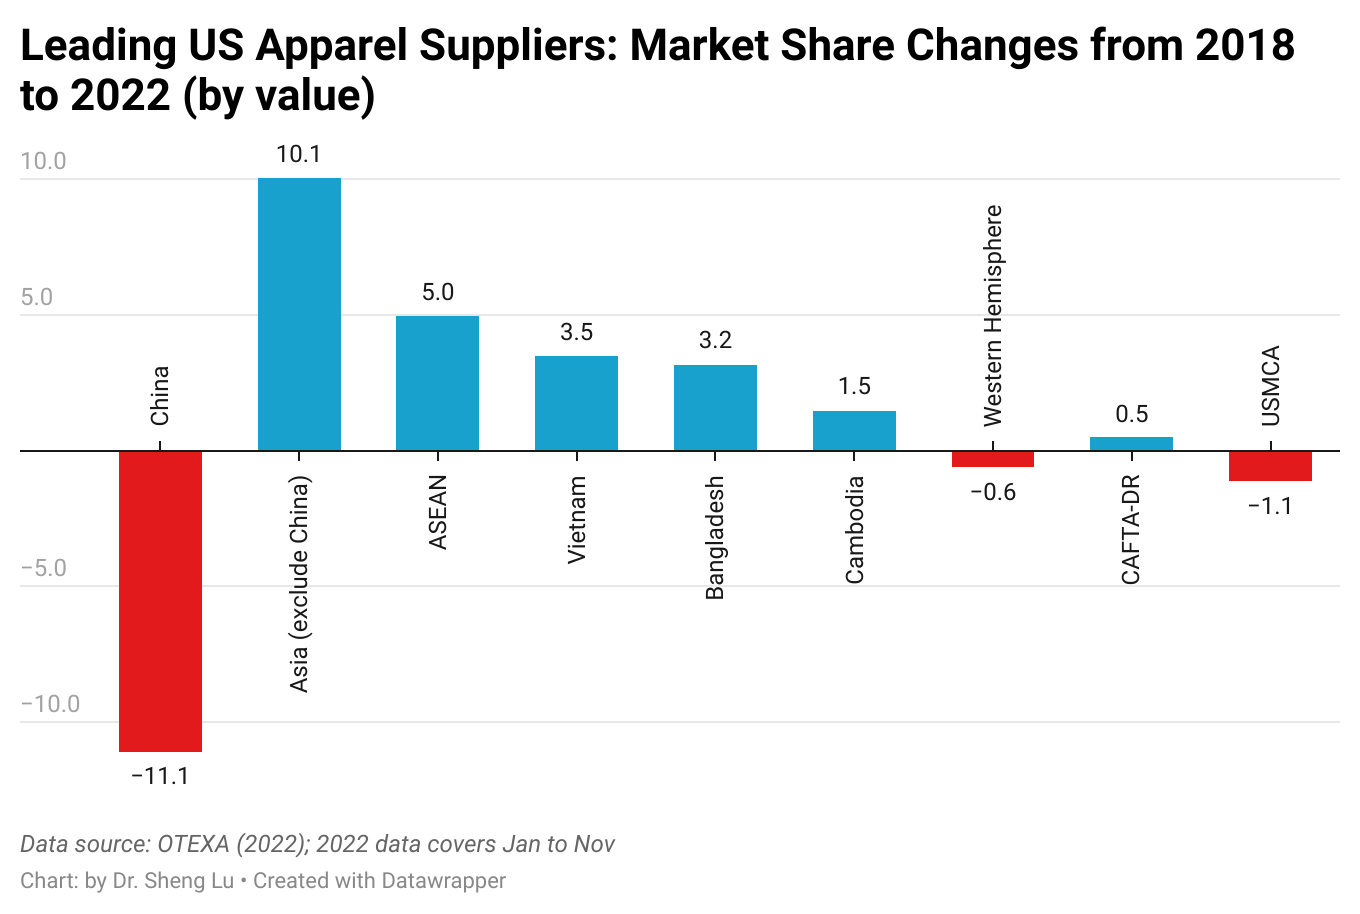
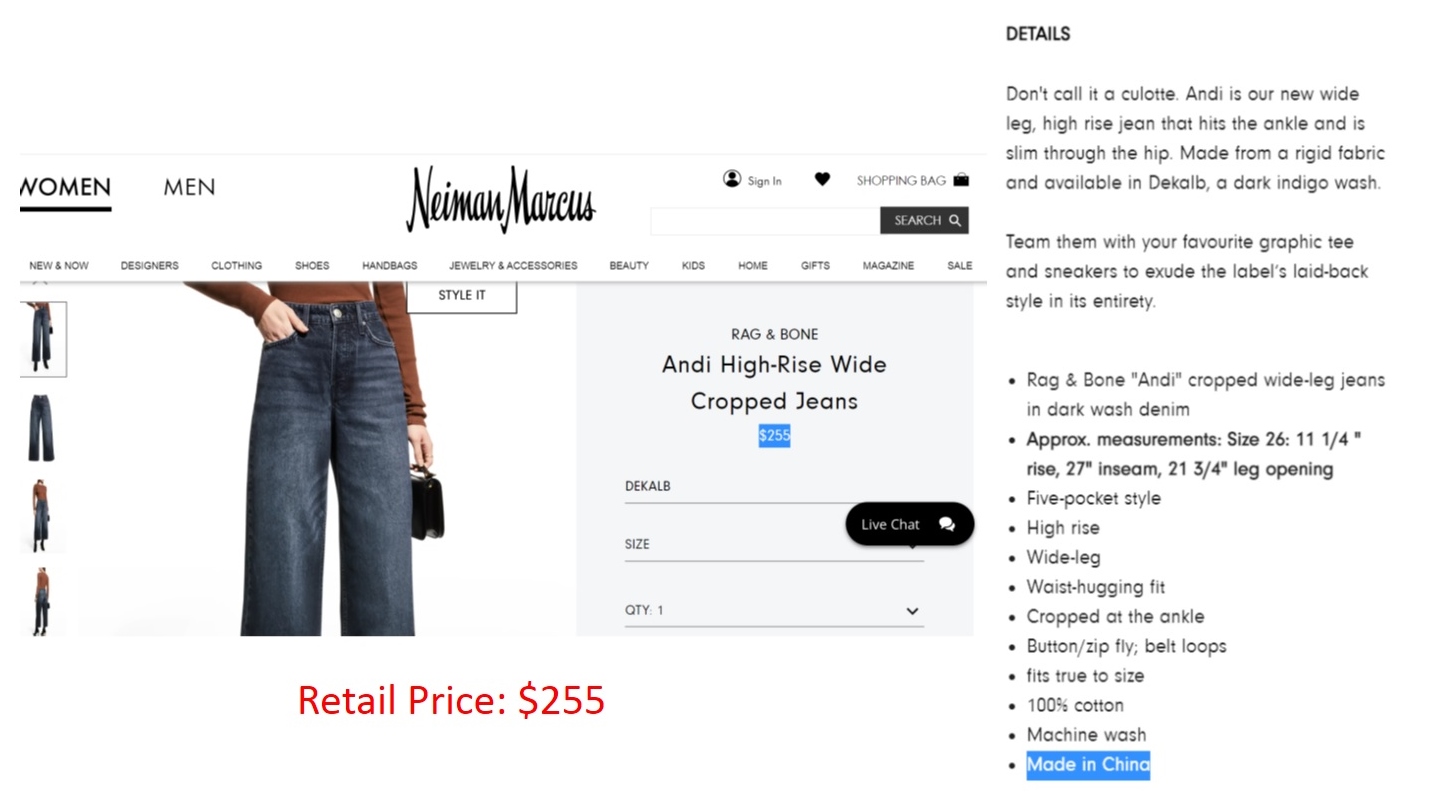
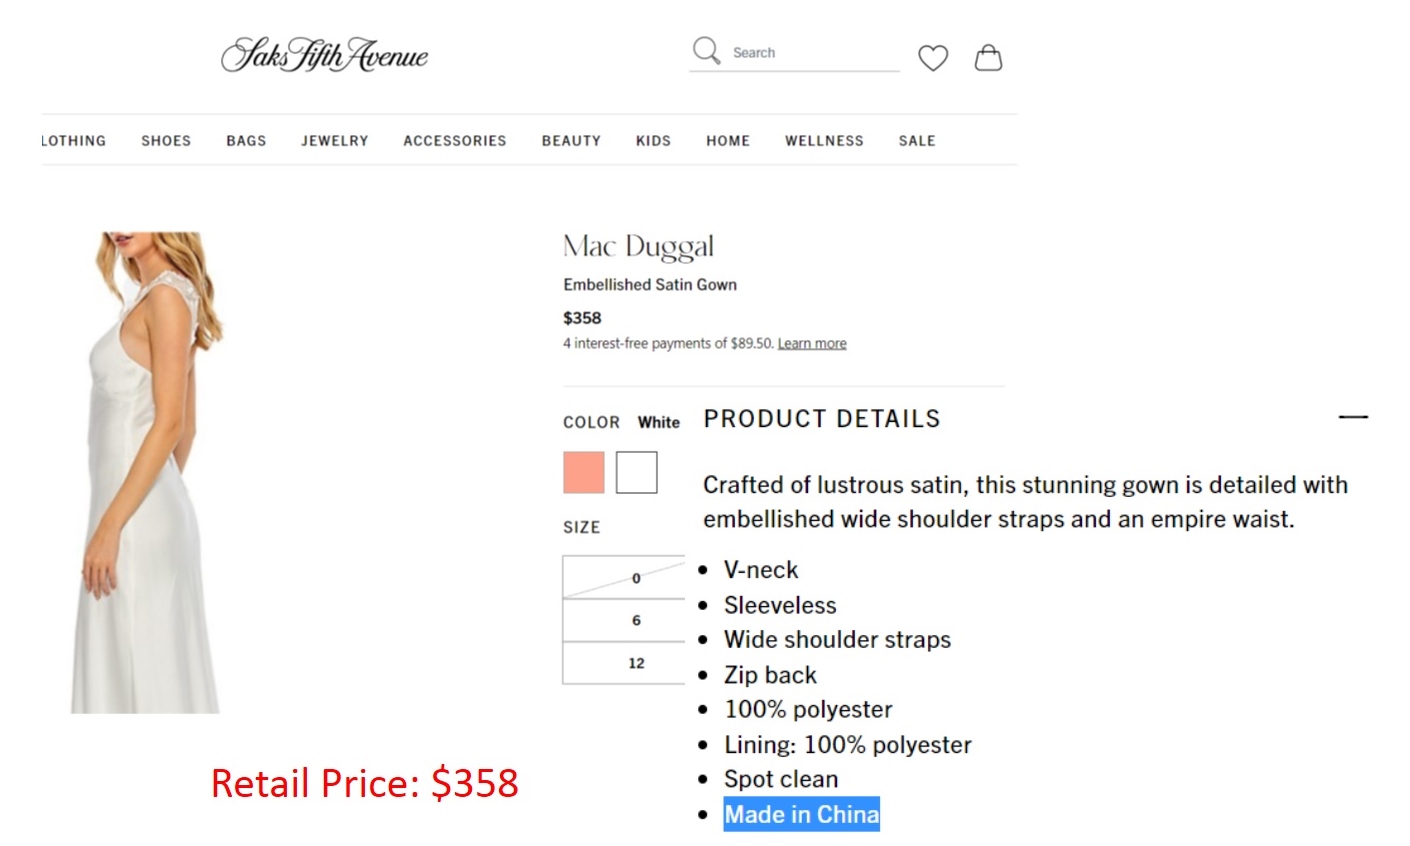
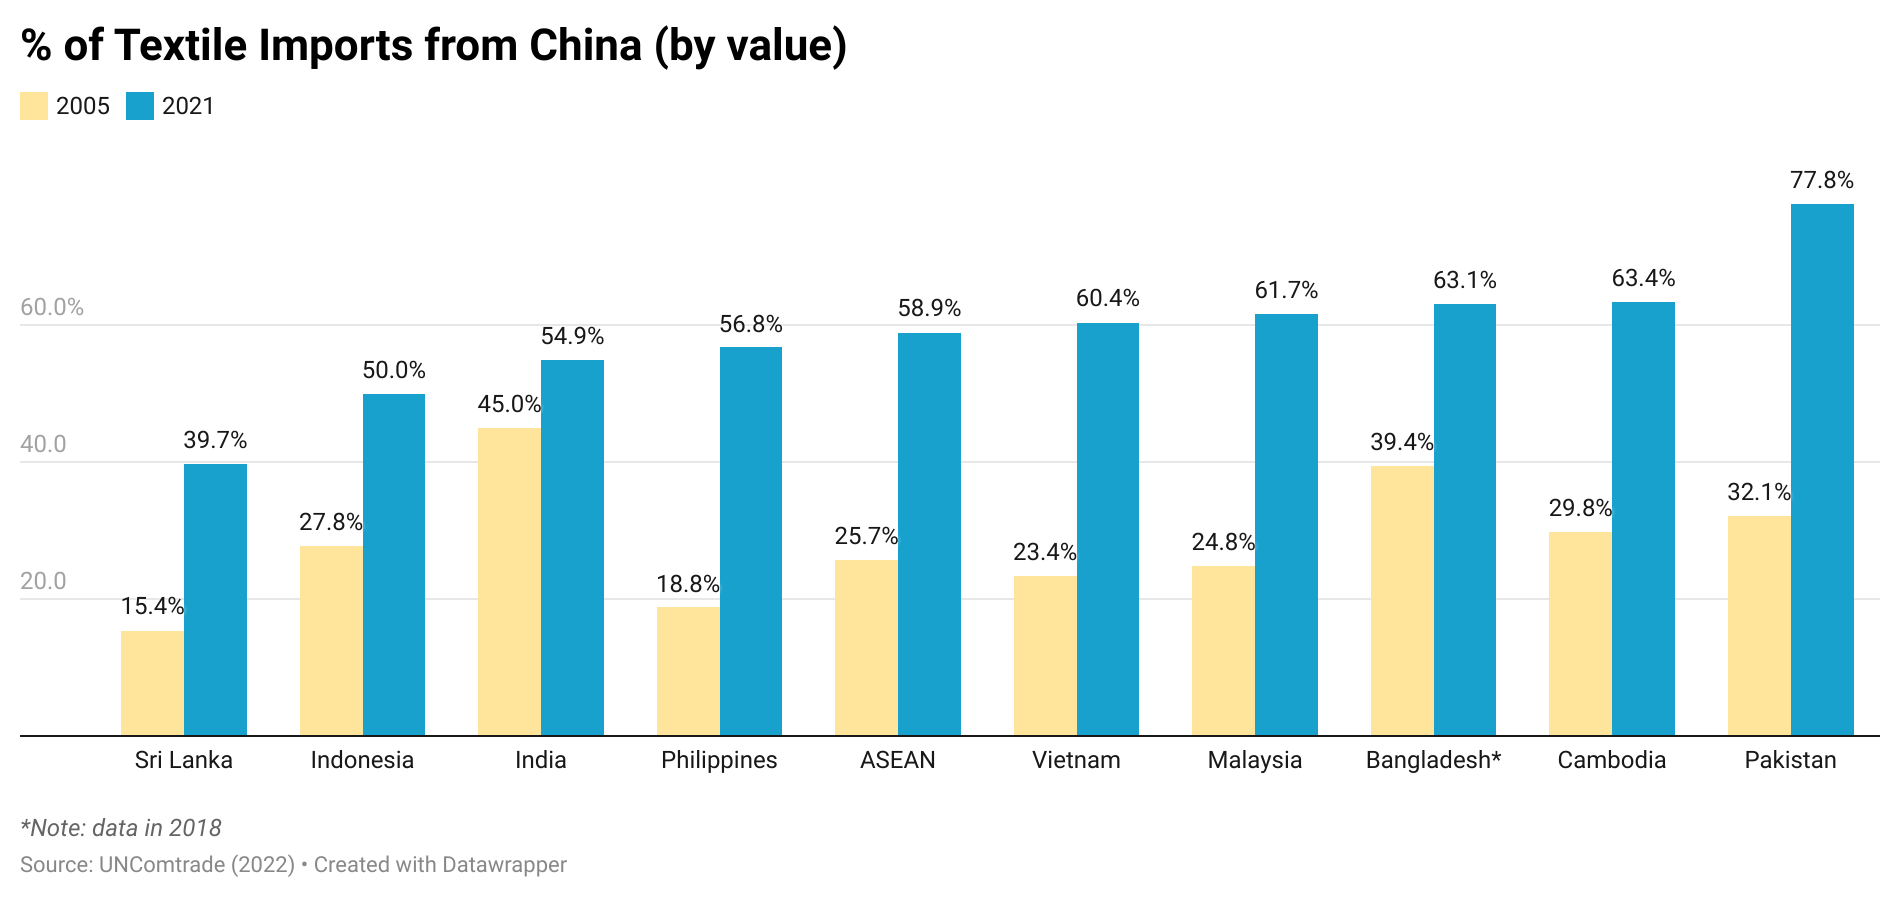
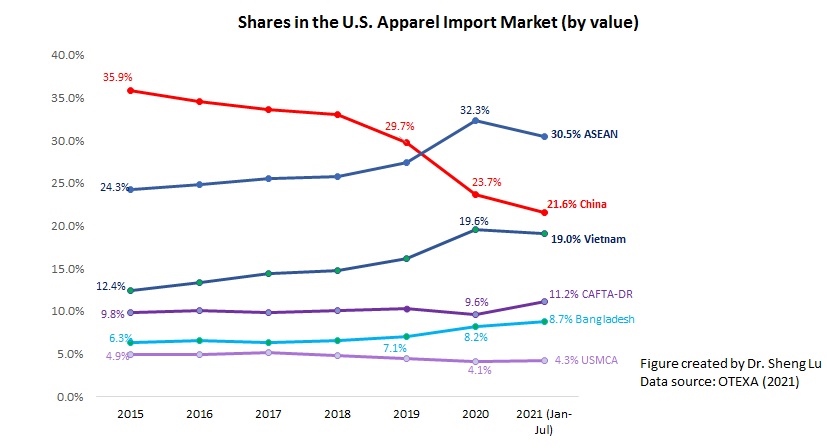
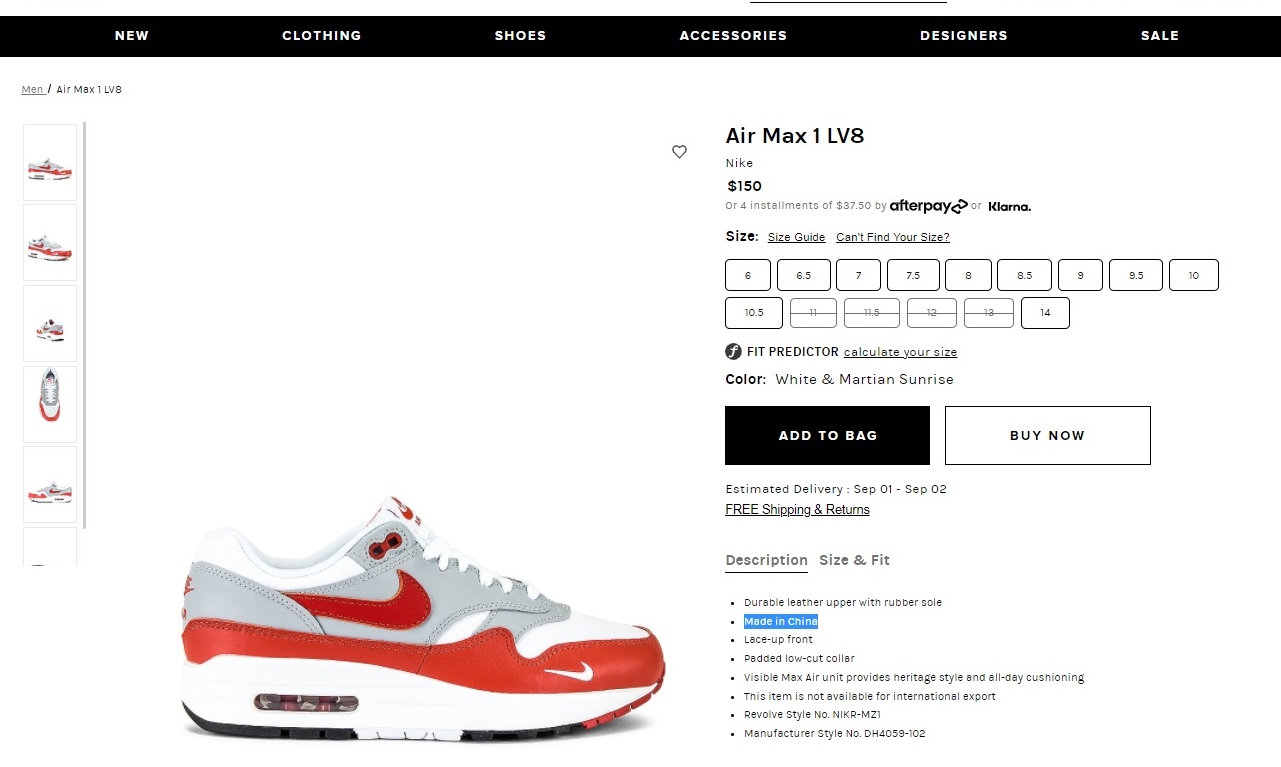
Fourth, US fashion companies continued reducing their China exposure as much as possible, but China will remain a key player in the game. On the one hand, about 20.0% of US apparel imports in value and 25.9% in quantity came from China in 2023, both hit a new low in the past decade. Recent studies also show that it became increasingly common for China to no longer be the largest source of apparel imports for many US fashion companies.


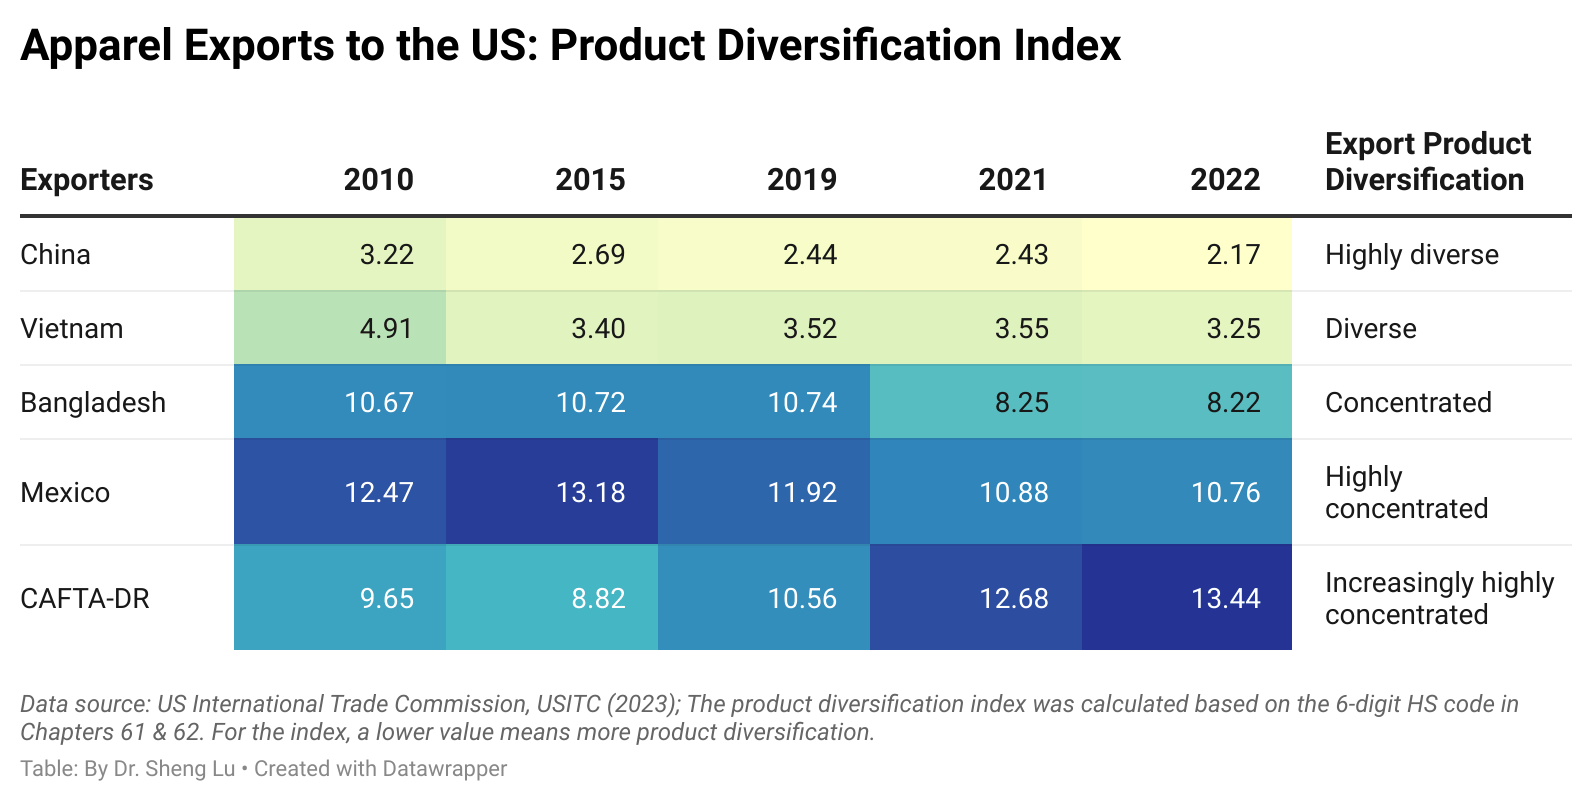
However, China remains highly competitive in terms of the variety of products it offers. For example, the export product diversification index, calculated based on trade data at the 6-digit HTS code level (Chapters 61 and 62), shows that few other countries can match China’s product variety. Likewise, product level data collected from industry sources indicates that China offered far more clothing styles (measured in Stock Keeping Units, SKUs) than its competitors in 2023. According to the results, rather than identifying 1-2 specific “next China,” US fashion companies appeared to leverage “category killers”—for example, utilizing Vietnam as a sourcing base for outerwear, underwear, and swimwear; India for dresses, and Bangladesh for large-volume basic knitwear items.
Related to this, another recent study found that the top five largest Asian suppliers next to China, including Vietnam, Bangladesh, Indonesia, India, and Cambodia, collectively can offer diverse product categories almost comparable to those from China in the US market.

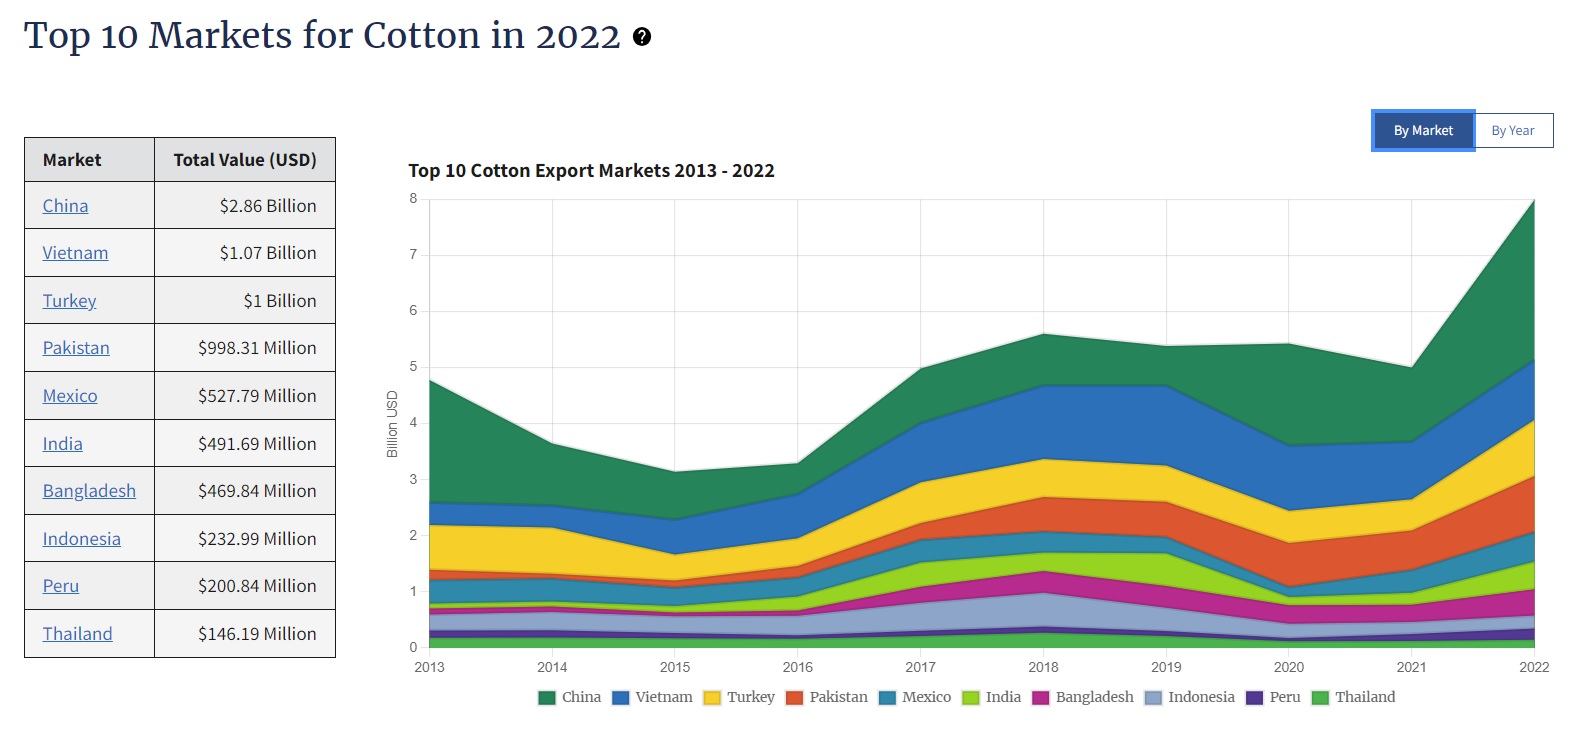
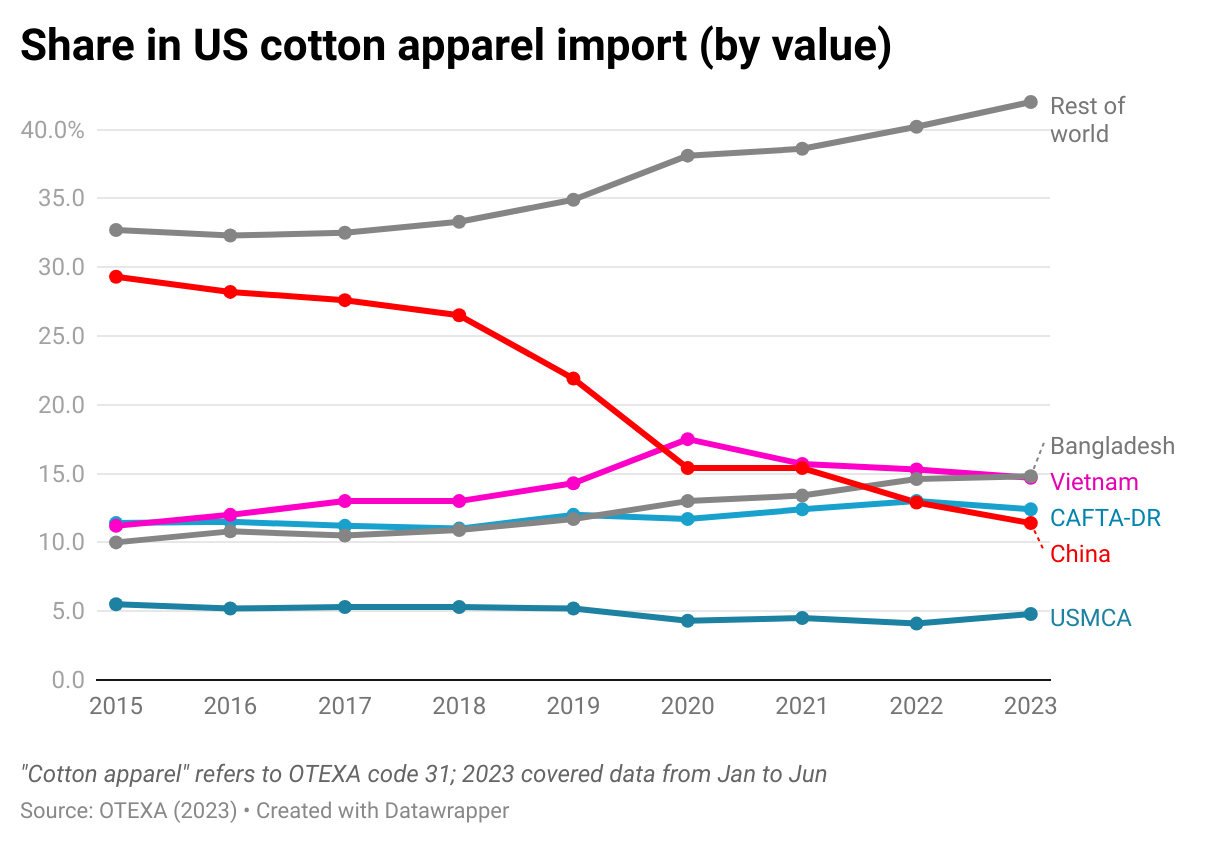
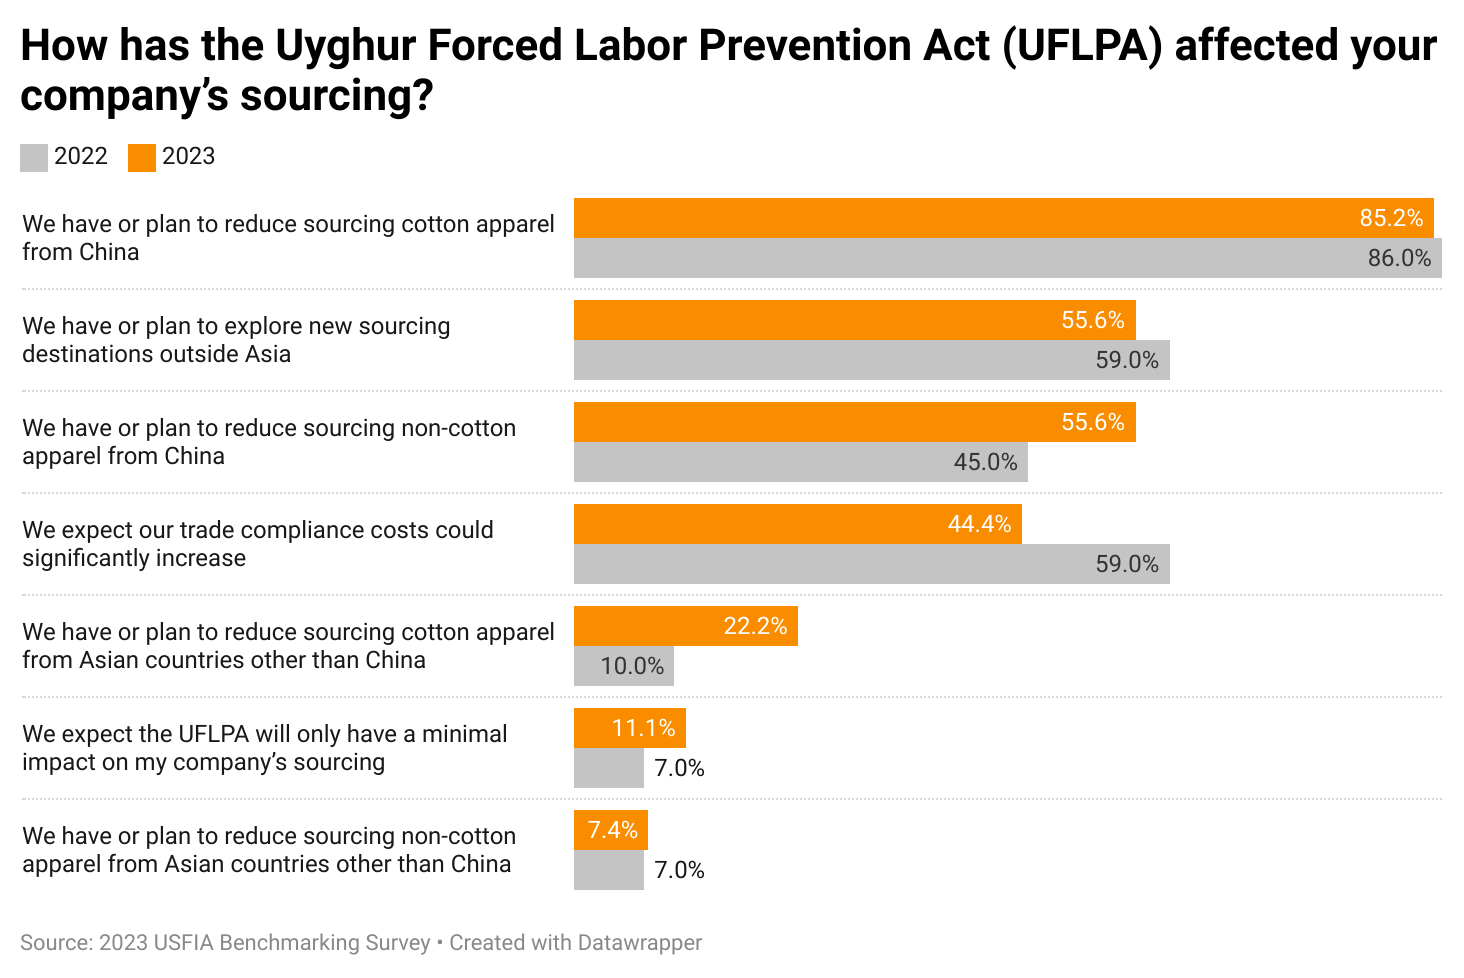
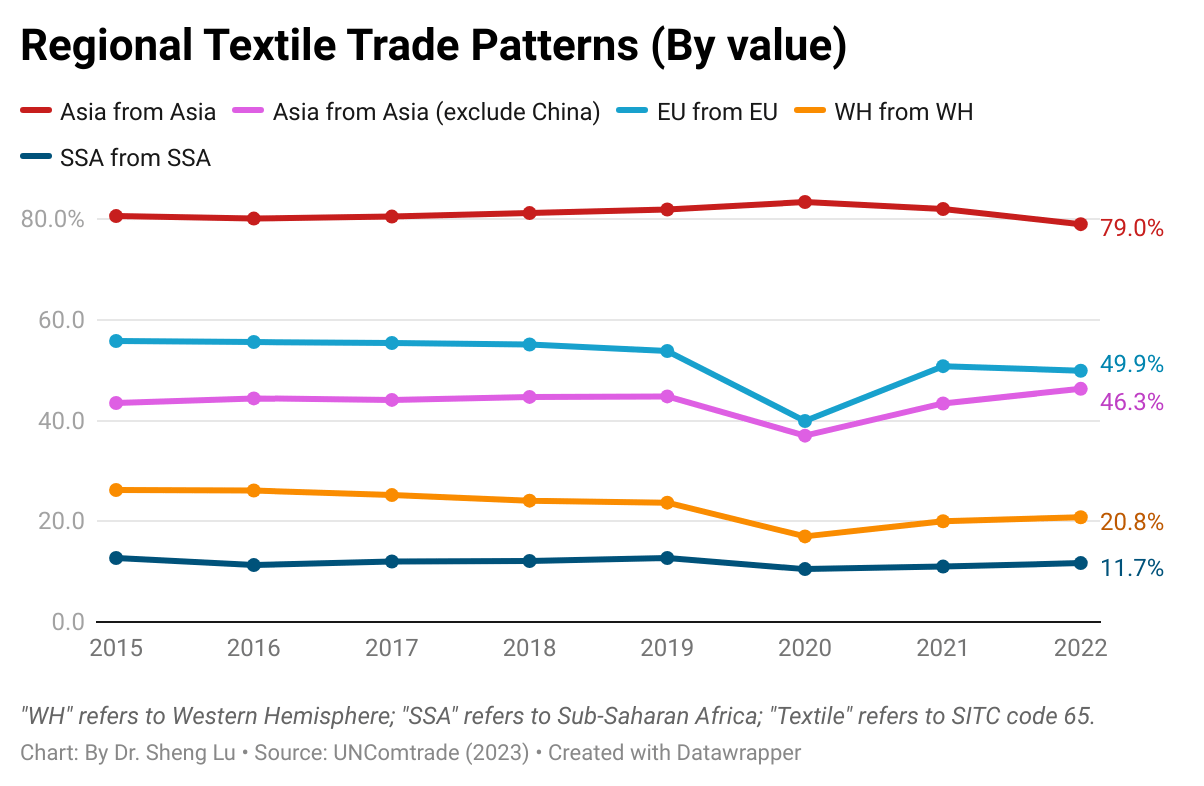
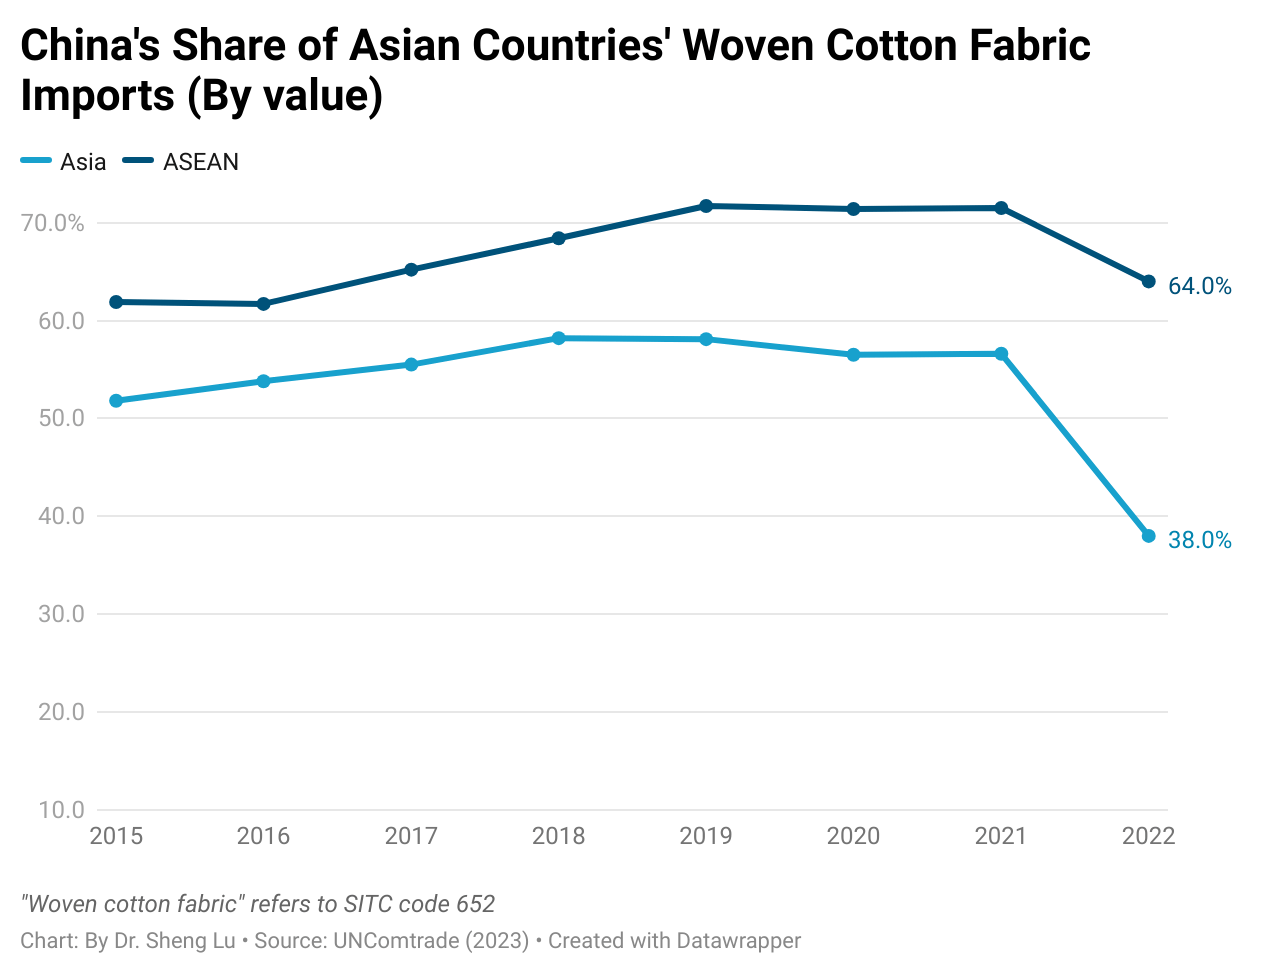
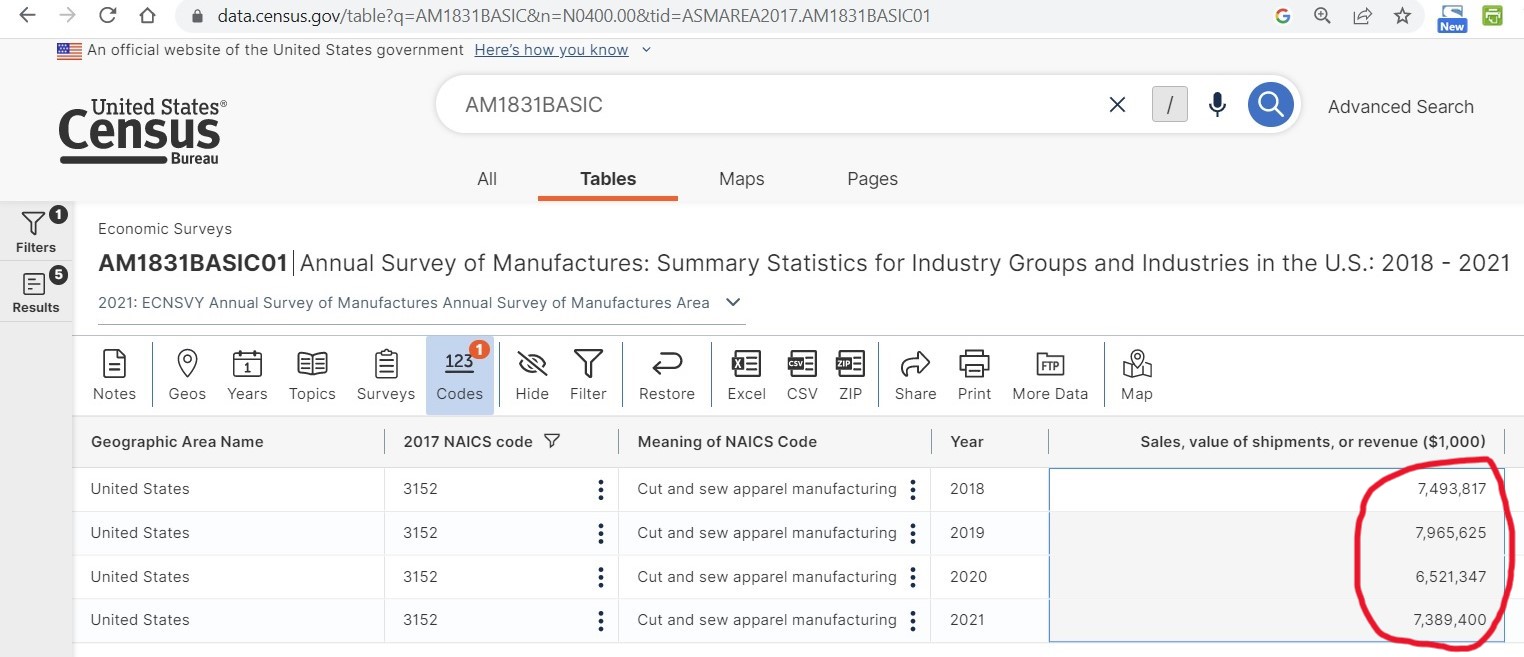
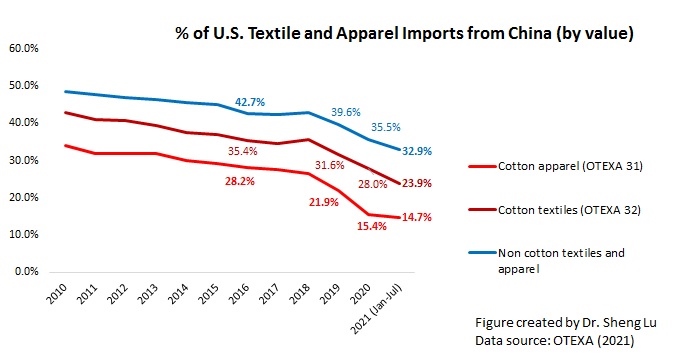
Fifth, trade data reveals early signs that US fashion companies are gradually reducing sourcing cotton apparel products from Asia because of the implementation of the Uyghur Forced Labor Prevention Act (UFLPA). Notably, when concerns about cotton made by Xinjiang forced labor initially emerged in 2018, US fashion companies quickly shifted sourcing orders for cotton apparel (OTEXA code 31) from China to other Asian countries. However, UFLPA’s enforcement increasingly targets imports from Asian countries other than China due to the highly integrated regional textile and apparel supply chain and Asian countries’ heavy reliance on textile inputs from China. Consequently, Asia (excluding China) accounted for a declining share in the total imports of US cotton apparel in 2023.

Meanwhile, affected by UFLPA’s enforcement, only 11.8% of US cotton apparel imports came from China in 2023, marking a further decline from 13% in 2022 and reaching a new low for the past decade. China also deliberately decreased the percentage of cotton apparel in its total apparel exports to the US market, dropping from nearly 40% in 2017 to only 25% in 2023. In comparison, cotton apparel consistently represented about 45% of total US apparel imports during the same period.


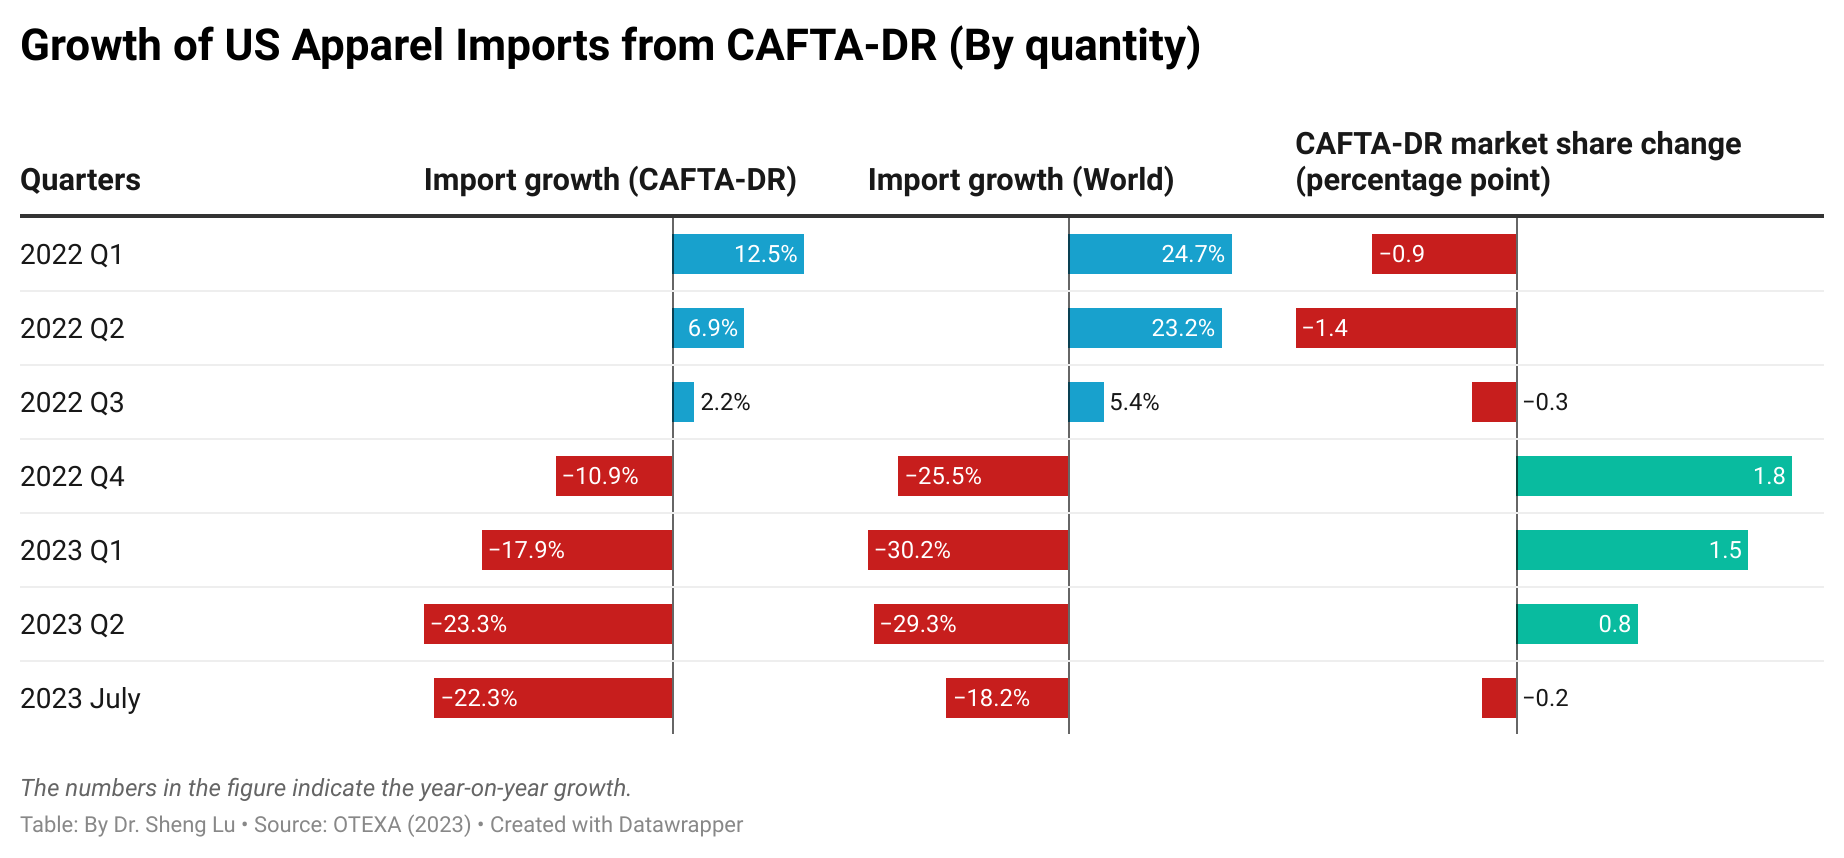
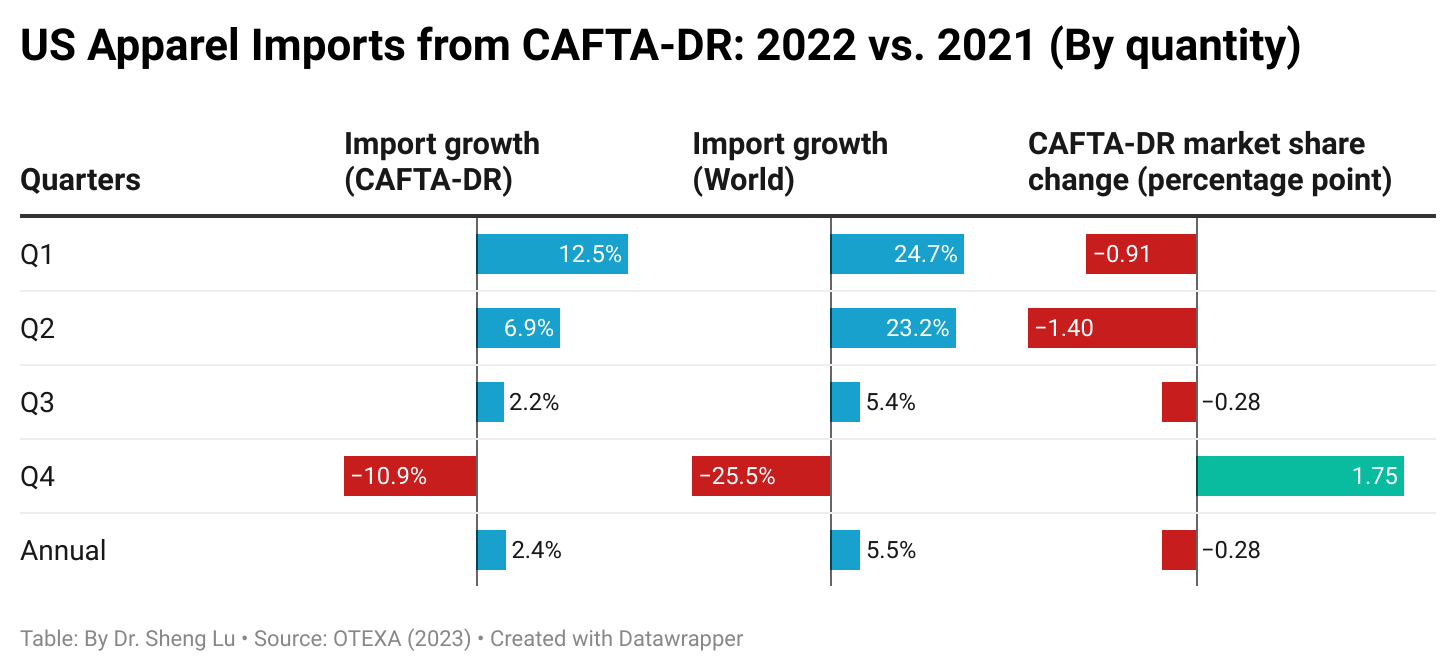
Additionally, while there was no substantial increase in the volume of US apparel imports from CAFTA-DR members, as a silver lining, the utilization of the trade agreement improved. In 2023, about 19.2% of US apparel imports claimed duty-free benefits under US free trade agreements and trade preference programs, a notable increase from 17.7% in 2022. Most such imports came under CAFTA-DR (45.4%) and USMCA (19.7%).

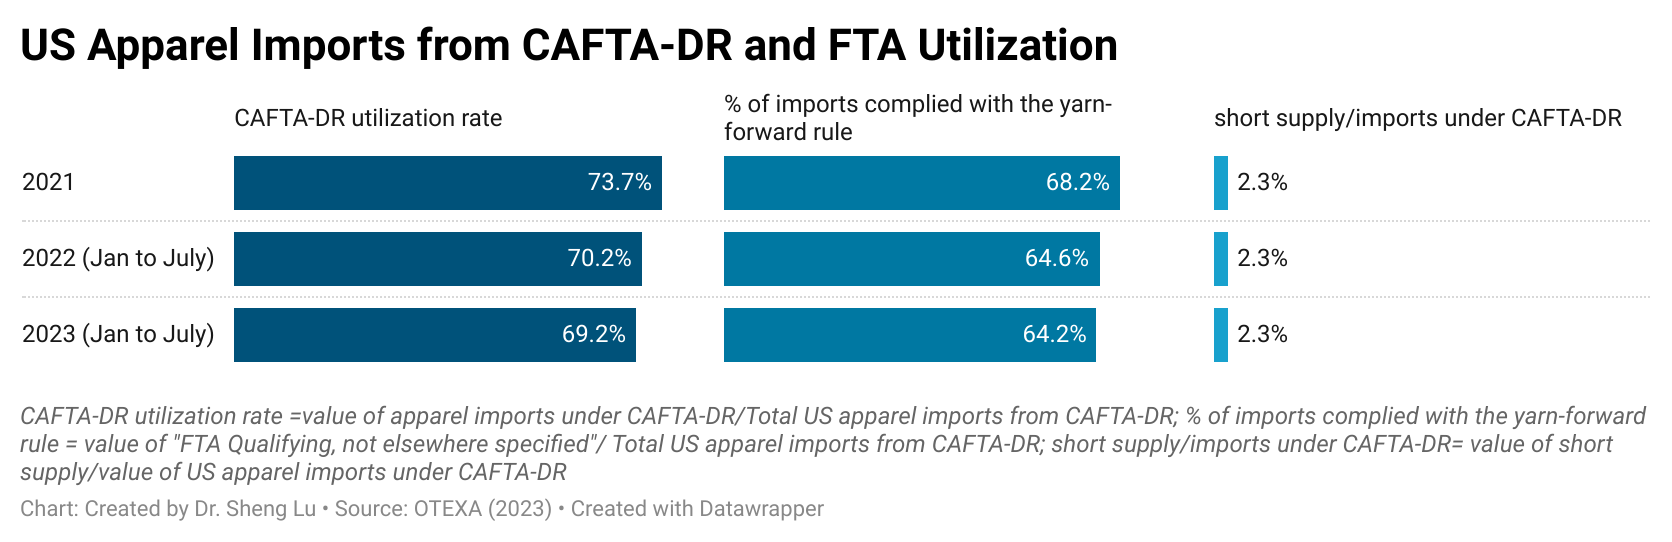
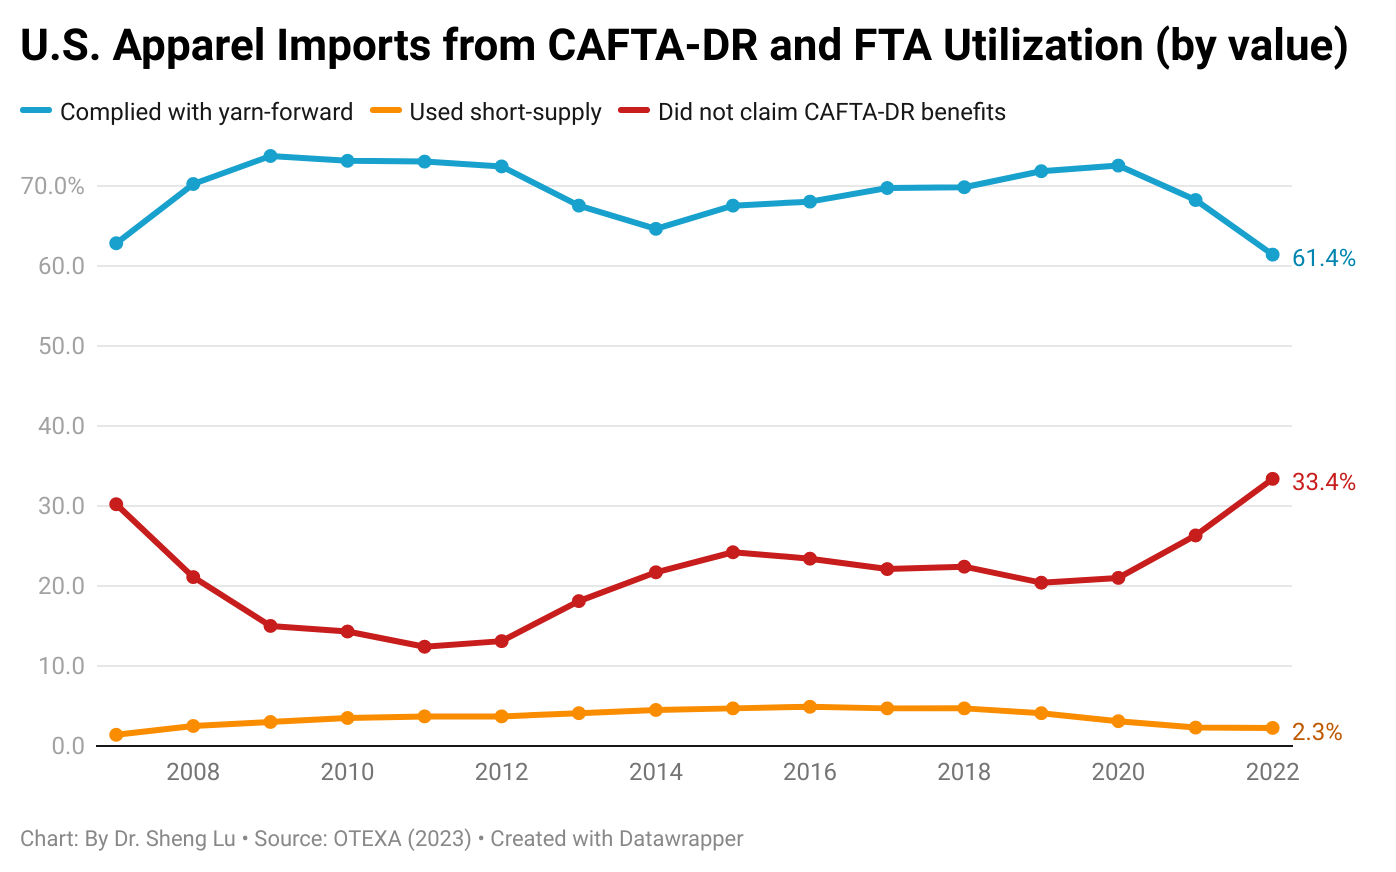
Meanwhile, in the first 12 months of 2023 (latest OTEXA data), about 70.2% of US apparel imports came from CAFTA-DR members claimed the duty-free benefit, up from 66.6% the same period a year ago. Particularly, 65.4% of US apparel imports under CAFTA-DR complied with the yarn-forward rules of origin in 2023, a notable increase from 61.3% in 2022. Another 2.6% of imports utilized the agreement’s short supply mechanism, which also went up from 2.3% in 2022. The results could reflect an ever more integrated regional textile and apparel supply chain among CAFTA-DR members due to increasing investments made in the region in recent years. However, there is still much that needs to be done to effectively increase the volume of US apparel imports from the region.
by Sheng Lu