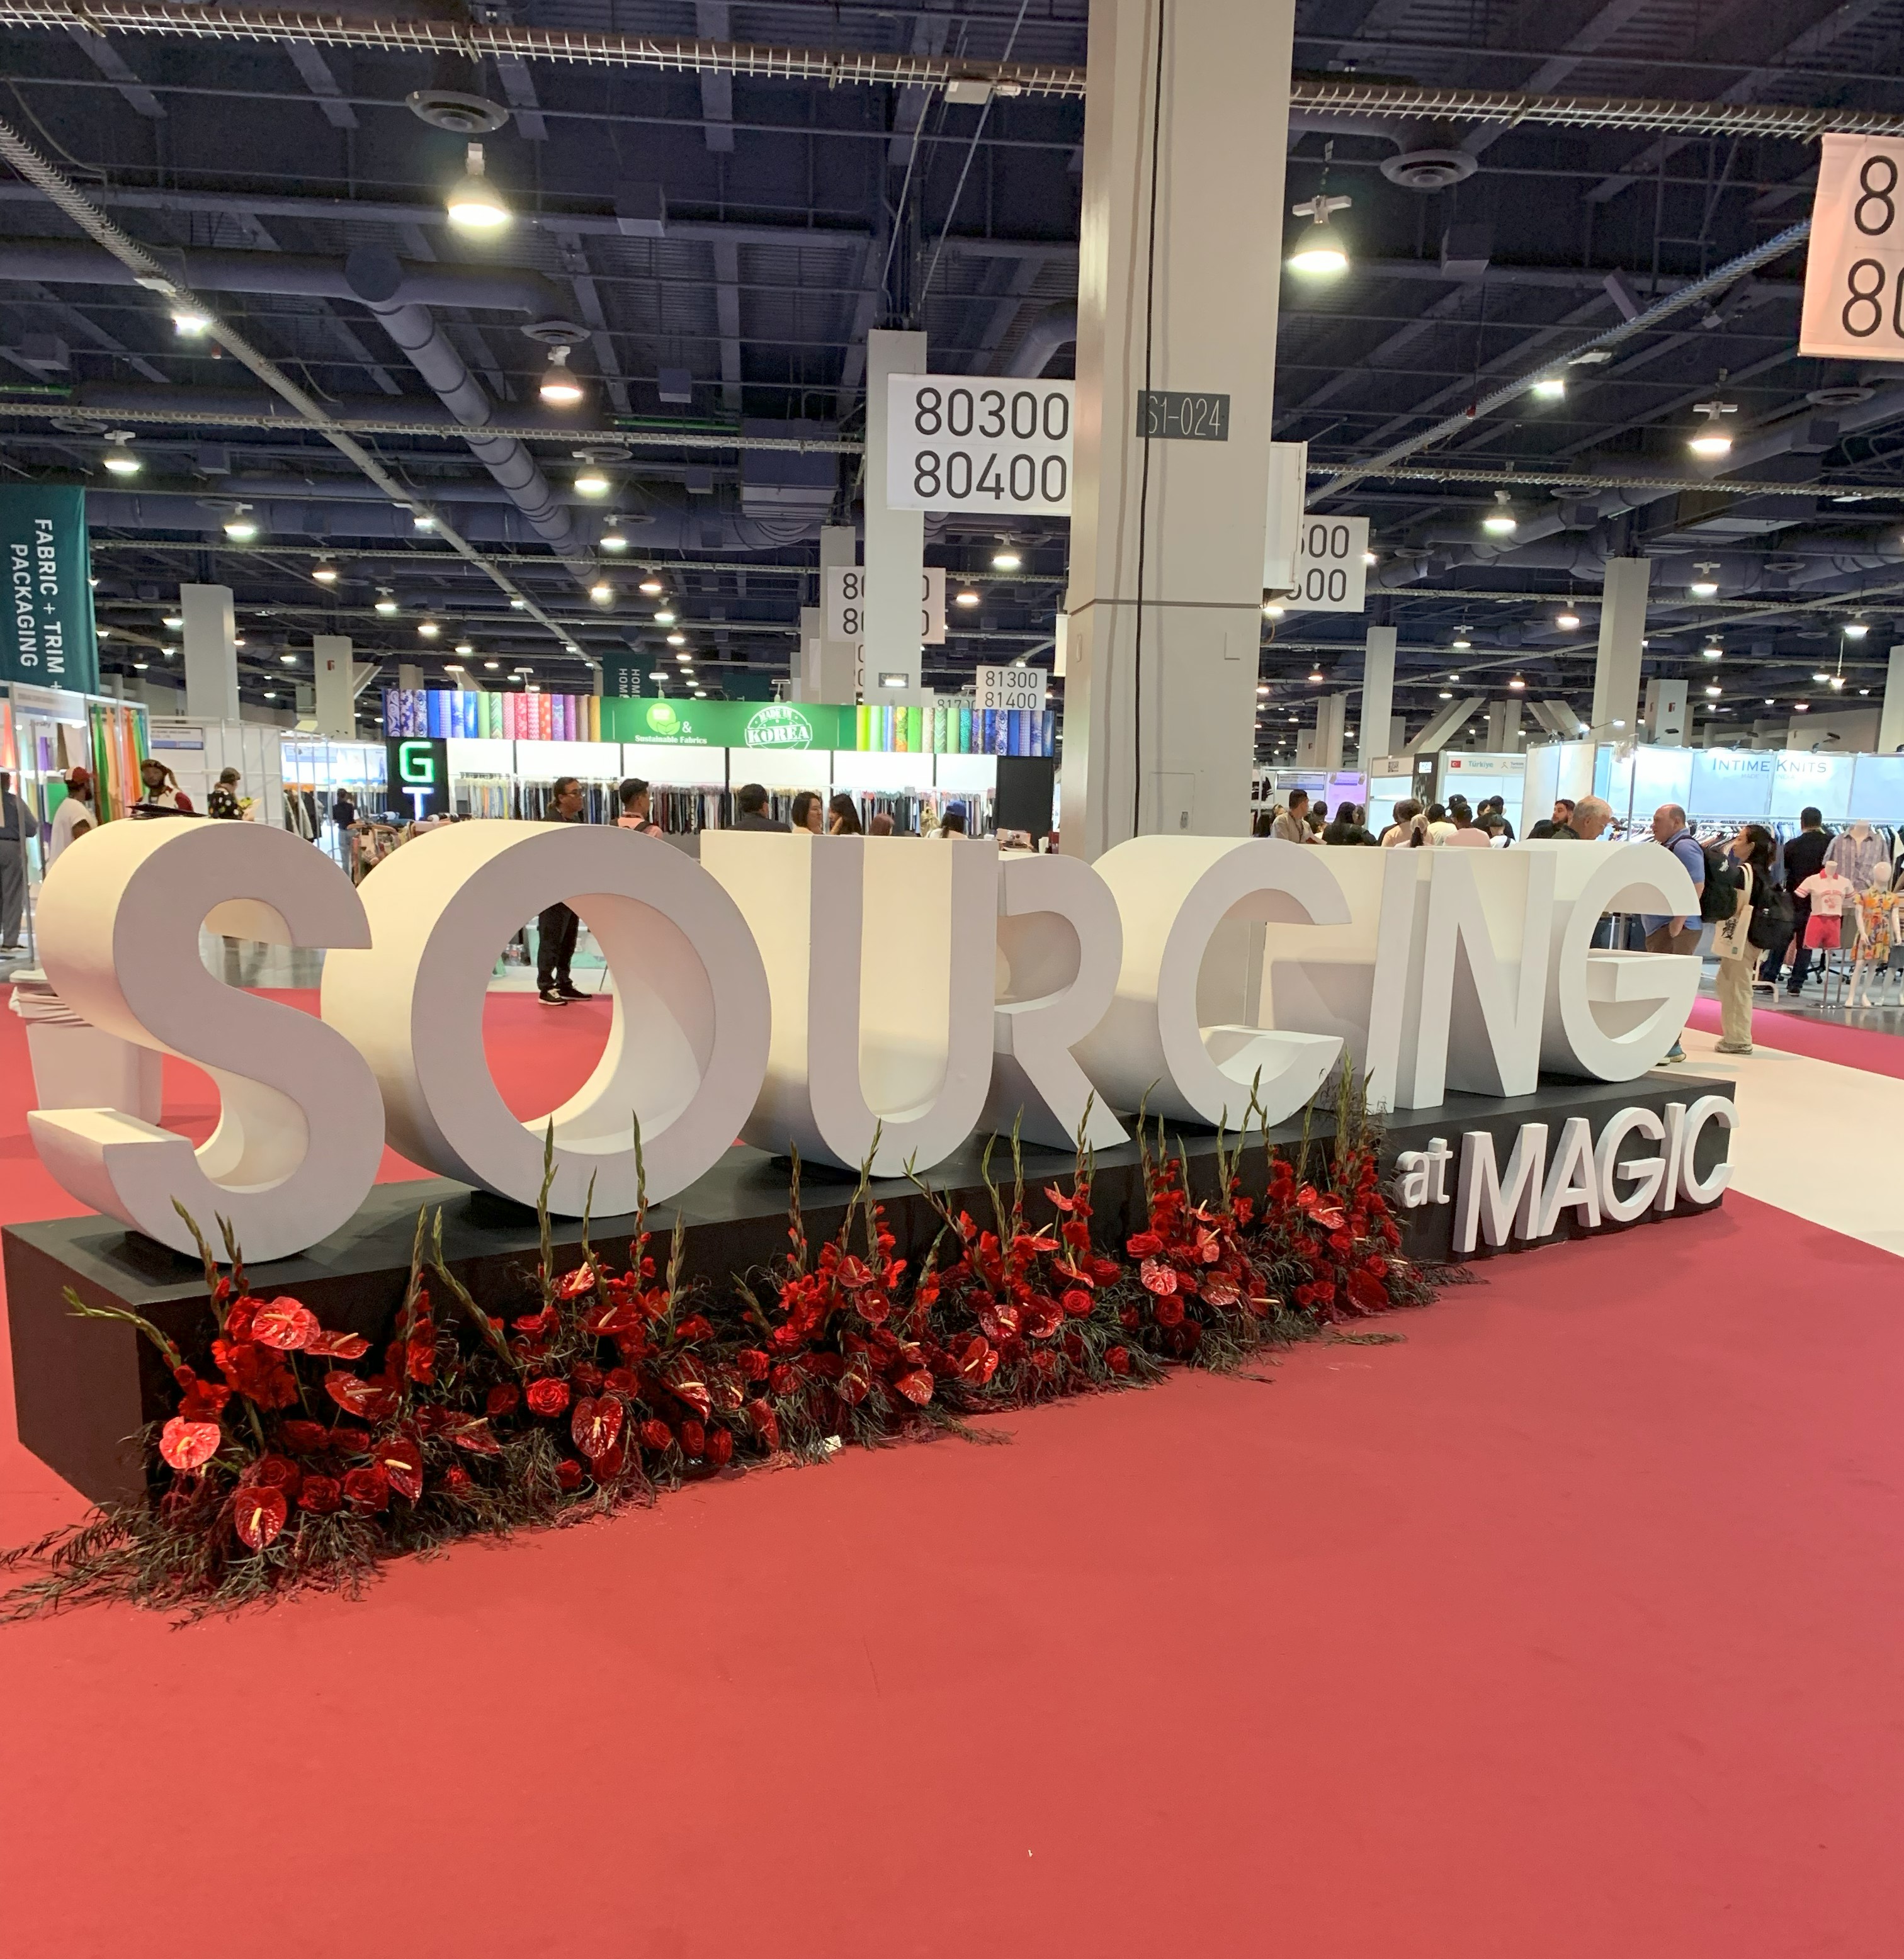
The latest Sourcing at MAGIC, one of the largest and most influential fashion apparel trade shows in North America, was held from August 18 to 20, 2025 in Las Vegas. Drawing thousands of apparel manufacturers, textile raw material suppliers, brands, and retail buyers from over 30 countries around the globe, the event provides a unique opportunity to observe the latest U.S. apparel sourcing trends and market sentiment.
Aligned with the results of the 2025 Fashion Industry Benchmarking Study released by the United States Fashion Industry Association (USFIA), the hiking tariffs imposed by the Trump administration and ongoing policy uncertainty were among the top concerns for MAGIC attendees. One major tariff impact often heard at the MAGIC show was the growing inflationary pressure. It was a prevailing view among vendors, brands, and retailers that a price increase had begun and would become even more noticeable to U.S. consumers in the upcoming months. Some also argue that “tariff is no longer a sourcing problem,” but how brands and retailers should handle their “profit margin, product assortment, and pricing.”
Meanwhile, apparel suppliers care significantly about the additional “reciprocaltariff” rates they face compared to their key competitors. For instance, a jeans supplier from Pakistan said they were relieved to see more order inquiries come in, as their Indian competitors faced significantly higher tariff rates threatened by the Trump administration.
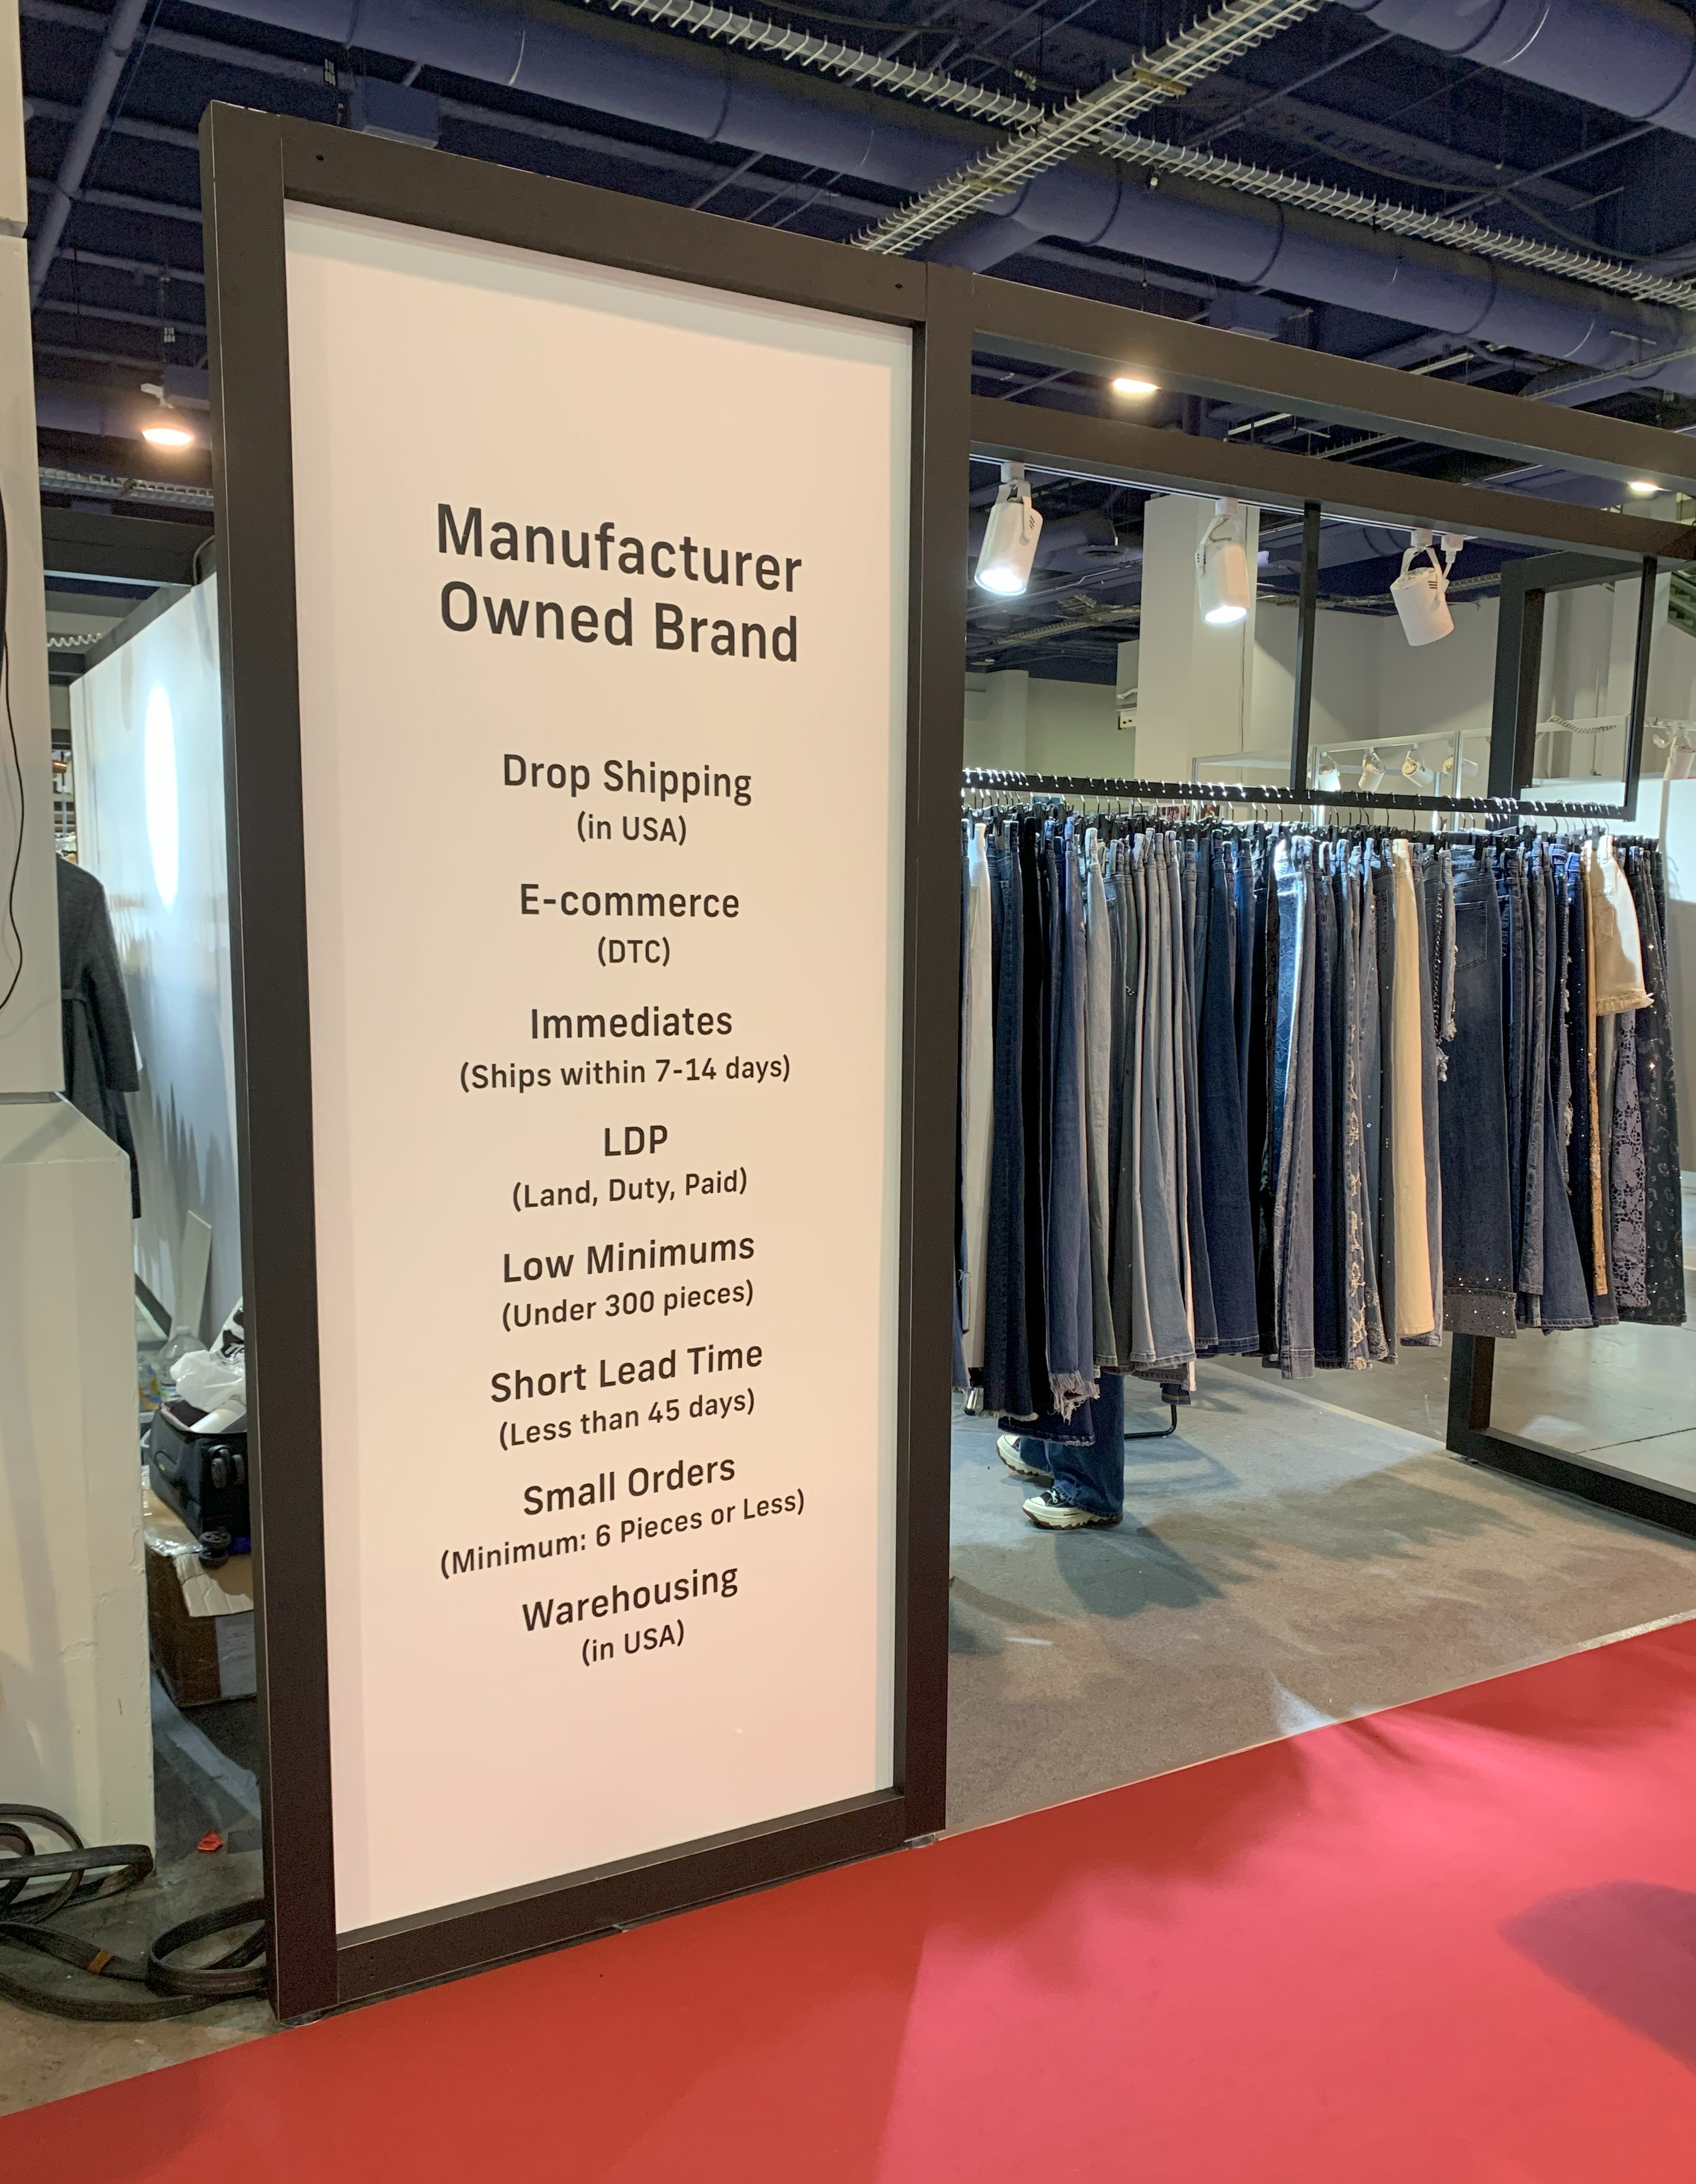
Still, nearly 600 exhibitors from China attended MAGIC, making it the largest delegation from any country. Two interesting phenomena revealed how Chinese suppliers try to stay competitive in today’s challenging business environment. One is to offer various value-added sourcing services beyond physical products. For example, there was a dedicated session at this year’s MAGIC show that featured Chinese manufacturers that provide services such as drop shipping (i.e., when a customer places an order, the retail store never physically handles the product. Instead, the manufacturer is responsible for inventory, packing, and shipping), director to consumer (DTC) e-commerce and warehousing. Meanwhile, some Chinese vendors accept small orders (i.e., 6 pieces or less) or low minimum orders (i.e., 300 pieces) and promise a short lead time of 45 days. In comparison, the minimum order quantity (MOQ) required by suppliers in other Asian and Western Hemisphere countries typically exceeds thousands of pieces.
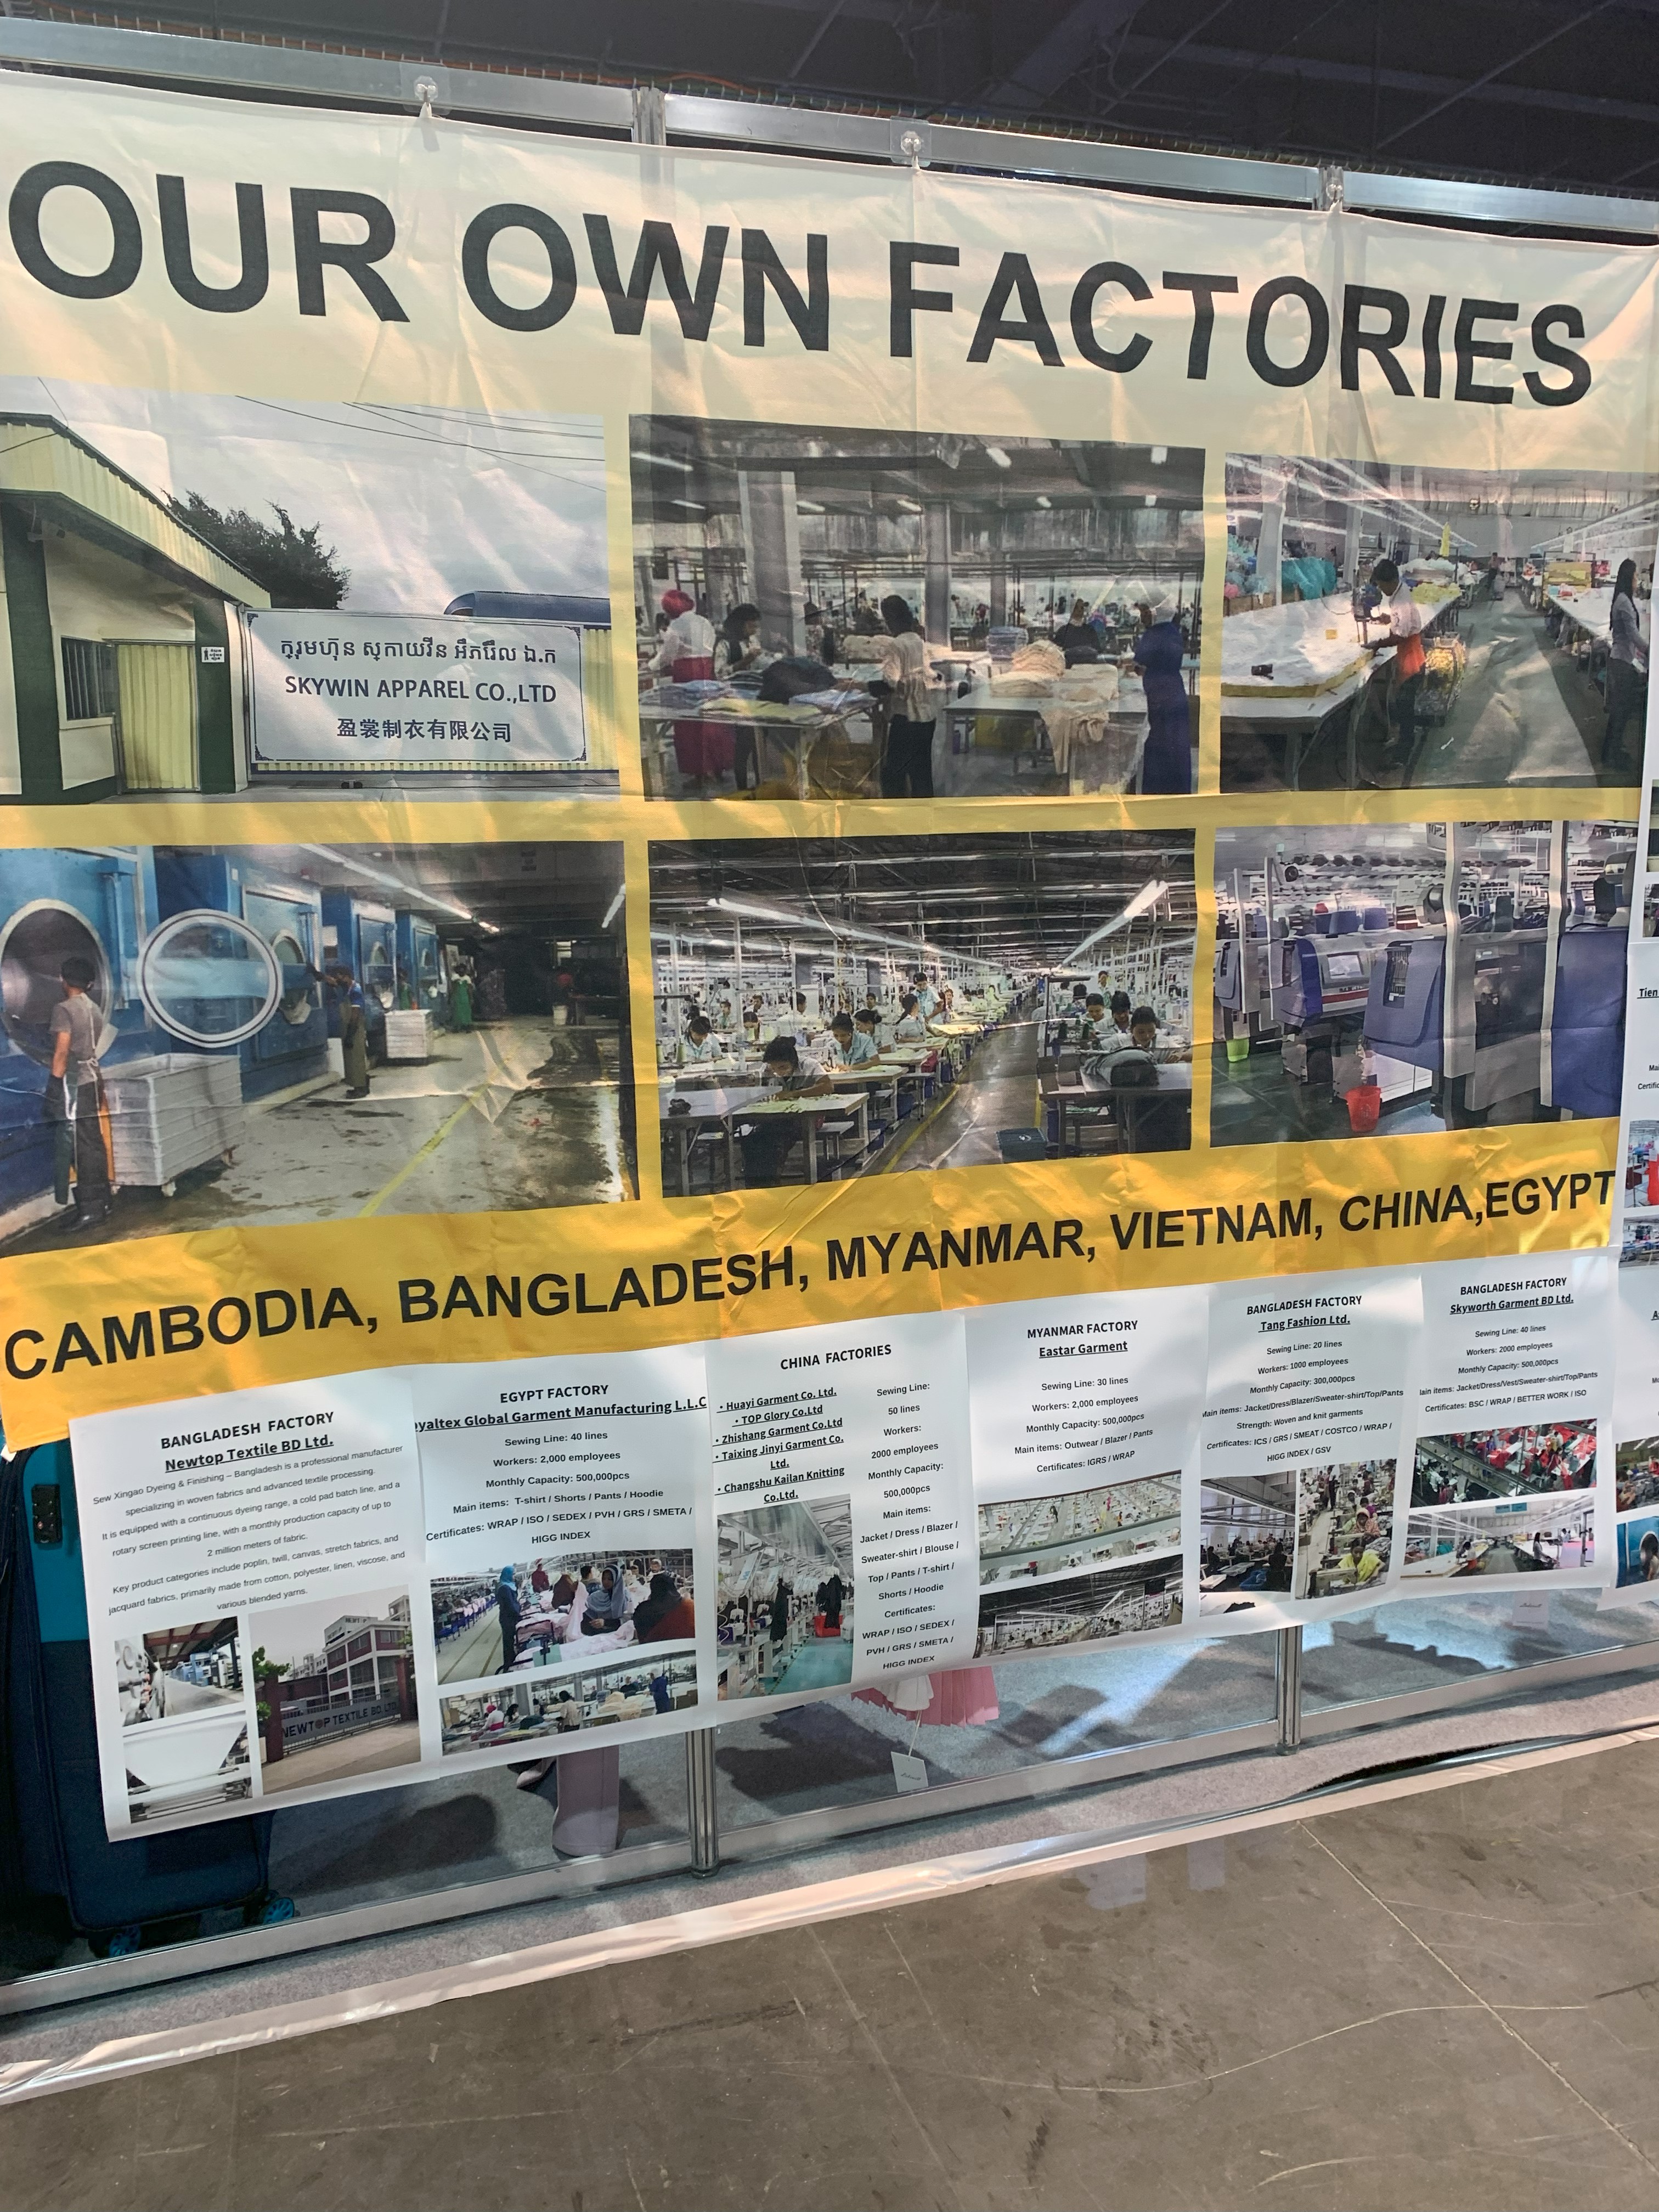
On the other hand, it is not uncommon to see that vendors from Bangladesh, Vietnam, Cambodia, or even Egypt and Ghana were actually owned by Chinese investors. Several Chinese factories purposefully highlight that they own factories across the world, from China and Southeast Asia to Africa. According to the USFIA benchmarking study, some U.S. fashion companies also prefer vendors with production capabilities in multiple countries to reduce sourcing risks.
As U.S. fashion companies continue to diversify their sourcing beyond the traditional top three—China, Vietnam, and Bangladesh—emerging destinations are increasingly optimistic about their U.S. export prospects. For instance, a supplier from Jordan noted that recent U.S. tariff hikes have boosted Jordan’s competitiveness, given the zero most-favored-nation (MFN) tariff under the U.S.-Jordan Free Trade Agreement and a 15% reciprocal tariff rate, which was lower than many Asian suppliers face.Jordanian suppliers speak highly of the capacity-building support from international organizations such as the International Trade Centre (ITC), particularly in areas like skills training and market intelligence.
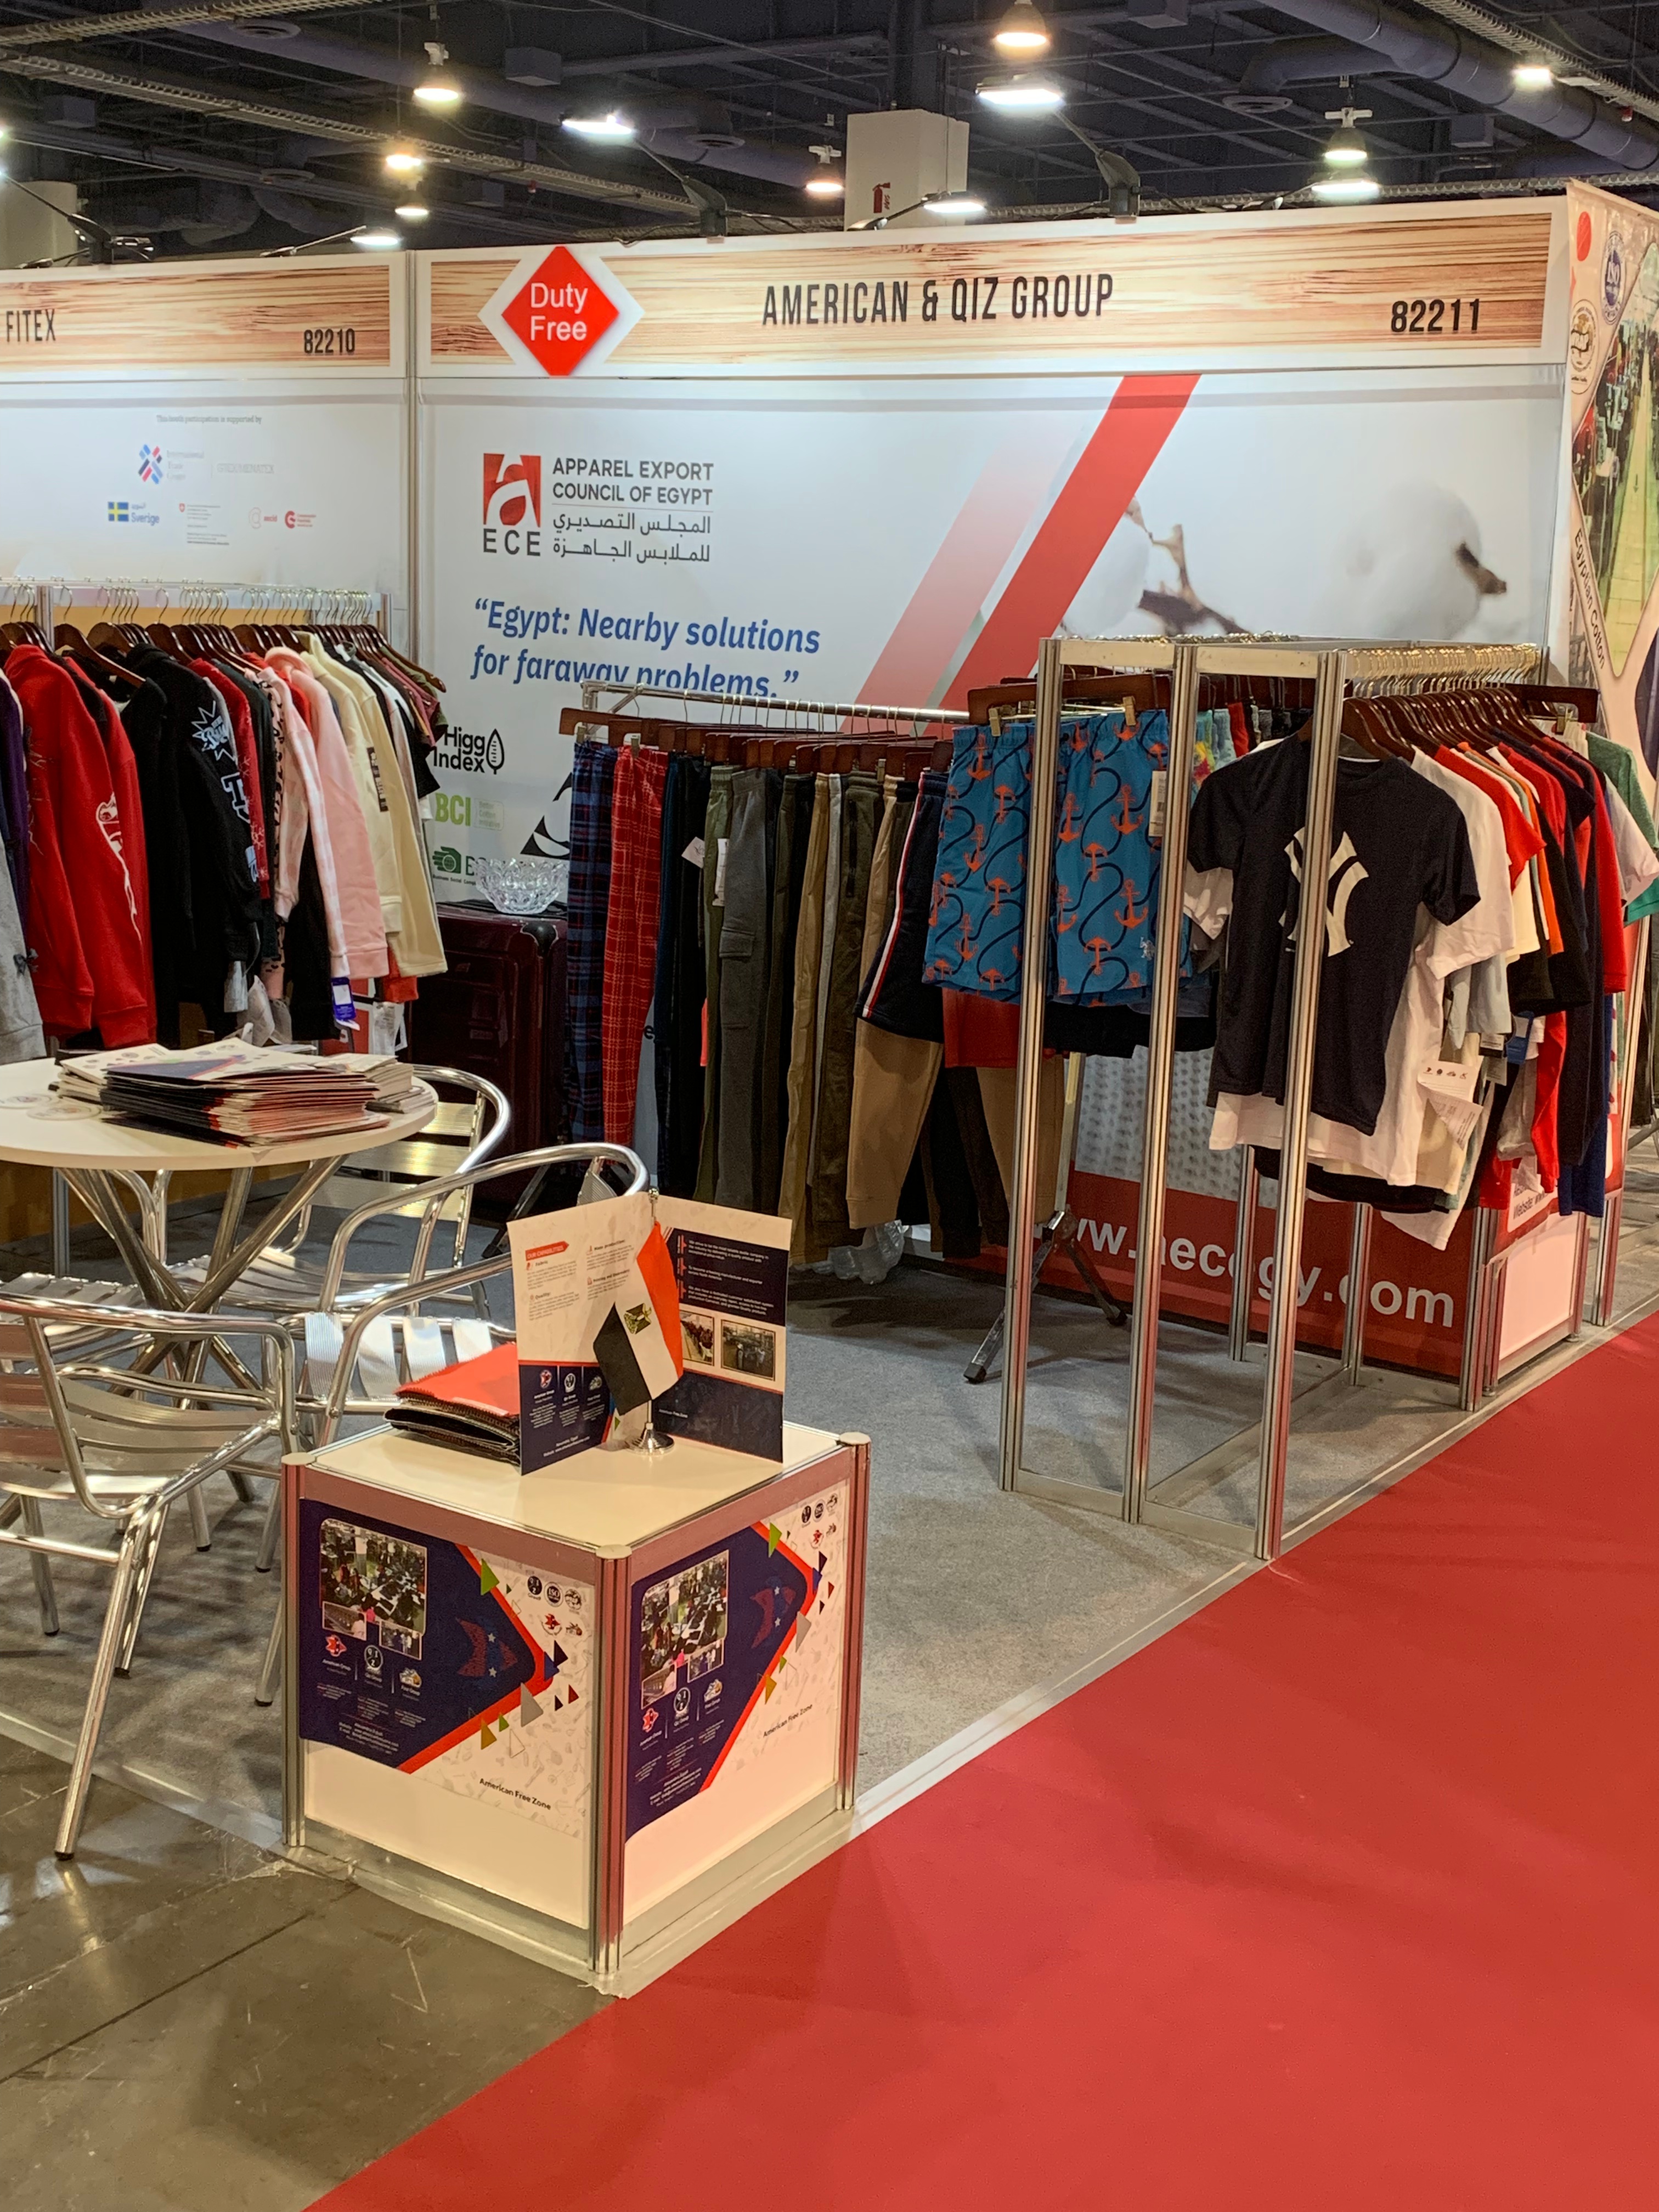
Similar to Jordan, Egypt’s apparel exports can benefit from a zero most-favored-nation (MFN) tariff, provided they meet the rules of origin under the Qualifying Industrial Zones (QIZ) initiative. However, unlike Jordan, suppliers from Egypt tend to specialize in cotton and other natural-fiber–intensive apparel, leveraging their advantages in producing locally made, high-quality natural textile fibers.
Clothing made from preferred sustainable fibers, particularly those incorporating recycled textiles, has grown increasingly popular. Nearly every country represented at MAGIC, including developing nations in Asia and Africa, showcased such products.
It should be noted, however, that producing clothing with sustainable textile fibers requires suppliers to obtain certifications such as GOTS (Global Organic Textile Standard), Global Recycled Standard (GRS), and Better Cotton Initiative (BCI). Although these certifications add costs, most vendors view sustainability as an opportunity to enhance export competitiveness rather than a threat in the long term. Some also mentioned that buyers were often willing to pay a premium for products made with sustainable materials, providing a significant financial incentive.
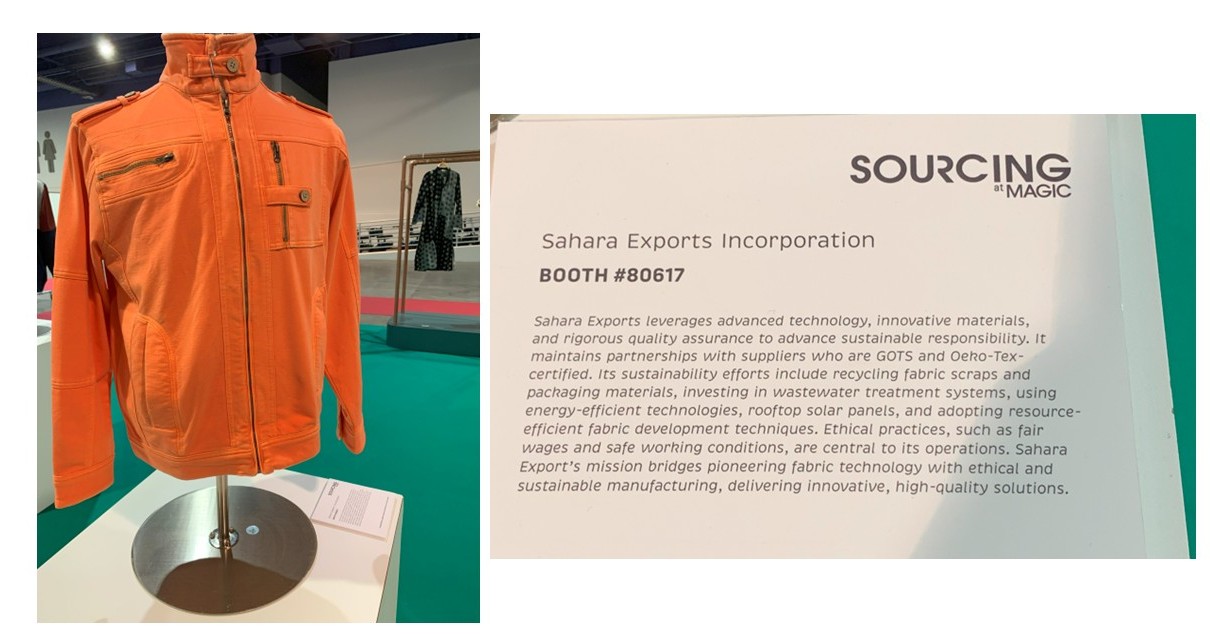
On the other hand, achieving sustainable sourcing and production is becoming increasingly comprehensive, requiring continuous innovation in both technology and business models. For example, at the show, some vendors showcased apparel products that integrated multiple sustainability concepts, ranging from material development and eco-design to social responsibility and post-consumption solutions.
#1 This year, the top business challenges facing U.S. fashion companies center on the Trump Administration’s escalating tariff policy and its wide-ranging impacts on companies’ sourcing and business operations.
100 percent of respondents rated “Protectionist U.S. trade policies and related policy uncertainty, including the impact of the Trump tariffs” as one of their top business challenges in 2025. This included as much as 95 percent of respondents who ranked the issue among their top two concerns.
Respondents also expressed significant concerns about the wide-ranging effects of Trump’s tariff policy, including “Inflation and economic outlook in the U.S. economy” (80 percent), “Increasing production or sourcing cost” (nearly 50 percent), and “Protectionist trade policies and policy uncertainty in foreign countries, including retaliatory measures against the U.S.” (52 percent).
#2 Maintaining a geographically diverse sourcing base has been one of the most popular strategies adopted by U.S. fashion companies to mitigate the impact of rising tariffs and policy uncertainty.
This year, respondents reported sourcing apparel products from 46 countries, similar to the 48 countries reported in 2024 and an increase from 44 countries in 2023. At the firm level, approximately 60 percent of large companies with 1,000+ employees reported sourcing from ten or more countries in 2025, a notable increase from the 45–55 percent range reported in 2022 and 2023 surveys.
Amid escalating tariffs and rising policy uncertainty, Asia has become an ever more dominant apparel sourcing base for U.S. fashion companies in 2025.Respondents reported increased use of several Asia-based sourcing destinations other than China in 2025 compared to the previous year, including Vietnam (up from 90 percent to 100 percent), Cambodia (up from 75 percent to 94 percent), Bangladesh (up from 86 percent to 88 percent), Indonesia (up from 75 percent to 77 percent), and Sri Lanka (up from 39 percent to 53 percent).As part of their sourcing diversification strategy, U.S. fashion companies are also gradually increasing sourcing from emerging destinations in the Western Hemisphere and beyond, such as Jordan, Peru, and Colombia.
Most respondents intend to build a more geographically diverse sourcing base and broaden their vendor network over the next two years. Nearly 60 percent of respondents plan to source apparel from more countries, and another 40 percent plan to source from more suppliers or vendors. Reducing sourcing risk, especially to minimize the impact of rising tariffs and tariff uncertainty, is a key driver of companies’ sourcing diversification strategies
#3 U.S. fashion companies remain deeply concerned about the future of the U.S.-China relationship during Trump’s second term and intend to further “reduce China exposure” to mitigate sourcing risks.
While 100 percent of respondents reported sourcing from China this year, a record-high 60 percent of respondents reported sourcing fewer than 10% of their apparel products from China, up from 40 percent in 2024. Approximately 70 percent of respondents no longer used China as their top apparel supplier in 2025, representing a further increase from 60 percent in 2024 and significantly higher than the 25-30 percent range prior to the pandemic.
Despite the announcement of the reaching of a U.S.-China “trade deal” in May 2025, more than 80 percent of respondents plan to further reduce their apparel sourcing from China over the next two years through 2027, hitting a new record high. Many large-scale U.S. fashion companies are already limiting or plan to limit their apparel sourcing from China to a “low single-digit” percentage by 2026 or earlier, mainly due to concerns about the increasing geopolitical and trade policy risks associated with sourcing from the country.
Still, respondents rated China ashighly economically competitive as an apparel sourcing basecompared to many of its Asian competitors regarding vertical manufacturing capability, low minimum order quantity (MOQ) requirements, flexibility and agility, sourcing costs, and speed to market. However, non-economic factors, particularly the perceived extremely high risks of facing U.S. import restrictions, geopolitical tensions with the U.S., and concerns about forced labor, are driving U.S. fashion companies to continue their de-risking efforts.
#4 No evidence indicates that the Trump Administration’s tariff policy has successfully encouraged U.S. fashion companies to increase domestic sourcing of “Made in the USA” textile and apparel products or to expand sourcing from the Western Hemisphere.
Only about 44 percent of respondents explicitly say that they would expand sourcing from the Western Hemisphere, and even fewer respondents (17 percent) plan to source more textiles and apparel “Made in the USA” amid the tariff increase.
This year, fewer respondents reported sourcing apparel from Mexico and Canada (down from 60 percent in 2024 to 50 percent in 2025) and members of the Dominican Republic-Central America Free Trade Agreement, CAFTA-DR (down from 75 percent in 2024 to 64 percent in 2025).
About half of the respondents plan to expand apparel sourcing from Mexico and CAFTA-DR members over the next two years. Notably, nearly all of these companies also intend to increase sourcing from Asia, indicating that U.S. fashion companies view near-shoring from the Western Hemisphere as a complement, not a replacement, to their broader sourcing diversification strategy.
#5 Respondents overall remain highly committed to sustainability, social responsibility, and compliance issues in the sourcing process.
This year, the top sustainability and compliance areas where respondents plan to allocate more resources include “Investing in technology to enhance supply chain traceability or isotopic testing” (53 percent), “Providing sustainability and social compliance training for internal employees” (50 percent) and “Providing sustainability and social compliance training for suppliers” (50 percent).
Moreover, most respondents (over 70 percent) plan to increase their use of various “sustainable fibers” in clothing over the next three years. This trend is especially strong for recycled materials, with 80 percent of respondents indicating they intend to increase their use.
The top three positions with the highest demand among respondents from 2025 through 2030 are “Environmental sustainability-related specialists or managers,” “Trade compliance specialists,” and “Data scientists”—more than 40 percent of respondents plan to increase hiring. There is also strong demand for “Textile raw material specialists” and “Sourcing specialists.”
#6 With the upcoming expiration of the trade preference program this September, respondents again underscore the importance of immediate renewal of the African Growth and Opportunity Act (AGOA) and extending the agreement for at least another ten years.
Due to the upcoming expiration of AGOA and uncertainty about its future, this year, respondents sourced from only six SSA and AGOA members (i.e., Kenya, Ethiopia, Ghana, Madagascar, Mauritius, and Tanzania), fewer than the seven countries in 2024. And none of these countries were used by more than 20 percent of respondents.
Nearly 80 percent of respondents support “renewing AGOA for at least another ten years,” and no one opposes. This shows a consistent and wide base of support for AGOA among U.S. fashion companies.
More than 70 percent of respondents say that securing a long-term renewal of AGOA for at least ten years is essential for expanding apparel sourcing from the region. Similarly, another 60 percent of respondents believe that a long-term renewal of AGOA is necessary for U.S. fashion companies and their supply chain partners to commit to new investments in the region.
Authored by Dr. Sheng Lu in collaboration with the United States Fashion Industry Association (USFIA), this year’s benchmarking study was based on a survey of executives from 25 leading U.S. fashion companies from April to June 2025. The study incorporated a balanced mix of respondents representing various businesses in the U.S. fashion industry. Approximately 85 percent of respondents were self-identified retailers, 60 percent were self-identified brands, and about 50 percent were importers/wholesalers.
The survey respondents included large U.S. fashion corporations and medium-sized companies. Around 90 percent of respondents reported having over 1,000 employees; the rest (10 percent) represented medium-sized companies with 100-999 employees.
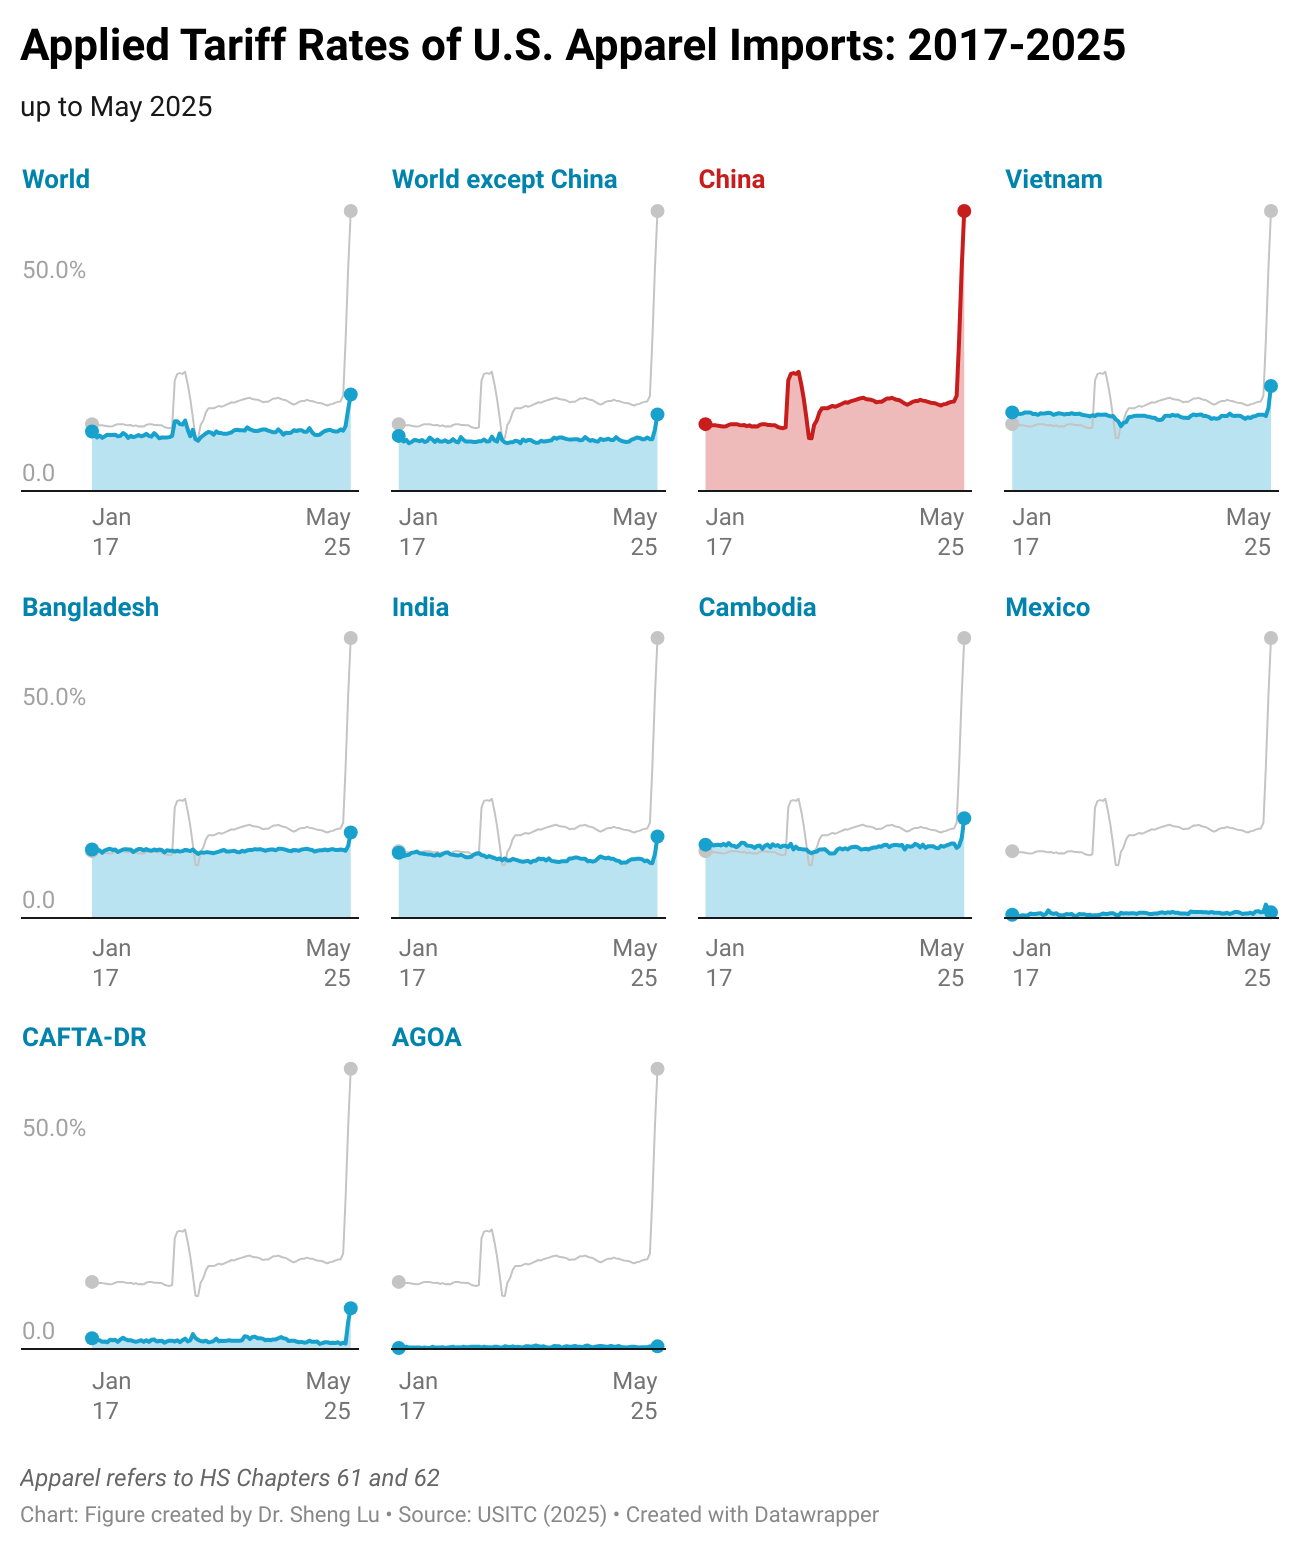
The latest data from the U.S. International Trade Commission (USITC) indicates that Trump’s “Reciprocal Tariff” has led to higher import duties on U.S. apparel imports, although the impact on sourcing appears to be more nuanced than expected. Specifically:
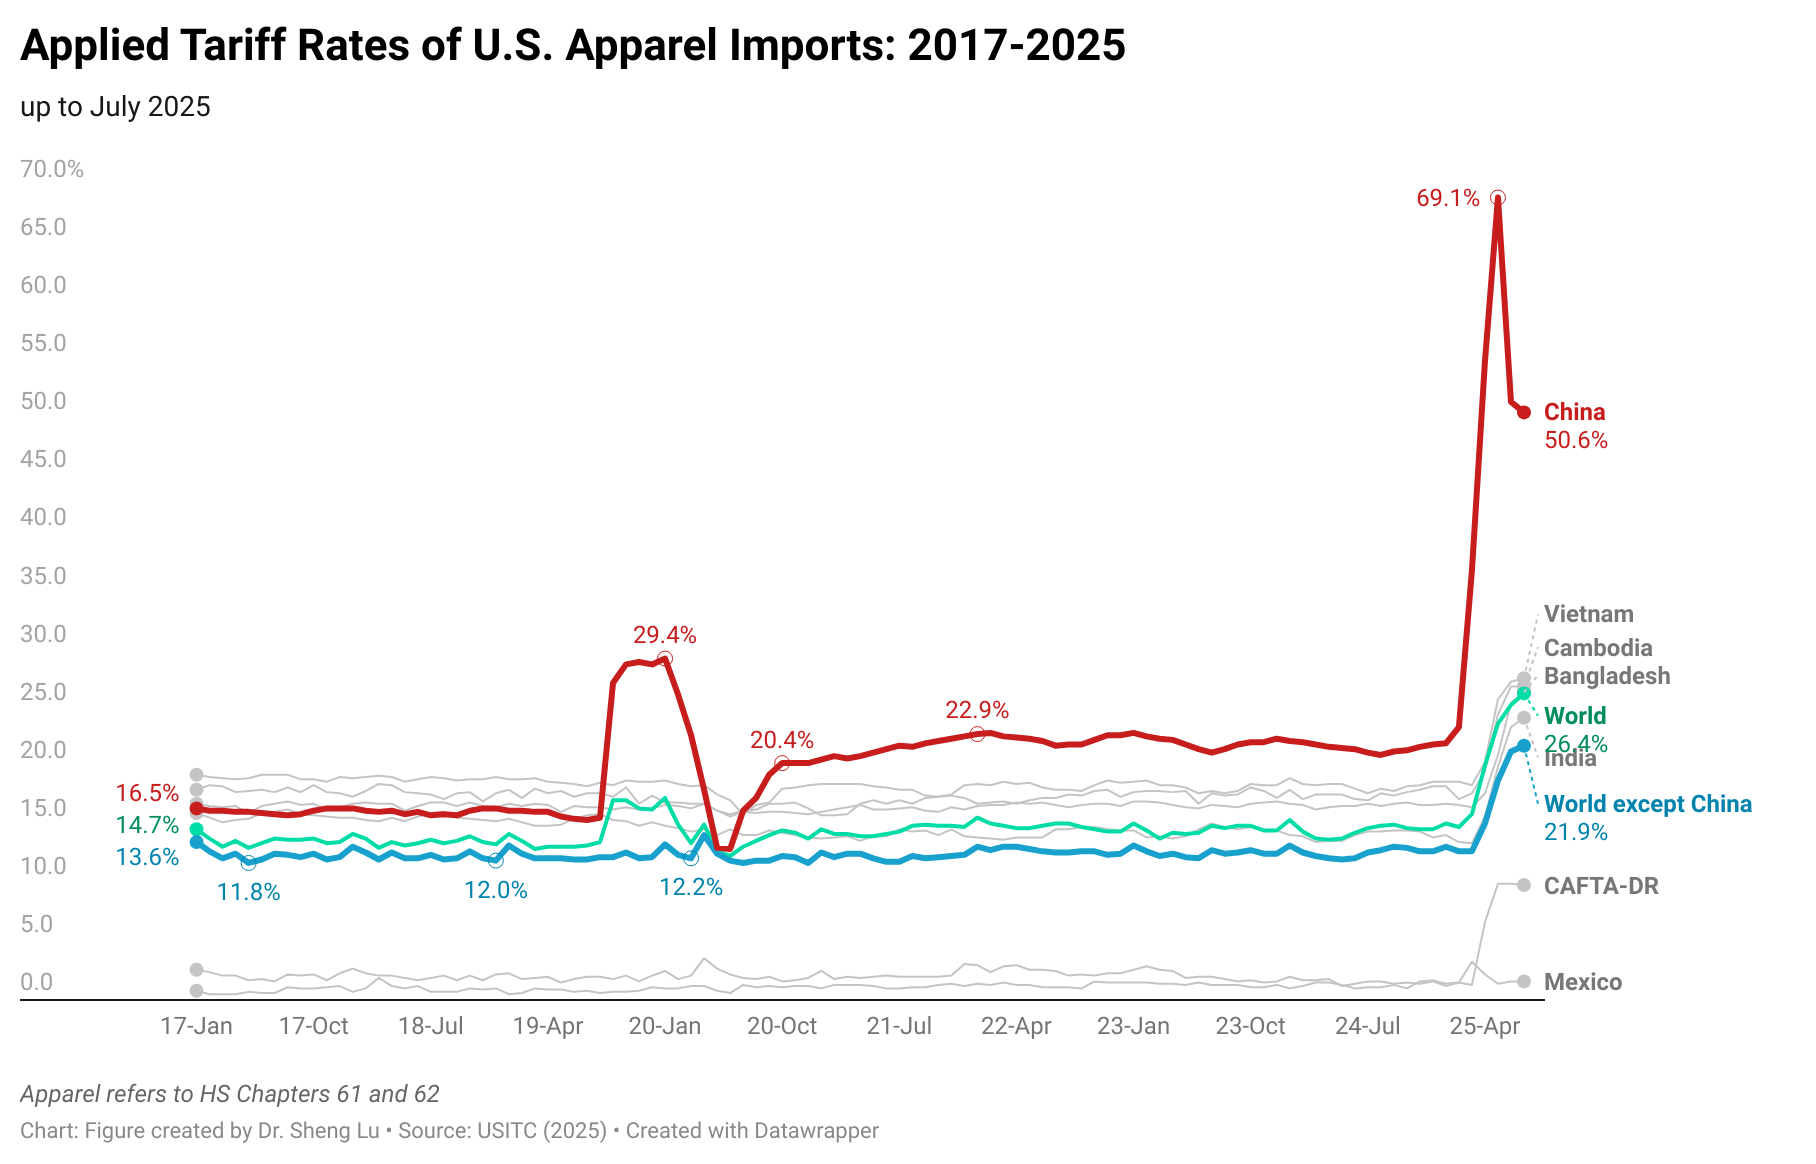
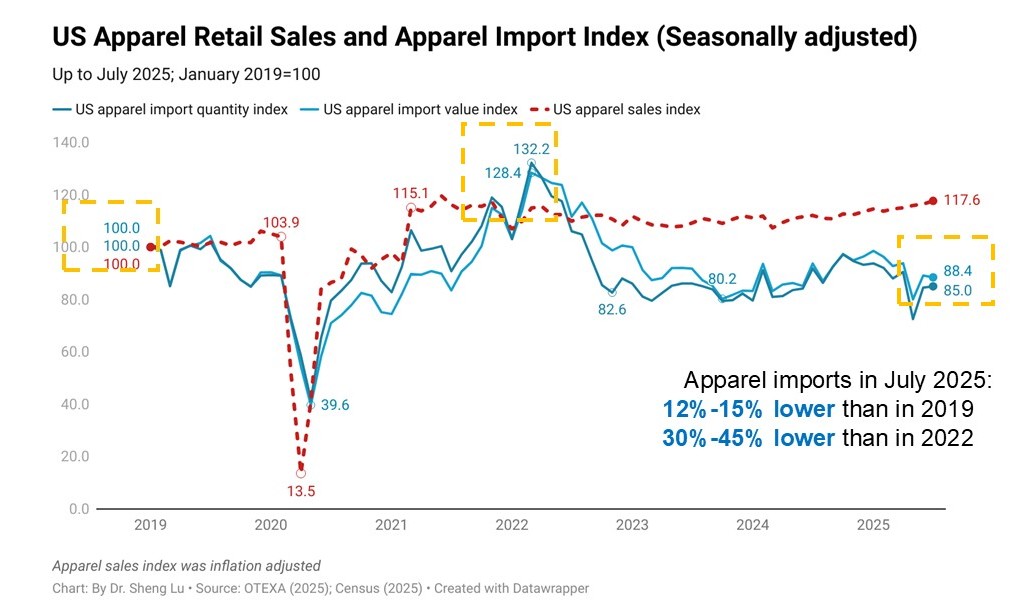
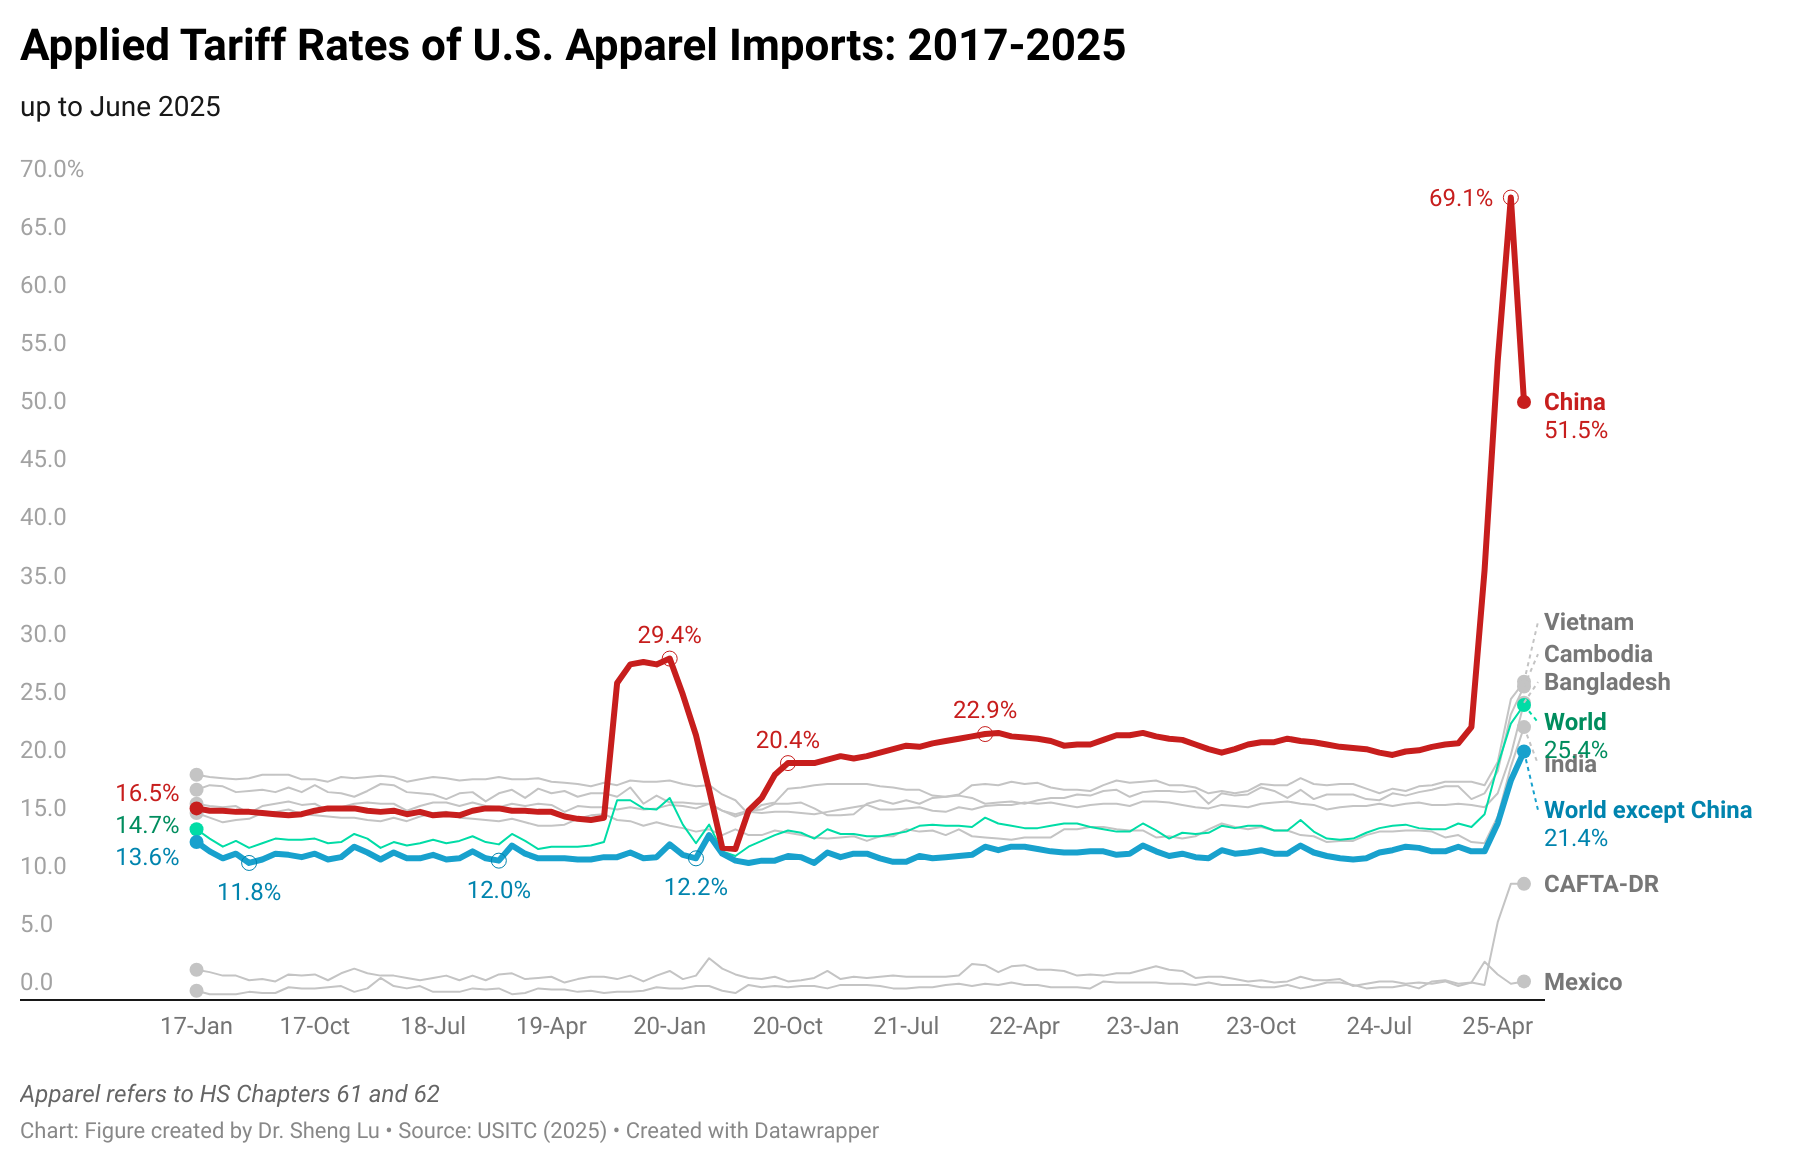
As a result of the reciprocal tariff, the average tariff rate for U.S. apparel imports (HS Chapters 61 and 62) reached 23.8% in May 2025, increased further from 20.8% in April 2025 and much higher than 13.9% in May 2024 and 14.7% in January 2025, prior to Trump’s second term. This tariff rate also hit its highest level in decades. Similarly, while the value of U.S. apparel imports in May 2025 decreased by 7% from May 2024, the import duties skyrocketed by nearly 60% over the same period. [View detailed data HERE]
Due to numerous punitive tariffs beginning in February 2025, the average tariff rate for U.S. apparel imports from China reached an unprecedented 69.1% in May 2025, a further increase from 55.0% in April 2025, 37.0% in March 2025 and 22.1% in January 2025. In theory, U.S. apparel imports from China in May should be subject to a tariff rate of over 145%, as mandated by a series of executive orders. However, as “goods loaded onto a vessel at the port of loading and in transit on the final mode of transit before 12:01 a.m. eastern daylight time on April 5, 2025,“ were excluded from Trump’s reciprocal tariffs, it explains why the actual tariff rate in April and May 2025 appeared lower than the theoretical one.
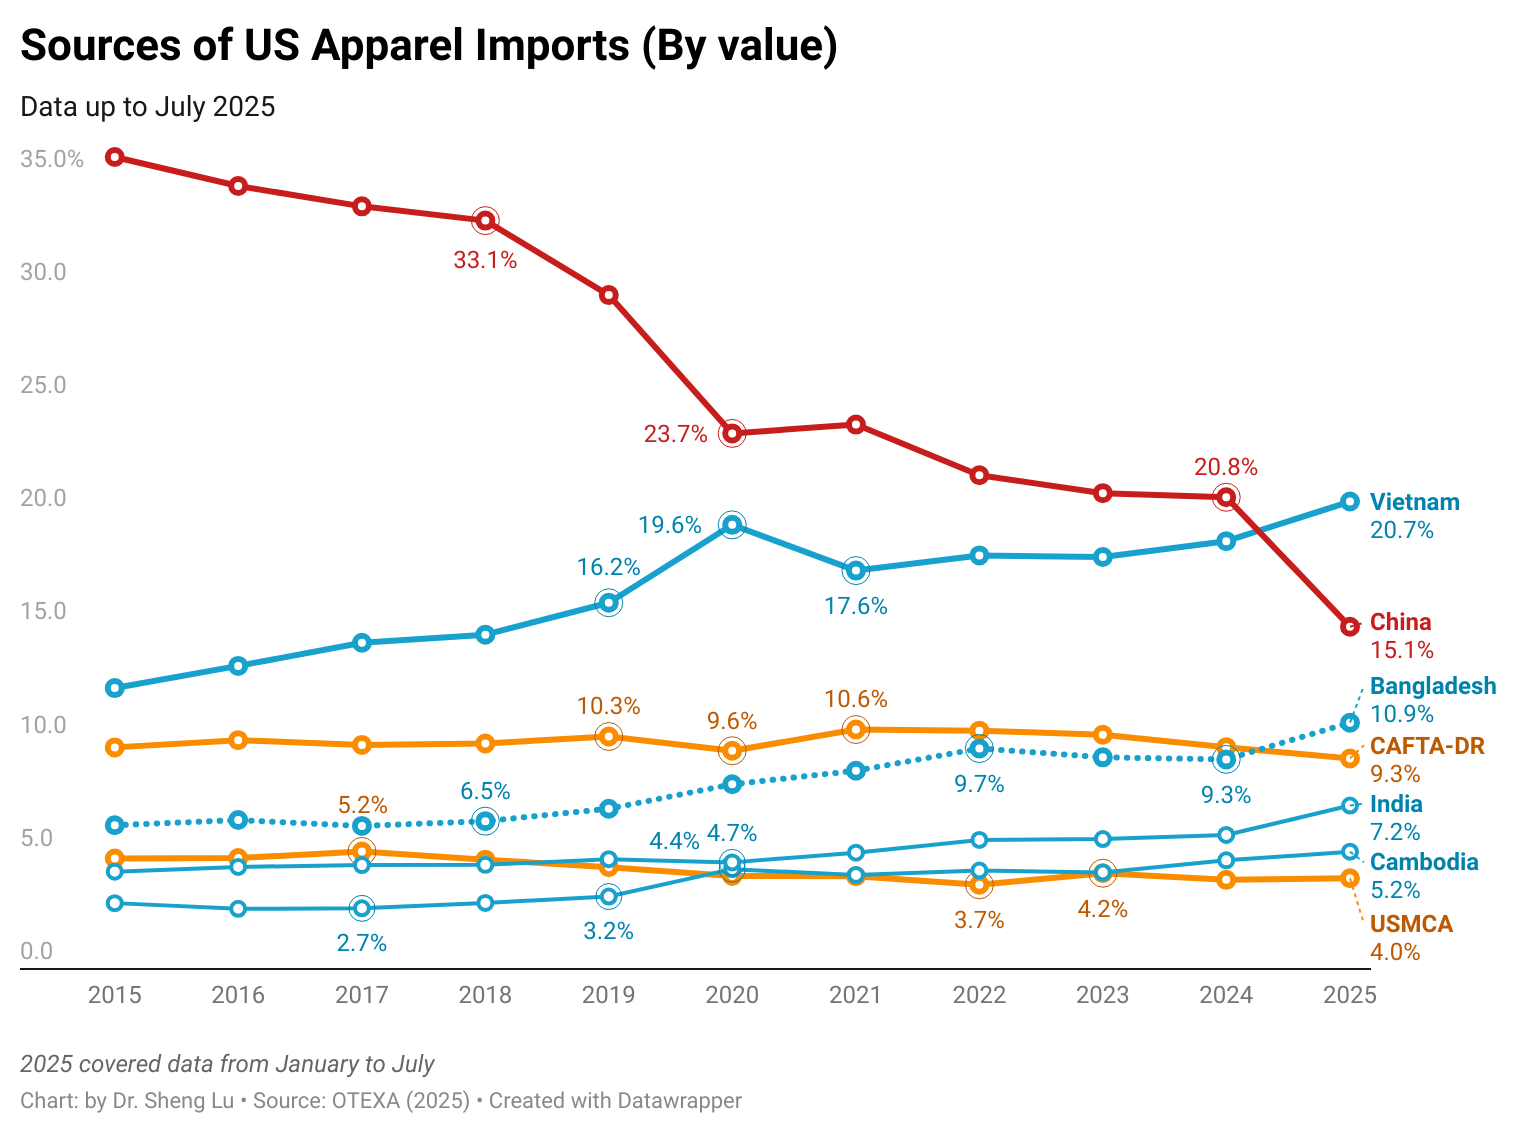
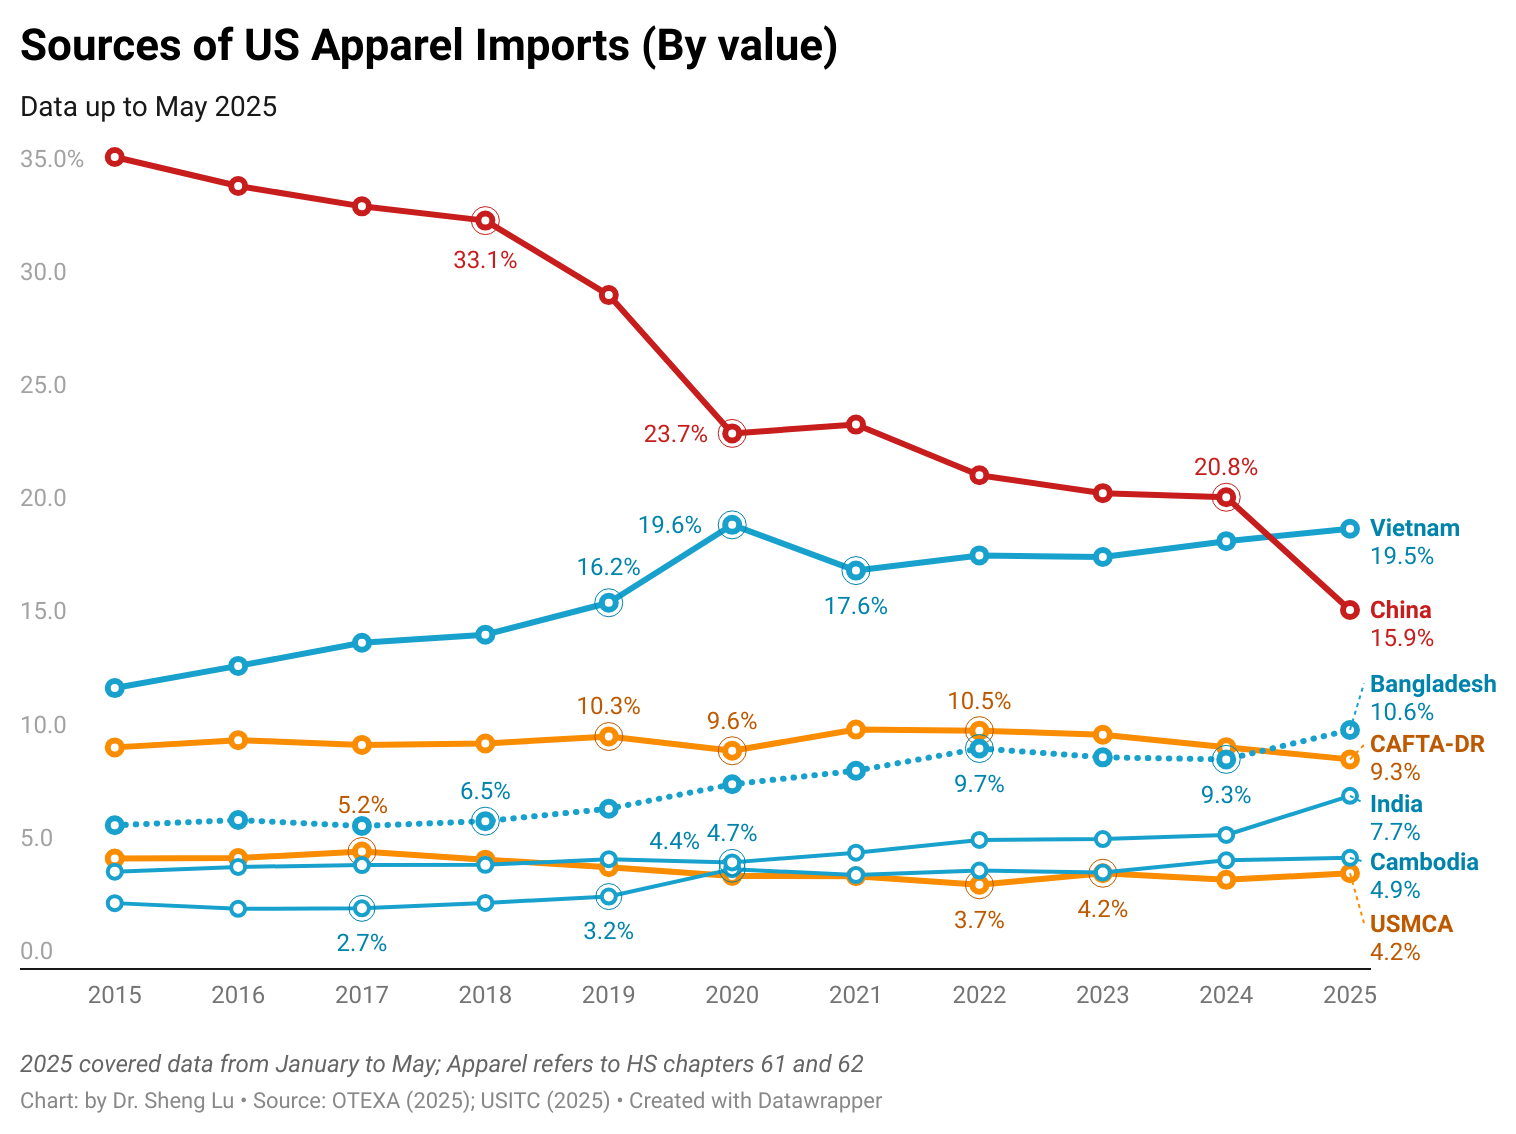
Nonetheless, affected by the high tariffs, the value of US apparel imports from China in May 2025 was cut by more than half from a year ago (down 52%). China’s market share in US apparel imports in May 2025 also dropped to 9.9%, a new low in decades (note: was 19.9% in May 2024). [View detailed data HERE]
Additionally, the average tariff rate for U.S. apparel imports from countries other than China reached 18.9% in May 2025, up from 15.2% in April 2025. Although this rate was higher than approximately 12-13% before Trump’s second term in early 2025, the increase was still much more modest than the theoretical 10% universal reciprocal tariff rate announced by the Trump administration. The average tariff rates for U.S. apparel imports from leading Asian suppliers such as Vietnam, Bangladesh, and Cambodia followed similar patterns (i.e., higher tariff rates but well below a 10% increase). Similar to China’s case, it appears that U.S. apparel imports from other countries in April 2025 included a significant proportion of products that were exempt from reciprocal tariffs because they were “loaded onto a vessel” early enough. [View detailed data HERE]
It is interesting to note that the reciprocal tariff resulted in the most significant increase in tariff rates on U.S. apparel imports from CAFTA-DR members. While imports from these countries were supposed to be duty-free under the trade agreement, the average tariff rate reached 10% in May 2025, up from 6.7% in April 2025. In other words, the short shipping distance unintentionally “disadvantaged” near-shoring imports from being exempted from the reciprocal tariffs, as they could be mostly loaded after the deadline.
Overall, it remains uncertain how the U.S. apparel tariff rates will continue to evolve in response to Trump’s shifting tariff policy. It appears that the trade volume and timing of shipment will be highly sensitive to short-term tariff rate changes, whereas adjusting sourcing bases and product structures will be a consideration for U.S. fashion companies in the medium to long term.
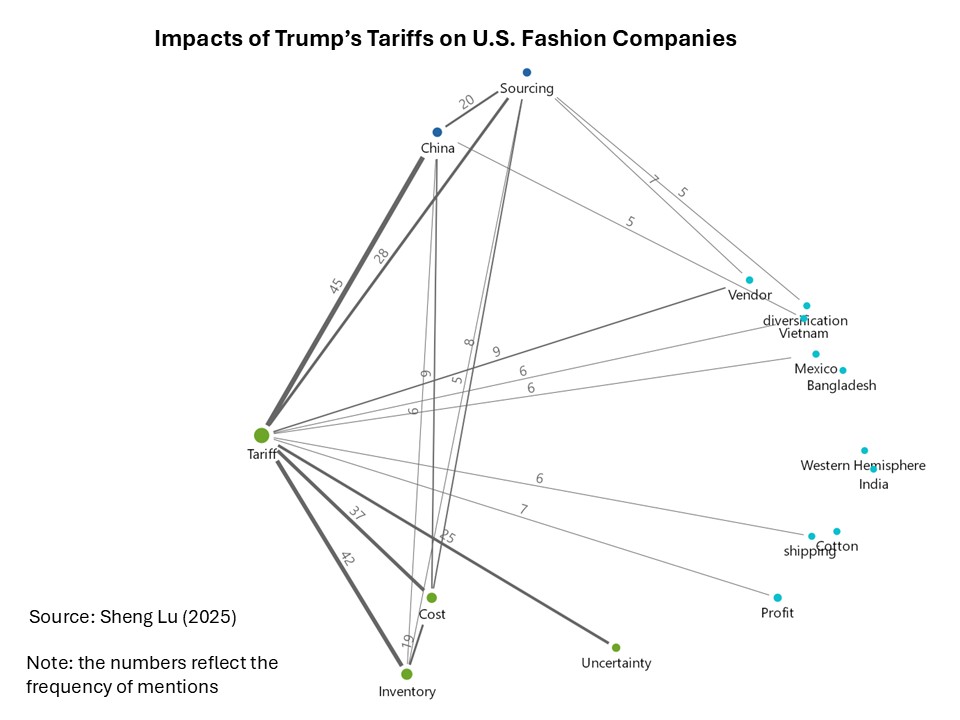
(Note: The figure above shows how frequently the term “tariff” was mentioned alongside other key issues in the earnings calls. A higher frequency indicates a more significant impact and a closer connection between tariffs and a specific theme.)
This study aims to examine the impacts of the Trump administration’s escalating tariffs on U.S. fashion companies’ apparel sourcing practices. Based on data availability, transcripts of the latest earnings calls from approximately 25 leading publicly traded U.S. fashion companies were collected. These earnings calls, held between mid-May and June 2025, covered company performance in the first quarter of 2025. A thematic analysis of the transcripts was conducted using MAXQDA.
Overall, the results indicate that the Trump administration’s escalating tariffs and policy uncertainties have financially hurt U.S. fashion companies and disrupted their apparel sourcing practices. To mitigate these impacts, most companies plan to further reduce their “China exposure,” maintain a geographically diversified sourcing base, and prioritize flexibility in sourcing and shipping. However, there is no clear evidence that the current policy environment has successfully incentivized U.S. companies to expand apparel sourcing from the Western Hemisphere, let alone commit to new long-term investments. Meanwhile, U.S. fashion companies have adopted a strategic pricing approach by not passing the entire cost increase to consumers through widespread retail price hikes.
A few key findings:
First, far from surprising, many leading U.S. fashion companies expressed concerns that the Trump administration’s escalating tariffs have resulted in higher sourcing costs and cut companies’ profit margins. For example:
Company G (specialty store): if current tariffs of 30% on most imports from China and 10% on most imports from other countries remain for the balance of the year, we estimate a gross incremental cost of approximately $250 million to $300 million.
Company O (a parent company of several leading apparel brands): We expect that gross margin will contract approximately 200 basis points for the year. This contraction includes $40 million in additional tariff costs.
Company V1 (underwear brand): gross tariff impact of approximately $120 million, which assumes 30% China tariffs and 10% non-China, with tariff mitigation of approximately $70 million for a net impact to fiscal year 2025 of approximately $50 million.
Second, with the hiking tariff rate on U.S. apparel imports from China and increasing strategic competition between the two countries, many leading U.S. fashion companies plan to reduce their apparel sourcing from China to a single-digit, if not move out of the country entirely. For example:
Company A1 (apparel brand): We’re on track to reduce our sourcing exposure to China to under 10% this year with fall and holiday season down to low single digits.
Company A2 (specialty store): For China specifically, we have worked for some time now to relocate the supply resources, and this year’s sourcing volume from China will be in the low single digits.
Company L (apparel brand): Less than 8% of our purchase order dollars last fiscal year were utilized on buys of China.
Company O (a parent company of several leading apparel brands): By the second half of 2026, we currently plan to be substantially out of China.
Company V2 (a parent company of several leading apparel brands): over the past several years we’ve strategically diversified our supply chain and proactively reduced our US finished goods sourced from China to less than 2%.
Company K2 (a parent company of several leading apparel brands): China for us is de minimis.
Third, maintaining a geographically diverse sourcing base remains a popular strategy for U.S. fashion companies to mitigate the impacts of increasing tariffs and ongoing policy uncertainties. Companies particularly intend to avoid “putting too many eggs in one basket” and limiting the reliance on any single supplying country. For example:
Company K1 (retailer): our talented and experienced global sourcing team has done an incredible job diversifying our countries of production to ensure that we are not overly reliant on any one country. Although tariffs remain a fluid and uncertain situation, the teams continue to work to reduce our exposure to high tariff countries by leveraging our diverse factory network to move production, adjusting orders based on pricing elasticity analysis.
Company G (specialty store): Most other countries represent less than 10%, Vietnam and Indonesia represented 27%, and 19% of our sourcing last year, respectively, and our goal is for no country to account for more than 25% by the end of 2026.
Company R (apparel brand): While tariffs will primarily impact our gross margins… we have a proven toolkit to manage cost inflation headwinds. This includes first, significant supply chain diversification…No single country accounts for more than 20% of our production volumes, with most countries representing a single-digit percentage.
Company U (retailer): The remaining third is strategically diversified across a number of other countries, each representing a low to mid-single-digit percentage. This deliberate diversification creates a well-balanced portfolio, reducing reliance on any single market and enhancing our ability to navigate geopolitical, costs and supply chain complexities from a position of strength.
Notably, while a limited few companies specifically mentioned the possibility of expanding sourcing from the Western Hemisphere amid the current business environment, most did not. For example:
Company L (apparel brand): We intentionally drove significant change in our supply chain as we accelerated production in the Western Hemisphere, giving us both speed and additional avenues to mitigate tariffs and provide resiliency.
Company G (specialty store): Diversification also means near-shoring as well as domestic investment.
Fourth, U.S. fashion companies have leveraged shipping timing, piled up inventory, and delayed or cancelled existing orders to mitigate the tariff impacts as much as possible. For example:
Company C (sportswear): For products that are impacted by the reciprocal tariffs, we are accelerating shipments to the extent possible in order to receive products during the 90-day tariff.
Company K1 (retailer): Inventory was up 1.7% compared to last year, driven by inventory strategies implemented to navigate the tariff pressure, including the pull forward of receipts and pack in holding seasonal inventory to be sold in the back half of the year.
Company B (off-price retailer): Our reserve inventory was 48% of our total inventory versus 40% of our inventory last year. In dollar terms, our reserve inventory was up 31% compared to last year, reflecting the great deals we were able to make to get ahead of tariffs.
Company M (retailer): With the recent announcement of these tariffs, we’ve renegotiated orders with suppliers, and we’ve canceled or delayed orders where the value proposition is just not where it needs to be.
It should be noted, however, that adjusting shipping and inventory could incur additional costs. For example:
Company V1 (underwear brand): More than half of the gross margin rate pressure in the quarter was due to a combination of elevated and expected airfreight rates, some tariff-related order adjustments…
Fifth, despite higher sourcing costs and increasing financial pressures, many U.S. fashion companies have avoided widespread price hikes but have implemented selective increases in less price-sensitive apparel categories. For example:
Company V1 (underwear brand): [price increase driven by higher tariffs] And so we are going to sort of play in the middle where we see value. So and it won’t be across all categories. As we think about our business, it’s really that strategic case by case, category by category look that we’re taking.
Company U (retailer): gently and sparingly raising some prices. Please note that any price increases will be very strategic, protecting opening price points and only targeting areas where we believe we could raise prices without affecting the overall customer experience.
Company A2 (specialty store): we are not planning broad-based ticket increases. As we’ve done season after season, our goal is to deliver high-quality product and align inventory and promotions with our customers’ value perception.
Company P (a parent company of several leading apparel brands): We will evaluate strategic discounts to mitigate the potential tariff impact. While we are focused on delivering price value for the consumer, we are also ready to take calibrated targeted pricing actions where we have pricing power.
Textile and apparel trade matters. Even today in the 21st century, apparel could still account for 80—90% of a developing country’s total merchandise export and play a critical role in promoting economic growth, poverty reduction, and gender equality. The interview explored several key topics:
Why textile & apparel trade matters for development in the 21st century
How ITC provides capacity building support and enhances the export competitiveness of garment exporters in developing countries
Sustainability movement’s impact on apparel sourcing and export competitiveness of developing countries
The promise and complexity of circularity in tackling used clothing challenges
Empowering women entrepreneurs through SheTrades
Skills and education needed to thrive in the global fashion apparel trade
About Matthias Knappe (speaker)
Matthias Knappe is the Head of Fibres, Textiles and Clothing Unit at the International Trade Centre (ITC), which is co-run by the World Trade Organization (WTO) and the United Nations (UN). Matthias has over 30 years of diversified professional experience in international trade and development. He has worked at the enterprise, institutional, and governmental levels. Matthias is leading ITC’s textile and apparel and light manufacturing unit. Over the last 20 years, he has been working with the T&C sector around the world to increase its export competitiveness. He designed and currently manages ITC’s Global Textiles and Clothing (GTEX) programme and various other fibre, apparel and light manufacturing projects. The Unit’s present portfolio includes projects in 15 countries.
AboutEmilie Delaye (moderator)
Emilie Delaye is a master’s student in Fashion and Apparel Studies at the University of Delaware, with a specific interest in supply chain, global sourcing, and sustainability. With a background in Entrepreneurship and Fashion Management, Emilie’s passion lies in improving the fashion industry through innovative problem-solving and collaboration. She has worked on projects exploring sourcing destinations and emerging sourcing trends, as well as collaborated with Macy’s on an initiative centered around Extended Producer Responsibility (EPR) regulations. Emilie’s work is driven by a commitment to fostering innovation and ethical practices in fashion, positioning her as a future leader in driving the industry toward greater sustainability and responsibility.
The U.S. Department of Agriculture (USDA) recently released its latest annual China cotton report. Below are the key findings most relevant to U.S. apparel sourcing from the country.
First, China’s retaliatory tariffs could severely impact US cotton exports. Faced with geopolitical tensions and rising competition from other suppliers like Brazil, U.S. cotton exports to China fell sharply by 73% in the first seven months of Marketing Year (MY) 24/25 (i.e., August 2024-February 2025), resulting in a decrease in the U.S. market share to 17.1%, down from 29.6% during the same period in MY 23/24. As noted in the report, “Beijing’s imposition of 140 percent tariffs on U.S. cotton will all but stop further imports from the United States.” Meanwhile, China’s overall demand for raw cotton could fall to a five-year low in MY 24/25, due to insufficient domestic demand and limited growth in textile and apparel exports.
Second, Xinjiang still dominated cotton production in China. Despite the Uyghur Forced Labor Prevention Act (UFLPA), Xinjiang accounted for approximately 92.3% of cotton production in China during MY 24/25 (note: was 90.9% in MY 23/24) and enjoyed an 11.4% year-on-year increase in total production. According to the USDA report, cotton production, yarn spinning, and textile manufacturing in Xinjiang received numerous subsidies from the government, such as support provided to farmers and cotton planting incentives.
The USDA report also noted that, in addition to raw cotton, textile production has experienced substantial growth in Xinjiang. For example, by the end of 2024, Xinjiang’s yarn spinning capacity reached 29.1 million spindles with 62,400 looms in operation, both marking the highest growth rates in history. “The spinning capacity is expected to rise further as the Xinjiang government plans to spin 45 to 50 percent of the Xinjiang cotton by 2028,” according to the USDA.
Third, China’s textile and apparel exports are facing growing headwinds. The USDA report predicted that “With ongoing market turbulences and uncertainties, China’s textile and apparel exports are expected to decrease in the remainder of MY 24/25” due to higher tariffs and the de minimis rule changes. While large-scale textile and apparel companies in China have been relocating some production to Southeast Asia, small-scale companies with limited resources may struggle to adapt. Additionally, according to the USDA, citing industry sources, the profit margin on China’s clothing exports to the US might be 10% or even lower and “the established textile manufacturers will face increased costs and administrative burdens for all import values, potentially disrupting their supply chains and reducing profit margins” due to the recent de minimis rule changes.
Video 1: Is U.S. Clothing Manufacturing at Risk? Tariffs and Competition Threaten Jobs (RT≠ Endorsement)
Video 2: Northern Virginia T-shirt brand faces challenges (RT≠ Endorsement)
Video 3: Tariffs could raise wedding dress prices for American brides (RT≠ Endorsement)
Video 4: Bangladeshi garment industry sweating on Trump tariffs (RT≠ Endorsement)
Video 5: Trump’s Tariff Twist: Can Pakistan’s Textiles Fill China’s Shoes? (RT≠ Endorsement)
Video 6: Tariffs: Europe’s textile sector holds its breath
For FASH455 class: When writing your blog comment, consider addressing the following aspects:
#1 Based on the videos, how do you expect the apparel sourcing strategy of US fashion companies to evolve in response to the tariff increase? For example, will companies continue to diversify sourcing, wait and see, or focus on expanding sourcing to countries or regions regarded as “safe havens”?
#2 Do you expect the higher tariffs on U.S. imports, including textiles and apparel, to benefit domestic “Made in the USA” production? Why or why not?
#3 As consumers, how do you perceive the impact of the tariffs on your shopping behavior and experiences? Have you noticed any changes, such as in price and product availability, while shopping for clothing recently? Feel free to share your observations.
#4 Are there any other notable impacts of the tariff increase on the global fashion apparel industry that we should be aware of? What additional questions do you have in mind about the tariff impacts?
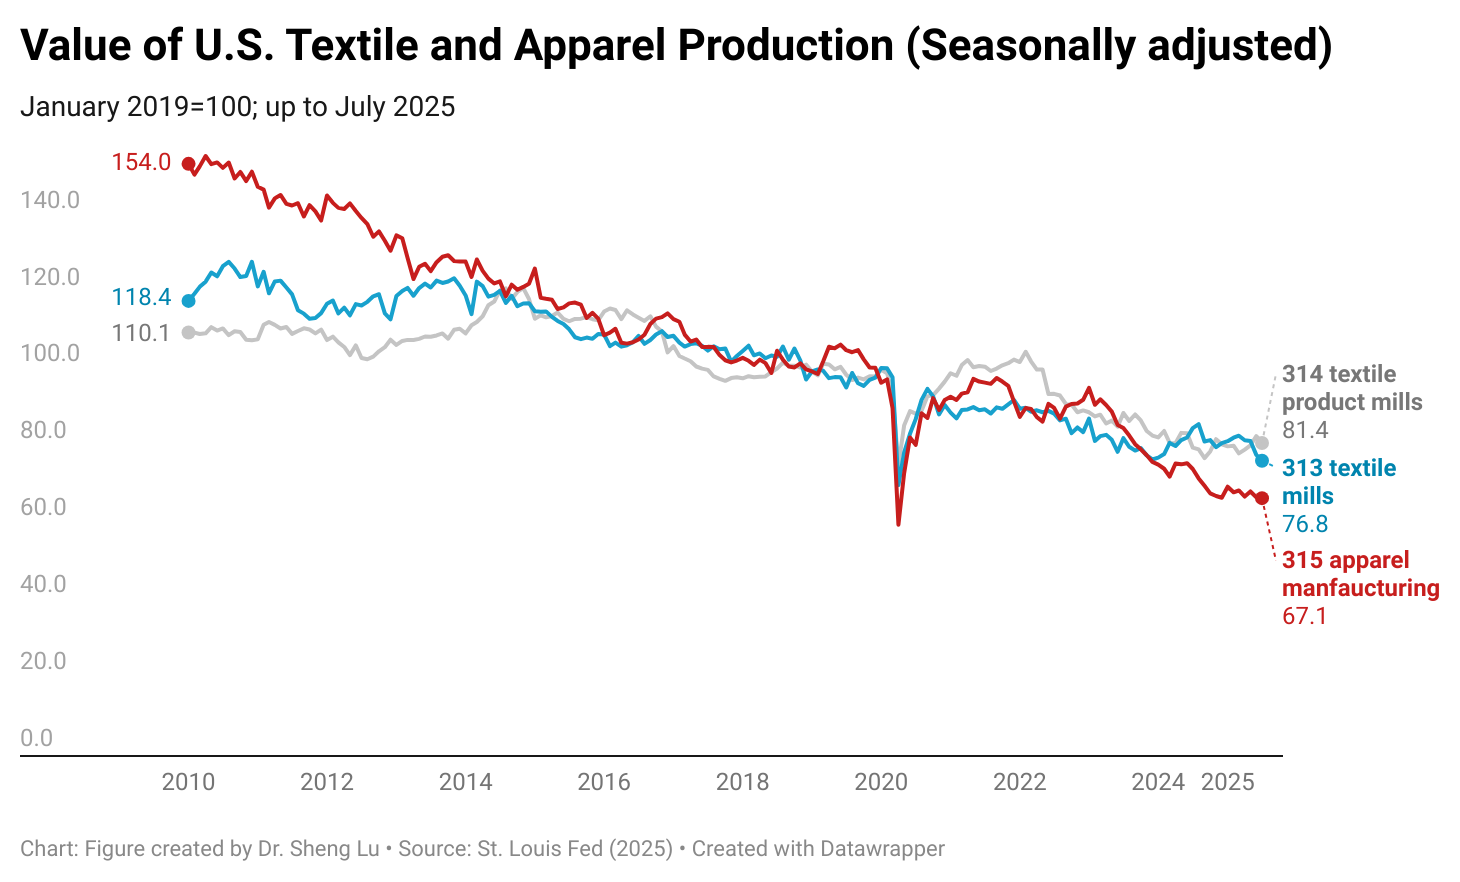
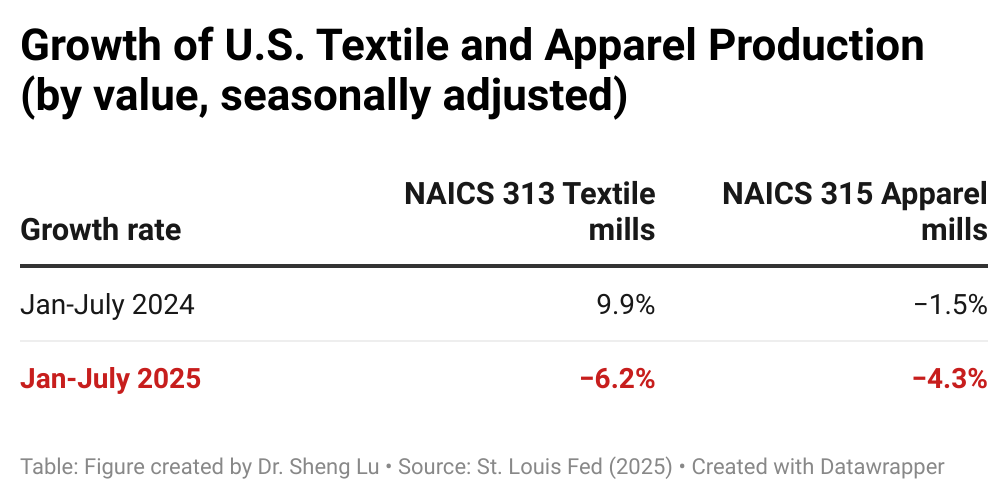
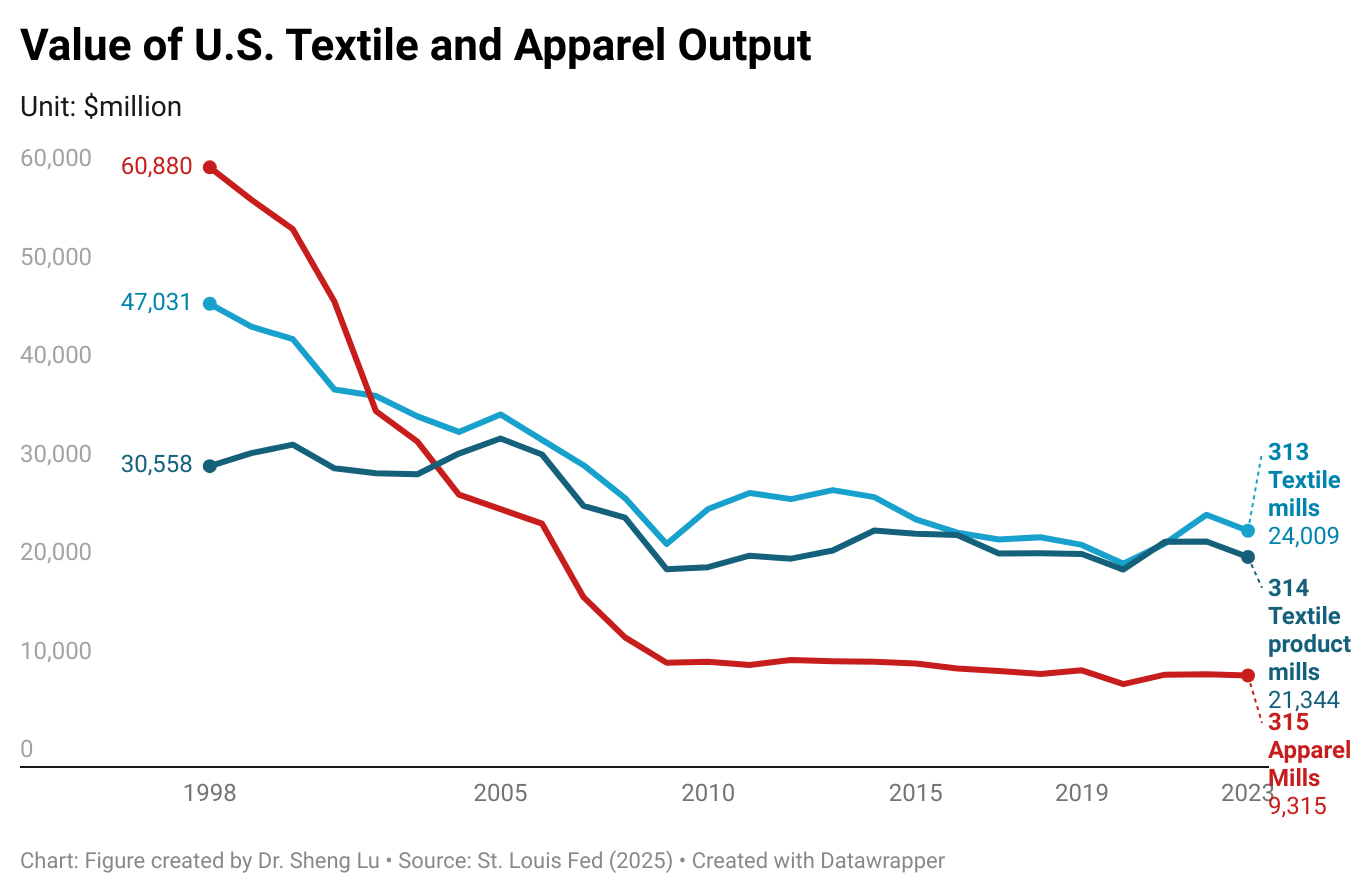
Textile and apparel manufacturing in the U.S. has significantly decreased over the past decades due to factors such as automation, import competition, and the changing U.S. comparative advantages for related products. However, thanks to companies’ ongoing restructuring strategies and their strategic use of globalization, the U.S. textile and apparel manufacturing sector has stayed relatively stable in recent years. For example, the value of U.S. yarns and fabrics manufacturing (NAICS 313) totaled $24 billion in 2023 (the latest data available), up from $23.3 billion in 2018 (or up 2.8%). Over the same period, U.S. made-up textiles (NAICS 314) and apparel production (NAICS 315) moderately declined by only 1.8% and 1.6%.
More importantly, the U.S. textile and apparel manufacturing sector is evolving. Several important trends are worth watching:
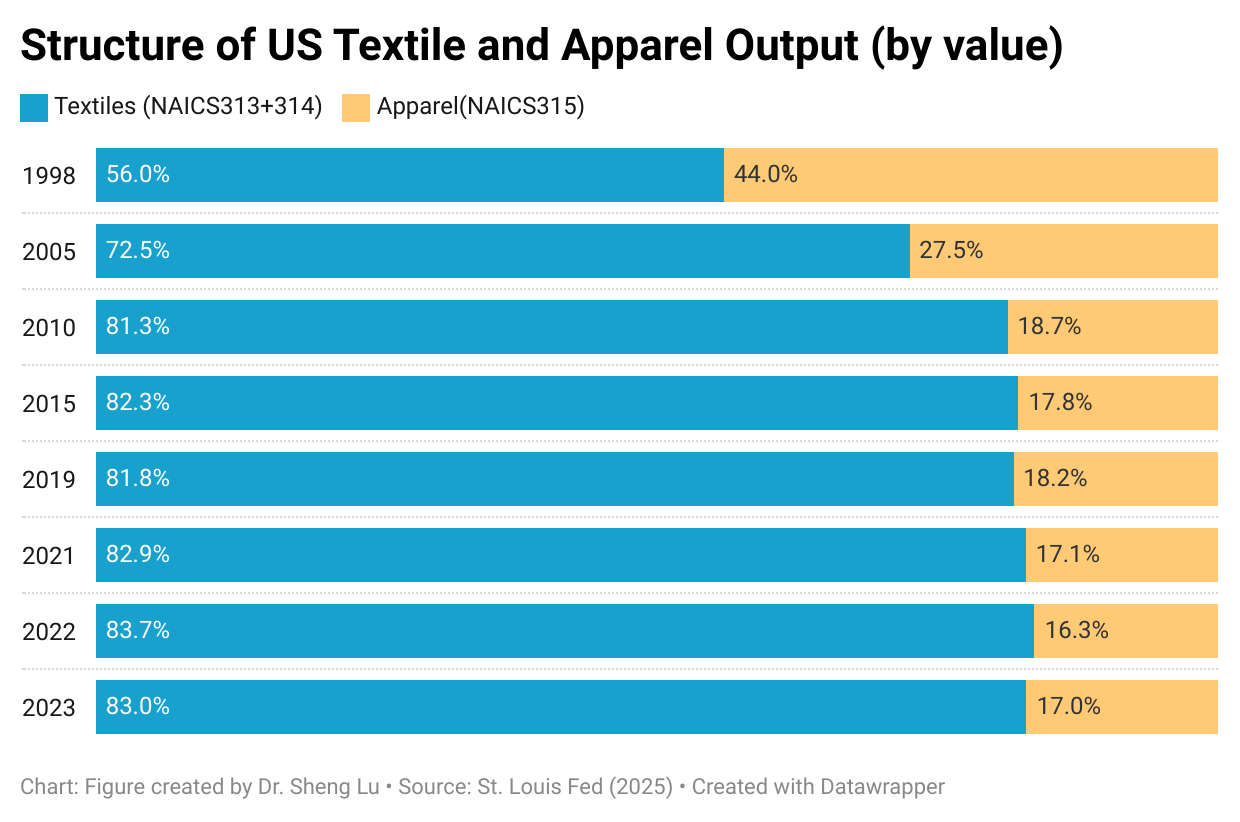
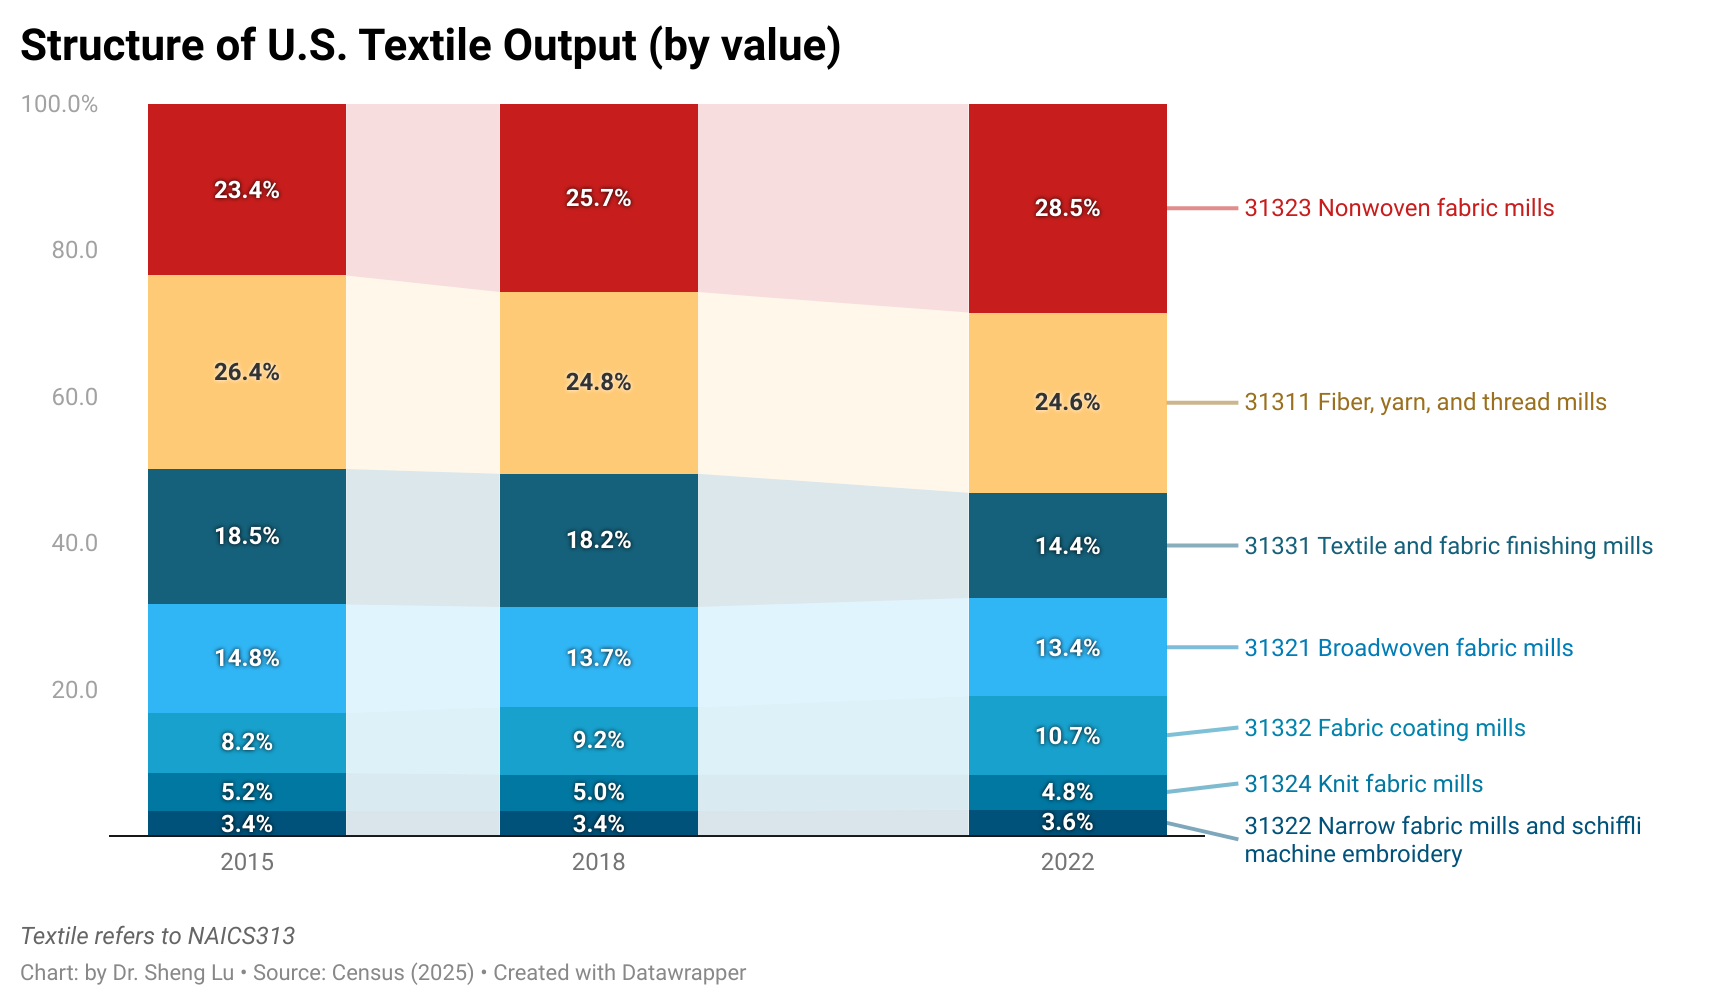
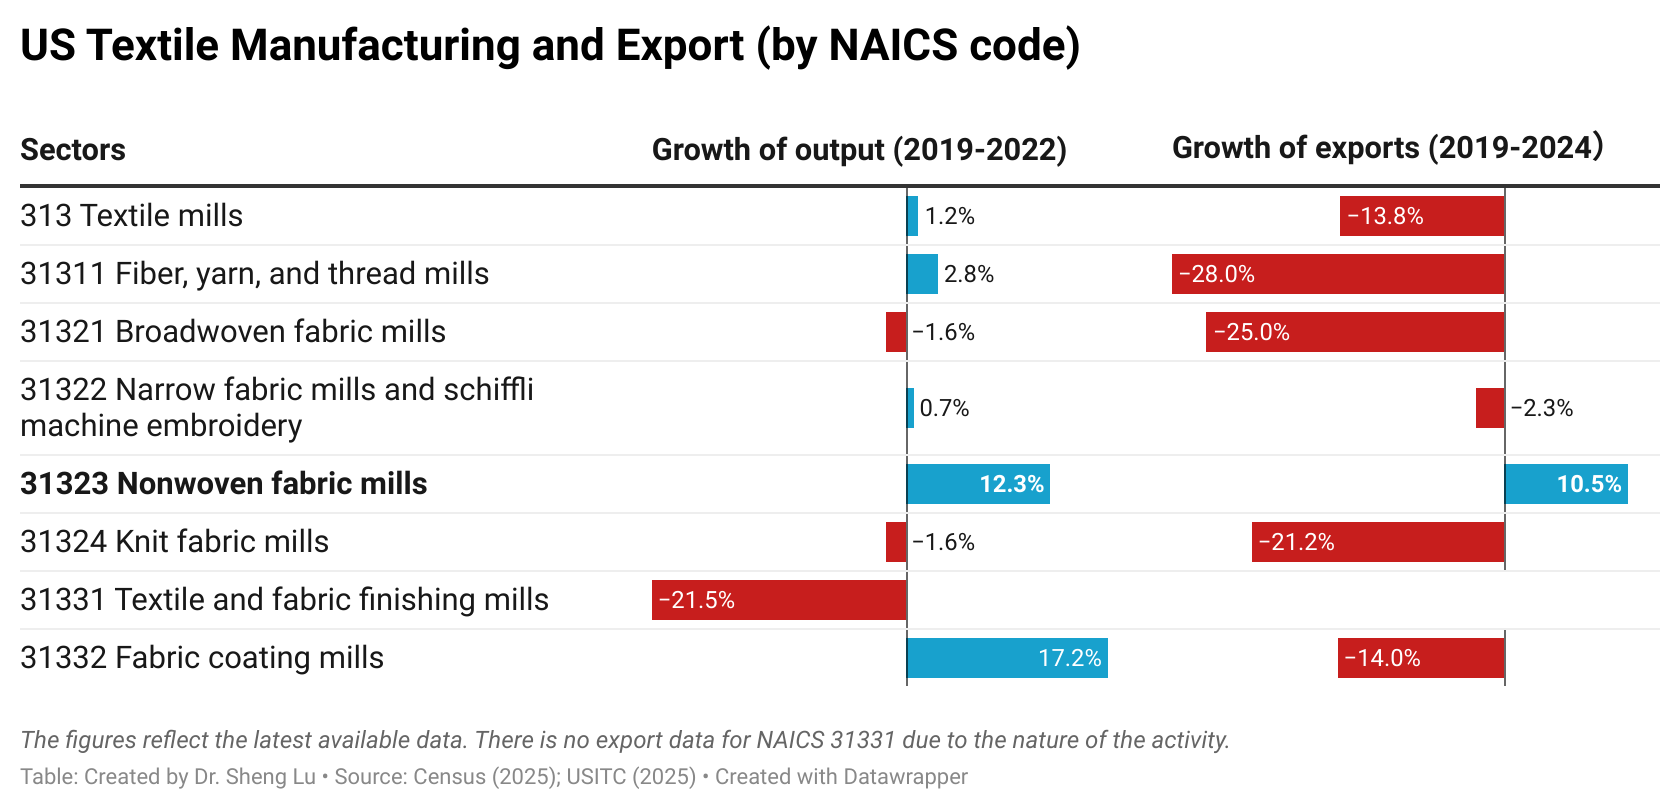
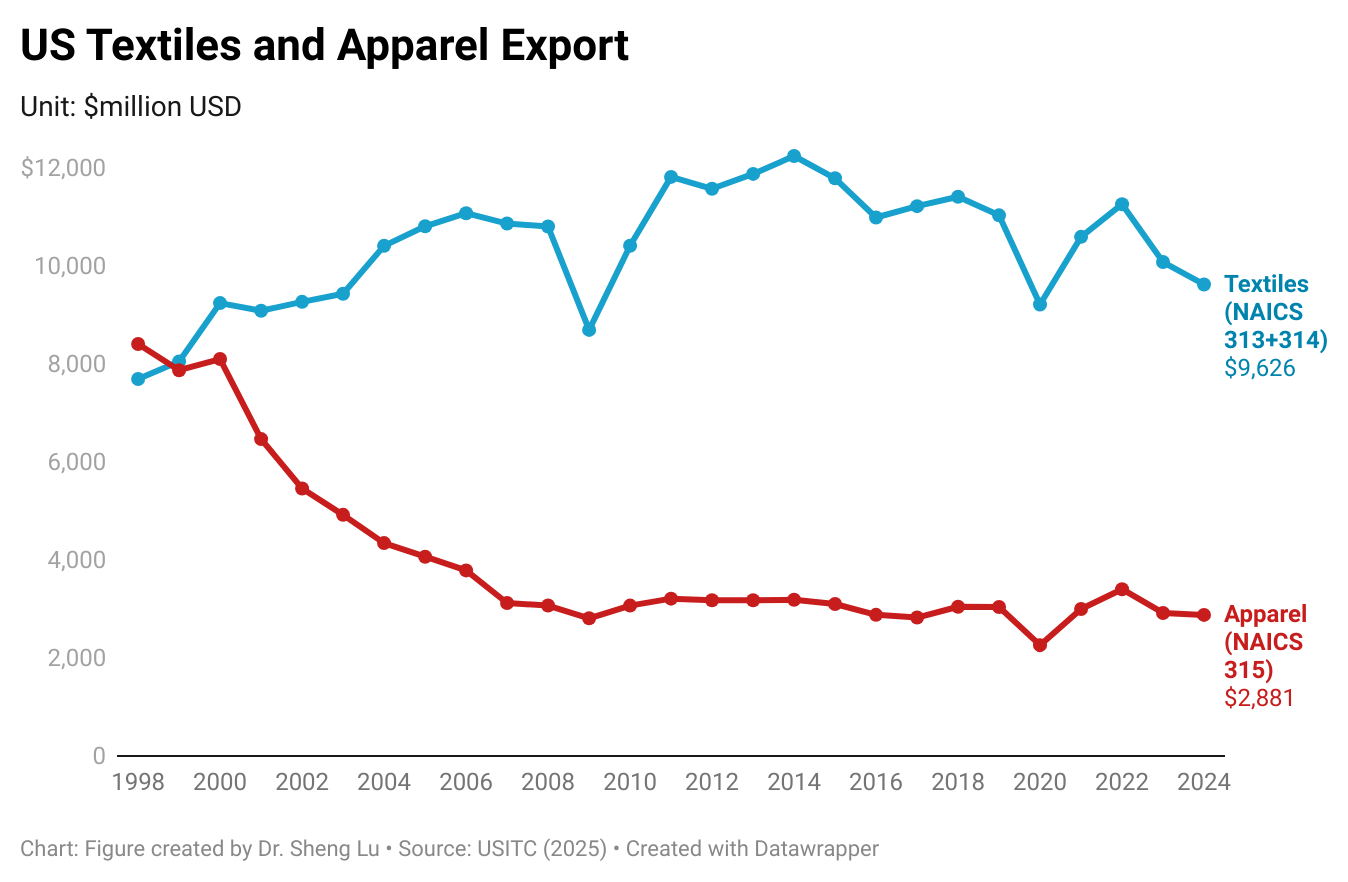
First, “Made in the USA” increasingly focuses on textile products, particularly high-tech industrial textiles that are not intended for apparel manufacturing purposes. Specifically, textile products (NAICS 313+314) accounted for over 83% of the total output of the U.S. textile and apparel industry as of 2023, much higher than only 56% in 1998 (U.S. Census, 2025). Textiles and apparel “Made in the USA” are growing particularly fast in some product categories that are high-tech driven, such as medical textiles, protective clothing, specialty and industrial fabrics, and non-woven. These products are also becoming the new growth engine of U.S. textile exports. Notably, between 2019 and 2022, the value of U.S. “nonwoven fabric” (NAICS 31323) production increased by 12.32%, much higher than the 1.15% average growth of the textile industry (NAICS 313). Similarly, while U.S. textile exports decreased by 13.75% between 2019 and 2024, “nonwoven fabric” exports surged by 10.48%--including nearly 40% that went to market outside the Western Hemisphere (U.S. International Trade Commission, 2025).
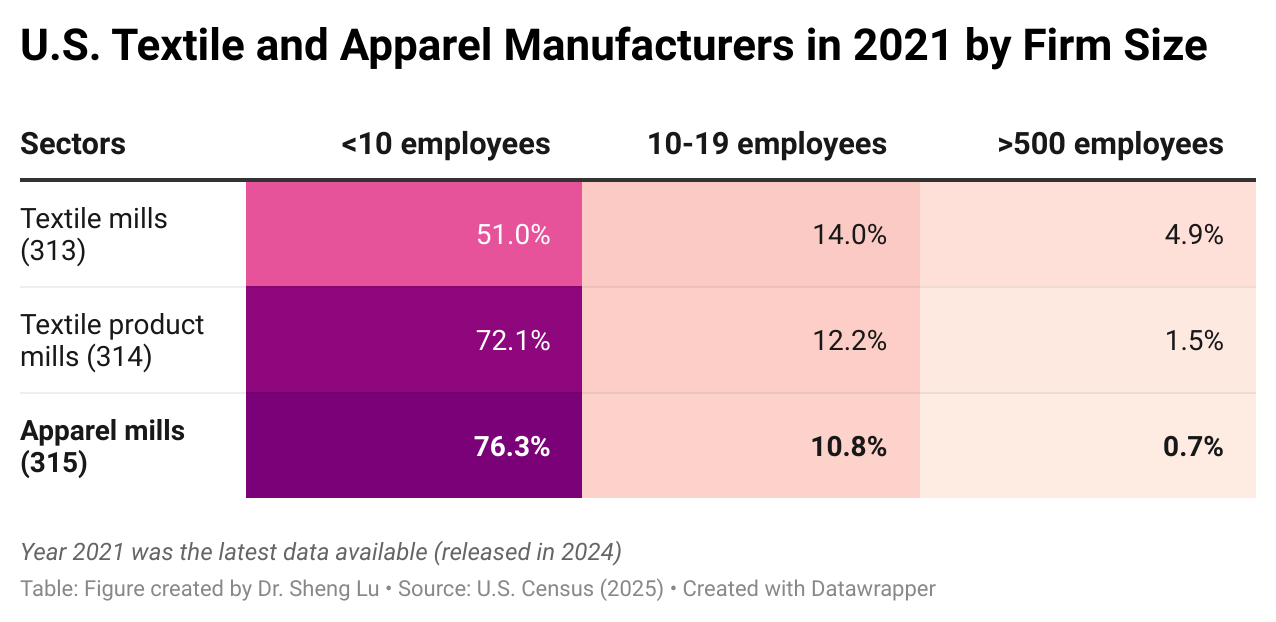
Second, U.S. apparel manufacturers today are primarily micro-factories, and they supplement but are not in a position to replace imports. As of 2021 (the latest data available), over 76% of U.S.-based apparel mills (NAICS 315) had fewer than 10 employees, while only 0.7% had more than 500 employees. In comparison, contracted garment factories of U.S. fashion companies in Asia, particularly in developing countries like Bangladesh, typically employ over 1,000 or even 5,000 workers.
Instead of making garments in large volumes, most U.S.-based apparel factories are used to produce samples or prototypes for brands and retailers. In other words, replacing global sourcing with domestic production is not a realistic option for U.S. fashion brands and retailers in the 21st-century global economy. Nor are U.S. fashion companies showing interest in shifting their business strategies from focusing on “designing + managing supply chain+ marketing” back to manufacturing.
Meanwhile, due to mergers and acquisitions (M&A) and to leverage economies of scale, approximately 5% of U.S. textile mills (NAICS313) had more than 500 employees as of 2021–this is a significant number, considering that textile manufacturing is a highly capital-intensive process.
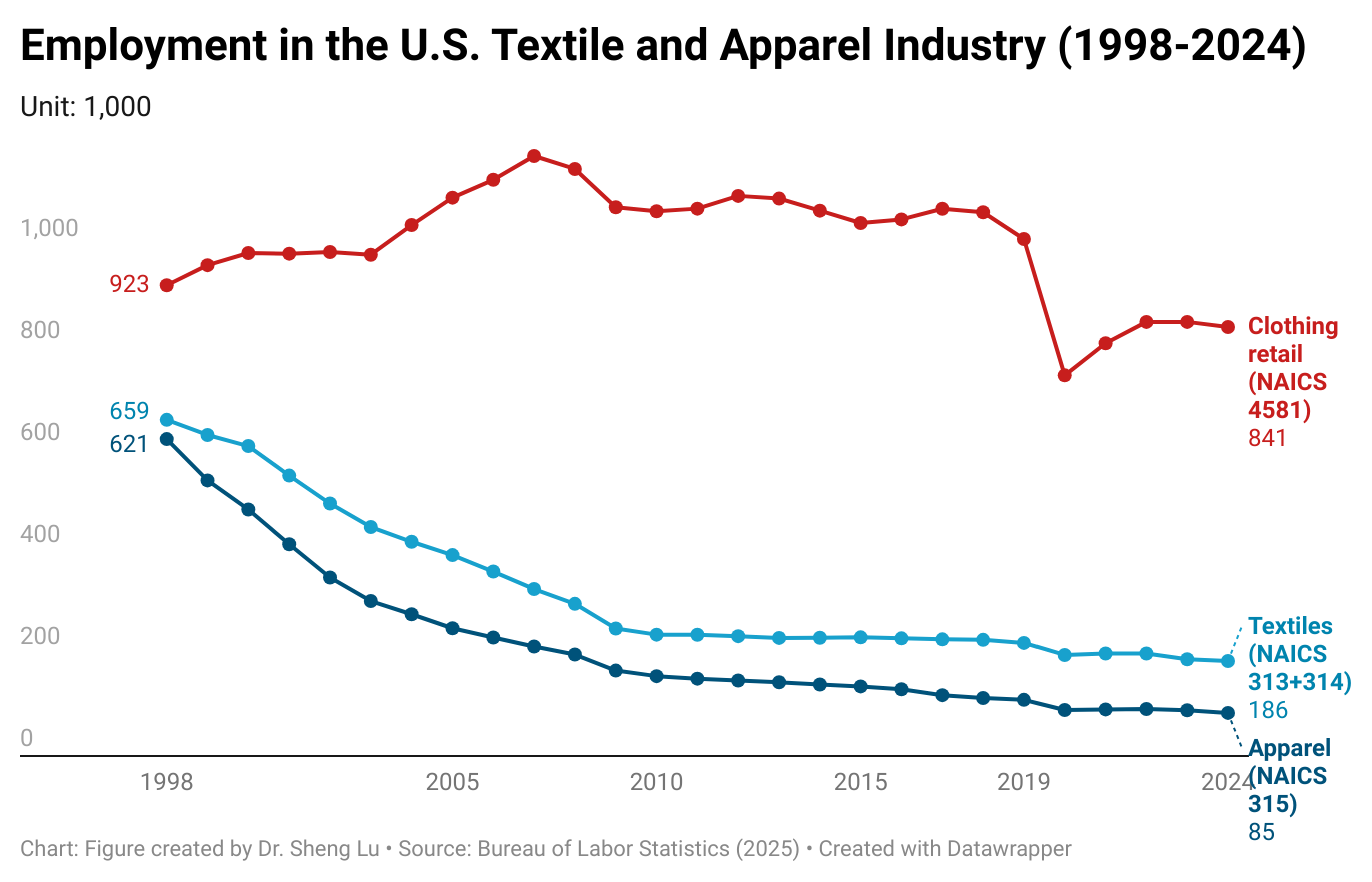
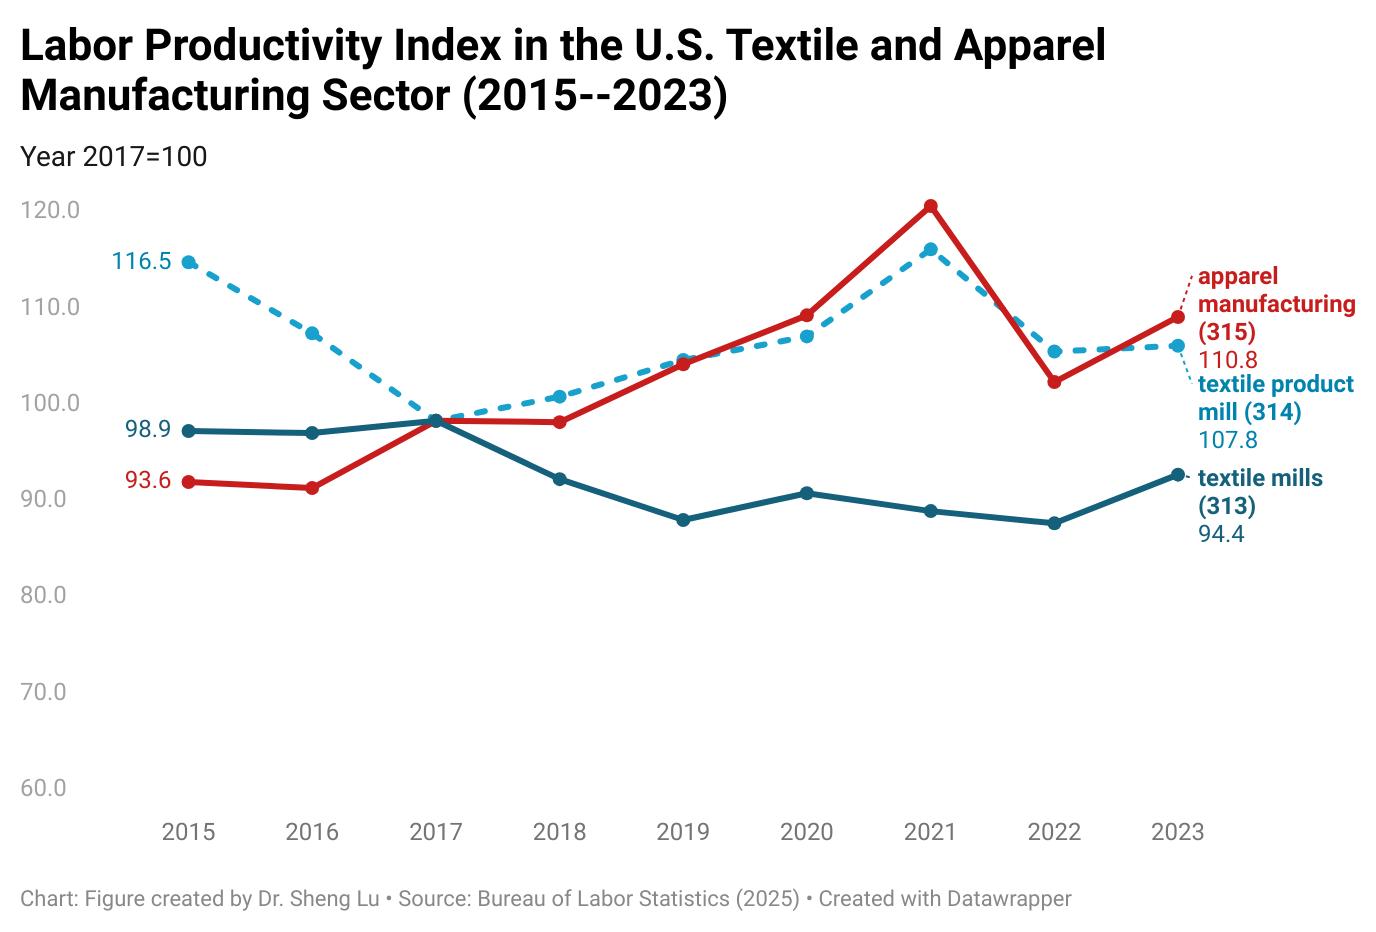
Third, employment in the U.S. textile and apparel manufacturing sector continued to decline, with improved productivity and technology being critical drivers. As of 2024, employment in the U.S. textile and apparel manufacturing sector (NAICS 313, 314, and 315) totaled 270,700, a decrease of 18.4% from 33,190 in 2019. Notably, U.S. textile and apparel workers had become more productive overall—the labor productivity index of U.S. textile mills (NAICS 313) increased from 89.7 in 2019 to 94.4 in 2023, and the index of U.S. apparel mills (NAICS 315) increased from 105.8 to 110.78 over the same period.
On the other hand, clothing retailers (NAICS 4481) accounted for over 75.7% of employment in the U.S. textile and apparel sector in 2024.
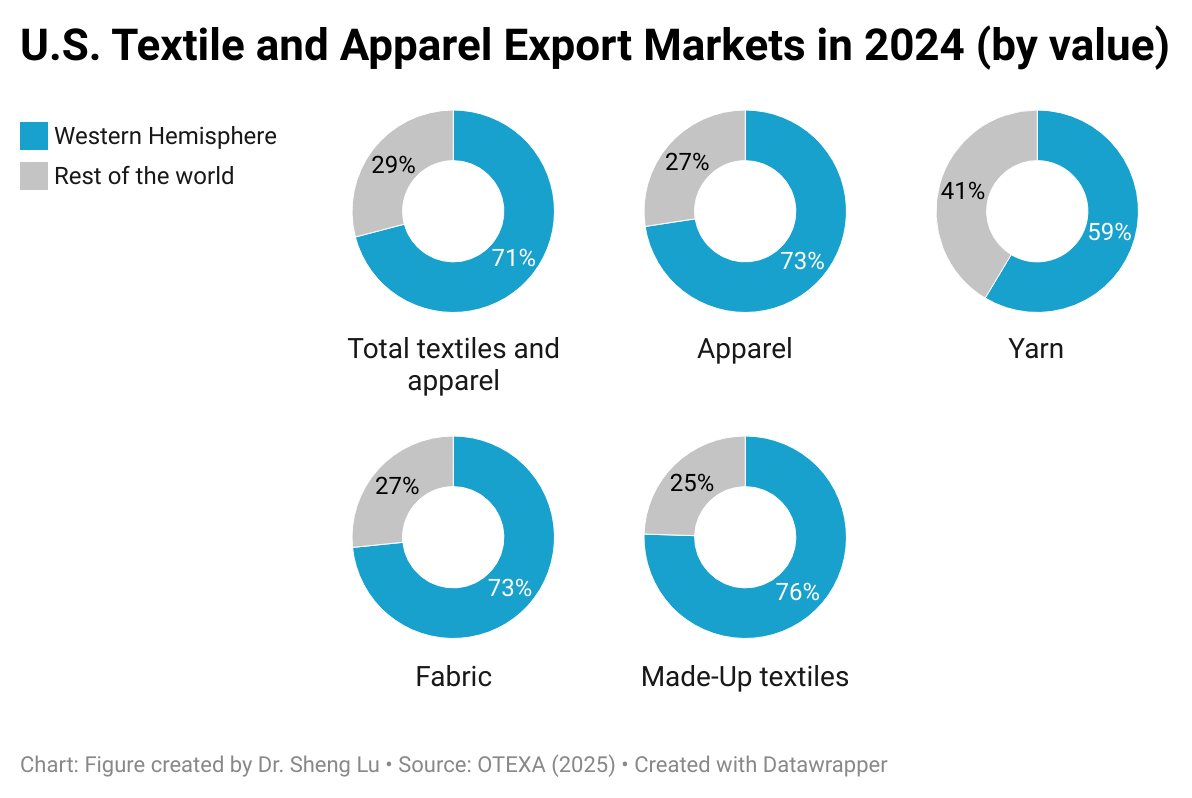
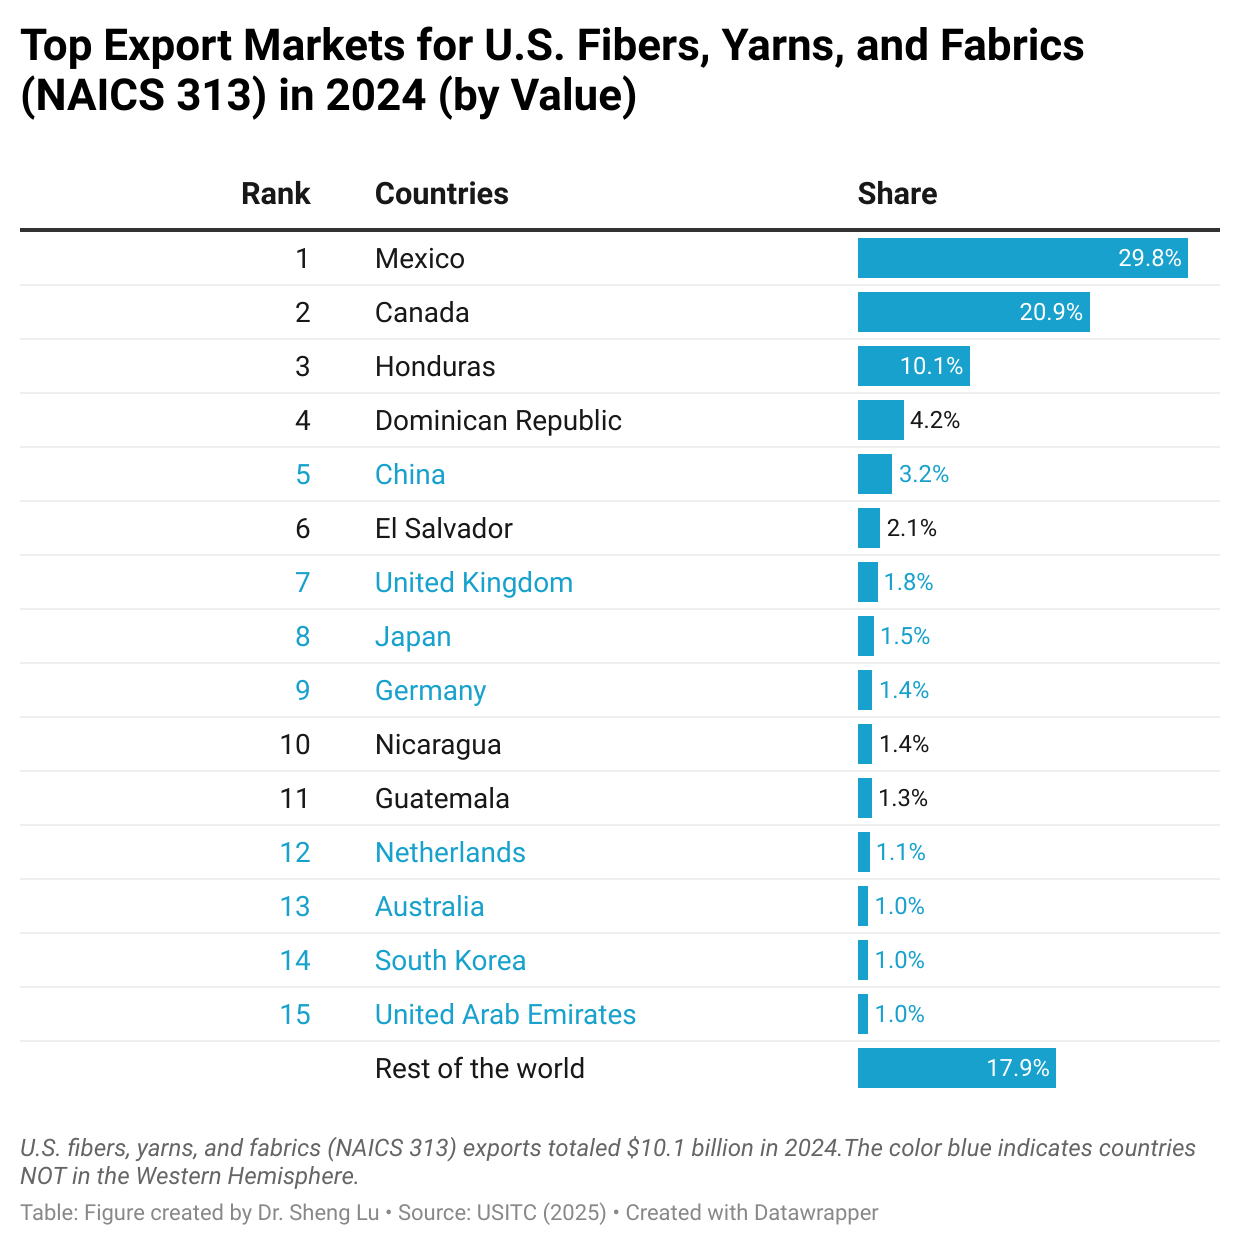
Fourth, international trade, BOTH import and export, supports textiles and apparel “Made in the USA.” On the one hand, U.S. textile and apparel exports exceeded $12.5 billion in 2024, accounting for more than 30% of domestic production as of 2023 (NAICS 313, 314 and 315). Thanks to regional free trade agreements, particularly the U.S.-Mexico-Canada Agreement (USMCA) and the Dominican Republic-Central America Free Trade Agreement (CAFTA-DR), the Western Hemisphere stably accounted for over 70% of U.S. textile and apparel exports over the past decades. However, for specific products such as industrial textiles, markets in the rest of the world, especially Asia and Europe, also become increasingly important. Thus, lowering trade barriers for U.S. products in strategically significant export markets serves the interest of the U.S. textile and apparel industry.
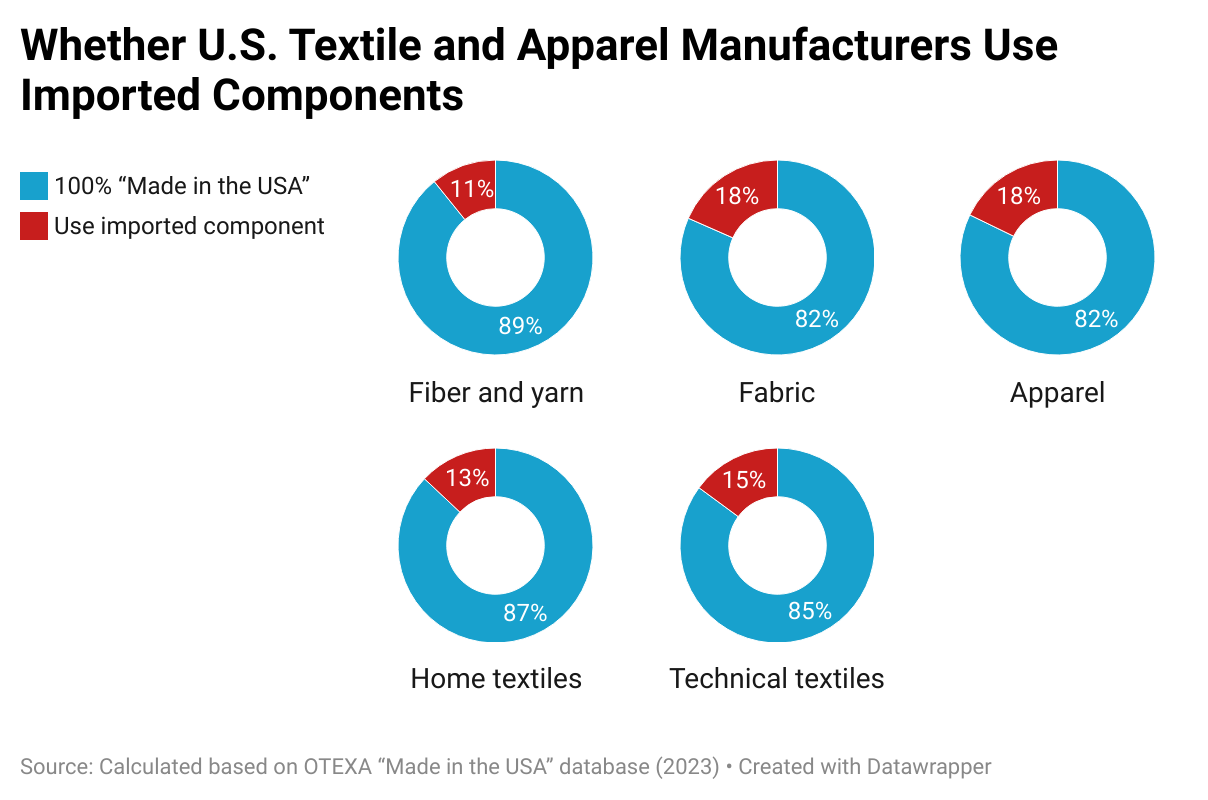
On the other hand, imports support textiles and apparel “Made in the USA” as well. A 2023 study found that among the manufacturers in the “Made in the USA” database managed by the U.S. Department of Commerce Office of Textile and Apparel, nearly 20% of apparel and fabric mills explicitly say they utilized imported components. Partially, smaller U.S. textile and apparel manufacturers appear to be more likely to use imported components–whereas 20% of manufacturers with less than 50 employees used imported input, only 10.2% of those with 50-499 employees and 7.7% with 500 or more employees did so. The results indicate the necessity of supporting small and medium-sized (SME) U.S. textile and apparel manufacturers to more easily access their needed textile materials by lowering trade barriers like tariffs.
What do you think about the pink tariff? How does the pink tariff affect different stakeholders, including consumers and fashion companies?
How can fashion companies respond to or navigate pink tariffs in their global sourcing, particularly considering the tariff escalation in 2025?
What role can governments and international trade organizations play in addressing pink tariffs, and what policy changes could help eliminate the disparities? What are the challenges?
The United States Fashion Industry Association (USFIA), whose members include many leading U.S. fashion brands and retailers, opposes raising tariffs and argues for lowering tariffs on textile and apparel products where the U.S. imposes a higher tariff rate than its trading partners. According to USFIA, higher tariffs on apparel and textiles would disproportionately impact lower-income U.S. consumers:
“A true ‘reciprocal’ trade policy would lower tariffs on the products of trading partners that maintain lower tariffs than the United States.”
“We recommend that the most successful policy to achieve trade reciprocity would be for the United States to lower the tariff rates of products for which our trading partners apply lower tariff rates. For consumer products such as textiles and apparel, this would help combat inflation and assist consumers who struggle to afford basic necessities.”
The American Apparel and Footwear Association (AAFA), representing U.S.-based “apparel, footwear and other sewn products companies”, opposes broad tariffs on apparel, footwear, and textiles. It is of concern to AAFA that the apparel and footwear sector already faces some of the highest tariffs in the U.S., and tariffs are a “hidden, regressive tax that falls harder on lower-income Americans.” Even worse, AAFA worries that higher tariffs would benefit “Illicit traders” and tariff threats would undermine the regional textile and apparel supply chain in the Western Hemisphere:
“Illicit traders are better positioned to escape paying proper duties or any duties at all. Higher tariffs end up maximizing the profit and market access they can gain at the expense of legitimate shippers.”
“Recent tariff threats particularly on our neighbors, Canada and Mexico, are especially concerning as the U.S.-Mexico-Canada Agreement (USMCA) review is about to begin. Canada is a key export market for U.S. made apparel and footwear while Mexico is a major source of a wide variety of apparel, including denim imports. Not only does the threat of tariffs cast uncertainty but it also undermines future investment and nearshoring opportunities.”
“We strongly recommend that the Trump administration take a targeted approach to raise tariffs on specific countries that disrupt markets through the use of blatantly unfair and often illegal trade practices, while simultaneously operating in home markets that remain mostly closed to our products.”
“We must preserve and strengthen existing trade relationships with U.S. free trade agreement (FTA) countries in the Western Hemisphere that offer valuable markets for U.S.-made textiles.”
“We strongly believe that reciprocity should not mean a race to the bottom with lower tariffs on imports from other countries into our market. Rather, reciprocity should hold bad actors accountable for systemic unfair trade practices that have hurt domestic manufacturers.”
“We urge the Trump administration to take several actions immediately to make textile and apparel trade more reciprocal and to support the domestic industry…Aggressively raise tariffs on imports of textile and apparel products from China and other trade predators in Asia…Close the de minimis loophole for all countries…”
SMART (Secondary Materials and Recycled Textiles Association),representing businesses engaged in the collection, reuse, conversion, and recycling of textiles and other secondary materials, advocates for addressing trade barriers that affect U.S. secondhand clothing exports. SMART also opposes CAFTA-DR members using the “yarn-forward” rules of origin for imports of secondhand clothing (HTS 6309) from the U.S. under the agreement.
National Retail Federation (NRF), generally representing all types of U.S. retailers, opposes broad-based tariffs, arguing that they increase consumer costs, disrupt supply chains, and hurt retailers. NRF supports targeted measures against unfair trade practices but warns against policies that could lead to unnecessary retaliation from U.S. trading partners.
“We believe that high, across-the-board tariffs will undermine the economic growth signaled by the other features of the president’s agenda and have lasting negative consequences for consumers and workers. If the goal of reciprocal tariffs is to enter into negotiations to remove barriers to trade, this will unlock economic growth and reduce prices for consumers. However, if the goal is primarily to raise tariffs, then the opposite is true.”
“There are plenty of areas where U.S. tariffs are actually much higher than our trading partners, for example, especially when you look at U.S. tariffs on low value apparel and footwear. These regressive tariffs hurt low- and middle-income consumers the most.”
“The administration should also consider the potential for retaliation from our trading partners on any reciprocal tariffs that are established. We are already witnessing our trading partners respond to strong tariff actions by the administration. This will further impact our farmers and manufacturers who are looking to gain access to those foreign markets.”
“We need to focus on key high-priority sectors where it makes sense to return manufacturing home or areas where there is strategic competition. High tariffs on everyday household goods, which could raise consumer prices, should not be the focus of such a policy.”
Parkdale Mills, a leading producer of spun yarns based in North Carolina, expressed concerns about “unfair trade practices” from its Asian competitors. Parkadel also calls for closing the “De minimis” loophole.
“Each week millions of pounds of product move through our free trade agreement partner countries illegally causing significant damage to the domestic textile industry. Non qualifying goods are shipped using false HTS codes, False Certificates of Origin, and illegal inputs to circumvent the required duty for US entry.”
“Section 321 De Minimis (imports)…are shipped into the US each day without inspection or any type of customs enforcement causing millions in lost revenue and again, thousands of lost jobs. This loophole must be closed.”
Apparel products are often subject to high tariffs for various reasons. In developed countries such as the United States, apparel has long been considered an “import-sensitive” sector, with relatively high tariff rates imposed primarily to “protect” specific domestic interest groups with political influences.
However, as importers, not exporters, pay the tariffs, heavy import duties have been a significant concern for US fashion companies for decades. According to data from the US International Trade Commission (USITC), in 2024, apparel (HS chapters 61 and 62) accounted for about 2.5 percent of total US imports but contributed approximately 15.6 percent of total tariff duties. Likewise, US fashion companies paid $11.9 billion in tariffs on apparel imports in 2024, an increase from $11.6 billion in 2023. The average applied tariff rate for apparel items reached 14.6% in 2024, a notable increase from 13.7% before the imposition of Section 301 tariffs on Chinese products. Additionally, due to retail markups, every $1 in tariffs could result in a $1.50 to $2 increase in the final retail price.
Meanwhile, developing countries, especially those least developed, also often impose high tariffs on apparel—either to protect their nascent domestic industries from import competition or to generate government revenues. For example, in Africa, the apparel import tariff rate commonly exceeds 35% as of 2023 (the latest data available).
In February 2025, President Trump announced the imposition of a so-called “reciprocal tariff,” aiming to “match” the tariff rates that other countries impose on US exports, thereby promoting “fairer trade practices.” However, the details of the “reciprocal tariff” idea remain highly uncertain.
In theory, if strict “tariff matching” is required on a product-by-product basis, US apparel imports from most leading sourcing destinations—particularly those in Asia without a free trade agreement with the US–would face a significant increase in tariffs. Similarly, beneficiary countries under the African Growth and Opportunity Act (AGOA) could face a similar issue, as AGOA is a trade preference program that does not provide duty-free market access for US products in Africa. If apparel exports from AGOA-member countries to the US were subjected to the same 35%+ tariff rates that US products currently face in their markets, it would be a devastating scenario.
By Sheng Lu
(note: this post is not open for comment/discussion)
According to the “America First Trade Policy” released in January 2025, the Trump administration aims to leverage tariffs to achieve various policy objectives, from reducing the U.S. trade deficit to countering “unfair” trading practices.
On February 1, 2025, the Trump Administration further announced the implementation of a 25% punitive tariff on imports from Canada and Mexico, along with an additional 10% punitive tariff on goods from China, in addition to the existing duties. With over 98% of clothing sold in the U.S. imported from abroad, U.S. fashion apparel companies are likely to be among the hardest hit by the tariff increase, particularly since Mexico and China are two of the leading apparel-sourcing destinations for the country.
This study aims to explore the dynamic relationship between U.S. apparel import tariffs, U.S. apparel import prices, and U.S. apparel retail prices. Since tariff rates, import prices, and retail prices are interrelated, a vector autoregression model (VAR) was used to analyze their interactions. The analysis was based on monthly data from January 2015 to November 2024 (latest data available), including:
U.S. apparel tariff rate (data source: USITC; tariff rate=value of calculated duties/custom values)
Price index of U.S. apparel imports (data source: St. Lous Federal Reserve; January 2015=100)
Price index of U.S. apparel retail price(data source: St. Louis Federal Reserve; January 2015=100)
Index of U.S. apparel retail sales(data source: St. Louis Federal Reserve; January 2015=100)
Consumer Price Index for all U.S. urban consumers (data source: St. Louis Federal Reserve; January 2015=100)
The results show that:
First, from January 2015 to November 2024, the average U.S. apparel tariff rate ranged from 12% to 17%. The fluctuation of the tariff rate during that period was primarily caused by the U.S. imposition of Section 301 punitive tariffs on imports from China, along with fashion companies shifting their sourcing from China to other countries, including members of U.S. free trade agreements.
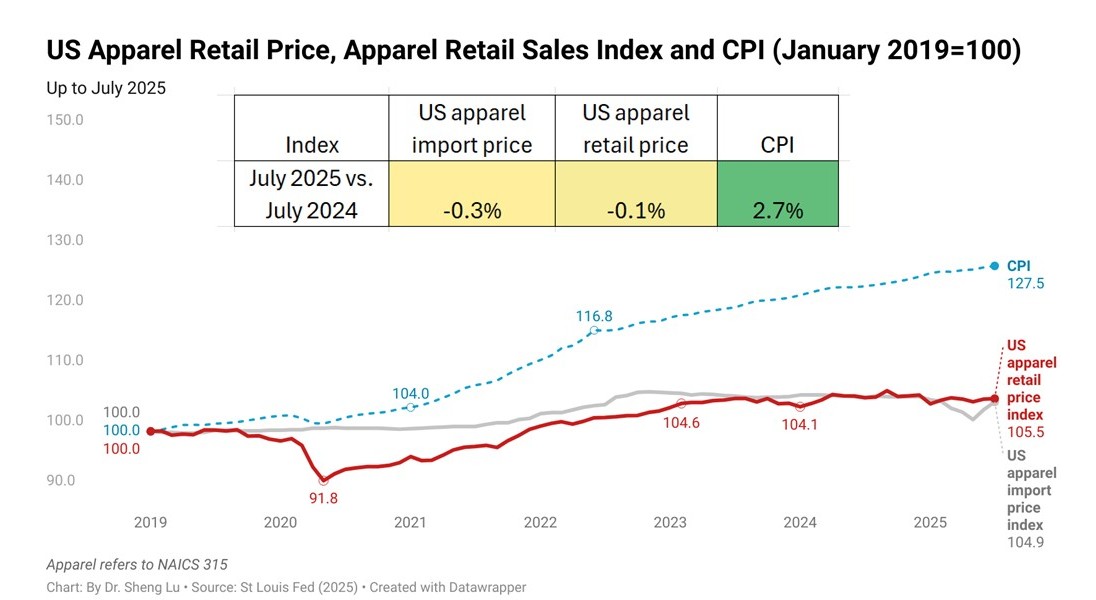
Second, the average price of U.S. apparel imports rose by approximately 6% from January 2015 to November 2024, which aligns with the U.S. apparel retail price increase of 4%. However, this increase was significantly lower than the 34% rise in the U.S. Consumer Price Index (CPI) over the same period. This pattern shows that despite overall inflation and higher operational costs, apparel exporters and U.S. retailers remained cautious about increasing prices due to intense market competition.
Third, the impulse response function (IRF) indicates that a positive tariff shock (i.e., a tariff increase) would lead to a rise in the U.S. apparel retail price. However, the magnitude of this effect is moderate, with the impact being most felt two months later. Specifically, a one-standard-deviation increase in tariffs would result in a 0.16 standard deviation increase in retail prices during Period 3. In other words, the price effect of the tariff increase typically appears in about two months. However, U.S. fashion retailers usually do not transfer the entire burden of tariffs to consumers, likely because of fierce competition in the market.
Fourth, the impulse response function (IRF) indicates that a positive tariff shock (i.e., a tariff increase) would lead to a slight decline in U.S. apparel import prices. This price decrease would also persist for about three months. Specifically, a one-standard-deviation increase in tariffs would result in approximately a 0.01 standard deviation decrease in apparel import prices through Period 4. This result aligns with previous studies indicating that following the implementation of Section 301 punitive tariffs in 2018, some Chinese exporters agreed to reduce their selling prices to keep sourcing orders.
Fifth, the impulse response function (IRF) further shows that a positive tariff shock (i.e., a tariff increase) could hurt U.S. apparel retail sales in the short to medium term. Specifically, a one-standard-deviation increase in tariffs would lead to approximately a 0.82-2.33 standard deviation decrease in U.S. apparel retail sales from Period 3 through Period 5. This result may be driven by higher selling prices, suppressing consumer spending on clothing.
Additionally, the variance decomposition analysis reveals that, in the short to medium term, about 50% to 80% of the variation in U.S. retail prices is explained by its own past values, underscoring the persistence of retailers’ pricing practices. Meanwhile, U.S. apparel retail sales account for about 27% of the changes in U.S. apparel retail prices. In comparison, apparel tariff changes explained only about 5% of the retail price fluctuations. In other words, market factors, particularly consumer demand, play a more significant role in shaping fashion companies’ pricing decisions than tariffs.
In summary, the study’s findings confirm the interconnections between apparel tariff rates, U.S. apparel import prices, and U.S. retail prices,although these relationships turn out to be more complex and nuanced than previously suggested. It is important to note that only apparel imports from China were subject to tariff increases during the examined period in this study. If tariffs were to increase on apparel products from a broader range of countries during Trump’s second term, the economic impact on U.S. apparel retail prices could be much more significant and persistent.
About the interview: Fashion is possible because of international trade. Each year, the global fashion industry generates more than $4 trillion USD and provides families with affordable clothing options. However, as fast fashion continues to grow, so does awareness of pressing issues such as labor standards and environmental sustainability. How are the United States and China involved in the global fashion industry? How can they collaborate on the issues facing the global fast fashion industry, from production to consumption?
Sheng Lu joins the National Committee to discuss how fast fashion is a global phenomenon and how the United States and China can address common areas of concern.
As the fashion industry grapples with increasing demands for sustainability, transparency, and social responsibility, the next generation of industry professionals—Generation Z—will play a crucial role in shaping the future of apparel sourcing and social responsibility practices in the industry.
This session explores how US college fashion programs equip Gen Z with critical knowledge in due diligence, sustainable sourcing, and supply chain transparency. Including voices from educators, Gen Z students (future professionals), and industry partners, the session will share best education practices, identify educational gaps, and present valuable Gen Z’s vision for improving due diligence and social responsibility in the garment industry. Additionally, the session will emphasize the increasing importance of industry-academic partnerships in curriculum development and talent preparation, illustrating the long-term benefits of such collaboration.
This session is highly relevant to industry professionals, educators, students, international organizations, and policymakers interested in supporting the next generation of fashion leaders and fostering a more socially responsible and sustainable fashion industry.
Discussion questions [Please address at least two questions in your comment]
#1: Based on the video and our class discussion, what would be the advantages and disadvantages for Nike to make Converse shoes leveraging a global supply chain?
#2: Assume you are an experienced U.S. shoe worker. What arguments would you present to Nike’s sourcing executives to produce Converse in the United States?
#3: In your opinion, are protective tariffs worth the economic and foreign policy consequences? Why or why not?
#4: The “hidden costs” of global trade (e.g., emissions, labor conditions) are often obscured from consumers. How can brands like Converse address these “hidden costs” while maintaining market competitiveness? What specific policies or regulatory measures should governments implement to promote responsible sourcing and enhance supply chain transparency?
Who might be the winners and losers of the suspension of the de minimis provision for U.S. imports from China? Why?
Imagine you are part of the sourcing department of a U.S.-based fashion company that currently sources from China. How would you respond to the situation in the video, and what recommendations would you make regarding your company’s sourcing strategies?
Do you have any other thoughts or reflections on the video?
In December 2024, Just-Style consulted a panel of industry experts and scholars in its Shape of apparel sourcing in 2025 briefing. Below is my contribution to the report. Welcome any comments and suggestions!
What’s next for apparel sourcing
Although the world economy is predicted to grow at a similar pace in 2025 from 2024, the slowing US and Chinese economies could impose new challenges to apparel sourcing, from weakened demand to intensified price competition.
Regarding the macroeconomic environment in 2025, which “sets the tone” for apparel sourcing, the International Monetary Fund (IMF) and the World Bank estimated that the world economy would grow by approximately 2.7-3.2 percent in 2025, with almost no change from the previous year. Similarly, the World Trade Organization (WTO) projected that world merchandise trade would increase by 3.3 percent in 2025, slightly higher than 2.6 percent in 2024.
Despite this incremental improvement, the world’s two largest economies–the US (with 2.2 percent GDP growth in 2025, down from 2.8 in 2024 and 2.9 in 2023) and China (with 4.5 percent GDP growth in 2025, down from 4.8 in 2024 and 5.2 in 2023) are expected to experience slower economic growth in the new year ahead. This slowdown means that apparel producers around the world, particularly those developing countries making large-volume basic items, will likely continue to struggle with a shortage of souring orders in 2025 due to overall weak import demand.
Even more concerning, as China grapples with declining domestic sales, the world clothing market could see an additional influx of low-cost Chinese products, especially through new e-commerce channels. Notably, less than half of China’s clothing production is exported, indicating its significant untapped export capacity. Furthermore, while China’s wage levels are higher than those in many other Asian apparel-producing countries, the unit price of U.S. apparel imports from China measured in dollar per square meter equivalent ($/SME) dropped by more than 21% between 2018 and 2024 (up to October). In contrast, U.S. apparel import prices from the rest of the world increased by 7.8% over the same period. Related to this, what is often overlooked is that even Shein, the “ultra-fast fashion” retailer known for its exceptionally competitive pricing, deliberately opted out of the vast Chinese market due to concerns about the intense price competition there. In other words, disregarding the new Trump tariff, 2025 could see an escalation of trade tensions targeting Chinese products in the US market and beyond.
Meanwhile, due to concerns about rising geopolitical tensions worldwide and trade policy uncertainty during Trump’s second term, fashion companies will likely continue to leverage sourcing diversification to mitigate risks. However, the “reducing China exposure” and sourcing diversification movement has yet to substantially benefit near-shoring or emerging sourcing destinations such as the Western Hemisphere and Sub-Saharan Africa (SSA). This result was mainly because fashion companies utilized China to source a wide range of various products, whereas Western Hemisphere and SSA suppliers can only produce a few basic categories.
For example, my latest studies show that in the first nine months of 2024, even excluding major platforms like Shein, Amazon, and Temu, US fashion companies sourced more than 60K Stock Keeping Units (SKUs) of clothing items from China. In comparison, India and Vietnam each supplied approximately 15K SKUs, Cambodia and Bangladesh each contributed 3,000 SKUs, Mexico provided only 2K SKUs, and CAFTA-DR and AGOA member countries supplied around 200 SKUs each. Therefore, even if fashion companies report sourcing from more countries, they are likely to stay sourcing from more Asian countries with closer export capacity and structure to China. Meanwhile, the total value or volume of trade may not fully capture the whole picture of sourcing diversification. This trend may persist in 2025, even with new tariff escalations.
Apparel industry challenges and opportunities
Today’s fashion business is highly global and relies heavily on the frequent movement of goods and services across borders. Thus, the uncertain and protectionist nature of U.S. trade policy during Trump’s second term could present significant challenges to the fashion industry in 2025. Of particular concern is that Trump’s new tariff actions would raise fashion companies’ sourcing costs, create additional inflationary pressure, reduce US consumers’ purchasing power on clothing, and trigger retaliatory trade measures from U.S. trading partners, ultimately hurting the U.S. economy. Notably, when the 7.5% Section 301 tariff was imposed on selected Chinese clothing products in 2018, the U.S. Consumer Price Index (CPI) growth was relatively low at 1.9%. However, imposing a 20% global tariff, a 60% tariff on Chinese products, and the existing 15%-30% regular tariff on clothing when the CPI is historically high is like “adding fuel to the fire.”
Besides tariffs, in 2025, if not sooner, U.S. fashion companies and many e-commerce suppliers worldwide will closely watch how Congress and the new Trump administration reform the de minimis rule, which currently exempts small-value shipments under $800 from tariffs and most customs procedures. With Trump’s new tariffs looming, some argue that closing the de minimis “loophole” has become even more urgent, as it creates more financial incentives to use the rule to bypass the tariff increase. Meanwhile, proposals under consideration suggest removing textile and apparel products entirely from de minimis, a move that could be an “earthquake” for those fashion companies utilizing the rule heavily.
Trump’s approach and philosophy toward conventional trade agreements and trade preference programs in 2025 also deserve attention. During his first term, Trump launched a few bilateral trade negotiations, from the one with the United Kingdom and Japan to Kenya. Back then, Trump saw a bilateral agreement would give the U.S. more leverage for a better “deal.” Specifically related to apparel sourcing and trade, two flagship U.S. trade preference programs–the African Growth and Opportunity Act (AGOA) and the Haiti HOPE/HELP Act, will expire in September 2025. It remains uncertain whether the new Trump administration will support the early renewal of these two trade preference programs with minimal changes or prefer to renegotiate them and add new bilateral elements.
Additionally, even though the new Trump administration may not prioritize addressing climate change, it is an irreversible trend for fashion companies to allocate more resources to comply with upcoming or newly implemented sustainability and environmental-related legislation, whether from the EU or the US state level. Unlike in the past, when being more sustainable only meant adding operational costs or paying a “one-time fee,” today’s new generation of sustainability-focused regulations—such as Extended Producer Responsibility (EPR)—requires companies to shift their mindset and demonstrate continuous improvement. Interestingly, my recent study tracking apparel products’ sustainability claims shows that vague terms like “sustainable” and “eco-friendly” are gradually being replaced by more neutral, fact-based keywords such as “regenerative,” “textile waste,” and “low impact.”
Meanwhile, offering “sustainable” apparel products and those using “preferred sustainable fibers” could provide fashion companies new opportunities to diversify their sourcing base and expand their vendor networks. For example, studies show that in the U.S. market, China and many other Asian countries are not necessarily the top suppliers of clothing made with recycled materials. Instead, Europe and countries in the Western Hemisphere or even Africa present unique sourcing advantages and capacities due to the unique nature of such products. Therefore, in 2025, we can expect an ever-closer collaboration between design, product development, merchandising, sourcing, and legal teams within fashion companies, working together to meet the growing demand for sustainable apparel and ensure compliance with evolving regulations.
Implemented in June 2022, the Uyghur Forced Labor Prevention Act (UFLPA) prohibits U.S. companies from importing apparel wholly or in part produced in China’s Xinjiang region. UFLPA could significantly alter U.S. apparel import patterns as fashion companies have begun or anticipate adjusting their sourcing base to comply with the law and mitigate the forced labor risks in the supply chain.
This study quantitatively evaluated the impacts of the UFLPA on U.S. apparel imports nearly two years after the law’s implementation. Unlike existing studies primarily focusing on UFLPA’s political or legal aspects, this study’s findings would enhance our understanding of the economic and trade implications of the new law.
A panel regression model was adopted to evaluate the quantitative impact of UFLPA on U.S. apparel imports based on data collected from OTEXA (2024) and USITC (2024), the most authentic government data source. Four countries in three categories were included in the study: 1) China; 2) Vietnam and Bangladesh representing top Asian apparel exporting countries other than China; 3) member countries of the Central America Free Trade Agreement (CAFTA-DR) representing near-shoring sourcing destinations. The annual trade activities of these four countries from 2010 to 2023 (the latest available) were used for the analysis.
The panel regression model suggests several interesting findings*:
Firstly, the results showed that holding other factors constant, U.S. cotton apparel imports from China decreased significantly by approximately 350 million square meter equivalent (SME) annually following UFLPA’s implementation. In other words, the result confirmed that UFLPA had negatively affected U.S. cotton apparel imports from China. This result is far from surprising as Xinjiang accounted for nearly 90% of China’s cotton production, causing significant forced labor risks associated with importing cotton apparel from China.
Secondly, holding other factors constant, U.S. cotton apparel imports from Vietnam and Bangladesh and CAFTA-DR also respectively decreased by approximately 81 million SME, 51 million SME, and 20 million SME annually after UFLPA’s implementation in 2022. The results revealed U.S. fashion companies’ concerns about UFLPA compliance risks associated with sourcing from countries other than China, particularly Asia, due to their heavy reliance on cotton yarns and fabrics from China through a highly integrated regional supply chain.
Thirdly, the results revealed a more significant positive relationship between U.S. cotton exports to China, Vietnam, Bangladesh, and CAFTA-DR countries and U.S. cotton apparel imports from these countries after UFLPA’s implementation. Related, trade data also showed a declining ratio of U.S. cotton apparel imports from China, Vietnam, Bangladesh, and CAFTA-DR countries relative to these countries’ cotton imports from the U.S. This pattern implies a closer alignment in the trade flow of raw cotton from the U.S. to these countries and the return of finished cotton apparel to the U.S. It could be the case that leading apparel exporting countries increasingly used US cotton after UFLPA to mitigate the forced labor risks.
Additionally, there was a negative relationship between U.S. cotton apparel imports from China, Vietnam, Bangladesh, and CAFTA-DR members and U.S. MMF apparel imports from these countries. In other words, cotton apparel and MMF apparel appear to compete within the total U.S. apparel import market. However, UFLPA’s implementation has not significantly impacted the relationship. Nonetheless, MMF apparel has accounted for a growing share of China’s total apparel exports to the United States after UFLPA’s implementation (down from 46% in 2010 to only 19% in 2023).
The study’s findings revealed a broad trade impact of UFLPA’s implementation that goes far beyond China. Notably, cotton apparel exporters from other Asian countries and those in the Western Hemisphere also appeared to be negatively affected by the new law. Also, unlike theoretical prediction, no clear evidence shows that UFLPA has significantly expanded the near-shoring of U.S. cotton apparel imports from the Western Hemisphere, such as CAFTA-DR members.
Meanwhile, the results call for further investigation of the net impact of UFLPA on U.S. cotton exports. While UFLPA may help U.S. cotton gain more shares in the global marketplace, the reduced U.S. import demand for cotton apparel due to forced labor risk concerns may also unexpectedly “shrink the pie size.”
*:The fixed effects (FE) model was selected for the study based on the likelihood ratio test results (p<.01). The result of the F-test suggests the FE model is statistically significant at the 99% confidence level (p<.01). The value of R2 exceeds 0.90, indicating an overall high goodness-of-fit of the panel regression. All the independent variables were statistically significant at the 99% confidence level (p<.01).
By Sheng Lu and Emilie Delaye
Note: The study will be presented at the 2024 International Textile and Apparel Association (ITAA) annual conference in November 2024.
The event was hosted by the Washington International Trade Association on October 9, 2024
Panelists
Ralph Carter, Staff Vice President, Regulatory Affairs, FedEx
Kim Glas, President & CEO, National Council of Textile Organizations; Commissioner, U.S.-China Economic and Security Review Commission
Melissa Irmen, Director of Advocacy, NAFTZ-National Association of Foreign-Trade Zones
John Pickel, Senior Director, International Supply Chain Policy, National Foreign Trade Council
Felicia Pullam, Executive Director, Office of Trade Relations, U.S. Customs and Border Protection
Ana Swanson, Trade and International Economics Reporter, The New York Times (Moderator)
Event summary: Competing views about de minims and its reform
Arguments supporting De Minimis: Proponents like Ralph from FedEx argue that de minimis reduces trade friction, drives international supply chain efficiency, and allows U.S. companies to offer competitive pricing through free returns and streamlined customs processes. Meanwhile, they argue that the de minimis supports low-income U.S. consumers and enables small U.S. businesses to remain competitive.
Criticism of De Minimis: Critics, including Kim Glas from the National Council of Textile Organizations (NCTO), argue that it undercuts U.S. manufacturers, especially in industries like textiles, by allowing cheap imports from countries like China, often bypassing tariffs and safety regulations. They also say that de minimis was unfair to U.S. retailers that pay millions of dollars of tariff duties. Additionally, there are significant concerns about the safety risks posed by counterfeit goods and dangerous products (e.g., fentanyl) entering under de minimis exemptions.
Challenges of dealing with de Minimis: Felicia from the U.S. Customs and Border Protection (CBP) emphasizes the strain on the agency’s resources due to the sheer volume of de minimis shipments—it surged from about 2.8 million shipments per day in fiscal year 2023 to close to 4 million shipments per day in fiscal year 2024. She highlighted challenges such as the often unreliable information the de minimis imports submitted and the outdated authorities that hinder CBP’s enforcement.
Equal treatment for U.S. Foreign Trade Zones: U.S. Foreign Trade Zones (FTZs) are designated areas within the United States that are considered outside U.S. customs territory for import duties. They allow businesses to import, store, assemble, manufacture, or process goods with deferred or reduced customs duties, which are only paid when goods leave the FTZ and enter U.S. commerce. Currently, U.S. FTZs do not benefit from the de minimis exemption, meaning goods imported directly into the U.S. from overseas warehouses can qualify for de minimis, but goods entering through U.S. FTZs do not.
Melissa Irmen from NAFTZ-National Association of Foreign-Trade Zones advocates for U.S. foreign trade zones to be given the same de minimis privileges as foreign warehouses, arguing that this would ensure better oversight and security while maintaining trade efficiency. Critics, however, say that expanding de minimis in this way would exacerbate the problem rather than fix it.
Reforming the De minimis: There is a push for comprehensive reform of the De minimis system, with proposals ranging from raising duties on certain products to eliminating the exemption altogether for specific categories of goods (e.g., textiles, products subject to Section 301 tariffs).
Particularly, in a face sheet released in September 2024, the Biden Administration announced it would address “the significant increased abuse of the de minimis exemption, in particular China-founded e-commerce platforms.” The announcement said the Biden Administration would issue a Notice of Proposed Rulemaking that would exclude from the de minimis exemption all shipments containing products covered by tariffs imposed under Sections 201 or 301 of the Trade Act of 1974, or Section 232 of the Trade Expansion Act of 1962. The announcement also called for Congress to pass new legislation to reform the de minimis rule comprehensively.
Michael Lambert is the Executive Director of Global Trade and Compliance at Urban Outfitters (URBN). He also serves as the Vice Chair of the Board of Directors of the United States Fashion Industry Association (USFIA).
Michael has spent over 30 years in the retail fashion business, primarily in the import/export and Customs compliance area. At URBN, Michael is responsible for Customs, Social, Vendor and Regulatory Compliance. Urban Outfitters has a global footprint, with stores in the U.S., Canada, Europe and the United Kingdom. Urban Outfitters designs and develops products throughout the world, working with a core vendor base across more than thirty countries. Prior to Urban Outfitters, Michael spent nine years with Limited Brands as head of their Import Planning department. He spent his last two years with Limited Brands in London, setting up Compliance activity for Limited Brands as they expanded overseas.
Michael has been a Licensed Customs Broker since 1998 and is a graduate of Pennsylvania State University, with a Bachelor of Arts in International Politics and Foreign Service.
About Emilie Delaye (Moderator)
Emilie Delaye is a 2024 UD entrepreneurship graduate and an incoming UD graduate student in fashion and apparel studies. Emilie is the recipient of the 2024 UD Alumni Association Alexander J. Taylor Sr. Awards for Outstanding Seniors.
Part I: Watch the following two videos on tariffs—one from an economic perspective and the other from a political perspective.
Part II: Check the respective tariff rate for the following products by copying and pasting the HS code into the search box
Product 1 (men’s and boys’ overcoat, cotton): HS code 6101.20.00
Product 2 (cotton): HS code 5201.00.05
Product 3 (smartphone): HS code 8517.13.00
Discussion question: Based on the videos and your findings, how would you explain the differences in tariff rates for these products? Do you think tariffs are still necessary in the 21st century?
Speaker: Dr. Deborah Elms, Founder and Executive Director of the Asian Trade Centre and the President of the Asia Business Trade Association. The clip was part of the webinar “Asia’s Noodle Bowl Of Trade” (March 2023).
Background
The Asia-Pacific region includes several mega free trade agreements:
ASEAN (Association of Southeast Asian Nations) is a regional intergovernmental organization comprising ten countries in Southeast Asia (Brunei, Cambodia, Indonesia, Laos, Malaysia, Myanmar, the Philippines, Singapore, Thailand, and Vietnam). In 2022, ASEAN members have a combined nominal GDP of $3.6 trillion and a population of 671.6 million.
CPTPP (Comprehensive and Progressive Agreement for Trans-Pacific Partnership) is a free trade agreement signed by 11 countries in the Asia-Pacific region, including Japan, Malaysia, Vietnam, Australia, Singapore, Brunei, New Zealand, Canada, Mexico, Peru, and Chile. The CPTPP covers a market of 495 million people with a combined GDP of $13.5 trillion in 2021. The United States was originally a participant in the Trans-Pacific Partnership (TPP) negotiations, but in January 2017, former US President Trump withdrew the US from the agreement. The Biden administration has indicated no interest in rejoining CPTPP. Additionally, China is actively seeking to join CPTPP (as of March 2024).
RCEP (Regional Comprehensive Economic Partnership) is a free trade agreement signed by 15 countries in the Asia-Pacific region, including China, Japan, South Korea, Australia, New Zealand, Brunei, Cambodia, Indonesia, Laos, Malaysia, Myanmar, the Philippines, Singapore, Thailand, Vietnam. In 2021, RCEP members collectively represented a market of 2.3 billion people with a combined GDP of $26.3 trillion. India was an RCEP member but withdrew from the agreement due to concerns about import competition with China.
IPEF (Indo-Pacific Economic Framework for Prosperity) is a US-led economic cooperation framework that aims to “link major economies and emerging ones to tackle 21st-century challenges and promote fair and resilient trade for years to come.” IPEF is NOT a traditional free trade agreement, and it does not address market access issues like tariff cuts. Instead, IPEF includes four pillars: trade, supply chains, clean economy, and fair economy. IPEF members in the Asia-Pacific region include the United States, Japan, Australia, New Zealand, South Korea, India, Fiji, Brunei, Indonesia, Malaysia, the Philippines, Singapore, Thailand, and Vietnam. The IPEF is designed to be flexible, meaning that IPEF partners are not required to join all four pillars. For example, India chooses not to join the trade pillar of the framework. In 2021, IPEF countries collectively represented a market of 2.1 billion people with a combined GDP of $23.3 trillion. The potential economic impact of IPEF remains too early to tell.
Notably, ASEAN, CPTPP, RCEP, and IPEF members play significant roles in the world textile and apparel trade. Specifically:
ASEAN and RCEP members have established a highly integrated regional textile and apparel supply chain. For example, a substantial portion of ASEAN and RECP members’ textile imports came from within the region.
ASEAN and RCEP members’ supply chain connection with China has substantially strengthened over the past decade. In contrast, the US barely participated in Asia-based textile and apparel supply chains. For example, other than CPTPP, the US accounted for less than 2% of ASEAN, RCEP, and IPEF members’ textile imports in 2022.
ASEAN and RCEP members also hold significant market shares in the world textile and apparel exports (over 50%). Meanwhile, the US and EU are indispensable export markets for ASEAN and RCEP members.
Because of the inclusion of the United States, IPEF represented one of the world’s largest apparel import markets (i.e., 33.7% in 2021, measured in value). Similarly, in 2022, about 26% of US apparel imports came from current IPEF members. Should IPEF address market access issues, it could offer significant duty-saving opportunities for textile and apparel products.
Additionally, the UK’s membership in CPTPP may have a limited direct impact on the textile and apparel sector, at least in the short to medium terms. For example, current CPTPP members only accounted for about 6% of the UK’s apparel imports in 2022.
#1 Respondents reported growing sourcing risks of various kinds in 2024, from navigating an uncertain U.S. economy, managing forced labor risks, and responding to shipping and supply chain disruptions to facing rising geopolitical tensions and trade protectionism.
Over half of the respondents ranked “Inflation and economic outlook in the U.S.” and “Managing the forced labor risks in the supply chain” as their top business challenges in 2024.
The issues of “Shipping delays and supply chain disruptions” and “Managing geopolitics and other political instability related to sourcing” have newly emerged among respondents’ top five concerns in 2024.
About 45 percent of respondents rated “Protectionist trade policy agenda in the United States” as a top five business challenge this year, a jump from only 15 percent in 2023.
#2 U.S. fashion companies leverage sourcing diversification to respond to the growing sourcing risks and market uncertainty in 2024.
Nearly 70 percent of large-sized companies with 1,000+ employees reported sourcing from ten or more countries, significantly higher than the 45-55 percent range in the past few years. It also has become more common for medium to small-sized companies with fewer than 1,000 employees to source apparel from six or more countries in 2024 than in the past.
Nearly 80 percent of respondentsplan to source from the same number of countries or even more countries through 2026, aiming to mitigate sourcing risks more effectively. However, their approaches differ at the firm level—some U.S. fashion companies plan to work with fewer vendors, while others intend to source from more.
#3 Managing the risk of forced labor in the supply chain continues to be a top priority for U.S. fashion companies in 2024.
U.S. fashion companies have adopted a comprehensive approach to comply with UFLPA and mitigate forced labor risks. On average, each surveyed company has implemented approximately six distinct practices across various aspects of their business operations this year, up from an average of five in 2023.
More than 90 percent of respondents say they are “Making more efforts to map and understand our supply chain, including the sources of fibers and yarns contained in finished products.” Notably, nearly 90 percent of respondents report mapping their entire apparel supply chains from Tier 1 to Tier 3 in 2024, a significant increase from about 40 percent in the past few years.
More than 80 percent of respondents say they “intentionally reduce sourcing from high-risk countries” in response to the UFLPA’s implementation. Another 75 percent of respondents explicitly state that their company has “banned the use of Chinese cotton in the apparel products” they carry.
About 45 percent of respondents have been actively “exploring sourcing destinations beyond Asia to mitigate forced labor risks.” However, this year, fewer respondents (i.e., under 10 percent) plan to cut apparel sourcing from Asian countries other than China directly, implying a more targeted and balanced approach to mitigating risks and meeting sourcing needs.
Based on field experience, respondents call for greater transparency in U.S. Customs and Border Protection (CBP)’s UFLPA enforcement, specifically in shipment detention and release decisions and in targeted entities and commodities information. Respondents also suggested that CBP reduce repeated detentions, focus on “bad actors” only, clarify enforcement on recycled cotton, and continue to partner with U.S. fashion companies on UFLPA enforcement.
#4 U.S. fashion companies remain deeply concerned about the deteriorating U.S.-China bilateral relationship and plan to further “reduce China exposure” to mitigate risks.
A record 43 percent of respondents sourced less than 10 percent of their apparel products from China this year, compared to only 18 percent in 2018. Likewise, nearly 60 percent of respondents no longer use China as their top apparel supplier in 2024, much higher than the 25-30 percent range before the pandemic.
Respondents rated China as economically competitive as an apparel sourcing base compared to many of its Asian competitors regarding vertical manufacturing capability, relatively low minimum order quantity (MOQ) requirements, flexibility and agility, sourcing costs, and speed to market. However, non-economic factors, particularly the perceived high risks of forced labor and geopolitical tensions, are driving U.S. fashion companies to move sourcing out of China. This trend applies to surveyed U.S. fashion companies selling products in China.
Nearly 80 percent of respondents plan to reduce their apparel sourcing from China further over the next two years through 2026. Consistent with last year’s results, large-size U.S. fashion companies with 1,000+ employees currently sourcing more than 10 percent of their apparel products from China are among the most eager to “de-risk.”
#5 U.S. fashion companies are actively exploring new sourcing opportunities, with a particular focus on emerging destinations in Asia and the Western Hemisphere.
This year, more respondents reported sourcing from India (89 percent utilization rate) than from Bangladesh (86 percent utilization rate) for the first time since we began the survey. Also, nearly 60 percent of respondents plan to expand apparel sourcing from India over the next two years, exceeding the planned expansion from any other Asian country.
For the second year in a row, three non-Asian countries made it to the top ten most utilized apparel sourcing destination list in 2024, including Guatemala (ranked 7th), Mexico (ranked 7th), and Egypt (ranked 10th). All three countries also witnessed an improved utilization rate in 2024 compared to last year’s survey results.
This year, a new record 52 percent of respondents plan to expand apparel sourcing from members of the Dominican Republic-Central American Free Trade Agreement (CAFTA-DR), over the next two years, up from 40 percent in 2023. However, most U.S. fashion companies consider expanding near-shoring from the Western Hemisphere as part of their overall sourcing diversification strategy. For example, nearly ALL companies that plan to increase sourcing from CAFTA-DR over the next two years also plan to increase sourcing from Asia.
75 percent of respondents identified the “lack of sufficient access to textile raw materials” as the main bottleneck preventing them from sourcing more apparel from CAFTA-DR members. Respondents say the local manufacturing capability for yarns and fabrics using fiber types other than cotton and polyester, such as spandex, nylon, viscose, rayon, and wool, was modest or low in the CAFTA-DR region, even when including the United States.
The U.S.-Mexico-Canada Trade Agreement (USMCA) entered into force on July 1, 2020, replacing the North American Free Trade Agreement (NAFTA). Within the context of expanding nearing-shoring from the Western Hemisphere, in 2024, about 65 percent of respondents reported sourcing from Mexico and Canada (or USMCA members), a noticeable increase from about 40 percent in 2019-2020. About 36 percent of respondents say their companies “expanded apparel sourcing from USMCA members because of the agreement.”
#6 Respondents underscore the importance of immediate renewal of AGOA before its expiration in September 2025 and extending the agreement for at least another ten years.
This year, respondents reported sourcing from seven AGOA members or countries in Sub-Saharan Africa (SSA), including Lesotho, Ethiopia (note: lost AGOA eligibility in 2022), Kenya, Madagascar, Mauritius, Tanzania, and Ghana, an increase from four countries in 2023, and six countries in 2022. Most respondents sourcing from AGOA in 2024 are typically large-scale U.S. fashion brands or retailers with 1,000+ employees. Generally, these companies treat AGOA as part of their extensive global sourcing network.
Over 86 percent of respondents support renewing AGOA for at least another ten years, and none object to the proposal. This reveals U.S. fashion companies’ strong support for the trade preference program and the non-controversial nature of continuing this agreement.
Over 70 percent of respondentssay another 10-year renewal of AGOA is essential for their company to expand sourcing from the region.
About 30 percent of respondents reported that they had already held back sourcing from AGOA members due to the pending renewal of the agreement and associated policy uncertainty. This figure could increase to half of the respondents if AGOA is not renewed by the end of 2024.
Another 30 percent of respondents indicate that keeping the flexible rules of origin in AGOA, such as the “third country fabric provision” for least-developed members, is essential for their company to source from the region.
Other topics the report covered include:
5-year outlook for the U.S. fashion industry, including companies’ hiring plan by key positions
The competitiveness of major apparel sourcing destinations in 2024 regarding sourcing cost, speed to market, flexibility & agility, minimum order quantity (MOQ), vertical integration and local textile manufacturing capability, social and environmental compliance risks and geopolitical risks (assessed by respondents)
Respondents’ detailed sourcing portfolio in 2024 for garments and textile materials (i.e., yarns, fabrics and accessories)
Respondents’ latest strategies to mitigate forced labor risks in the supply chain and fashion companies’ suggestions for CBP’s UFLPA enforcement based on field experience
U.S. fashion companies’ latest social responsibility and sustainability practices related to sourcing
U.S. fashion companies’ trade policy priorities in 2024
About the study
This year’s benchmarking study was based on a survey of executives from 30 leading U.S. fashion companies from April to June 2024. The study incorporated a balanced mix of respondents representing various businesses in the U.S. fashion industry. Approximately 80 percent of respondents were self-identified retailers, 60 percent were self-identified brands, 41 percent were importers/wholesalers, and 3 percent were manufacturers.
The survey respondents included large U.S. fashion corporations and medium-sized companies. Around 80 percent of respondents reported having over 1,000 employees; the rest (20 percent) represented medium-sized companies with 100-999 employees.
Question 1: We know that nearly 98% of clothing consumed in the U.S. is imported. Can you give our students a quick overview of U.S. Customs and Border Protection (CBP)’s role in regulating international trade, particularly textiles and apparel products?
CBP’s Office of Trade facilitates legitimate trade, enforces U.S. trade laws, and protects the United States economy to ensure consumer safety and create a level playing field for American businesses.
CBP is responsible for regulating clothing and/or textiles products imported into the United States, ensuring that all trade aspects of the importation are correct at the time of entry. These include, but are not limited to the classification, valuation, country of origin markings, and qualification for preferential duty treatment under a free trade agreement and/or program.
Textiles and wearing apparel are recognized as a Priority Trade Issue as codified in the Trade Facilitation and Trade Enforcement Act (TFTEA) of 2015. As such, this issue is one of the primary drivers for risk-informed investment of CBP resources as well as our enforcement and facilitation efforts. This includes the selection of audit candidates, special enforcement operations, outreach, review of free trade agreements and/or trade preference programs claims, and regulatory initiatives.
Question 2: Ensuring no forced labor in the supply chain is a top priority for U.S. fashion companies. Specifically, the Uyghur Forced Labor Prevention Act (UFLPA) officially came into force in June 2022. For our students who may not be familiar with the UFLPA, what essential information should they know about this legislation and the issue of forced labor? Additionally, could you recommend any helpful online resources?
CBP is the leading federal agency in the enforcement of forced labor laws and the UFLPA. The agency achieves this through two approaches – the first is through forced labor investigations and issuance of Withhold Release Orders (WROs) and Findings, which require CBP to prevent the release of goods made with forced labor into the U.S. commerce. The second is through the implementation of the UFLPA rebuttable presumption.
CBP enforces U.S. law on forced labor within Section 307 of the Tariff Act of 1930, which says any “goods, wares, articles, and merchandise mined, produced, or manufactured wholly or in part in any foreign country” by convict or forced labor is not permitted entry into U.S. commerce.
In 2016, the U.S. Government enacted the Trade Facilitation and Trade Enforcement Act (TFTEA), which removed the “consumptive demand” clause that was in the original statute. This change allowed CBP to set up its own investigative unit, where CBP receives allegations of forced labor, investigates them using the 11 indicators of forced labor, and issues WROs or Findings when applicable. CBP issues a WRO if there is a reasonable suspicion of forced labor conditions by a particular foreign manufacturer, and it issues a Finding if there is probable cause that forced labor conditions exist.
The relatively recent UFLPA establishes a rebuttable presumption that any goods made wholly or in part from the Xinjiang Uyghur Autonomous Region (XUAR) are prohibited from entry into U.S. commerce, as they are presumed to be made with forced labor unless the importer can provide clear and convincing evidence the goods are not made from forced labor or sourced from the XUAR.
When goods are exported directly from the XUAR, CBP applies the rebuttable presumption and excludes the goods from entry. Importers then must prove by clear and convincing evidence that the goods are not made with forced labor before they can be released into U.S. commerce. For goods not imported directly from the XUAR, CBP evaluates the risk that the producer uses inputs from the XUAR in the production of the final product and will stop any shipments it deems as high risk of containing materials produced from the XUAR.
CBP is committed to identifying products made by forced labor and preventing them from entering the United States. CBP’s enforcement of 19 U.S.C. § 1307 supports ethical and humane trade while leveling the playing field for U.S. companies that respect fair labor standards. The UFLPA is a major shift for importers as it requires them to know their entire supply chains from the raw materials all the way to the end product and to ensure no materials made with forced labor are included at any step along the way. Information on all of these topics and many more are available on CBP’s Due Diligence in Supply Chains webpage.
Students can visit our Forced Labor webpage for updated information and resources on CBP’s efforts to prevent goods produced with forced labor from entering U.S. commerce. There is also a specific UFLPA webpage, which explains CBP’s roles and responsibilities and links to the UFLPA Entity List; an UFLPA Statistics Dashboard with information on the number of shipments stopped by CBP by fiscal year, industry, or country of origin; due diligence documents and reports; CBP’s Operational Guidance for Importers, frequently asked questions on UFLPA enforcement and the Department of Homeland Security (DHS) Strategy; and additional links to the DHS Forced Labor Enforcement Task Force Agency Related Resources.
Question 3: Our students are also intrigued by the so-called ‘de minimis rule,’ which has been a topic of heated debate in the news. Why was this rule proposed initially, and how does it relate to the fashion and apparel trade?
De minimis shipments, also referred to as Section 321 low-value shipments, are goods that are exempt from duty and tax under 19 U.S.C. § 1321(a)(2)(C) and 19 C.F.R. § 10.151. De minimis eligibility is based on the value of all goods imported by one person, in one day. The de minimis exemption allows CBP to pass, free of duty and tax, merchandise imported by one person on one day that has an aggregate fair retail value in the country of shipments of $800 or less. This provision was first enacted in 1938 to avoid administrative expense to the government from inspecting low-value goods disproportionate to the amount of revenue realized and was subsequently raised multiple times.
In 2015, CBP processed 139 million de minimis transactions. By 2023, this increased to more than 1 billion, representing a 662% growth in eight years. Now, in Fiscal Year 2024, nearly 4 million de minimis shipments arrive at CBP facilities for targeting, review, and potential physical examination each day. Although these packages are low value, they pose the same potential health, safety, and economic security risks as larger and more traditional containerized shipments.
As long as a good is not subject to duties, taxes or fees (such as anti-dumping/ countervailing duties, excise taxes such as those required for alcohol and tobacco products, or any interagency fees that have not been waived for informal entries), it is eligible for de minimis clearance.
Significant attention is being placed on the de minimis administrative process for new business models, such as those used by e-commerce and fast fashion companies, which leverage the de minimis process for direct-to-consumer shipments.
Question 4: Building on the previous question, in April 2024, the Department of Homeland Security (DHS) announced its new textile enforcement actions. How will CBP contribute to the new enforcement strategy?
CBP is responsible for the management, control, and protection of U.S. borders and ports of entry, acting on the frontline of textiles and trade agreements enforcement. The U.S. textile industry is a vital domestic industrial base for U.S. national security, health care, and economic priorities. U.S. textile production is the foundation of the western hemisphere textile and apparel co-production chain, representing over 500,000 U.S. jobs, 1.5 million western hemisphere jobs, and $39 billion in annual shipments. Members of the textile industry have raised concerns with CBP regarding a decline in business momentum affecting their ability to maintain productivity and jobs.
In response to these concerns, CBP is increasing its efforts to detect, interdict and deter illicit textiles trade and promote a level playing field for the domestic textiles industry given the ever-changing threat landscape and recent proliferation of allegations.
CBP is conducting coordinated and unified intelligence and data-driven operations to target and interdict textile imports that are not compliant with U.S. trade laws. Efforts include, but are not limited to, running special operations, carrying out Textile Production Verification Team visits at foreign factories and raw material providers, examining cargo, conducting compliance reviews and verifications, completing trade audits, and performing laboratory analysis on imported products with a heighted focus on imports that are subject to the U.S.-Mexico-Canada and Dominican Republic – Central America trade agreements, imported under the de minimis provision, and/or potentially in violation of forced labor laws, including the Uyghur Forced Labor Prevention Act.
You can learn more about CBP’s textile enforcement work in a recent CBP Reports video. You can also find information on our website.
Question 5: We know technology is significantly affecting and shifting how international trade is conducted. At CBP, there is an initiative called “21st Century Customs Framework.” Can you provide our students with more information about this program? For example, what is it about, what do you plan to achieve, and why does the program matter for fashion apparel companies?
The 21st Century Customs Framework (21CCF) is CBP’s effort to update its Title 19 authorities and underlying statutes, which have not seen comprehensive updates in more than 30 years.
Since 1993, trade volumes have increased dramatically, trade practices have changed, and new threats have emerged, which means CBP needs new tools and capabilities to do its job.
21CCF matters for fashion apparel companies in two key ways: (1) the framework identifies updates that would better enable CBP to facilitate lawful trade more efficiently, so that goods can get to consumers, warehouses, stores, and other destinations as quickly as possible; and (2) the framework identifies updates that would enable CBP to bolster detection and enforcement against goods that threaten the well-being of American businesses and consumers—counterfeits, goods produced with forced labor, anti-competitively priced goods, and goods that violate environmental or consumer safety laws.
For example, 21CCF includes concepts that would authorize CBP to furnish industry stakeholders with information generated by market platforms regarding compliance with intellectual property rights laws—such as product origin and manufacturer—in importations where intellectual property violations are suspected.
By sharing additional information with the private sector, CBP will be able to utilize its private sector partnerships to more readily identify illicit sellers using online marketplaces to import intellectual property rights-infringing goods into the United States.
Additionally, these proposed updates would better position the private sector to make more informed business decisions and eliminate high-risk actors from their supply chains.
Overall, in pursuing 21CCF, CBP envisions a trading system where legitimate goods move swiftly and securely; ethical production methods are used throughout the global supply chain; domestic industries compete on a level playing field; and the United States helps lead the world with innovative trade practices.
Private sector input has been instrumental throughout the development of the 21CCF statutory concepts, and the framework is now undergoing an interagency review process before eventually being cleared to be formally transmitted to Congress for consideration.
Question 6: As members of Generation Z, our students deeply care about fashion sustainability. Studies also show that fashion companies are increasingly concerned about climate change and its significant business implications. In your view, how can international trade contribute to sustainability and foster a more sustainable fashion industry? How might CBP support and assist in these efforts?
Sustainability in fashion concerns more than just addressing textiles or products. It involves the entire product lifecycle process, which includes the way the clothing is produced, consumed, and disposed of in landfills.
Sustainability in fashion encompasses a wide range of factors, including cutting carbon dioxide emissions, addressing overproduction, reducing pollution and waste, and supporting biodiversity.
CBP has a responsibility, as part of our mission, to keep people safe and protect the economy; that includes supporting the fashion industry. As noted, the fashion, textile, and apparel industries are crucial parts of the U.S. economy. The work CBP does is key in seizing suspect and potentially illegal fashion goods at the border, issuing penalties to bad actors, and protecting the health and safety of the American people.
Due to CBP’s direct influence over trade processes, we see ourselves as a facilitator across the government to start conversations about sustainability and where government can remove barriers or add value to existing environmental efforts in trade.
CBP has developed strategies aimed at promoting environmental sustainability within trade. CBP’s Green Trade Strategy, for instance, is designed to champion the reduction of pollution and waste while encouraging the adoption of green technologies and practices. Such initiatives reflect a broader commitment to advancing circularity, recycling, and reuse in the fashion industry that can enable fashion companies to produce and sell their products more sustainably.
CBP launched the Green Trade Strategy in 2022 to further enable CBP to fight the negative impacts of climate change and environmental degradation in the context of the trade mission.
The strategy focuses on four main pillars:
o Incentivize Green Trade; o Strengthen Environmental Enforcement Posture; o Accelerate Green Innovation; and o Improve Climate Resiliency and Resource Efficiency.
Thousands of CBP employees work toward making international trade more sustainable and transparent. The strategy touches every office and every employee at CBP.
With these four pillars, the strategy provides a framework for future action. Success requires buy-in and collaboration with all our stakeholders, including the fashion industry, and especially you, the future of fashion. We want your help because we cannot do this alone, and you offer unique perspectives that we need in order to fight and mitigate climate change.
Students who are interested in learning more about CBP’s green trade efforts can visit our Green Trade Strategy webpage.
Question 7: Additionally, some of our students are considering a career in international trade. What career opportunities at CBP might be a fit for our undergraduate and graduate students?
There are a number of paths for college students and recent graduates to gain experience and begin to build their careers at CBP, including our recent graduate programs and the Pathways Program.
Some positions that recent graduates can pursue include the following:
Administrative – CBP has administrative roles in various business functions, such as finance, budget, personnel, logistics, and asset management. Position titles include Staff Assistant and Management and Program Analyst.
Law Clerks – This role is for those with recent JDs that expect to pass the Bar Exam within 14 months.
Auditors – This is for students pursuing the auditor career (Interns) or those expecting to complete the required unit of Auditor courses (Auditor, GS-11).
CBP prioritizes facilitating legitimate trade in textiles and wearing apparel and protecting the intellectual property rights of fashion and apparel brands as a part of its trade mission.
CBP employees help protect the wearing and apparel industry from counterfeit merchandise and other unfair or harmful trade practices.
Learn more about career opportunities at CBP on our careers page.
–END–
Disclaimer: This interview is intended exclusively for educational purposes in the FASH455 class and shall not be considered an official policy statement of the U.S. Customs and Border Protection (CBP).
The prospect of Sub-Saharan Africa (SSA) as an apparel-sourcing base for U.S. fashion companies has been a growing heated debate. On the one hand, U.S. fashion companies, driven by increasing geopolitical concerns and other market factors, were eager to diversify apparel sourcing away from Asia. The SSA region was often regarded as one of the most popular alternative sourcing destinations thanks to its large population, relatively low labor costs, and shorter shipping distance to U.S. ports compared to most Asian. The African Growth and Opportunity Act (AGOA), a trade preference program enacted in 2000, in particular, allowed eligible apparel exports from SSA countries to enter the United States import duty-free, creating substantial financial incentives for U.S. fashion companies to source from the SSA region.
However, empirical trade data shows that U.S. apparel imports from SSA members have stagnated over the past decades without evident growth. Notably, with little change from 2010, SSA countries collectively accounted for only 1.8% of U.S. apparel imports in 2023, with no single SSA member achieving a market share of more than 1%. In contrast, over the same period, despite China’s declining market shares, the following five largest Asian suppliers—Vietnam, Bangladesh, India, Indonesia, and Cambodia—jointly accounted for 43.0% of U.S. apparel imports in 2023, a notable increase from 27.4% in 2010.
This study aims to evaluate SSA countries’ capacity to serve as an alternative apparel sourcing destination to Asian suppliers for US fashion companies. Specifically, the study examined the detailed product information of a total of 10,000 stock keeping units (SKUs) of clothing items sold in the U.S. retail market from January 2021 to December 2023. Half of these items were sourced from the six largest apparel-exporting countries in SSA: Lesotho, Kenya, Mauritius, Ethiopia, Madagascar, and Tanzania. Together, these countries accounted for over 96% of the value of U.S. apparel imports from the SSA region between 2021 and 2023. The remaining half came from China, Vietnam, Bangladesh, Cambodia, India, and Indonesia, the six largest Asian apparel exporters, which stably accounted for approximately 90% of U.S. apparel imports from Asia over the past decade.
Key findings:
First, the results revealed that U.S. fashion companies’ sourcing strategies for SSA countries appeared more subtle and complicated than simply treating the region as another low-cost sourcing destination, as suggested by previous studies. Instead, according to the results, U.S. fashion companies seemed to leverage SSA countries as suppliers of “niche products,” such as those relatively simple and basic apparel categories containing African cultural elements and targeting the luxury and premium market segment. Meanwhile, the demand for such products could be much smaller than regular apparel items sold in the value and mass market. This allows SSA countries to fulfill these smaller orders despite their limited production capacity, often family-owned or involving handmade processes.
Second, the study’s findings identified significant challenges for SSA countries serving as immediate alternatives to sourcing from Asia for U.S. fashion companies. While SSA countries could offer relatively low sourcing costs, the range of apparel products available for U.S. fashion companies to source from the SSA region remained significantly more limited than those from Asia. For example, results show that U.S. fashion companies preferred sourcing relatively basic and technologically simple categories like knitwear, T-shirts, and bottoms from SSA countries. However, imports from SSA countries offered more limited sizing and color choices and were less likely to include womenswear and relatively more sophisticated or specialized product categories such as outerwear and swimwear. As another example, U.S. apparel imports from SSA countries were primarily made of cotton and polyester, with less use of other fiber types, including nylon, rayon, viscose, wool, and those made from recycled textile materials (see table below).
Third, building on the previous point, the results call for new thinking on strengthening SSA countries’ genuine competitiveness as an apparel-sourcing destination. Over the past decades, trade preference programs such as AGOA have mainly focused on improving the price competitivenessof SSA countries’ apparel exports. However, as this study’s findings illustrate, AGOA and other trade preference programs seemed inadequate in assisting SSA countries in developing capacity beyond basic apparel categories and securing a sufficient variety of textile materials. As U.S. fashion companies have placed greater emphasis on factors beyond price in their sourcing decisions, such as flexibility, agility, sustainability, and vendors’ capability to make a wide variety of products, this could put SSA countries at even more significant disadvantages down the road to being considered alternatives to Asia for apparel sourcing.
The results also reminded us that AGOA’s liberal rules of origin, which allowed least-developed SSA countries to use textile materials from anywhere worldwide, cannot replace the crucial need to develop the local textile manufacturing capacity within the SSA region. Without a robust local textile manufacturing sector, SSA countries would encounter significant challenges in diversifying their product offerings to include more complex and versatile clothing categories, such as outerwear and women’s dresses. These categories typically require a wide variety of raw textile materials and accessories, making it highly impractical and inefficient to rely solely on imports for their supply.
On the other hand, the findings reveal the necessity of creating a stable and foreseeable business environment, such as the long-term renewal of AGOA, to attract more long-term investments in SSA. For example, investing in and strengthening SSA countries’ local supply of sustainable textile materials, such as recycled or organic fibers, could strategically enhance SSA countries’ competitiveness in meeting the increasing demand from U.S. fashion companies for sustainable apparel products.
The new punitive tariffs on Chinese steel and aluminum: The overcapacity problem in the steel industry globally could raise national security concerns. While the Biden Administration is more focused on outreach to allies and partners to address the issue collectively, the Trump Administration took a different approach with the Section 232 tariffs specifically targeting China. However, the impact of China-targeted measures could be muted due to the limited amount of US steel imported from China today. The next administration is expected to face the challenge of addressing global overcapacity in various industries. Like it or not, tariffs seem to be one of the few tools available to the US government to tackle these issues directly.
Currency debate: “Currency manipulation” refers to the deliberate actions taken by a country’s government or central bank to artificially influence the value of its currency in the foreign exchange market. When a foreign government deliberately lowers the value of its currency, it could result in more US imports from that country and hurt the price competitiveness of US exports. While currency manipulation has not been a significant concern in recent years, the recent strength of the US dollar against other currencies, such as the Japanese yen, Chinese yuan, and Vietnamese dong, may reignite debate over the issue. The Biden Administration struggles to fight high inflation using high-interest rates, making it extremely challenging to “devalue the US dollar” in a macro sense. In comparison, the second Trump administration could designate countries of concern as currency manipulators, followed by new retaliatory measures, including tariffs or other trade barriers.
Industrial policy and subsidy: The Biden administration has packaged industrial policy as a core pillar of “Bidenomics,” which has pledged more than $805 billion in new subsidies for semiconductor manufacturing and research, climate and energy investments, and infrastructure spending. In comparison, the Republicans would be more inclined to let market forces determine the outcome of these policies rather than funding them through the government. It is also likely that the second Trump administration will tighten certain rules related to foreign entities taking advantage of US tax credits. However, there could be coordinated investments and supply chain resilience efforts in Biden and Trump’s second term, such as tactical coordination to prevent global subsidy races and disruptions in supply chains.
Trade policy as a tool for other issues: Reviving the Trans-Pacific Partnership (TPP) or similar mid-2010s era trade agreements was slim during the Biden administration. Instead, the Biden administration prioritizes a climate and trade agenda, as evidenced by the launch of a new White House Climate and Trade Task Force. Biden administration will continue to prioritize investments in domestic production capacity while looking outward to use trade to support other non-trade objectives.
In comparison, the Trump administration was more aggressive in pushing back against protectionist trade measures against US products but also less optimistic about the willingness of other countries to engage in good-faith negotiations with the US. Further, Trump 2.0 will likely return to trade policies similar to his first term, including potential tariffs of up to 60% on Chinese imports and an across-the-board tariff of 10% on all imports. Further, there is bipartisan support for increasing tariffs on Chinese goods, considering the deteriorating bilateral relationship. However, a 10% global tariff on imports from countries like Switzerland and Ireland could be more controversial due to potential consumer price impacts and damage to US alliances.
Discussion questions:
Any of the aforementioned issues could potentially impact fashion apparel companies? Why?
In your view, is it preferable for the textile and apparel industry not to be a focus of US trade policy? Why?
What are your top 1-2 takeaways from the panel discussion?
#1: On April 5, 2024, the US Department of Homeland Security (DHS) released its new enhanced strategy to combat illicit trade and level the playing field for the American textile industry and the estimated over 500,000 US textile jobs*. *note: according to the Bureau of Labor Statistics, as of December 2023, the US textile and apparel manufacturing sector employed about 272,400 workers (seasonally adjusted), including 89.3K in NACIS313 textile mills, 95.6K in NAICS314 textile product mills and 87.5K in NAICS315 apparel manufacturing. As of December 2023, NAICS 4482 apparel retail stores employed about 850,000 workers (seasonally adjusted).
According to DHS, the new enforcement plan will focus on the following areas:
Cracking down on small package shipments to prohibit illicit goods from U.S. markets by improving screening of packages claiming the Section 321 de minimis exemption for textile, Uyghur Forced Labor Prevention Act (UFLPA), and other violations, including expanded targeting, laboratory and isotopic testing, and focused enforcement operations.
Conducting joint Customs and Border Protection (CBP)-Homeland Security Investigation (HIS)HSI trade special operations to ensure cargo compliance. This includes physical inspections; country-of-origin, isotopic, and composition testing; and in-depth reviews of documentation. CBP will issue civil penalties for violations of U.S. laws and coordinate with HSI to develop and conduct criminal investigations when warranted.
Better assessing risk by expanding customs audits and increasing foreign verifications. DHS personnel will conduct comprehensive audits and textile production verification team visits to high-risk foreign facilities to ensure that textiles qualify under the U.S.-Mexico-Canada Agreement (USMCA) or the Central America-Dominican Republic Free Trade Agreement (CAFTA-DR). (note: As CBP noted, most US free trade agreements and trade preference programs have complex textiles and apparel-specific rules of origin requirements. CBP is “responsible for ensuring that the trade community complies with all statutory, regulatory, policy, and procedural requirements that pertain to importations under free trade agreements and other trade preference programs.”)
Building stakeholder awareness by engaging in an education campaign to ensure that importers and suppliers in the CAFTA-DR and USMCA region understand compliance requirements and are aware of CBP’s enforcement efforts.
Leveraging U.S. and Central American industry partnerships to improve facilitation for legitimate trade. (note: The Biden Administration aims to leverage textile and apparel trade as part of the solution to address “root causes of migration in Central America. According to the White House Fact Sheet released in March 2024, the Office of the U.S. Trade Representative and Central American Trade Agencies and textiles and apparel industry stakeholders will work together to build a directory with detailed profiles of manufacturing and sourcing companies in the region, including information on business practices and production capabilities, to facilitate transparent sourcing, and bolster the region’s supply chain.)
Expanding the Uyghur Forced Labor Prevention Act (UFLPA) Entity List to identify malign suppliers for the trade community through review of additional entities in the high-priority textile sector for inclusion in the UFLPA Entity List. (note: Once an entity is on this list, in general, it is prohibited from exporting its goods to the United States. Importers are required to ensure the supply chains of their imported products are free from entities on the Entity List).
#2: Several US textile and apparel industry stakeholders have publicly responded to DHS’s new strategy.:
“We strongly commend DHS for the release of a robust textile and apparel enforcement plan today. We also greatly appreciate Secretary Mayorkas’ personal engagement in this urgent effort and believe it’s a strong step forward to addressing pervasive customs fraud that is harming the U.S. textile industry.”
“The essential and vital domestic textile supply chain has lost 14 plants in recent months. The industry is facing severe economic harm due to a combination of factors, exacerbated by customs fraud and predatory trade practices by China and other countries, which has resulted in these devastating layoffs and plant closures. DHS immediately understood the economic harms facing the industry and deployed the development of a critical action plan.”
“The industry requests include
Ramped up textile and apparel enforcement with regard to Western Hemisphere trade partner countries, including onsite visits and other targeted verification measures to enforce rules of origin as well as to address any backdoor Uyghur Forced Labor Prevention Act (UFLPA) violations.
Increased UFLPA enforcement to prevent textile and apparel goods made with forced labor from entering our market, including in the de minimis environment.
Immediate expansion of the UFLPA Entity List, isotopic testing, and other targeting tools. Intensified scrutiny of Section 321 de minimis imports and a review of all existing Executive Branch authorities under current law to institute basic reforms to this outdated tariff waiver mechanism. “
“We appreciate the Department of Homeland Security (DHS)’s announcement today outlining enhanced enforcement activities to prevent illicit trade in textiles. Our members support 55 million (more than one in four) American jobs and invest considerable time and resources in their customs compliance programs. Many of our members are Tier 3 participants in Customs-Trade Partnership Against Terrorism (C-TPAT). They are trusted traders and meet the high standards required to receive that designation by U.S. Customs and Border Protection and DHS. Our members are on the front lines for ensuring that they have safe and secure supply chains.
“While DHS launches this enforcement plan, we urge it to partner with our associations and our associations’ members. A successful enforcement plan must include input from all stakeholders, clear communication with the trade, and coordinated activities with importers, especially if DHS finds illicit activity happening in the supply chain. The results of any illicit activities must be shared so that our members and other importers can act quickly to address the issue. As our members look to diversify their supply chains, especially back to the Western Hemisphere, we must make sure efforts are included to incentivize and not deter new investments.”
#3 Comments: Overall, the new DHS textile enforcement plan suggests several key US textile and apparel trade policy directions: 1) revisit the current de minimis rules that are used by many e-commerce businesses; 2) further strengthen the UFLPA and forced labor enforcement; 3) expand the Western hemisphere textile and apparel supply chain and encourage more US apparel sourcing from CAFTA-DR members; 4) scrutinize US apparel imports from China and imports from other Asian countries that heavily use textile raw material from China.
Discussion questions for FASH455 (please answer them all):
How do the perspectives of the US textile industry and US fashion brands and retailers diverge concerning CBP’s new strategy? What are the areas in which they share common ground?
Building on the previous question, how can the difference between the US textile industry and US fashion brands and retailers be explained regarding their response to DHS’s new enforcement strategy?
As a sourcing manager for a major US apparel brand with global operations, how do you plan to adjust your company’s sourcing practices in light of DHS’s new strategy? You can list 1-2 detailed action plans and provide your analysis.
Background
The U.S. Customs and Border Protection (CBP) is an agency within the Department of Homeland Security (DHS), responsible for “regulating and facilitating international trade, collecting import duties, enforcing U.S. trade laws, and protecting the nation’s borders.”
Homeland Security Investigations (HSI) is also a division within the Department of Homeland Security (DHS), responsible for “investigating transnational crime and threats, specifically those criminal organizations that exploit the global infrastructure through which international trade, travel and finance move.”
Speaker: Katherine Tai (U.S. Trade Representative, Office of the U.S. Trade Representative)
Presider: Michael Froman (President, Council on Foreign Relations; Former U.S. Trade Representative, 2013-17)
Excerpt from the conversation
Worker-Centric US trade policy
Question from FROMAN: “Back in the old days, there was a notion that since the U.S. market is relatively open—we don’t have that much protection here, the average applied tariff is about 3 ½ percent—that if we were able to reduce barriers to other countries disproportionately we could export more made by U.S. workers, and that export-related jobs paid more than non-export related jobs, and that we could use access to our market as a way of getting other countries to reform their labor practices and raise their standards, which would create a more level playing field. That theory is sort of out of vogue at the moment. But, tell me, can you envisage what an agreement that is worker-centric looks like that reduces barriers or increases trade?”
Response from TAI: “The percentage of (U.S.) exports to GDP is around 10 percent—maybe 11 or 12 percent. So it’s not very high. Some of our—some of our trading partners have very, very high exports as a proportion of GDP (e.g., 25 percent)…So you just have to put that (trade liberalization) into context. I think you also have to think about the fact of the balance of exports and imports…”
“We’re trying to create and maintain jobs, and good jobs, at home… so then the question becomes not what do I have to pay you to do X, Y, or Z, but how can we put the forces of our cooperation together? What does the deal look like where we are building our middle classes together? And I think that the worker pieces then come in, along with the environment pieces, as something that I shouldn’t have to pay you to do, but as something that you should want to do…”
“Traditionally we’ve kept our scorecard by, you know, how many trade agreements you finished and how many you’ve gotten across the finish line… Our progress lies very much in how the conversation has fundamentally shifted. That the conversation now is very much focused on supply chain resilience, on equity, and how not to leave those within our economies behind further, how not to leave those developing countries behind further.”
Digital trade
Question from FROMAN: “For a long time, the U.S. had a position around the free flow of data across borders, not taxing digital products across borders… given the fact that the U.S. economy is probably—certainly the leader in all things digital, what does it mean for us to move away from defending these principles that have been so core to what we’ve tried to do before?”
Response from TAI: “So in early 2000s that we’re negotiating (digital trade)… It’s called the e-commerce chapter. And it’s the e-commerce chapter in several iterations of FTAs (free trade agreements)…And I think that that makes sense if you think about what the digital economy looked like in the early 2000s. It really was about e-commerce…At the time—thought about e-commerce digital trade provisions as largely facilitative provisions. The flow of data was there, and we wanted to safeguard the flow of data to facilitate traditional trade transactions, the movement of goods across borders, the analogy to services we used also in digital.”
“In 2024, one of the things that you realize is that the flow of data, the decisions around where data needs to be stored, how it needs to be handled, has—on much, much different dimensions because over this period of time, in fact, in the digital economy the data is no longer just about facilitating traditional types of transactions. The data has become the commodity in and of itself. The data is now what has value. The ability to accumulate that data and for vast amounts of data then to be combined with computing power to create things like generative AI and large language models, it starts to give you a sense, just as a normal trade negotiator, that there are much, much bigger equities at stake in what we might be doing in our trade negotiations…It’s not just about facilitating trade, but around how we regulate data and how we regulate the companies that accumulate, harvest, and trade in this data is something that we need to resolve and advance before we can thoughtfully and responsibly engage in trade negotiations to figure out what the limits are in terms of what we should be doing, and what the goals are for what we should be doing with our trading partners… what underlies the digital economy and our digital existences, and just thinking about what the rules should be for how that data is handled, who has rights to that data, and then the international components around trade and prosperity but also trade and national security.”
Tradeoffs in trade policy
Question from FROMAN: “Trade is a great area to talk about tradeoffs. We hate being overly dependent on China for basic goods. We also hate inflation and higher cost of living. The actions taken to deal with the first one will likely exacerbate the second one… How do you talk about that tradeoff with communities around the country? And do you make explicit that, yes, you’re going to pay more at Walmart for this for that, but we’re going to become less dependent on China as a result?”
Response from TAI: “That today, we know that we have critical dependencies and vulnerabilities that are actually bad from a national security and just a geopolitical standpoint. For every sector where we feel that we are critically vulnerable to another country and, say, China in particular, I think that it creates a sense of angst and insecurity that is destabilizing for the world economy and, frankly, for the world… if you look at it from a more holistic, medium-term perspective, supply chain diversity and supply chain resilience is actually a management tool for inflation… “
“For as long as there are concentrated pockets for production and supply—and this is internationally, but this is also the logic behind taking on dominant players in our economy—for as long as you have that kind of dominance, you’re going to have in the hands of certain players the ability to distort the market and to take advantage of that dominance by jacking up prices, whether it’s shrinkflation, or greedflation, or in the international context economic coercion… if you think about the tradeoff as between today and tomorrow, it’s not zero-sum at all. And in fact, these changes are ones that we need to be able to manage, not being faced with the same risks over and over and over again.”
US trading partners
Comment from TAI: “when you talk about some evolution in our (trade policy) approach, I just want to be clear, the evolution in our approach is about what should be in those things, what should be in those agreements, what should be in the exercises and the cooperation that we undertake with our partners. This is not a walking away from those partners, at all…You’ll see how much time I spend in Brussels, how much time I’ve spent in Asia, and the Indo-Pacific over the course of the last three years. And you’ll see that the prioritization of our like-minded partners, our traditional partners if you will, is still very much there.”
Tariffs
Comment from TAI: “What is really important to appreciate about tariffs is that they’re a tool. They’re a tool that can be used in constructive ways… They’re a tool, at least for us, in trade remedies… They are a tool for remedying unfair trade. I actually kind of like the way the Europeans describe these types of tools—dumping, countervail. They call them trade defense instruments.”
“What I also want to reflect is that trade policy and economic policy isn’t just tariffs… we have kept a lot of the tariffs, because we see strategic value in those tariffs in this exercise of building up the middle class and reinvigorating American manufacturing and the American economy… it needs to take the tariffs as a tool, the investments as another tool to help reinforce, policies that support and empower all workers, and to encourage our partners to be supporting and empowering their workers, and then also promoting economic vitality, opportunity through the enforcement of our competition laws…”
Textile industry strategic or not?
Comment from TAI: “You know, there are things that are more strategic, things that maybe we feel like are less strategic or not strategic. But, you know, I think that is actually a really, really important question. And it’s a hard one—what’s strategic and what isn’t? We clearly did not think that surgical masks—surgical, you know, medical-grade gloves and ventilators were that strategic. And so we let that go wherever it was going to go. And in the early days of the pandemic, boy, did that hurt us a lot. So, you know, one of the—one of the stories that came out of the pandemic was all of our—all of our textile manufacturers, you know, were told your industry is not that strategic. They’d been told it for a long time. And yet, we know that it is important. It’s politically important. And USTR has for a very long time had a textiles office and textiles negotiator…it was that textiles industry, what we still have, that was able to repurpose their capabilities and to step up, and to actually start producing some of these things that we were really deficient in during the pandemic, and to save us. So I think that where you draw the lines on strategic and nonstrategic… It’s not necessarily obvious.”
Video discussion questions [For students in FASH455, please address at least two of the following questions in your response]
#1: Tai emphasizes the importance of creating and maintaining good jobs at home and building middle classes together with trading partners. How can the textile and apparel trade contribute to the goal?
#2: Reflecting on the textile industry’s response during the pandemic, Tai raises questions about what industries are considered strategic and the implications of such categorizations. How should policymakers determine which industries are strategic, and what criteria should be used in making these decisions?
#3: How has the role of data evolved in trade discussions, and what are the potential challenges in regulating data in international trade agreements? What are the implications of digital trade governance on today’s fashion business?
#4: Tai discusses the strategic importance of supply chain diversity and resilience. How might diversifying supply chains contribute to national security and economic stability, and what are the challenges in achieving this diversification? Please use the textile and apparel sector as an example.
#5: Any other reflections, thoughts, or feedback on the conversation?
First, affected by the macro economy, US apparel import volume in 2023 suffered the most significant decline since the pandemic. Specifically, US apparel imports decreased by 22% in quantity and value in 2023 compared to 2022, with none of the top ten suppliers experiencing positive growth.
Nevertheless, after several months of straight decline, US apparel imports finally bounced back in December 2023. Thanks to the holiday season and a gradual improvement of the US economy, seasonally adjusted US apparel imports in December 2023 were about 4.5% higher in quantity and 4.2% higher in value than the previous month. Highly consistent with trends, the US Consumer Confidence Index (CCI) increased from 67.2 in November to 76.4 in December (January 2019=100), suggesting US households turned more confident about their financial outlook and willing to spend. That being said, the latest January 2024 International Monetary Fund (IMF) forecasts still predicted the US GDP growth would slow down from 2.5% in 2023 to 2.1% in 2024. Thus, whether the US apparel import volume could continue to maintain growth after the holiday season remains a big question mark.
Second, while the pace of sourcing cost increases has slowed, the costs and financial pressure facing US fashion companies are far from over. Specifically, as of December 2023, the price index of US apparel imports stood at 106 (January 2019=100), almost no change from January 2023. However, two emerging trends are worth watching. One is the declining US apparel retail price index since August 2023, which means US fashion companies may have to sacrifice their profits to attract consumers to the store. The second trend is the surging shipping costs as a result of the recent Red Sea shipping crisis, which were not reflected in the December price data. According to J.P. Morgan, during the week of January 25, 2024, the container shipping rates from China to the US West Coast and East Coast saw a significant spike of around 140% and 120% from November 2023, respectively. Even worse, there is no sign that the Red Sea crisis will soon be solved. Therefore, 2024 could pose another year of financial challenges for many US fashion companies.
Third, diversification remained a pivotal trend in US fashion companies’ sourcing strategy in 2023. For example, the Herfindahl–Hirschman index (HHI), a commonly used measurement of market concentration, went down from 0.105 in 2022 to 0.101 in 2022, suggesting that US apparel imports came from even more diverse sources.
Notably, measured in value, only 71.6% of US apparel imports came from Asia in 2023, the lowest in five years. Highly consistent with the US Fashion Industry Association’s Benchmarking Survey results, OTEXA’s data reflected companies’ intention to diversify their sourcing away from Asia due to increasing geopolitical concerns, particularly the rising US-China strategic competition.
However, it should be noted that Asia’s reduced market share did not benefit “near-shoring” from the Western hemisphere much. For example, in 2023, approximately 14.6% of US apparel imports originated from USMCA and CAFTA-DR members, nearly the same as the 14.3% recorded in 2022. Instead, US apparel imports outside Asia and the Western Hemisphere jumped to 11.4% in 2023 from 9.8% a year ago. Some emerging EU and African suppliers, such as Turkey, Romania, Morocco, and Tunisia, performed relatively well in the US market in 2023, although their market shares remained small. We could highly expect the sourcing diversification strategy to continue in 2024 as many companies regard the strategy as the most effective to mitigate various market uncertainties and sourcing risks.
Fourth, US fashion companies continued reducing their China exposure as much as possible, but China will remain a key player in the game. On the one hand, about 20.0% of US apparel imports in value and 25.9% in quantity came from China in 2023, both hit a new low in the past decade. Recent studies also show that it became increasingly common for China to no longer be the largest source of apparel imports for many US fashion companies.
However, China remains highly competitive in terms of the variety of products it offers. For example, the export product diversification index, calculated based on trade data at the 6-digit HTS code level (Chapters 61 and 62), shows that few other countries can match China’s product variety. Likewise, product level data collected from industry sources indicates that China offered far more clothing styles (measured in Stock Keeping Units, SKUs) than its competitors in 2023. According to the results, rather than identifying 1-2 specific “next China,” US fashion companies appeared to leverage “category killers”—for example, utilizing Vietnam as a sourcing base for outerwear, underwear, and swimwear; India for dresses, and Bangladesh for large-volume basic knitwear items.
Related to this, another recent study found that the top five largest Asian suppliers next to China, including Vietnam, Bangladesh, Indonesia, India, and Cambodia, collectively can offer diverse product categories almost comparable to those from China in the US market.
Fifth, trade data reveals early signs that US fashion companies are gradually reducing sourcing cotton apparel products from Asia because of the implementation of the Uyghur Forced Labor Prevention Act (UFLPA). Notably, when concerns about cotton made by Xinjiang forced labor initially emerged in 2018, US fashion companies quickly shifted sourcing orders for cotton apparel (OTEXA code 31) from China to other Asian countries. However, UFLPA’s enforcement increasingly targets imports from Asian countries other than China due to the highly integrated regional textile and apparel supply chain and Asian countries’ heavy reliance on textile inputs from China. Consequently, Asia (excluding China) accounted for a declining share in the total imports of US cotton apparel in 2023.
Meanwhile, affected by UFLPA’s enforcement, only 11.8% of US cotton apparel imports came from China in 2023, marking a further decline from 13% in 2022 and reaching a new low for the past decade. China also deliberately decreased the percentage of cotton apparel in its total apparel exports to the US market, dropping from nearly 40% in 2017 to only 25% in 2023. In comparison, cotton apparel consistently represented about 45% of total US apparel imports during the same period.
Additionally, while there was no substantial increase in the volume of US apparel imports from CAFTA-DR members, as a silver lining, the utilization of the trade agreement improved. In 2023, about 19.2% of US apparel imports claimed duty-free benefits under US free trade agreements and trade preference programs, a notable increase from 17.7% in 2022. Most such imports came under CAFTA-DR (45.4%) and USMCA (19.7%).
Meanwhile, in the first 12 months of 2023 (latest OTEXA data), about 70.2% of US apparel imports came from CAFTA-DR members claimed the duty-free benefit, up from 66.6% the same period a year ago. Particularly, 65.4% of US apparel imports under CAFTA-DR complied with the yarn-forward rules of origin in 2023, a notable increase from 61.3% in 2022. Another 2.6% of imports utilized the agreement’s short supply mechanism, which also went up from 2.3% in 2022. The results could reflect an ever more integrated regional textile and apparel supply chain among CAFTA-DR members due to increasing investments made in the region in recent years. However, there is still much that needs to be done to effectively increase the volume of US apparel imports from the region.
Textiles and apparel “Made in the USA” have gained growing attention in recent years amid the increasing supply chain disruptions during the pandemic, the rising geopolitical tensions worldwide, and consumers’ increasing interest in sustainable apparel and faster speed to market. Statistics from the U.S. Bureau of Economic Analysis showed that U.S. textile and apparel production totaled nearly $28 billion in 2022, a record high in the most recent five years. Meanwhile, unlike in the old days, a growing proportion of textiles and apparel “Made in the USA” are sold overseas today. For example, according to the Office of Textiles and Apparel (OTEXA) under the U.S. Department of Commerce, U.S. textiles and apparel exports exceeded $24.8 billion in 2022, up nearly 12% from ten years ago.
By leveraging U.S. Department of Commerce Office of Textiles and Apparel (OTEXA)’s “Made in U.S.A. Sourcing & Products Directory,” this study explored U.S. textiles and apparel manufacturers’ detailed production and export practices. Altogether, 432 manufacturers included in the directory as of October 1, 2023, were analyzed. These manufacturers explicitly mentioned making one of the following products: fiber, yarn, fabric, garment, home textiles, and technical textiles.
Key findings:
First, U.S. textile manufacturers exhibit a notable geographic concentration, whereas apparel manufacturers are dispersed throughout the country. Meanwhile, by the number of textile and apparel manufacturers, California and North Carolina are the only two states that rank in the top five across all product categories, showcasing the most comprehensive textile and apparel supply chain there.
Second, U.S. textile and apparel manufacturers have a high concentration of small and medium-sized enterprises (SMEs). Highly consistent with the macro statistics, few textile and apparel manufacturers in the OTEXA database reported having more than 500 employees. Particularly, over 74% of apparel and nearly 60% of home textile manufacturers are “micro-factories” with less than 50 employees.
Third, U.S. textile and apparel manufacturers have limited vertical manufacturing capability. A vertically integrated manufacturer generally makes products covering various production stages, from raw materials to finished products. Results show that only one-third of U.S. textile and apparel manufacturers in OTEXA’s database reported making more than one product type (e.g., yarn or fabric). Meanwhile, specific types of vertically integrated production models are relatively popular among U.S. textile and apparel manufacturers, such as:
Apparel + home textiles (5.8%)
Fabric + technical textiles (5.1%)
Yarn + fabric (3.9%)
However, the lack of fabric mills (N=38 out of 432) appears to be a critical bottleneck preventing the building of a more vertically integrated U.S. textile and apparel supply chain.
Fourth, it is not uncommon for U.S. textile and apparel manufacturers to use imported components. Specifically, among the manufacturers in the OTEXA database, nearly 20% of apparel and fabric mills explicitly say they utilized imported components. In comparison, given the product nature, fiber and yarn manufacturers had a lower percentage using imported components (11%). Furthermore, smaller U.S. textile and apparel manufacturers appear to be more likely to use imported components. For example, whereas 20% of manufacturers with less than 50 employees used imported input, only 10.2% of those with 50-499 employees and 7.7% with 500 or more employees did so. The results indicate the necessity of supporting SME U.S. textile and apparel manufacturers to access textile input through mechanisms such as the Miscellaneous Tariff Bill (MTB).
Fifth, many US textile and apparel manufacturers have already explored overseas markets. Specifically, factories making textile products reported a higher percentage of engagement in exports, including fiber and yarn manufacturers (68.4%), fabric mills (78.9%), and technical textiles producers (69.1%). In comparison, relatively fewer U.S. apparel and home textile producers reported selling overseas.
Sixth, U.S. textile and apparel manufacturers’ export markets are relatively concentrated. Specifically, as many as 72% of apparel mills and 57% of home textiles manufacturers in the OTEXA database reported selling their products in less than two markets. These manufacturers also have a high percentage of selling to the U.S. domestic market. Likewise, because of the reliance on the Western Hemisphere supply chain, more than half of U.S. fiber and yarn manufacturers reported only selling in two markets or less. In comparison, reflecting the global demand for their products, U.S. technical textile manufacturers had the most diverse markets, with nearly 40% exporting to more than ten countries.
Seventh, while the Western Hemisphere remains the top export market, many U.S. textile and apparel manufacturers also export to Asia, Europe, and the rest of the world. For example, nearly half of U.S. textile and apparel manufacturers in OTEXA’s database reported exporting to Asia, and over 60% of U.S. technical textile manufacturers sold their products to European customers.
Additionally, over half of U.S. textile and apparel mills engaged in exports leveraged U.S. free trade agreements (FTAs). U.S. textile mills, on average, reported a higher percentage of using FTAs than apparel and home textile manufacturers. As most U.S.-led FTAs adopt the yarn-forward rules of origin, the results suggest that while such a rule may favor the export of U.S. textile products, its effectiveness and relevance in supporting U.S. apparel exports could be revisited.
Moreover, in line with the macro trade statistics, U.S. textile and apparel manufacturers in the OTEXA database reported a relatively high usage of USMCA, given Mexico and Canada being the two most important export markets. In comparison, U.S. textile and apparel manufacturers’ use of CAFTA-DR was notably lower, even for fiber and yarn manufacturers (37%) and fabric mills (33.3%).
by Kendall Ludwig, Miranda Rack and Sheng Lu
Picture above: On December 13, 2023, Kendall Ludwig and Miranda Rack, FASH 4+1 graduate students and Dr. Sheng Lu, had the unique opportunity to present the study’s findings to senior U.S. trade officials from OTEXA and the Office of the U.S. Trade Representative (USTR) in Washington DC, including Jennifer Knight (Deputy Assistant Secretary for Textiles, Consumer Goods and Materials), Laurie-Ann Agama (Acting Assistant US Trade Representative for Textiles), Maria D’Andrea-Yothers (Director of OTEXA), Natalie Hanson (Deputy Assistant US Trade Representative for Textiles) and Richard Stetson (Deputy Director of OTEXA).
Check the Udaily article that features the research project and the presentation (February 2024).