
Updated data in 2019 is now available: WTO Reports World Textiles and Apparel Trade in 2019

According to the World Trade Statistical Review 2019 newly released by the World Trade Organization (WTO), the current dollar value of world textiles (SITC 65) and apparel (SITC 84) exports totaled $315 billion and $505 billion in 2018 respectively, increased by 6.4% and 11.1% from a year earlier. This has been the fastest growth of world textile and apparel trade since 2012. Specifically:
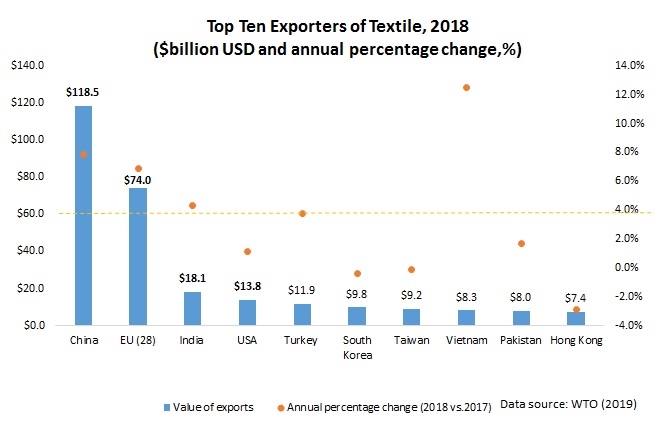
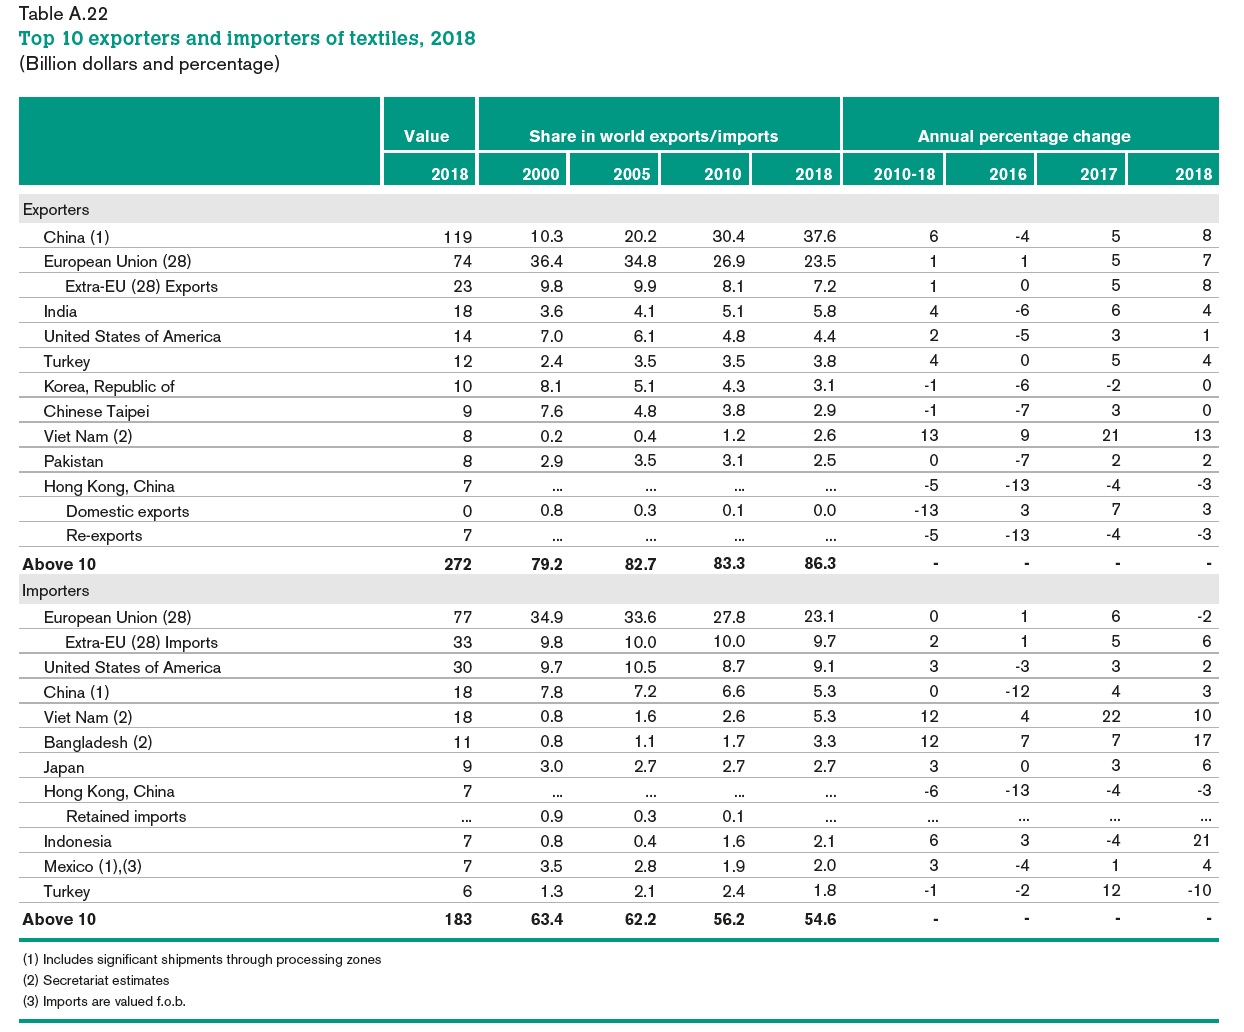
I. Textile export
China, European Union (EU28), and India remained the world’s top three exporters of textiles in 2018. Altogether, these top three accounted for 66.9% of world textile exports in 2018, a new record high since 2011. Notably, China and EU (28) also enjoyed a faster-than-world-average export growth in 2018, up 7.9% and 6.9% respectively. The United States remained the world’s fourth top textile exporter in 2018, accounting for 4.4% of the shares, down slightly from 4.6% in 2017.
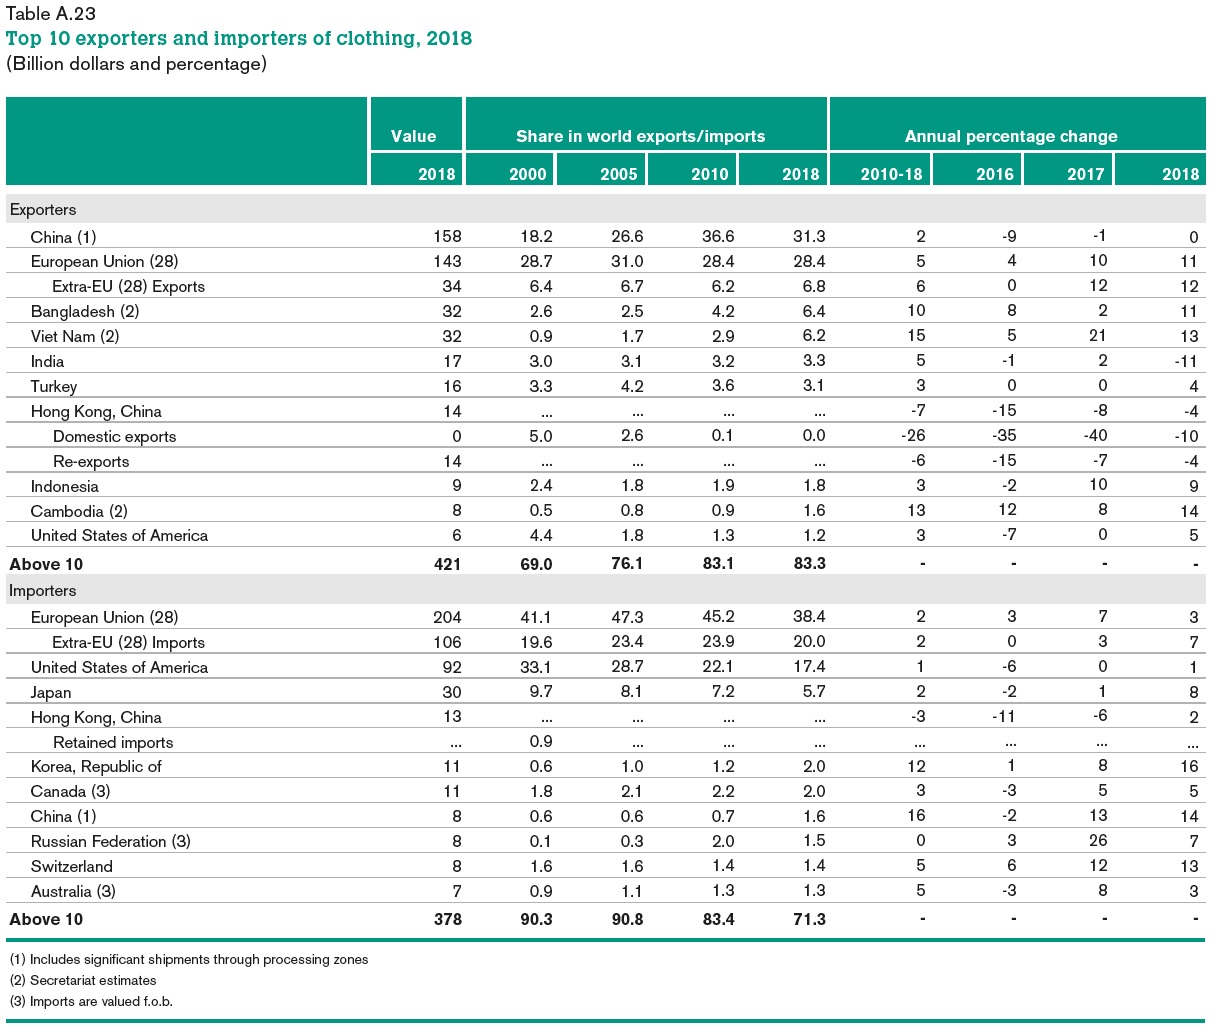
II. Apparel export
China, the European Union (EU28), Bangladesh, and Vietnam unshakably remained the world’s top four largest exporters in 2018. Altogether, these top four accounted for as much as 72.3% of world market shares in 2018, which, however, was lower than 75.8% in 2017 and 74.3% in 2016—primarily due to China’s declining market shares. Notably, even though apparel exports from Vietnam (up 13.4%) and Bangladesh (up 11.1%) enjoyed a fast growth in absolute terms in 2018, their gains in market shares were quite limited (up 0.3 percentage point from 5.9% to 6.2% for Vietnam and up 0.1 percentage point from 6.4% to 6.5% for Bangladesh). This result once again suggests that due to capacity limits, no single country has emerged to become the “Next China.” Instead, China’s lost market shares in apparel exports were fulfilled by a group of countries, a phenomenon which can be linked with fashion brands and retailers’ sourcing diversification strategy.
III. Textile import
The European Union (EU28), the United States, and China were the top three largest importers of textiles in 2018, accounting for 37.5% of the world’s total textile imports that year. Although the market shares of the top three in 2018 were close to 37.7% a year earlier, it nevertheless was much lower than over 50% back in the 2000s. The increasing diversification of textile import market is associated with the shifting pattern of world apparel manufacturing and export closely.
IV. Apparel import
Affected by consumers’ purchasing power (often measured by GDP per capita) and size of the population, the European Union, the United States, and Japan remained the world’s top three importers of apparel in 2018. Altogether, these top three absorbed 61.5% of world apparel in 2018, which, however, was lower than 62.3% in 2017 and a significant drop from 84% back in 2005. Behind the result, it is not the case that consumers in the EU, U.S., and Japan are importing less clothing. Instead, several emerging economies (such as China) are becoming fast-growing apparel consumption markets and starting to import more. As consumers’ purchasing power in these emerging economies continues to improve, we could expect a more diversified world apparel import market in the years ahead.
Additional reading: Latest trends in world textile and apparel trade

Professor Sheng Lu
Hope you are well.
I am collecting data on the clothing sector in order to discuss the phenomenon called “sweatshops” – it is for a post graduate study.
I have been following your blog since 2015. In your post, dated 16 August 2009, you mention there is an extract about current dollar value of world textiles (U$ 315 billion) and apparel (U$ 505 billion) exports from World Trade Statistical Review 2019.
I have read this publication but I am struggling to find that data.
Please may I ask you to assist me in finding where this is mentioned, if the information available in the attached graphs?
I would be immensely grateful for any assistance.
Kind regards,
Regina