
Statistical review of world textile and apparel trade in 2018 is now available
According to the newly released World Trade Statistical Review 2018 by the World Trade Organization (WTO), the current dollar value of world textiles (SITC 65) and apparel (SITC 84) exports totaled $296.1bn and $454.5bn respectively in 2017, increased by 4.2% and 2.8% from a year earlier. This is the first time since 2015 that the value of world textile and apparel exports enjoyed a growth.
Textiles and apparel are not alone. Driven by rising demand for imports globally, the current dollar value of world merchandise exports also grew by 4.7% in 2017–its most robust growth in six years, to reach $17.43 trillion. Particularly, the ratio of trade growth to GDP growth finally returned to its historic average of 1.5, compared to the much lower 1.0 ratio recorded in the years following the 2008 financial crisis.
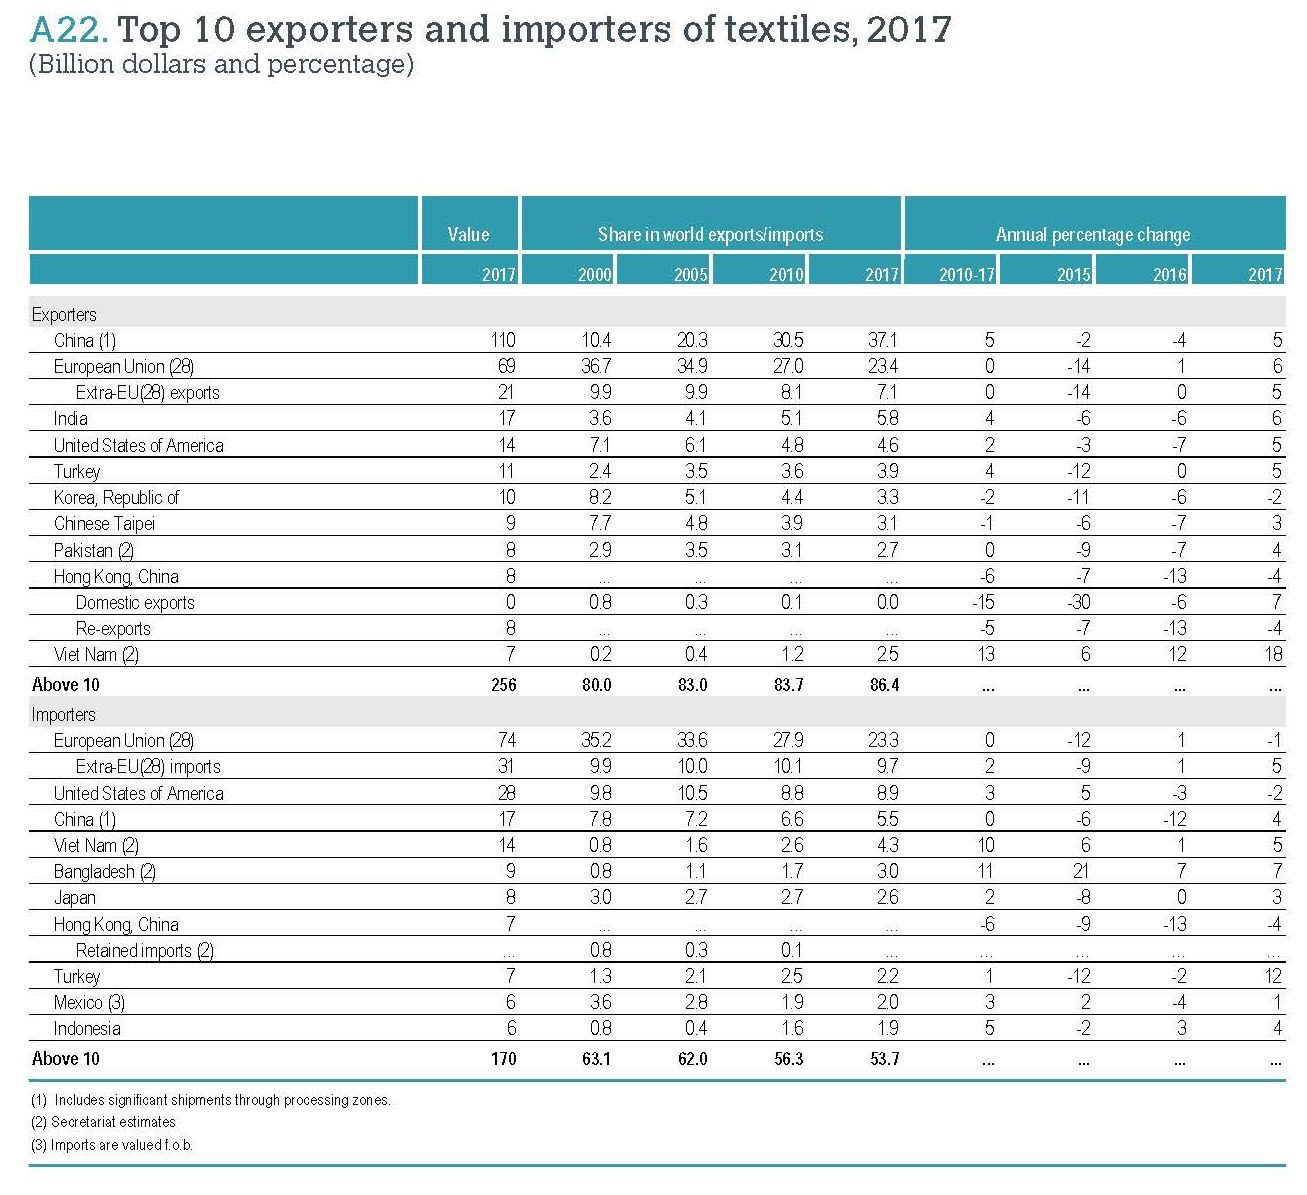
China, European Union (EU28), and India remained the world’s top three exporters of textiles in 2017. Altogether, these top three accounted for 66.3% of world textile exports in 2017, up from 65.9% in 2016. All the top three also enjoyed a faster-than-average export growth in 2017, including 5.0% of China, 5.8% of EU(28) and 5.9% of India. The United States remained the world’s fourth top textile exporter in 2017, accounting for 4.6 percent of the shares, the same as a year earlier.
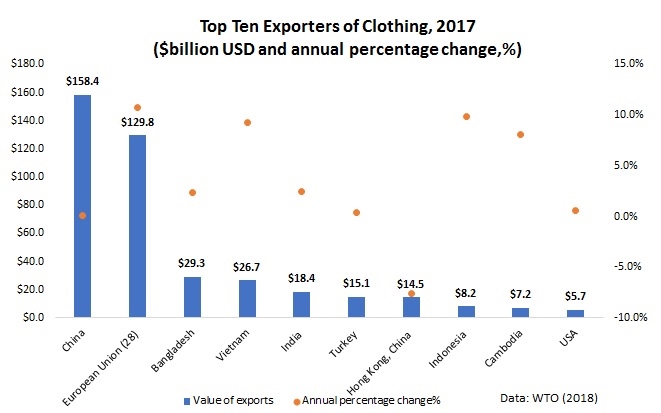
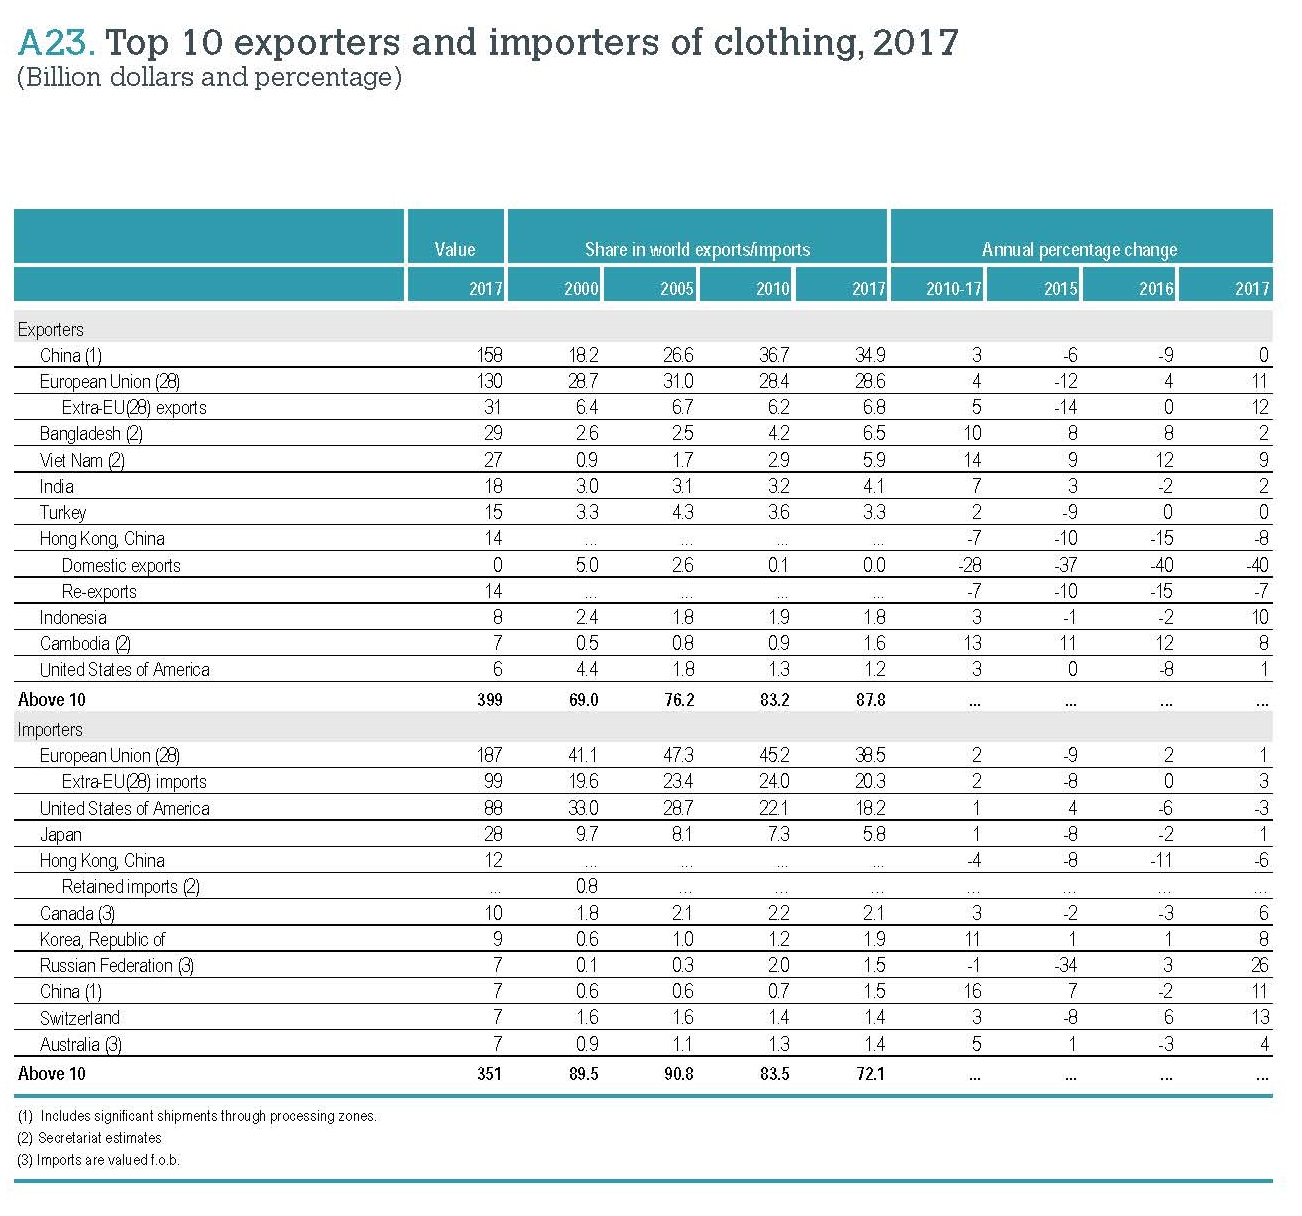
Regarding apparel, China, the European Union (EU28), Bangladesh and Vietnam unshakably remained the world’s top four largest exporters in 2017. Altogether, these top four accounted for as much as 75.8% of world market shares in 2017, which was higher than 74.3% a year earlier and a substantial increase from 68.3% back in 2007.
Continuing with the emerging trend in recent years, China is exporting less apparel and more textiles to the world. Notably, China’s market shares in world apparel exports fell from its peak—38.8% in 2014 to a record low of 34.9% in 2017. Meanwhile, China accounted for 37.1% of world textile exports in 2017, which was a new record high. It is important to recognize that China is playing an increasingly critical role as a textile supplier for many apparel-exporting countries in Asia. Measured by value, 47% of Bangladesh’s textile imports came from China in 2017, up from 39% in 2005. We observe similar trends in Cambodia (up from 30% to 65 %), Vietnam (up from 23 % to 50 %), Pakistan (up from 32 % to 71 %), Malaysia (up from 25 % to 54 %), Indonesia (up from 28 % to 46 %), Philippines (up from 19 % to 41 %) and Sri Lanka (up from 15 % to 39 %) over the same period.
Additional readings:
Lu, S. (2018). Changing trends in world textile and apparel trade. Just-Style.
Lu, S. (2018). How regional supply chains are shaping world textile and apparel trade. Just-Style.

The figures relate to “exporters”. I assume that this figure only shows where the goods are exported from – not where they were produced. Contrary to China, Bangladesh, Vietnam etc. the high export figure of the EU may include a huge part of apparel which is produced elsewhere but only distributed from the EU. Right ? If so, it would be interested to evaluate the share of EU-produced part within the 130 Billion USD.
Around 76% (or $99 billion) of the $130 billion EU exports of apparel were EU intra-region trade (i.e. one EU country exports to another EU member). EU extra-region trade (i.e. a EU member exports to a non-EU) member totaled $30 billion. WTO will release the detailed country-level trade data in October based on which I can explore the patterns of EU intra-region trade in details. My previous studies suggest that over half of apparel consumed by EU consumers remain made in EU (through the regional supply chain). https://www.just-style.com/comment/5-key-trends-in-world-textile-and-apparel-trade_id132343.aspx
The trade war between the US and China has been a popular topic during recent years. However, from the first two chart shown in this article, the EU nations still main at the second place of textile import and export. Is this safe to say the EU nations would benefit because of the negative factors of the trade war? Is this trade war period a opportunity for EU nations to improve their textile and apparel industry?
FASH455 has helped me realize a lot more about trade and the trade war that has been going on between the United States and China. It’s interesting to me that China, European Union, and India remained the world’s top three exporters of textiles in 2017. They had an above average export growth in 2017, highest in India. It’s fascinating that the U.S. remained the world’s fourth top textile exporter in 2017, accounting for 4.6% of the shares. Are the EU nations benefiting from the negative factors of this trade war?