
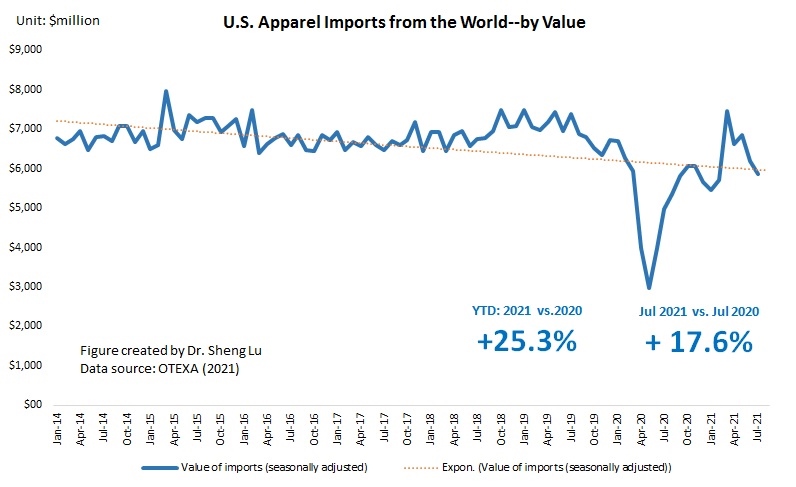
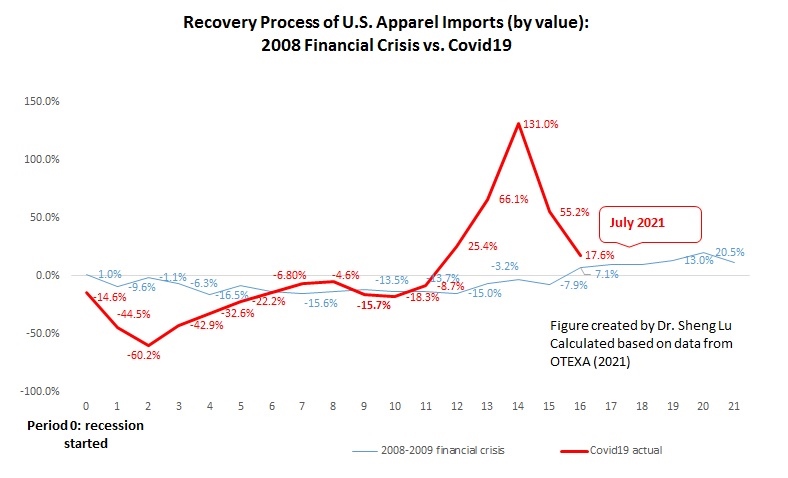
First, the shipping crisis and new wave of COVID cases start to affect US apparel imports negatively. While US consumers’ demand for clothing overall remains strong, for the second month in a row, the value of US apparel imports (seasonally adjusted) in July 2021 decreased by 5.5% from a month ago and down 9.7% from May to June. The absolute value of US apparel imports year to date (YTD) in 2021 (January—July) was 25.3% higher than in 2020 and around 87% of the pre-COVID level (benchmark: January-July, 2019). However, the year-over-year growth in July 2021 was only 15.4%, compared with 60.0% in May 2021 and 29.1% in June 2021. Overall, the results remind us that the market environment is far from stable yet as the COVID situation in the US and other parts of the world continues to evolve.
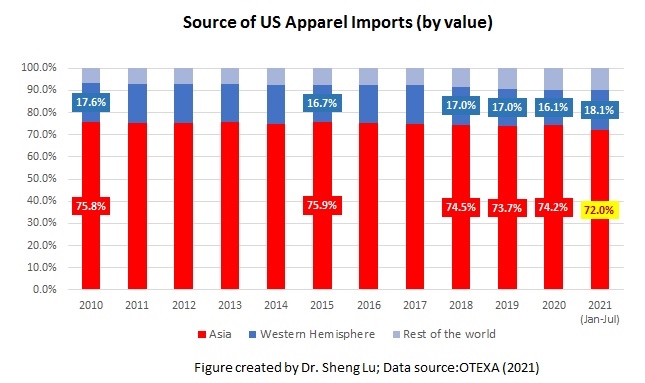
Second, Asian countries lost market shares as some leading apparel supplying countries, including Vietnam and Bangladesh, struggled with new COVID lockdowns. While Asia as a whole remains the single largest apparel sourcing base for US companies, Asian countries’ market shares fell from 74.2% in 2020 to 71.3% in July 2021, the lowest since 2010. The new COVID lockdowns in Vietnam and Bangladesh, the No. 2 and No. 3 top suppliers for the US market, post significant challenges to US fashion companies trying to build inventory for the upcoming holiday season. Notably, US companies source many high-volume products from these two countries, and there is a lack of alternative sourcing destinations in the short run.

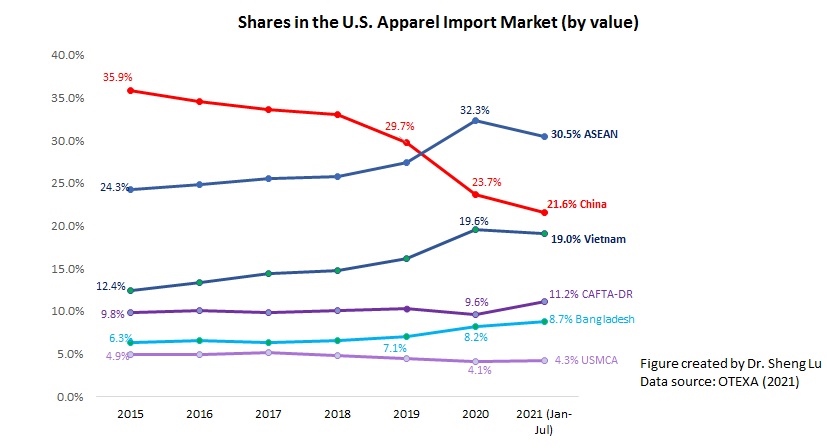
Third, US companies continue to treat China as an essential sourcing base during the current challenging time. However, there is no clear sign that companies are reversing their long-term strategy of reducing “China exposure.” China stays the largest supplier for the US market in July 2021, accounting for 41.3% of total US apparel imports in quantity and 26.0% in value. The export product diversification index also suggests that China supplied the most variety of products to the US market. US apparel imports from Bangladesh, Mexico, and CAFTA-DR members are more concentrated on specific product categories. In other words, should China were under lockdowns, the negative impacts on US companies’ inventory management could be even worse.

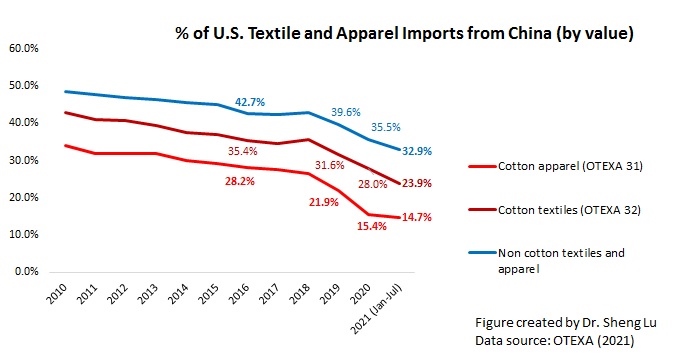
Nevertheless, the HHI index and market concentration ratios (CR3 and CR5) calculated based on the latest data suggest that US fashion companies continue to move their apparel sourcing orders from China to other Asian countries overall. For example, only 14.7% of US cotton apparel imports came from China in 2021 (January—July), a new record low in the past ten years. Further, as US apparel imports from China typically peak from June to September because of seasonal factors, China’s market shares are likely to drop in the next few months. Additionally, the fundamental concerns about sourcing from China are NOT gone. On the contrary, new US actions against alleged forced labor in Xinjiang are likely in the coming months and affect imports from China beyond cotton products.
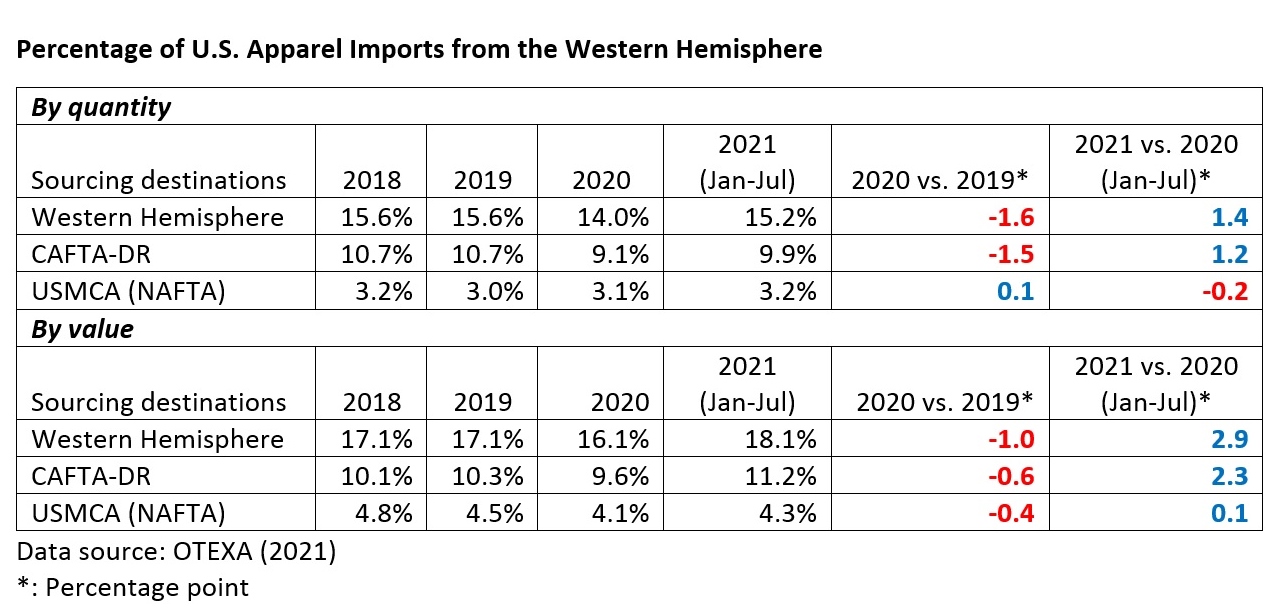
Fourth, US apparel sourcing from the Western Hemisphere, especially CAFTA-DR members, gains new momentum. Specifically, 18.1% of US apparel imports came from the Western Hemisphere YTD in 2021 (January-July), higher than 16.1% in 2020 and 17.1% before the pandemic. Notably, CAFTA-DR members’ market shares increased to 11.2% in 2021 (January to July) from 9.6% in 2020. The value of US apparel imports from CAFTA-DR also enjoyed a 58.4% growth in 2021 (January—July) from a year ago, one of the highest among all sourcing destinations. The imports from El Salvador (up 75.2%), Honduras (up 74.6%), Dominican Republic (45.1%), and Guatemala (40.6%) had grown particularly fast so far in 2021.
Meanwhile, US apparel imports from USMCA members stayed stable (i.e., no significant change in market shares). CAFTA-DR and USMCA members currently account for around 60% and 25% of US apparel imports from the Western Hemisphere. They are also the single largest export market for US textile products (about 70%).
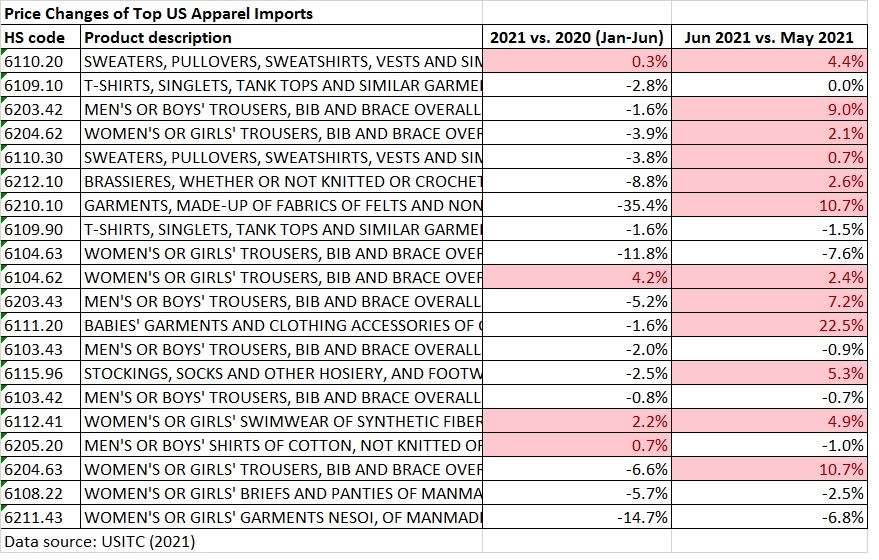
Fifth, US apparel imports start to see a notable price increase. While an across-the-board price increase was not a big concern at the beginning of 2021, the increase has become more noticeable since June 2021. For example, of the top 20 US apparel imports (HS chapters 61-62) at the 6-digit HS code level based on import value, the price of thirteen products increased from May to June 2021. The price increase at the country level is even more significant. From May to July 2021, the average unit price of US apparel imports from leading sources all went up substantially, including China (7%), Vietnam (13%), Bangladesh (13.9%), and India (15.6%).
As almost everything is becoming more expensive, from raw material, shipping to labor, the August and September trade data (to be released in October and November) could suggest an even more significant price increase.
by Sheng Lu
