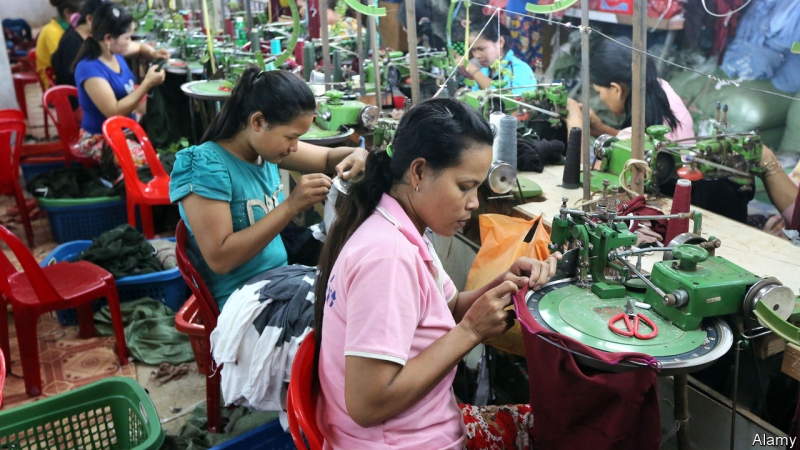
Sub-Saharan Africa (SSA) is widely regarded as a growing apparel-souring destination. Particularly, U.S. Congress established theAfrican Growth and Opportunity Act (AGOA), a non-reciprocal trade preference program, in 2000, to help developing SSA countries grow their economy through expanded exports to the United States. Because apparel production plays a dominant role in many SSA countries’ economic development, apparel has become one of the top exports for many SSA countries under AGOA. Notably, the “third-country fabric provision” under AGOA allows US apparel imports from certain SSA countries to be qualified for duty-free treatment even if the apparel items use yarns and fabrics produced by non-AGOA members, such as China, South Korea, and Taiwan. This special rule is deemed as critical as most SSA countries still have no capacity in producing capital and technology-intensive textile products.
That being said, to play a bigger role as an apparel sourcing base, SSA is not without significant challenges:
Challenge 1: limited industry upgrading and local textile production capacity
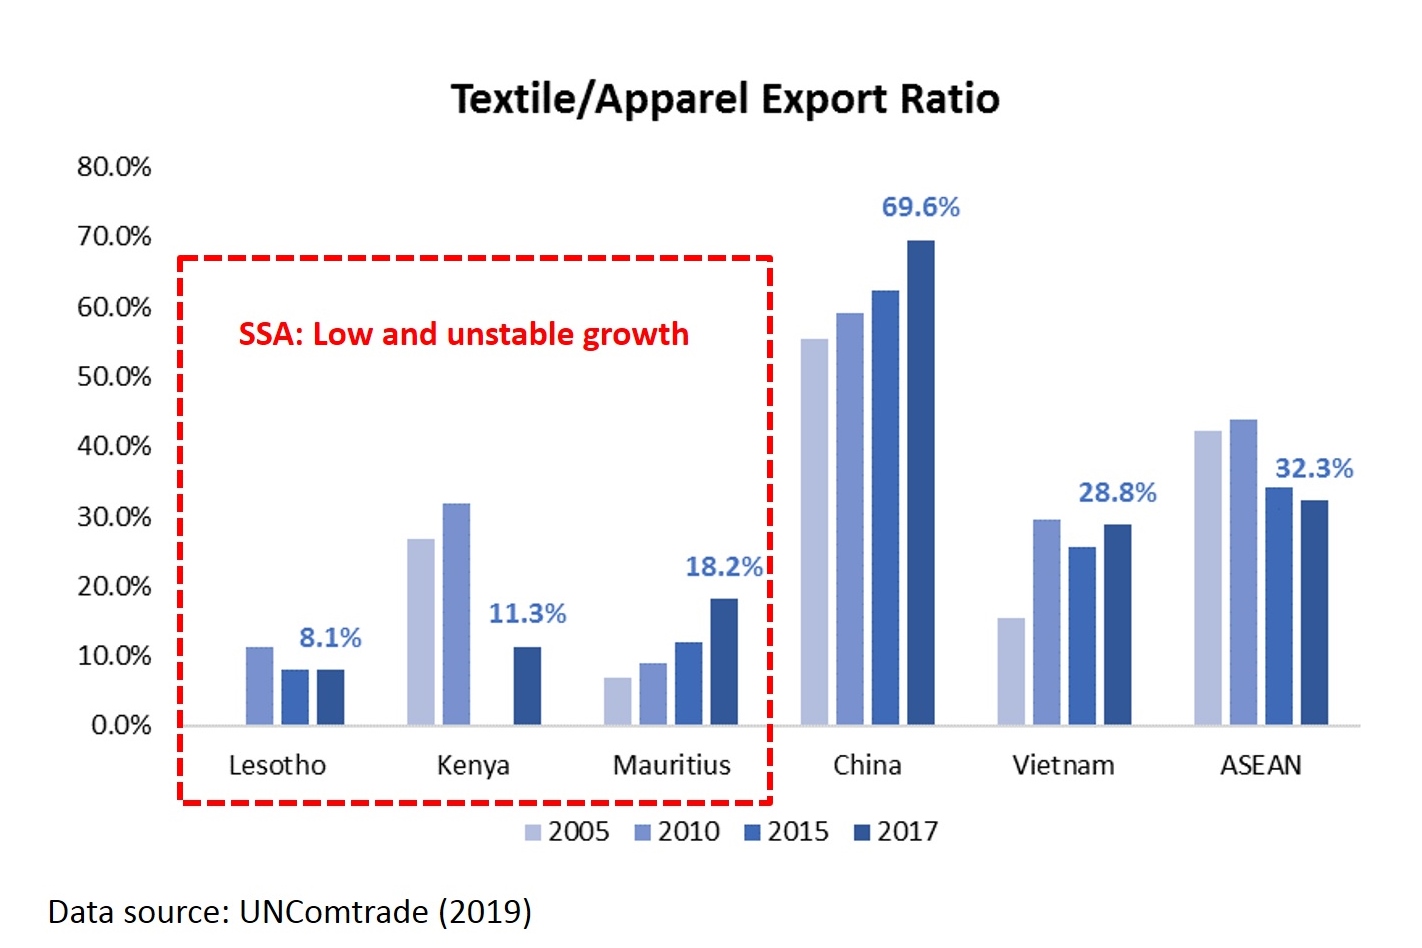
Theoretically, as a country’s economy advances, it should gradually be producing and exporting more capital and technology-intensive textiles versus labor-intensive apparel products. This is the notable trends in many Asian countries (such as China and Vietnam), where the textile/apparel export ratio has been rising steadily between 2005 and 2017. However, as a reflection of the stagnant industry upgrading, the textile/apparel export ratio remains fairly low in SSA, including in Lesotho, Kenya, and Mauritius, the top three largest apparel exporters in the SSA region.
Challenge 2: Slow and no progress in export diversification
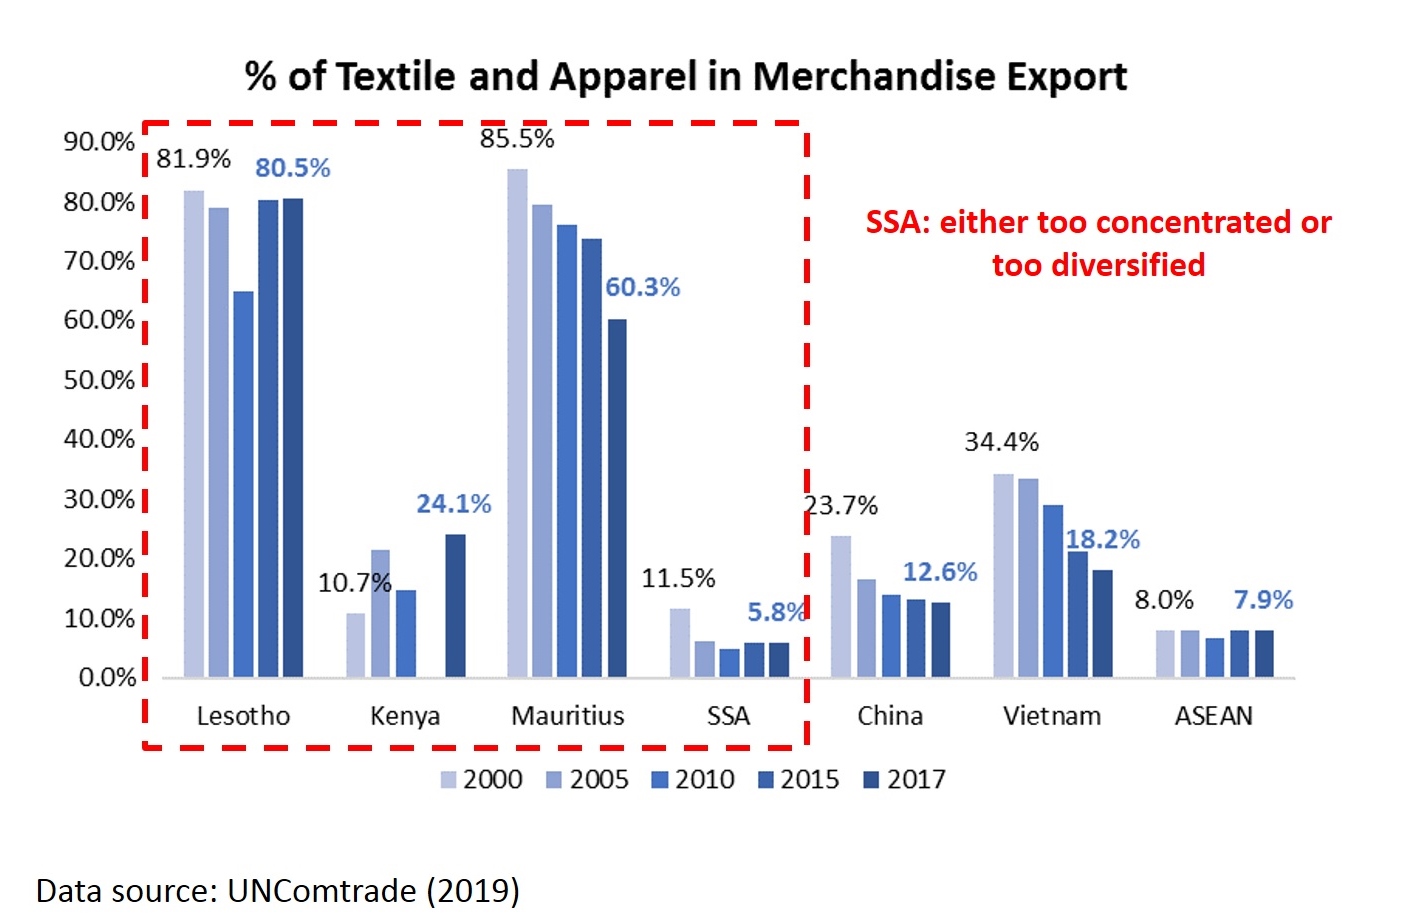
Ideally, as the economy becomes more sophisticated, textiles and apparel (T&A) should account for a declining share in a country’s total merchandise exports. Countries such as China, Vietnam, and ASEAN demonstrate perfect examples. However, in some SSA countries (e.g., Lesotho), T&A has stably accounted for over 80% of their total merchandise exports over the past 17 years, a sign of slow or no progress in export diversification. In other SSA countries, T&A accounted for less than 10% of their total merchandise exports, suggesting the sector is not a priority to the local economy.
Challenge 3: Intense competition both in key export markets and domestic market
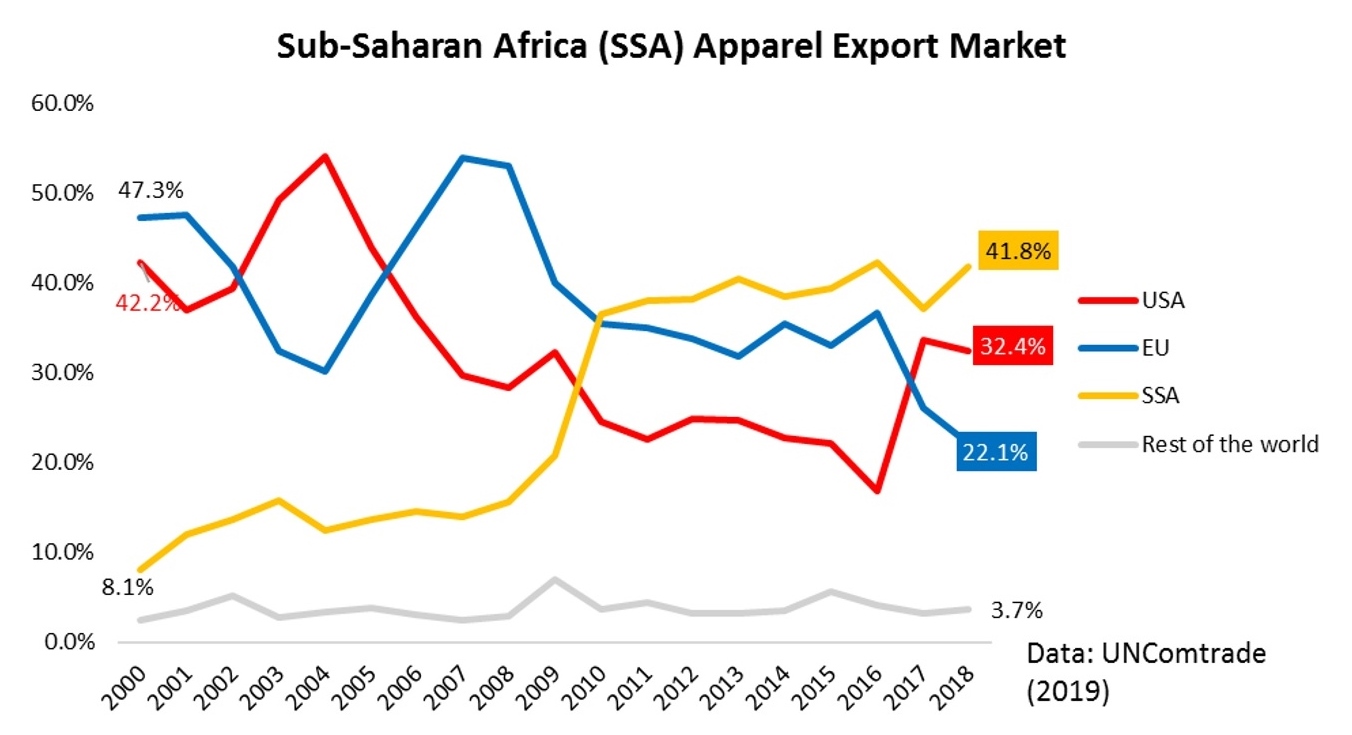
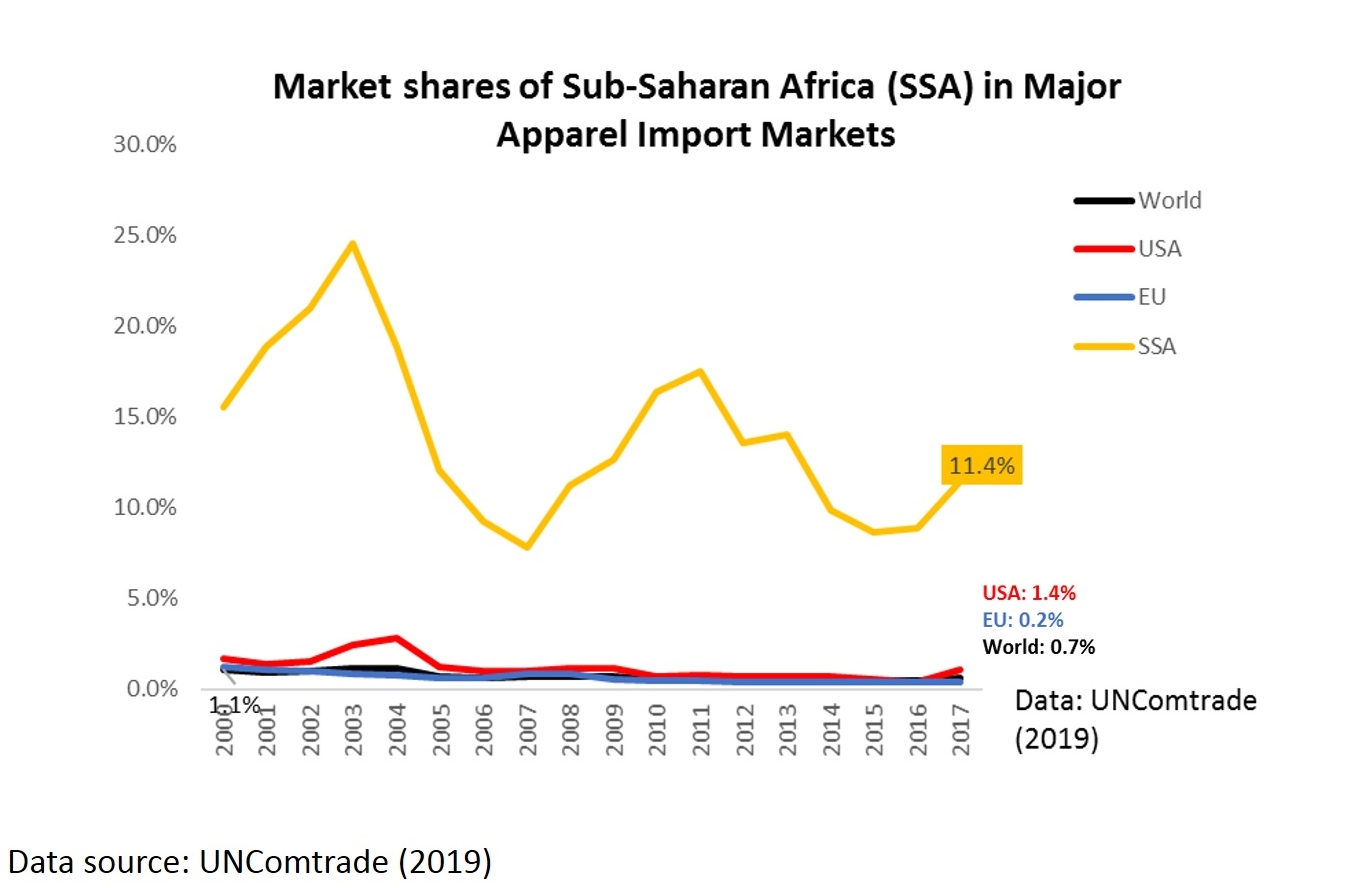
As of 2017, over 96% of SSA countries’ T&A exports went to three markets: the United States, the EU, and other SSA members. However, because of the intense competition, except for the regional SSA market, SSA countries account for merely 1.4% and 0.2% of total U.S. and EU textile and apparel imports in 2017 respectively.
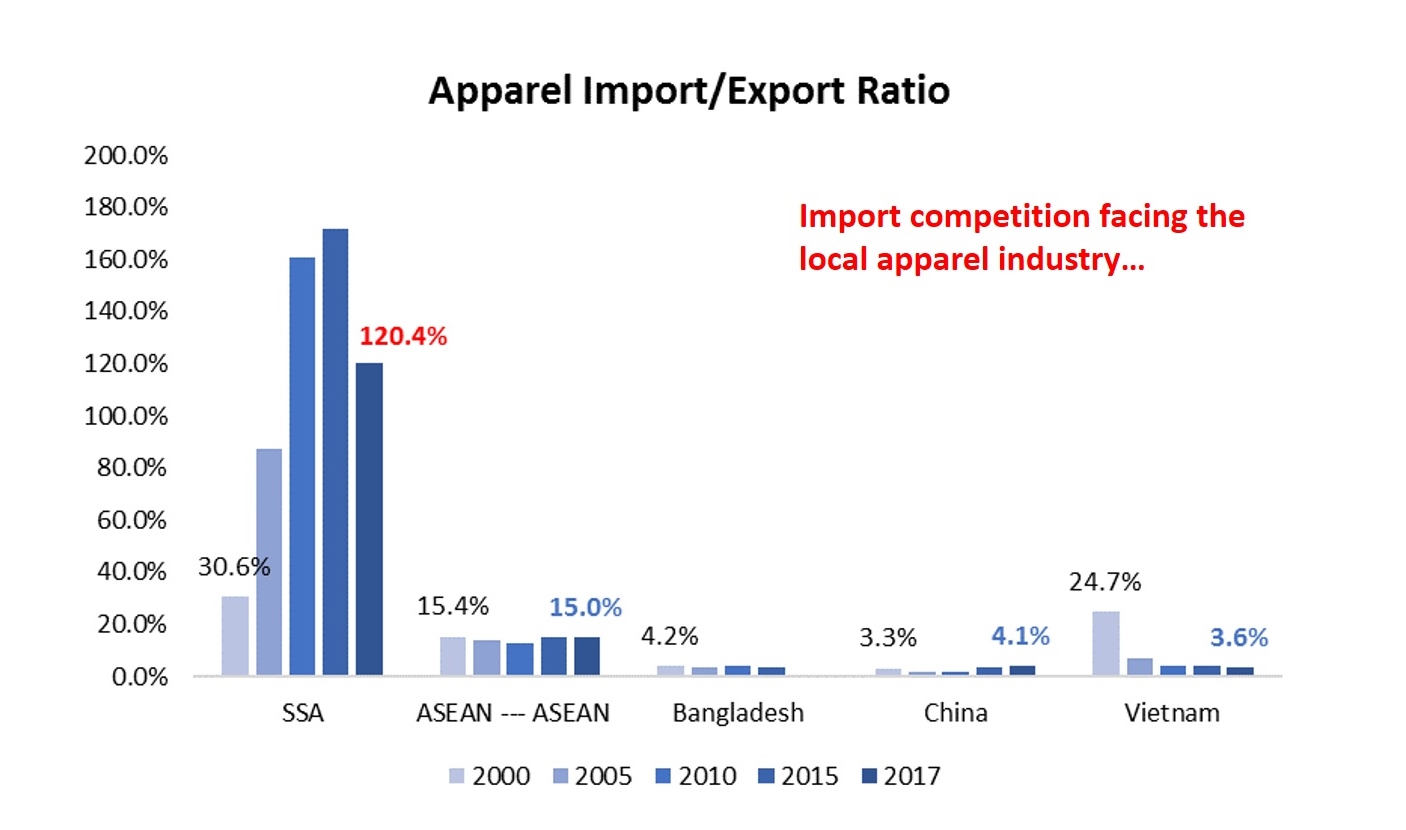
Even more concerning, the T&A industry in SSA countries is facing growing competition in the domestic market with cheap imports, mostly from Asia. Notably, SSA countries import MORE apparel than they export, a phenomenon rarely seen among developing countries in a similar stage of economic development.
Challenge 4: U.S. companies remain low interest in investing in the region directly
According to several recent studies, leading U.S. fashion brands and retailers remain low interest in investing in the SSA region directly, even though companies admit more investments in areas such as infrastructure are critical to the success of SSA countries serving as competitive apparel sourcing bases. Some argue that the “temporary” nature of AGOA make companies hesitant to build factories in SSA. However, should AGOA become a permanent free trade agreement, which follows the principle of reciprocity, SSA countries would have to lower their trade barriers to U.S. products, including eliminating the tariffs and non-tariff barriers, in exchange for the reciprocal market access benefits from the United States. It doesn’t seem most AGOA members are ready for that stage yet.
On April 19, 2019, the U.S. International Trade
Commission (USITC) released
its independent assessment report on the likely economic impact of the
U.S.-Mexico-Canada Free Trade Agreement (USMCA or NAFTA2.0). Below are the key
findings of the report:
Impact of USMCA on
the U.S. economy
USITC found that because of the size of the U.S. economy
relative to the size of the Mexican and Canadian economies and the reduction in
tariff and nontariff barriers that has already taken place among the three countries
under the North American Free Trade Agreement (NAFTA), the overall impact of USMCA on the U.S. economy is likely to be
moderate. For example, USITC’s computable general equilibrium (CGE) model suggests
that compared to the base year level in 2017, USMCA could increase the U.S. GDP
by 0.35% (or $68.2 billion) and create 0.17 million new jobs when other factors
held constant.
Impact of USMCA on
the textile and apparel sector
First, USITC found that the USMCA overall is a balanced deal for the textile and apparel sector, particularly regarding the rules of origin (RoO) debate. As USITC noted, USMCA eases the requirements for duty-free treatment for certain textile and apparel products, but tighten the requirements for other products. For example, USMCA eliminates the NAFTA requirements that visible linings must be sourced from members of the agreement; however, USMCA adds more restrictive new requirements for narrow elastic fabrics, sewing thread, and pocket bag fabric.
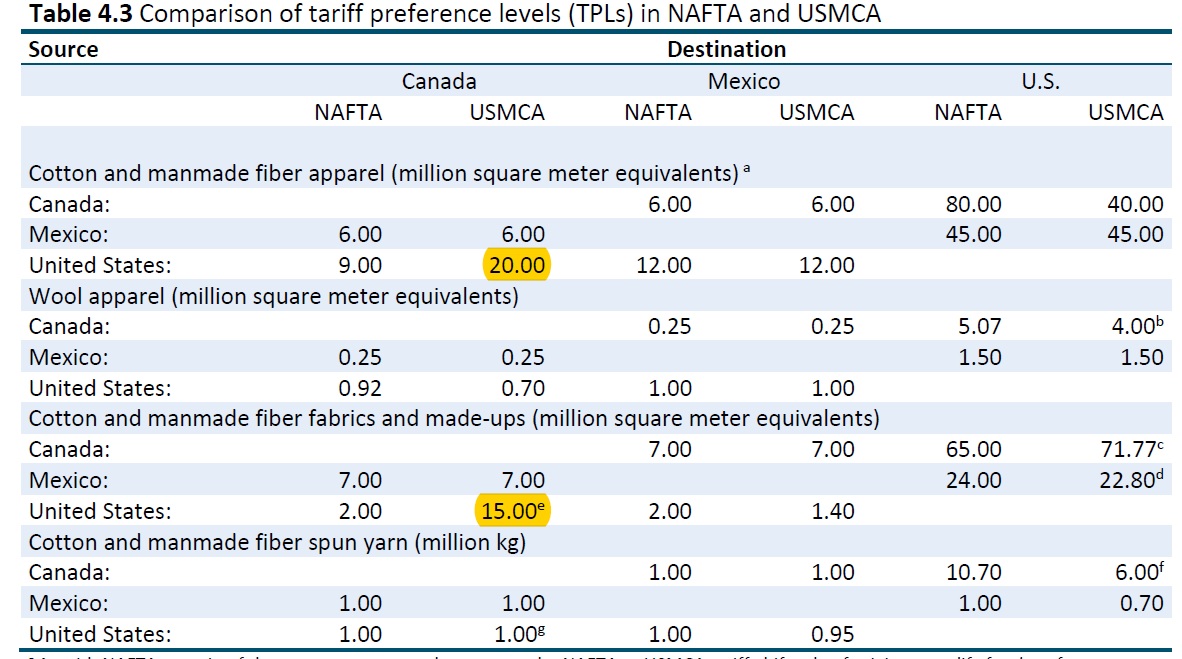
Second, USITC found that the USMCA changes to the Tariff Preference Level (TPLs) would not have much effect on related trade flows. As USITC noted in its report, where USMCA would cut the TPL level on particular U.S. imports from Canada or Mexico, the quantitative limit for these product categories was not fully utilized in the past. Meanwhile, the TPL level for product categories typically fully used would remain unchanged under USMCA. The only trade flow that might enjoy a notable increase is the U.S. cotton and man-made fiber (MMF) apparel exports to Canada—the TPL is increased to 20million SME annually under USMCA from 9 million under NAFTA.
Third, USITC suggested that in aggregate, the changes under USMCA for the textile and apparel sector will more or less balance each other out and USMCA would NOT affect the overall utilization of USMCA’s duty-free provisions significantly. Notably, the under-utilization of free trade agreements (FTAs) by U.S. companies in apparel sourcing has been a long-time issue. Data from the Office of Textiles and Apparel (OTEXA) shows that of the total $4,292.8 million U.S. apparel imports from the NAFTA region in 2018, only $3,756.1 million (or 87.5%) claimed the preferential duty benefits under the agreement. As noted in the U.S. Fashion Industry Benchmarking Study, some U.S. fashion companies do not claim the duty savings largely because of the restrictive RoO and the onerous documentation requirements.
However, interesting enough, the USITC report says little
about the potential impact of USMCA on U.S. textile and apparel manufacturing.
Timeline
On 30 September 2018, the United States reached USMCA with Canada and Mexico. On 30 November 2018, USMCA was officially signed by Presidents of the three countries. According to the Bipartisan Congressional Trade Priorities and Accountability Act of 2015 (the picture above), after the release of the USITC economic assessment report on USMCA, the Trump Administration will need to work with U.S. Congress to develop legislation to approve and implement the agreement. However, there remains huge uncertainties over USMCA’s prospect.
A group of eminent panelists will bring their experience on how digital technologies are changing international trade and how international trade cooperation can help governments reap the benefits and address the challenges of digital trade.
Speakers/Panalists:
Roberto Azevêdo, Director-General, World Trade Organization
The UK government on March 13, 2019 released the temporary
rates of customs duty on imports if the country leaves the European Union
with no deal. In the case of no-deal Brexit, these tariff rates will take
effect on March 29, 2019 for up to 12
months.
According to the announced plan, around 87% of UK’s imports by value would be eligible for zero-tariff in the no-deal Brexit scenario.
Specifically for apparel products, 113 out of the total 148 tariff lines (8-digit HS code) in Chapter 61 (Knitted apparel) and 145 out of the total 194 tariff lines (8-digit HS code) in Chapter 62 (Woven apparel) will be duty-free. However, other apparel products will be subject to a Most-Favored-Nation (MFN) tariff rate ranging from 6.5% to 12%.
Meanwhile, the UK will offer preferential tariff duty rates for apparel exports from a few countries/programs, including Chile (zero tariff), EAS countries (zero tariff), Faroe Islands (zero tariff), GSP scheme (reduced tariff rate), Israel (zero tariff), Least Developed Countries (LDC) (zero tariff), Palestinian Authority (zero tariff), and Switzerland (zero tariff).
On the other hand, the EU Commission said it would apply the Most-Favored-Nation (MFN) tariff rates on UK’s products in the no-deal Brexit scenario rather than reciprocate.
While U.S. textile manufacturers and the apparel and retail
industries have expressed overall support for the newly reached
US-Mexico-Canada Free Trade Agreement (USMCA or NAFTA2.0), textile producers
and the apparel sector still hold divergent views on certain provisions:
Textile “Yarn-Forward”
Rule of Origin
USMCA vs. NAFTA1.0: The
USMCA will continue to adopt the “yarn-forward” rules of origin. The USMCA will
also newly require sewing thread, coated fabric, narrow elastic strips, and
pocketing fabric used in apparel and other finished products to be made in a
USMCA country to qualify for duty-free access to the United States.
U.S. textile industry: U.S.
textile manufacturers almost always support a strict “yarn-forward” rules of
origin in U.S free trade agreements and
they support eliminating exceptions to the “yarn forward” rule as well. The
National Council of Textile Organization (NCTO) estimates that a yearly USMCA
market for sewing thread and pocketing fabric of more than $300 million.
U.S. apparel and retail
industries: The U.S. apparel industry opposes “yarn forward” and argues
that apparel should be considered of
North American origin under a more flexible regional “cut and sew” standard,
which would provide maximum flexibility for sourcing, including the use of
foreign-made yarns and fabrics.
Tariff Preference
Levels (TPL) for Textiles and Apparel
USMCA vs. NAFTA1.0: With some adjustments, the USMCA would continue a program that allows duty-free access for limited quantities of wool, cotton, and man-made fiber apparel made with yarn or fabric produced or obtained from outside the NAFTA region, including yarns and fabrics from China and other Asian suppliers.
U.S. textile industry: The
textile industry contends China is a major
beneficiary of the current NAFTA TPL mechanism, and it strongly pushed for its
complete elimination in the USMCA.
U.S. apparel and retail
industries: U.S. imports of textiles and apparel covered by the tariff preference level mechanism supply 13% of
total U.S. textile and apparel imports from Canada and Mexico. Apparel
producers assert that these exceptions give regional producers flexibility to
use materials not widely produced in North America.
Viewpoints on other Provisions in USMCA
U.S. textile industry: The
U.S. textile industry also opposes the USMCA newly allows visible lining fabric
for tailored clothing could be sourced
from China or other foreign suppliers, and it would permit up to 10% of a
garment’s content, by weight, to come from outside the USMCA region (up from 7%
in NAFTA1.0). The U.S. textile industry also welcomes that the USMCA would add specific textile verification and
customs procedures aimed at preventing fraud and transshipment. Additionally, the U.S. textile industry is also pleased
that the USMCA would end the Kissell
Amendment. The Kissell Amendment is an exception in NAFTA that allows
manufacturers from Canada and Mexico to qualify as “American” sources when Department
of Homeland Security (DHS) buys textiles, clothing, and footwear using
appropriated funds (about $30 million markets
for textiles, clothing, and shoes altogether).
U.S. apparel and retail
industries: Apparel importers are of
concern that the USMCA continue to incorporate the existing NAFTA short
supply procedure, which is extremely difficult to get a new item approved and
added to the list, limiting their flexibility to source apparel with inputs
from outside North America.
Finally, the report argues that “Regardless of whether the USMCA takes effect, the global competitiveness of U.S. textile producers and U.S.-headquartered apparel firms may depend more on their ability to compete against Asian producers than on the USMCA trade rules.”
Last week in FASH455, we discussed the unique critical role played by textile and apparel trade in generating economic growth in many developing countries. The developed countries also use trade policy tools, such as trade preference programs, to encourage the least developed countries (LDCs) making and exporting more apparel. However, a debate on these trade programs is that they have done little to improve the genuine competitiveness of LDCs’ apparel exports in the world marketplace, but instead have made LDCs rely heavily on these trade programs to continue their apparel exports. Here is one more example:
With growing concerns about “the deterioration of democracy, respect for human rights and the rule of law in Cambodia”, in a statement made on February 12, 2019, the European Union says it has started the process that could lead to a temporary suspension of Cambodia’s eligibility for EU’s Everything But Arms (EBA) program. Specifically, the EU process will include the following three stages:
Stage 1: six
months of intensive monitoring and engagement with the Cambodian government;
Stage 2: another three months for the EU to produce a
report based on the findings in stage 1
Stage 3: after
a total of twelve months in stages 1
& 2, the EU Commission will conclude the procedure with a final decision on
whether or not to withdraw tariff preferences; it is also at this stage that
the Commission will decide the scope and duration of the withdrawal. Any
withdrawal would come into effect after a further six-month period.
However, the EU
Commission also stressed that launching the temporary withdrawal procedure does
not entail an immediate removal of Cambodia’s preferential access to the EU
market, which “would be the option of last resort.”
Developed in 2001, the EBA program establishes duty-free and quota-free
treatment for all Least Developed Countries (LDCs) in the EU market. EBA includes
almost all industries other than arms and armaments. As of February 2019, there
are 49
EBA beneficiary countries.
The EBA program has benefited the apparel sector in particular given clothing accounts for the lion’s share in many LDCs’ total merchandise exports. Because of the preferential duty benefits provided by EBA, many LDCs can compete with other competitive apparel powerhouses such as China. Notably, the EBA program also adopts the “cut and sew” rules of origin for apparel, which is more general than the “double transformation” rules of origin typically required by EU free trade agreement and trade preference programs. Under the “cut and sew” rule, Cambodia’s apparel exports to the EU can enjoy the import duty-free treatment while using yarns and fabrics sourced from anywhere in the world.
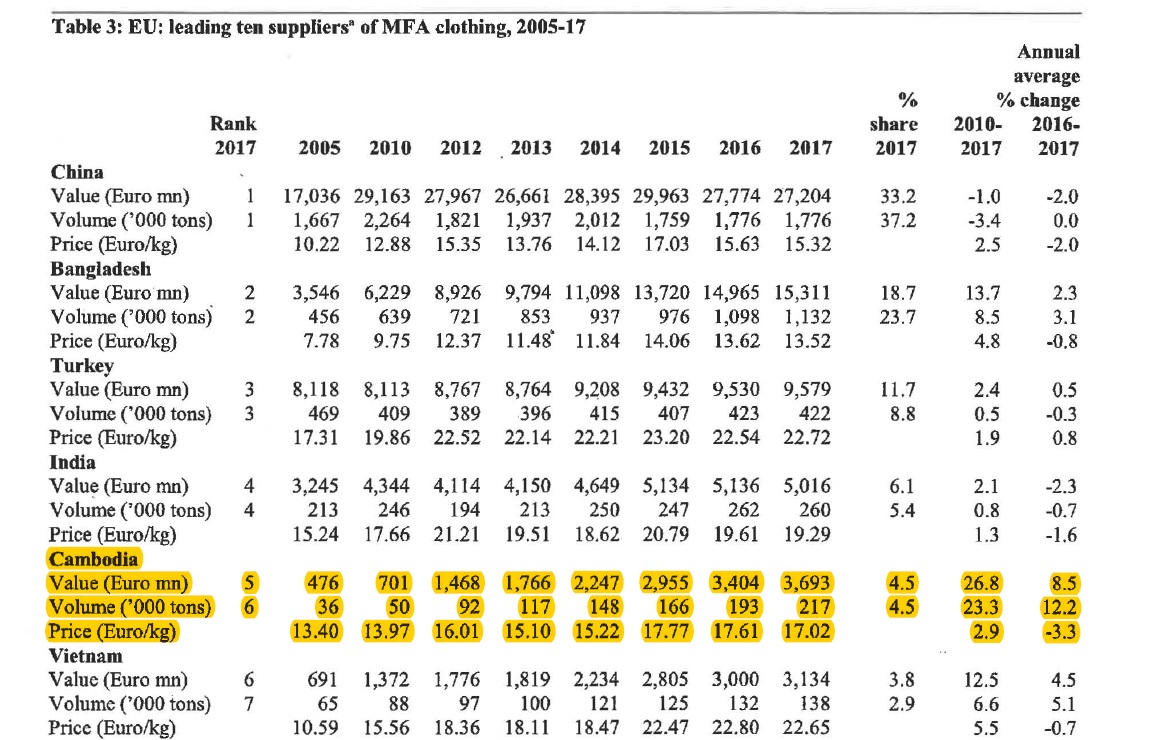
Cambodia is a major apparel supplier for the EU market, accounting for approximately 4% of EU’s
total apparel imports in 2017. Exporting
apparel to EU through the EBA program is also of particular importance to
Cambodia economically. In 2016, the apparel sector created over 500,000
jobs in Cambodia, of whom 86% were female, working in 556 registered factories.
According to Eurostat, of EU’s €4.9bn imports from Cambodia in 2017, around 74.9% were apparel (HS chapters 61 and
62). Meanwhile, of EU’s €3.7bn apparel imports from Cambodia in 2017, as high
as 96.6% claimed the EBA benefits. Understandably,
losing the EBA eligibility could hurt Cambodia’s apparel exports to the EU significantly.
“Globotics” or Globalization + Artificial intelligence (AI) is changing the world. Globotics means globalization mixed with new kinds of robotics, from artificial intelligence to technologies that make it easier to outsource services jobs. Particularly, globotics is injecting pressure into our socio-politico-economic system (via job displacement) faster than our system can absorb it (via job replacement). Overall, AI and robots will take jobs — but make the world better.
Past globalization and automation were mostly about goods— making them and shipping them. However, the era of globotics is about service-sector automation—driven by information and data.
The competition from software robots and telemigrants will seem monstrously unfair to white collar works who lost their jobs. When white-collar workers start sharing the same pain [as blue-collar workers], some sort of backlash is inevitable.
As technologies reduce the need for face-to-face contact, some developing nations stand to benefit. For example, India, with its sizeable English-speaking population and armies of techies, could become a hub for services outsourcing, just as China was for manufacturing.
Future jobs (that are left) will be more human and involve more face-to-face contact since software robots and tele-migrants will do everything else. In other words, the future economy will be more local and more human.
The problem is the short-term. In the era of globotics, it is important to make the rapid job displacement politically acceptable to a majority of voters. Governments may set the policy goal to protect workers, not jobs.
While the majority of apparel consumed in the United States come from overseas, “Made in the USA” is growing in popularity. According to the 2018 U.S. Fashion Industry Benchmarking Study released by the U.S. Fashion Industry Association (USFIA) in July 2018, around 46 percent of surveyed U.S. fashion brands and apparel retailers report currently sourcing “Made in the USA” products, even though local sourcing typically only account for less than 10 percent of these companies’ total sourcing value or volume. Likewise, the State of Fashion 2019 report published by Business of Fashion (BOF) and McKinsey & Company in November also forecasts that over 20 percent of U.S. fashion companies’ sourcing volume could be from nearshore by 2025, thanks to automation technology and consumers’ increasing demand for speed to market.
However, the detailed practice of the “Made in the USA” apparel sourcing strategy–including who is sourcing, what products are sourced, and what the typical price range of these products remain largely unknown.
To answer these questions, we recently analyzed the pricing, product assortment and inventory information of over 90,000 fashion retailers and 300,000,000 fashion apparel products at the Stock-Keeping Unit (SKU) level based on EDITED, a big data and business analytics tool developed for the fashion industry. For the research purpose, we selected apparel products newly launched to the U.S. market in the past twelve months (i.e., between 1 December 2017 and 30 November 2018) with “Made in the USA” explicitly mentioned in the product description. Below are the key findings:
First, “Made in the USA”
apparel overall are treated as a niche product in U.S. fashion brands and
retailers’ sourcing portfolio.
During
the 12 months we examined (1 December 2017-30 November 2018), 94 out of the
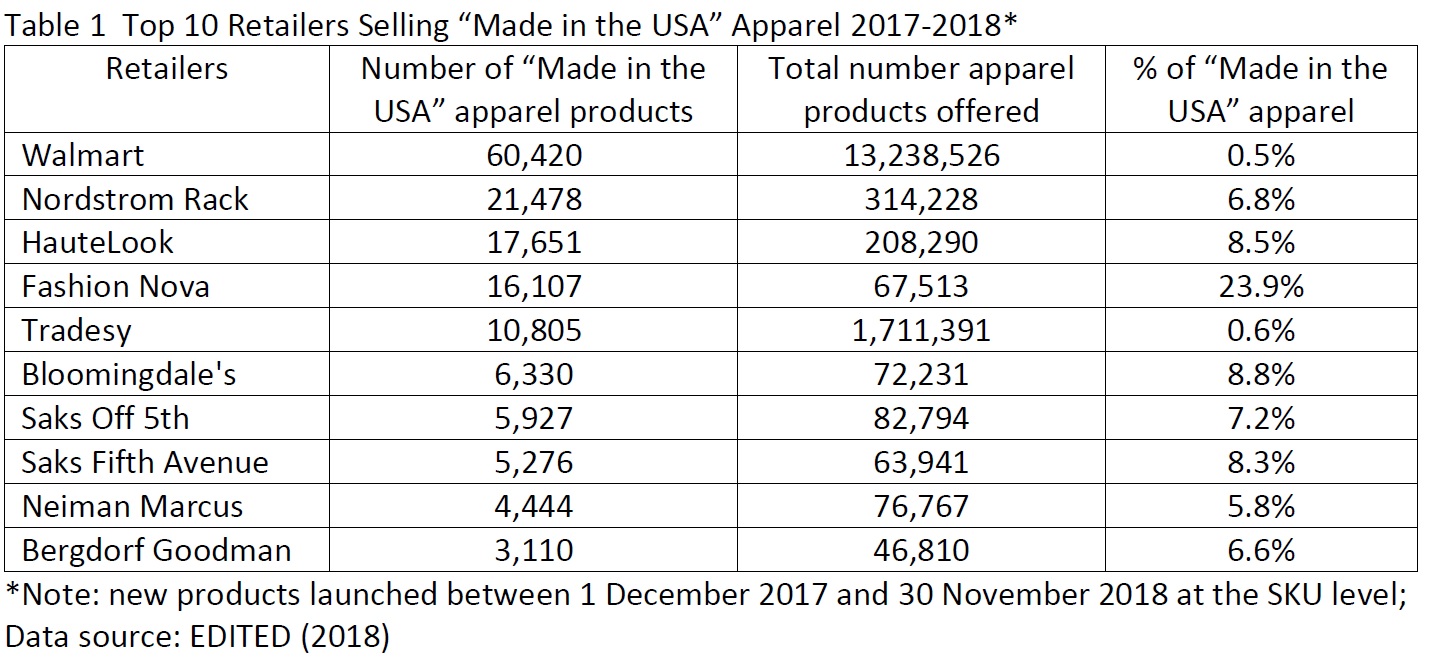
total 348 retailers (or 27 percent) sold “Made in the USA” apparel in the U.S.
market. The top 10 sellers list includes BOTH retailers that focus on the value
market such as Walmart and relatively high-end department stores such as
Bloomingdale and Saks Fifth Avenue. However, even for these top sellers, “Made
in the USA” apparel accounted for less than 8 percent of their total product
offers on average.
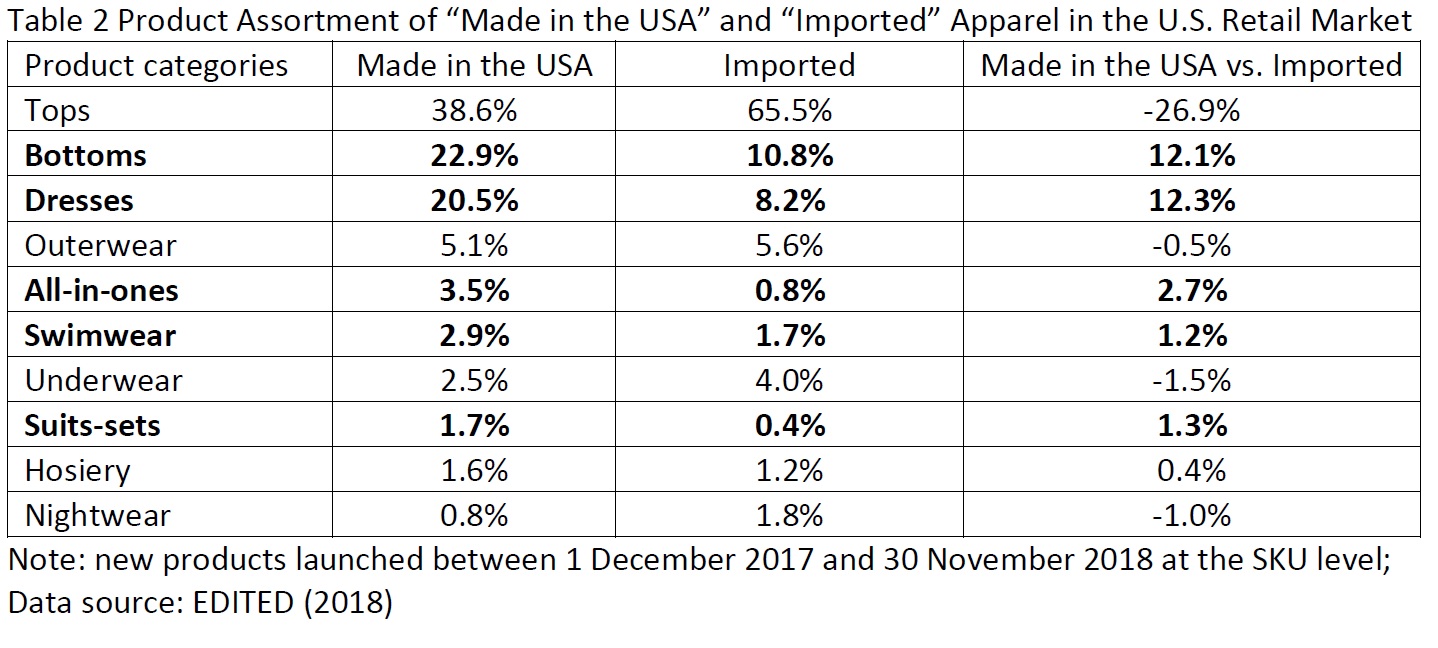
Second, U.S. fashion brands and retailers are most
likely to source“Made in the
USA” apparel for relatively fashion-oriented items, particularly bottoms (such
as skirts, jeans, and trousers), dresses, all-in-ones (such as playsuits and
dungarees), swimwear and suits-sets.
The competitive
edge for these product categories in the retail market, in general, increasingly depends on unique designs, high
product quality, and speed to market,
which makes sourcing from the United States commercially beneficial. In comparison, imported products are more concentrated
on basic fashion items often competing on price in the U.S. retail market,
including tops (such as T-shirt and polo shirt), underwear, and nightwear.
It is also interesting to note that
“Made in the USA” apparel were predominately women’s wear (92 percent), whereas imported
clothing adopted a more balanced gender combination (63 percent women’s wear
and 37 percent men’s wear). Because the fashion trends for women’s wear usually
are shorter-lived and harder to predict, this result once again indicates that seeking
quick response and shorter lead time for stylish and trendy items could be an
important incentive for local sourcing by U.S. fashion brands and retailers.
Third, consistent with the common perception,
“Made in the USA” apparel overall are pricier than imported ones in the U.S.
retail market.
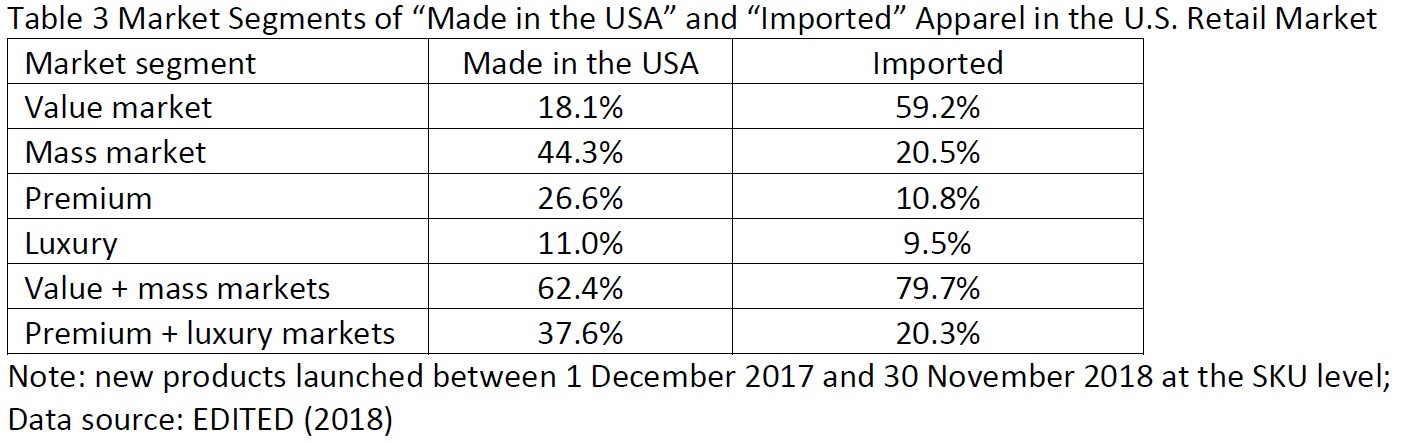
Taking the U.S.
apparel retail market as a whole, close to 40 percent of “Made in the USA” offering
in the past 12 months targeted the premium or luxury market, compared with only
20 percent of imported products. In
contrast, as few as 18 percent of “Made in the USA” offering were in the value
market, which, however, accounted for approximately 60 percent of all imported apparel
sold in the U.S. market. In totality, it
seems U.S. fashion brands and retailers are purposefully targeting “Made in the
USA” apparel for less price-sensitive segments of the market to balance the
high domestic production cost.
On the other hand, when examining
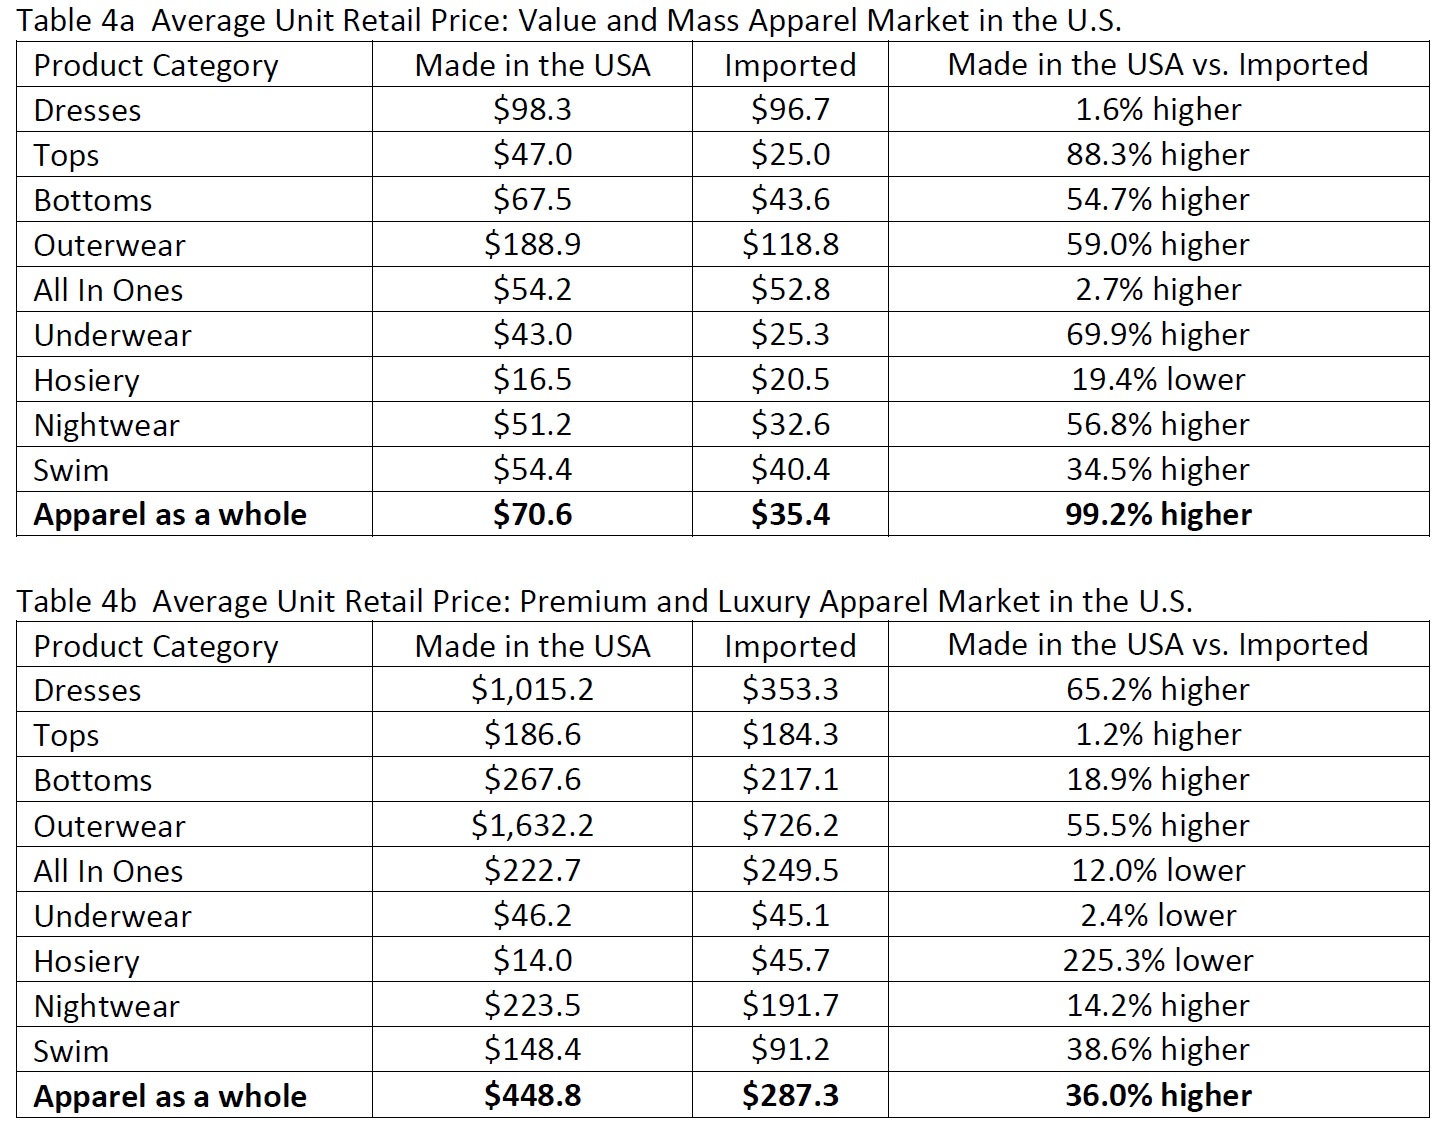
U.S. fashion brands and retailers’ pricing strategy at the product level, “Made
in the USA” clothing was still priced much higher than imported ones for almost
all major apparel categories, except hosiery. Notably, in the past 12 months, the
average unit retail price of “Made in the USA” clothing was 99.2 percent higher
than imported ones in the value and mass market and 36.0 percent higher in the
premium and luxury market. This interesting phenomenon supports the arguments that
U.S. consumers somehow are willing to pay a premium price for products with the
“Made in the USA” label.
Additionally, during the past 12
months, around 46.3 percent of “Made in the USA” apparel were sold at a
discount compared with more than 54.6 percent of imported ones. The advantage
of proximity to the market, which makes speedy replenishment for in-season items
possible, is an important factor behind the more successful control of
markdowns for “Made in the USA” products. For example, data shows that U.S.
fashion brands and retailers replenished approximately 12.7 percent of their “Made
in the USA” offering in the past 12 months but only 2.8 percent of imported
clothing.
In conclusion, the findings of this study concur with the view that “Made in the USA” apparel are still relevant today. Meanwhile, it does not seem to be the case that “Made in the USA” apparel and imported ones are necessarily competing with each other in the U.S. retail market. With apparel sourcing increasingly requiring striking a balance among various factors ranging from cost, flexibility, compliance to speed to market, it is hopeful that “Made in the USA” apparel will continue to have its unique role to play in U.S. fashion brands and retailers’ merchandising and sourcing strategies.
1: What do you see as the biggest challenges – and opportunities – facing the apparel industry in 2019, and why?
In my view, uncertainty will remain the single biggest challenge facing the apparel industry in 2019, ranging from a more volatile global economy, the unpredictable outlook of the U.S.-China trade talks to the various possible scenarios of Brexit. While uncertainty creates exciting new research opportunities for scholars like me, it could be a big headache for companies seeking a foreseeable market environment to guide their future business plan and investments.
Meanwhile, the increasing digitalization of the apparel supply chain based on big-data tools and artificial intelligence (AI) technologies means a huge opportunity for fashion companies. Indeed, the apparel industry is quickly changing in nature—becoming ever more globalized, supply-chain based, technology-intensive and data-driven. Take talent recruitment as an example. In the 2018 US Fashion Industry Benchmarking Study, which I conducted in collaboration with the US Fashion Industry Association (USFIA), as much as 68 percent of surveyed leading U.S. fashion brands and apparel retailers say they plan to increase hiring of data scientists in the next five years. Googling “apparel industry” together with terms such as “big data” and “data science” also returns much more results than in the past. It is hopeful that the advancement of digital technologies and the smarter use of data will enable apparel companies to overcome market uncertainties better and improve many aspects of their businesses such as speed to market, operational efficiency and even sustainability.
2: What’s happening with sourcing? How is the sourcing landscape likely to shift in 2019, and what can apparel firms and their suppliers do to stay ahead?
Based on my research, I have three observations regarding apparel companies’ sourcing trends and the overall sourcing landscape in 2019:
First, apparel companies overall will continue to maintain a diverse sourcing base. For example, in a recent study, we examined the detailed sourcing portfolios of the 50 largest U.S.-based apparel companies ranked by the Apparel Magazine. Notably, on average these companies sourced from over 20 different countries or regions using more than 200 vendors in 2017. Similarly, in the 2018 US Fashion Industry Benchmarking Study, which I conducted in collaboration with the US Fashion Industry Association (USFIA), we also found companies with more than 1,000 employees typically source from more than ten different countries and regions. Since no sourcing destination is perfect, maintaining a relatively diverse sourcing base allows apparel companies to strike a balance among various sourcing factors ranging from cost, speed, flexibility, to risk management.
Second, while apparel companies are actively seeking new sourcing bases, many of them are reducing either the number of countries they source from or the number of vendors they work with. According to our study, some apparel companies have been strategically reducing the number of sourcing facilities with the purpose of ensuring closer collaborations with their suppliers on social and environmental compliance issues. Some other companies are consolidating their sourcing base within certain regions to improve efficiency and maximize productivity in the supply chain. Related to this trend, it is interesting to note that approximately half of the 50 largest U.S. apparel companies report allocating more sourcing orders to their largest vendor in 2017 than three years ago.
Third, nearshoring or onshoring will become more visible. Take “Made in the USA” apparel for example. According to the 2018 U.S. Fashion Industry Benchmarking Study, around 46 percent of surveyed U.S. fashion brands and apparel retailers report currently sourcing “Made in the USA” products, even though local sourcing typically only account for less than 10 percent of these companies’ total sourcing value or volume. In a recent study, we find that 94 out of the total 348 retailers (or 27 percent) sold “Made in the USA” apparel in the U.S. market between December 2017 and November 2018. These “Made in the USA” apparel items, in general, focus on fashion-oriented women’s wear, particularly in the categories of bottoms (such as skirts, jeans, and trousers), dresses, all-in-ones (such as playsuits and dungarees), swimwear and suits-sets. The advantage of proximity to the market, which makes speedy replenishment for in-season items possible, also allows retailers to price “Made in the USA” apparel substantially higher than imported ones and avoid offering deep discounts. Looking ahead, thanks to automation technology and consumers’ increasing demand for speed to market, I think nearshoring or onshoring, including ”Made in the USA” apparel, will continue to have its unique role to play in fashion brands and retailers’ merchandising and sourcing strategies.
3: What should apparel firms and their suppliers be doing now if they want to remain competitive further into the future? What will separate the winners from the losers?
2019 will be a year to test apparel companies’ resources, particularly in the sourcing area. For example, winners will be those companies that have built a sophisticated but nimble global sourcing network that can handle market uncertainties effectively. Likewise, companies that understand and leverage the evolving “rules of the game”, such as the apparel-specific rules of origin and tariff phase-out schedules of existing or newly-reached free trade agreements, will be able to control sourcing cost better and achieve higher profit margins. Given the heavy involvement of trade policy in apparel sourcing this year, companies with solid government relations should also enjoy unique competitive advantages.
On the other hand, as apparel business is changing in nature, to stay competitive, apparel companies need to start investing the future. This includes but not limited to exploring new sourcing destinations, studying the changing consumer demographics, recruiting new talents with expertise in emerging areas, and adopting new technologies fitting for the digital age.
4: What keeps you awake at night? Is there anything else you think the apparel industry should be keeping a close eye on in the year ahead? Do you expect 2019 to be better than 2018, and why?
Two things are at the top of my watchlist:
First, what is the future of China as an apparel sourcing base? While external factors such as the U.S.-China tariff war have attracted most of the public attention, the genuine evolution of China’s textile and apparel industry is something even more critical to watch in the long run. From my observation, China is playing an increasingly important role as a textile supplier for apparel-exporting countries in Asia. For example, measured by value, 47 percent of Bangladesh’s textile imports came from China in 2017, up from 39 percent in 2005. Similar trends are seen in Cambodia (up from 30 percent to 65 percent), Vietnam (up from 23 percent to 50 percent), Pakistan (up from 32 percent to 71 percent), Malaysia (up from 25 percent to 54 percent), Indonesia (up from 28 percent to 46 percent), Philippines (up from 19 percent to 41 percent) and Sri Lanka (up from 15 percent to 39 percent) over the same time frame. A key question in my mind is how quickly China’s textile and apparel industry will continue to evolve and upgrade by following the paths of most other advanced economies in history.
Second, how will the implementation of several newly-reached free trade agreements (FTAs) affect the big landscape of apparel sourcing and the existing regional apparel supply chains? For example:
The newly-reached U.S.-Mexico-Canada Free Trade Agreement (USMCA or commonly called NAFTA2.0) includes several interesting changes to the textile and apparel specific rules of origin provisions, such as the adjustment of the tariff-preference level (TPL) mechanism. Whether these changes will boost textile and apparel production in the Western-Hemisphere and attract more sourcing from the region will be something interesting to watch.
The implementation of the Comprehensive and Progressive Agreement of the Trans-Pacific Partnership (CPTPP)and the EU-Vietnam Free Trade Agreement (EVFTA)will allow Vietnam to get access to nearly 40% of the world apparel import market (i.e., EU + Japan) duty-free. However, restrained by the country’s relatively small population, the apparel industry is increasingly facing the challenge of competing for labor with other export-oriented sectors in Vietnam. Realistically, what is the growth potential of apparel “Made in Vietnam” after the implementation of CPTPP and EVFTA?
In 2017, close to 80% of Asian countries’ textile imports came from other Asian countries, up from around 70% in the 2000s. Similarly, in 2017, 85.6% of Asian countries’ apparel imports also came from within the region. The negotiation of the Regional Comprehensive and Economic Partnership (RCEP) is likely to conclude in 2019, whose membership includes member states of the Association of Southeast Asian Nations (ASEAN) and other six economies in the Asia-Pacific region (Australia, China, India, Japan, South Korea and New Zealand). Will RCEP result in an ever more integrated Asia-based textile and apparel supply chain and make the Asia region even more competitive as an apparel sourcing destination?
On
October 16, 2018, the Trump
Administration notified U.S. Congress its intention to negotiate the
U.S.-EU Free Trade Agreement. Between
2013 and 2016, the United States and EU were also engaged in the negotiation of
a comprehensive free trade agreement– Trans-Atlantic Trade and Investment Partnership
(T-TIP) with the goal to unlock market access opportunities for
businesses on both sides of the Atlantic through the ambitious elimination of
trade and investment barriers as well as enhanced regulatory coherence. The T-TIP
negotiation was stalled since 2017, although
the Trump Administration has never officially announced to withdraw from the
agreement.
II. Negotiating Objectives
On
January 11, 2019, the Office of the U.S. Trade Representative (USTR) released
thenegotiating
objectives of the proposed U.S.-EU Free Trade Agreement after
seeking inputs from the public. Overall, the proposed agreement aims to address
both tariff and non-tariff barriers and to “achieve fairer, more balanced trade”
between the two sides.
Regarding textiles and apparel, USTR says it will secure duty-free access for U.S. textile and
apparel products and seek to improve competitive opportunities for exports of
U.S. textile and apparel products while taking into account U.S. import
sensitivities” during the negotiation. The proposed U.S.-EU free trade
agreement also will “establish origin procedures for the certification and
verification of rules of origin that promote strong enforcement, including with respect to textiles.” T-TIP
had adopted similar negotiating objectives for the textile and apparel sector.
III. Industry viewpoints on the agreement
As of
January 2019, leading trade associations
representing the U.S. apparel industry and the EU textile and apparel industries
have expressed support for the proposed U.S.-EU Free Trade Agreement. In general,
these industry associations recommend the agreement to achieve the following
goals:
First, eliminate import duties. For example:
American
Apparel and Footwear Association (AAFA): “We
support the immediate and reciprocal elimination of the high duties that both
countries maintain on textiles, travel goods, footwear, and apparel.”…” We also
support the immediate elimination of any retaliatory duties imposed by the
E.U., as well as any duties imposed by the U.S. (that led to that retaliation).
The duties impose costs on activities, including manufacturing activities in
the U.S., and undermine markets for U.S. exporters in Europe.”
European
Apparel and Textile Confederation (Euratex):“The
European Textile and Clothing sector faces high tariffs while exporting to the
US market from 11% to up to 32% for some products, namely sewing thread of
man-made filaments, suits, woven fabrics of cotton, trousers and t-shirts. Zero
customs duties while ensuring modern rules of origin will allow EU companies to
boost exports and offer more choice to American consumers and professional
buyers.”
Second, promote regulatory coherence (Harmonization). For example:
AAFA: “The E.U. and the
United States both maintain an extensive array of product safety, chemical management,
and labeling requirements regarding apparel (including legwear), footwear,
textiles, and travel goods.”…” Yet they often contain different requirements,
such as testing or certification, that greatly add compliance costs.”…” We
believe the U.S.‐E.U. trade agreement presents an important opportunity to achieve
harmonization or alignment for these regulations.”
Euratex: “Maintaining high
level of standards while eliminating unnecessary burdens, removing additional
requirements and facilitating customs procedures that impede business are top
priorities. Mutual recognition of the EU and US standards will preserve high
level of consumer protection on both sides of the Atlantic. Convergence on labelling (fibre
names, care symbols and wool labelling),
consumer safety on children products and flammability standards is key for the
T&C sector.” “EURATEX believes the EU and US standardization bodies should
cooperate on setting standards for Smart Textiles taking into account the
industry views for facilitating development and trade of such products of the
future.”
Third, adopt flexible/modern rules of origin. For example:
AAFA: “We should also support higher usage of the agreement by making sure the rules of origin reflect the realities of the industry today…”the yarn forward” rules, although theoretically promote usage of trade partner inputs, in practice they operate as significant barriers that restrict the ability of companies to use a trade agreement in many cases”…” We need to incorporate sufficient flexibilities into the rules of origin so that different supply chains –and the U.S. jobs they support – can take advantage of the agreement.”
Euratex: “Zero customs
duties while ensuring modern rules of
origin will allow EU companies to boost exports and offer more choice to
American consumers and professional buyers.”
The National Council of Textile Organizations (NCTO), which represents the U.S. textile industry, hasn’t publically stated its position on the proposed U.S.-EU Free Trade Agreement. However, NCTO had strongly urged U.S. trade negotiators to adopt a yarn-forward rule of origin in T-TIP. NCTO also opposed opening the U.S. government procurement market protected by the Berry Amendment to EU companies.
IV. Patterns of U.S.-EU textile and apparel trade
The
United States and the EU are mutually important textile and apparel (T&A)
trading partners. For example, the United States is EU’s largest extra-region
export market for textiles, and EU’s fifth largest extra-region supplier of
textiles in 2017 (Euratex, 2018).
Meanwhile,
the EU is one of the leading export markets for U.S.-made technical textiles as
well as an important source of high-end apparel products for U.S. consumers (OTEXA,
2018). Specifically, in 2017, U.S. T&A exports to the European Union
totaled $2,572 million, of which 73.2% were textile products, such as specialty
& industrial fabrics, felts & other non-woven fabrics and filament
yarns. In comparison, EU’s T&A exports to the United States totaled $4,163
million in 2017, among which textiles and apparel evenly accounted for 48.7%
and 51.3% respectively.
V. Potential economic impact of the agreement
By adopting the Global Trade Analysis Project (GTAP) model, Lu (2017) quantitatively evaluated the potential impact of a free trade agreement between the U.S. and EU on the textile and apparel sector. According to the study:
First,
the trade creation effect of the agreement will expand the EU-U.S.
intra-industry trade for textiles. Meanwhile, the agreement is likely to
significantly expand EU’s apparel exports to the United States.
Second,
the trade diversion effect of the U.S.-EU Free Trade Agreement will affect other
T&A exporters negatively, including Asia’s T&A exports to the U.S. market
and EU and Turkey’s T&A exports to the EU market.
Third, the U.S.-EU Textile and Apparel Trade might affect the intra-region T&A trade in the EU region negatively but in a limited way.
Overall, the study suggests that the EU T&A industry will benefit from the additional market access opportunities created by the U.S.-EU Free Trade Agreement.One important factor is that the U.S. and EU T&A industries do not constitute a major competing relationship. For example, the United States is no longer a major apparel producer, and EU’s apparel exports to the United States fulfill U.S. consumers’ demand for high-end luxury products. The U.S.-EU Free Trade Agreement is also likely to create additional export opportunities for EU textile companies in the U.S. market, especially in the technical textiles area, which accounted for approximately 40% of EU’s total textile exports to the United States in 2017 measured in value. Compared with traditional yarns and fabrics for apparel making purposes, technical textiles are with a greater variety in usage, which allows EU companies to be able to differentiate products and find their niche in the U.S. market.
Further, the study suggests that we shall pay more attention to the details of non-tariff barrier removal under the U.S.-EU Free Trade Agreement, which could result in bigger economic impacts than tariff elimination.
To better understand companies’ latest sourcing practices, we recently examined the detailed sourcing portfolios of the 50 largest U.S.-based apparel companies ranked by the Apparel Magazine. Specifically, we conducted a content analysis of each company’s publicly released annual reports and their financial statements from 2014 to 2017 (the latest information available), with a focus on the following two research questions: 1) How have the sourcing strategies of U.S. apparel companies evolved? 2) How have the evolving sourcing strategies affected companies’ financial performance? Here are the key findings:
First, U.S.
apparel companies overall adopt a diverse sourcing base. Among the 50
companies we examined, on average they sourced from over 20 different countries
or regions using more than 200 vendors in 2017. These results echo the findings
of the 2018 U.S. Fashion Industry Benchmarking Study released by the U.S.
Fashion Industry Association (USFIA) in July. Based on a survey of nearly 30
executives from leading U.S. fashion brands and apparel retailers, the study
also found companies with more than 1,000 employees typically source from more
than ten different countries and regions. Also, larger companies, in general,
adopt a more diverse sourcing base than smaller ones.
Second, while U.S.
apparel companies are actively seeking new sourcing bases, many of them are
reducing either the number of countries they source from or the number of
vendors they work with. Specifically, among the top 50 U.S. apparel
companies examined, around 28 percent increased the number of countries or
regions they use as sourcing bases between 2014 and 2017. However, over the
same period, 52 percent chose to consolidate their existing sources base, but
on a small scale. Likewise, among the top 50 U.S. apparel companies examined,
approximately half reduced the number of vendors they use between 2014 and
2017, compared with 33 percent that chose to source from more vendors.
Third, for risk
control purposes, most U.S. apparel companies avoid relying too much on any
single vendor; however, some companies have begun to allocate more sourcing
orders to its largest vendors. The top 50 U.S. apparel companies we
examined on average assigned no more than 10 percent of their total sourcing
value or volumes to any single vendor in 2017. This practice suggests that
minimizing supply chain risks is a critical consideration of U.S. apparel
companies’ sourcing strategy. Nevertheless, between 2014 and 2017, around 45
percent of apparel companies we examined raised the cap slightly.
Fourth, regarding the financial implications of the adjustment of sourcing strategies, companies that diversified their sourcing bases between 2014 and 2017, in general, were able to reduce sourcing cost and improve gross margin. In comparison, U.S. apparel companies we examined that consolidated their sourcing base between 2014 and 2017 suffered a slight decline in their gross margin percentage.
On the other hand, however, there was no clear pattern between a company’s choice of sourcing strategy and its net profit margin. While multiple factors could come into play, one possible explanation for the results is that either diversifying or considering the sourcing base would incur additional management costs for the company.
A recent study released by the U.S. International Trade Commission (USITC) provides a comprehensive review and valuable insights into the state of textile and apparel manufacturing in the United States. According to the study:
First, data suggests a mixed picture of the recovery of textile manufacturing in the U.S.
Total capital expenditures in plants and equipment for the textile sector increased by 36 percent in the 2013–16 period. Interesting enough, much of the new investment is by foreign firms, including new investments by Chinese and Indian firms, as well as by firms from Mexico, Canada, Turkey, and Saudi Arabia.
U.S. textile shipments increased in 2017 to $39.6 billion, but remained 3 percent below the 2013 level. The result suggests that rather than simply increasing capacity, some of the new investment is likely replacing existing equipment, as firms upgrade and modernize their manufacturing processes and/or focus their operations on different products. [Note: shipments measure the dollar value of products sold by manufacturing establishments and are based on net selling values, f.o.b. (free on board) plant, after discounts and allowances are excluded]
At $10.6 billion, U.S. textile exports in 2017 were also below the five-year high of $12.1 billion in 2014.
Employment in the textiles sector declined by 4 percent from 131,000 in 2013 to an estimated 126,000 in 2017. Meanwhile, official data on labor productivity index for yarns and fabrics show steady declines during 2013–16.
Second, some evidence suggests that reshoring has taken place in recent years in the apparel sector, although on a modest scale.
For the 2013–16 period, capital expenditures were up 5 percent to $301 million, suggesting capital investment in the apparel sector may be increasing, as the industry begins to adopt more labor-saving technologies.
Domestic shipments of apparel showed modest increases in the past two years, reaching $12.0 billion in 2016 and $12.5 billion in 2017, after a record low of $11.5 billion in 2014 and 2015.
Employment in the apparel sector steadily declined during 2013–17, down 21 percent from 145,000 workers in 2013 to 120,000 workers in 2017. Official data on labor productivity also showed steady declines during 2013–16.
U.S. fashion companies continue to source apparel from the United States, although in a relatively small amount.
Third, the advantages of making textiles and apparel in the United States include:
Advantages of producing textiles in the United States include local and state incentives for investment, and the benefits afforded by free trade agreement (FTA) preferences (i.e., the “yarn-forward” rules of origin) that encourage the use of U.S.-produced inputs in downstream production in FTA partner countries, energy cost and the availability and reliability of high-quality cotton. Meanwhile, product innovation and automation are important aspects of the U.S. textile sector’s competitiveness strategy.
Advantages of producing apparel in the United States include improved lead times, better quality control, and more flexible production. Many domestically made products also use “Made in USA” branding to capitalize on the buy-American trend and the appeal of “Made in USA.” The adoption of various automation and digital technologies to accelerate the process of product development, improve the fit of the final product and reduce the needs for skilled sewing operators may also help improve the competitiveness.
Why does the U.S. textile industry call for additional tariffs on textile and apparel imports from China whereas U.S. fashion brands and apparel retailers oppose the tariffs?
Based on the trade theories we have learned so far, why or why not would you recommend President Trump to impose 25% punitive tariffs on imports from China?
Appendix: Comments on the Proposed Section 301 Tariffs on Imports from China (August 2018)
The Bureau of Industry and Security (BIS) under the U.S. Department of Commerce recently released its assessment report of the U.S. textile and apparel (T&A) manufacturing sector. The report was based on a survey of 571 U.S. T&A manufacturers in summer 2017. These respondents include 230 textile mills (NAICS 313), 128 textile product mills (NAICS 314), and 213 apparel manufacturers (NAICS 315).
Below are the key findings of the study:
The state of the U.S. textile and apparel (T&A) manufacturing sector
U.S. T&A manufacturing has shrunk significantly: the value of T&A shipments (seasonally adjusted) in 2016 ($68 billion) was almost 56% decrease in real terms since 1995 ($153 billion).
U.S. T&A manufacturing has undergone substantial structural change: textiles and textile products accounted for 82% of the total shipments of the U.S. T&A industry as of 2016, compared to 57% in 1995. Notably, only 18% of shipments came from apparel manufacturing in 2016, compared to 43% in 1995.
U.S. T&A manufacturing sector is hiring less: Between 1990 and 2016, total employment decreased by 79%, from 1.7 million to 352,000 workers; over the same period, over 86% of apparel manufacturing jobs disappeared.
U.S. T&A manufacturers are making more capital investments: The overall total Capital Expenditures (CAPEX) of the 571 respondents increased 90 percent from 2012 to 2016 (from $1.6 billion to $3.1 billion). Particularly, the CAPEX of textile mills grew by 80 percent over that period—mostly on “Machinery, Equipment, and Vehicles.”
North Carolina hosted the largest number of U.S. T&A facilities (22 percent of the respondents), followed by Georgia (10 percent), and South Carolina (9 percent).
China, Mexico, and Canada are the most popular destinations for foreign investments by U.S. T&A manufacturers.
Competition landscape and factors
Respondents listed a total of 1,309 U.S. competitors and 552 non-U.S. competitors. Chinese companies were cited as the number one source of foreign competition.
“Quality,” “Lead Time,” and “Innovation” were the top three competitive advantages of U.S. T&A manufacturers as they related to foreign competition. “Labor Costs” was regarded as the top disadvantage of U.S. T&A manufacturing.
43 percent of respondents believed that reshoring was occurring in U.S. T&A manufacturing. Almost all of these respondents believed that “Shorter Lead Times” and the “Marketability of the ‘Made in USA’ Label” were the factors driving the trend.
The Affordable Care Act (ACA), Minimum Wage regulations (Federal, State, and Local), and U.S. Trade Policy were the top governmental regulations and provisions cited as negatively impacting the competitiveness of U.S. T&A manufacturers.
61 percent of respondents reported that they had difficulties hiring and/or retaining employees for their T&A operations, specifically production line workers such as operators and machine technicians. The skill gaps in the labor market for those positions were by far the biggest ones identified for the industry.
43 percent of respondents believed that reshoring was occurring in T&A manufacturing (i.e., the practice of transferring a business operation that was moved to a non-U.S. location back to the United States.) Textile manufacturers were more likely to be aware of reshoring.
Trade and U.S. textile and apparel manufacturing
On average, respondents say 48 percent of their textile and textile products are “100 percent made in the U.S.”, while for apparel it was around 54 percent.
U.S. T&A exports dropped 10 percent between 2012 and 2016, from $2.2 billion to $1.98 billion. On average, exports accounted for only 12 percent of respondents’ total sales.
33 percent of respondents considered themselves to be dependent on foreign sources for supplies, which was highest among textile mills.
37 percent of respondents reported that they considered themselves to be dependent on non-U.S. sourcing for their machinery or equipment.
Berry Amendment and U.S. textile and apparel manufacturing
For textile mills, an average of 12 percent of U.S. output was Berry Amendment-related; for textile product mills the average was 21 percent, and for apparel production, it averaged 26 percent. 67 percent of respondents believed that the Berry Amendment had a positive impact on their organization’s business.
The Office of U.S. Trade Representative (USTR) announced that the United States and Mexico have “reached a preliminary agreement in principle” to update the 24-year old North American Free Trade Agreement (NAFTA). According to USTR, compared with the existing NAFTA, the new deal will
strengthen the labor and environmental protection provisions
provide stronger and more effective protection and enforcement of intellectual property right protection
reduce various non-tariff barriers facing U.S. agriculture exports
include new rules of origin and origin procedures for autos (including requiring 75 percent of auto content be made in the United States and Mexico AND 40-45 percent of auto content be made by workers earning at least $16 per hour.)
include new chapters dealing with digital trade and textiles
include a 16-year “sunset period” with a review every six years, at which time the parties can renew the deal for another 16 years.
Specifically for the textile and apparel sector, USTR said that “The new provisions on textiles incentivize greater United States and Mexican production in textiles and apparel trade, strengthen customs enforcement, and facilitate broader consultation and cooperation among the Parties on issues related to textiles and apparel trade.” More specifically, the new textile chapter in renegotiated NAFTA will:
1) Promote greater use of Made-in-the-USA fibers, yarns, and fabrics by limiting rules that allow for some use of non-NAFTA inputs in textile and apparel trade; and requiring that sewing thread, pocketing fabric, narrow elastic bands, and coated fabric, when incorporated in apparel and other finished products, be made in the region for those finished products to qualify for trade benefits. “
2) Include textile-specific verification and customs cooperation provisions that provide new tools for strengthening customs enforcement and preventing fraud and circumvention.
Based on USTR’s statement, it is likely, although not confirmed, that the US-Mexico deal will allow more limited tariff preference level (TPL) than the existing NAFTA.
USTR’s statement also said that the new deal would be subject to “finalization and implementation,” and its relationship with NAFTA remain unclear. The statement did not mention anything about Canada, another NAFTA member, either. Interesting enough, when announcing the US-Mexico deal in front of the press, President Trump said “I will terminate the existing deal (NAFTA). When that happens, I can’t quite tell you; it depends on what the timetable is with Congress. But I’ll be terminating the existing deal and going into this deal. We’ll start negotiating with Canada relatively soon.”
In a statement released on the same day, the American Apparel and Footwear Association (AAFA) said it welcomed the conclusion of bilateral talks with Mexico on NAFTA and emphasized the need for Canada to be a part of any final agreement: “The conclusion of talks between the U.S. and Mexico is a positive step in the NAFTA negotiations, however, it is essential that the updated agreement remain trilateral. At the same time, we encourage the administration to share the details of the agreement so the business community can inspect the impact on North American supply chains and share feedback with the administration and Congress…Any update to the agreement must continue to support these American jobs, promote trade linkages, and be seamlessly implemented to be considered a success. It is with this in mind that we are deeply concerned to hear any mention of withdrawal or termination of the existing agreement at this late stage.”
According to Inside U.S. Trade, the National Council of Textile Organizations (NCTO)which represents the U.S. textile industry says it is “encouraged by the information released by USTR with respect to strengthening the rules of origin for textiles and apparel in the announced agreement with Mexico. U.S. talks with Canada are still ongoing, however, and NCTO will wait to review the text of any final agreement before issuing a more detailed statement on the negotiation outcome.”
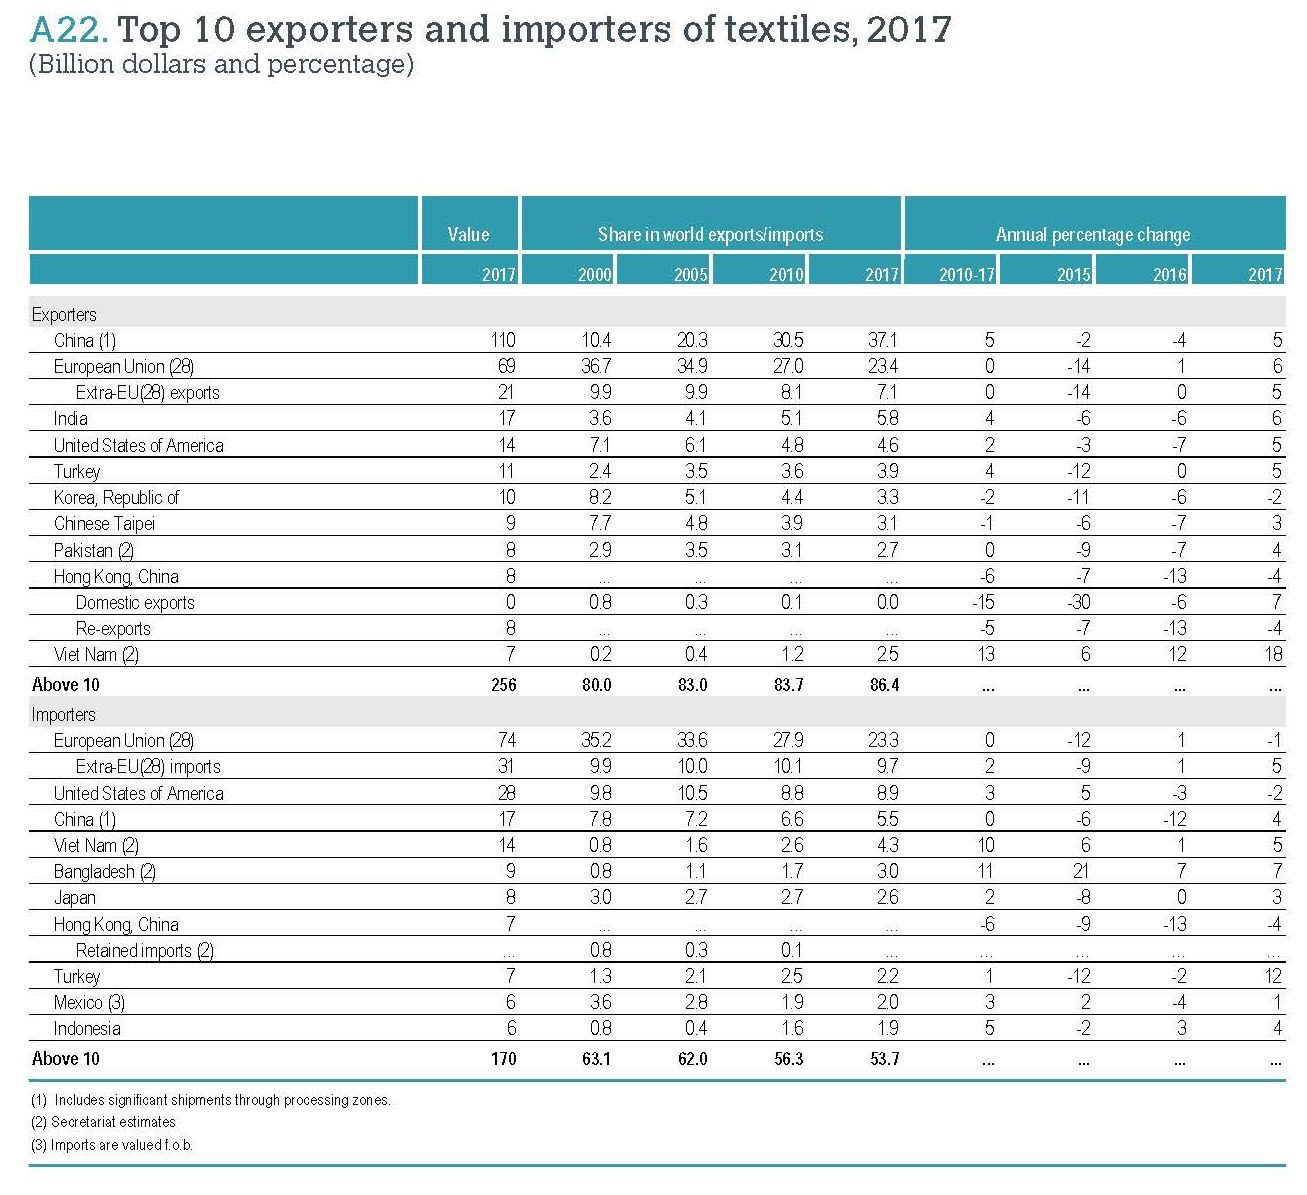
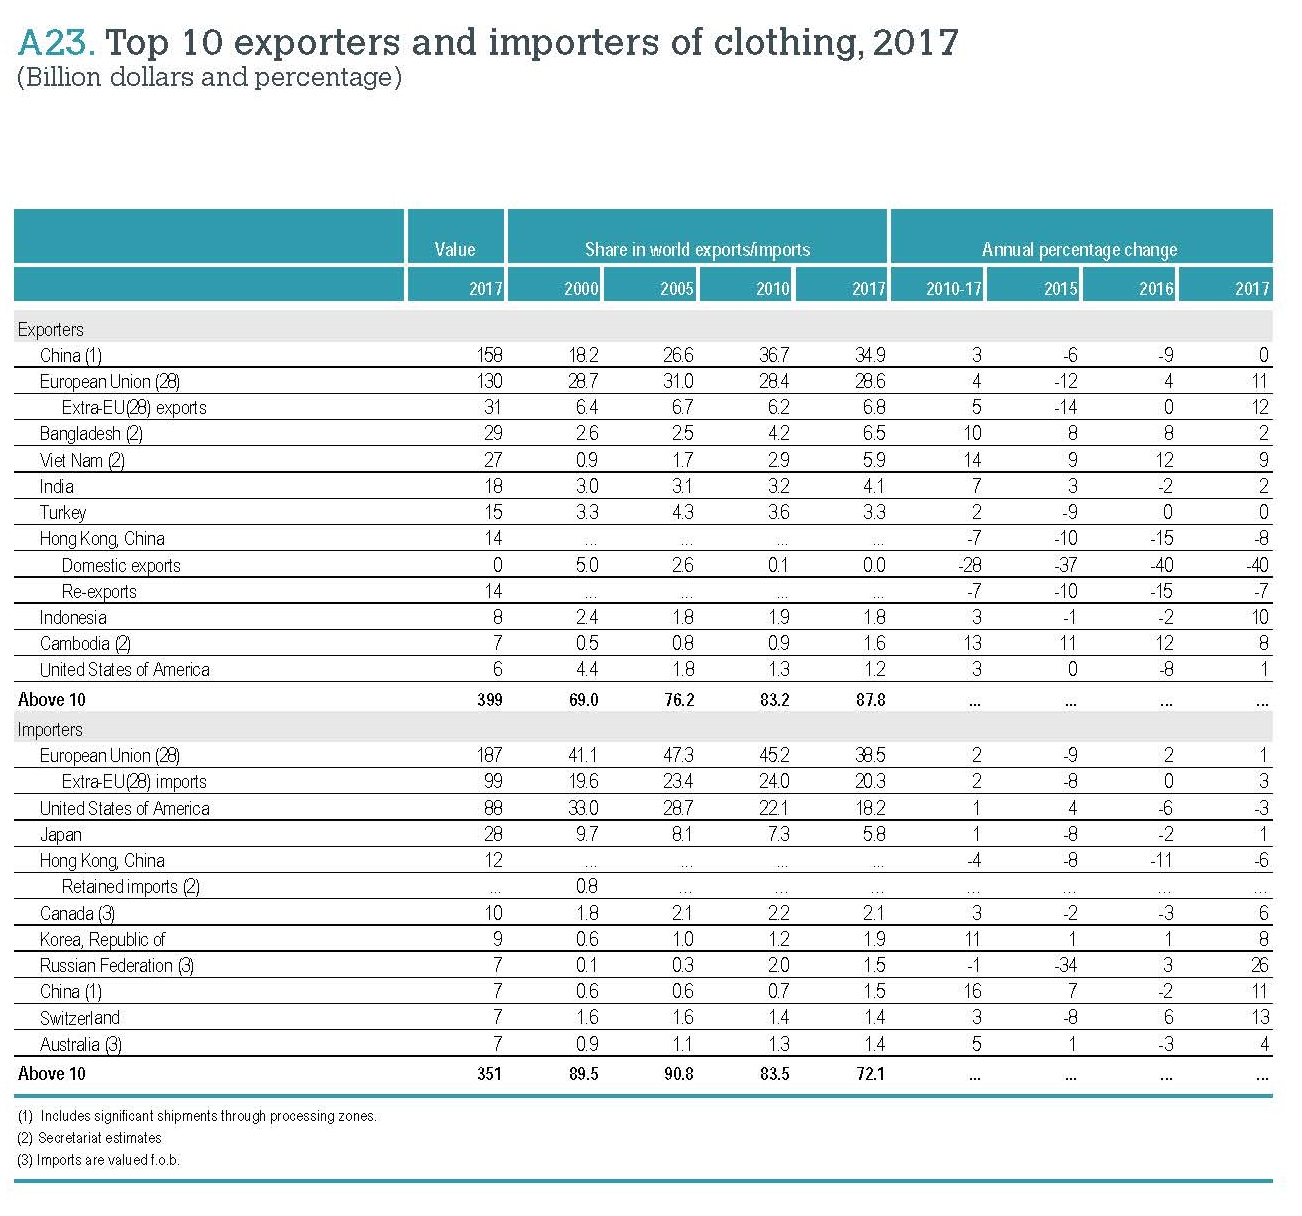
According to the newly released World Trade Statistical Review 2018 by the World Trade Organization (WTO), the current dollar value of world textiles (SITC 65) and apparel (SITC 84) exports totaled $296.1bn and $454.5bn respectively in 2017, increased by 4.2% and 2.8% from a year earlier. This is the first time since 2015 that the value of world textile and apparel exports enjoyed a growth.
Textiles and apparel are not alone. Driven by rising demand for imports globally, the current dollar value of world merchandise exports also grew by 4.7% in 2017–its most robust growth in six years, to reach $17.43 trillion. Particularly, the ratio of trade growth to GDP growth finally returned to its historic average of 1.5, compared to the much lower 1.0 ratio recorded in the years following the 2008 financial crisis.
China, European Union (EU28), and India remained the world’s top three exporters of textiles in 2017. Altogether, these top three accounted for 66.3% of world textile exports in 2017, up from 65.9% in 2016. All the top three also enjoyed a faster-than-average export growth in 2017, including 5.0% of China, 5.8% of EU(28) and 5.9% of India. The United States remained the world’s fourth top textile exporter in 2017, accounting for 4.6 percent of the shares, the same as a year earlier.
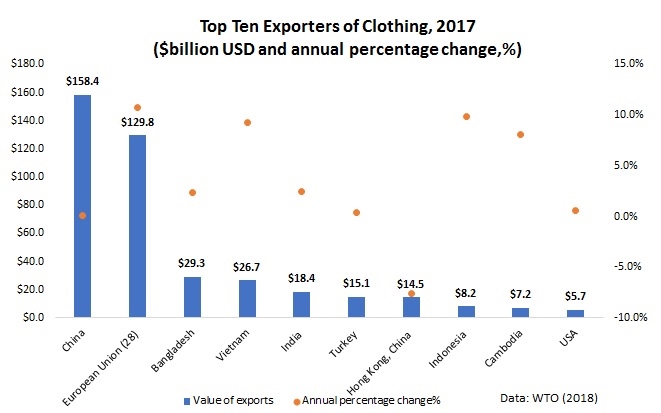
Regarding apparel, China, the European Union (EU28), Bangladesh and Vietnam unshakably remained the world’s top four largest exporters in 2017. Altogether, these top four accounted for as much as 75.8% of world market shares in 2017, which was higher than 74.3% a year earlier and a substantial increase from 68.3% back in 2007.
Continuing with the emerging trend in recent years, China is exporting less apparel and more textiles to the world. Notably, China’s market shares in world apparel exports fell from its peak—38.8% in 2014 to a record low of 34.9% in 2017. Meanwhile, China accounted for 37.1% of world textile exports in 2017, which was a new record high. It is important to recognize that China is playing an increasingly critical role as a textile supplier for many apparel-exporting countries in Asia.Measured by value, 47% of Bangladesh’s textile imports came from China in 2017, up from 39% in 2005. We observe similar trends in Cambodia (up from 30% to 65 %), Vietnam (up from 23 % to 50 %), Pakistan (up from 32 % to 71 %), Malaysia (up from 25 % to 54 %), Indonesia (up from 28 % to 46 %), Philippines (up from 19 % to 41 %) and Sri Lanka (up from 15 % to 39 %) over the same period.
Business challenges facing U.S. fashion companies: Protectionism is the top challenge for the U.S. fashion industry in 2018. More companies worry about increases in production or sourcing cost, too. For the second year in a row, “protectionist trade policy agenda in the United States” ranks the top challenge for U.S. fashion companies in 2018.
Industry outlook:Despite concerns about trade policy and cost, executives are more confident about the five-year outlook for the U.S. fashion industry in 2018 than they were a year ago, although confidence has not fully recovered to the level seen in 2015 and 2016. In addition, 100 percent of respondents say they plan to hire more employees in the next five years, compared with 80-85 percent in previous studies; market analysts, data scientists, sustainability/compliance related specialists or managers, and supply chain specialists are expected to be the most in-demand.
U.S. fashion companies’ sourcing strategy: When it comes to sourcing, diversification is key for many companies.
Most respondents continue to maintain a diverse sourcing base, with 60.7 percent currently sourcing from 10+ different countries or regions, up from 57.6 percent in 2017.
Larger companies, in general, continue to be more diversified than smaller companies.
Reflecting the U.S. fashion industry’s growing global reach, respondents report sourcing from as many as 51 countries or regions in 2018, the same as in 2017. Asia as a whole continues to take the lead as the dominant sourcing region. Meanwhile, with the growing importance of speed-to-market and flexibility, the Western Hemisphere is becoming an indispensable sourcing base.
Keeping a relatively diverse sourcing base will remain a key element of U.S. fashion companies’ sourcing strategy. Nearly 80 percent of respondents plan to source from the same number of countries, or more countries, in the next two years. However, respondents are equally divided on whether to increase or decrease the number of suppliers they will work with.
“China plus Vietnam plus Many” has become an ever more popular sourcing model among respondents. And this model is evolving as companies further diversify their China production. In particular, China now typically accounts for only 11-30 percent of companies’ total sourcing value or volume, compared with 30-50 percent in the past.
Although China’s position as the top sourcing destination is unshakable, companies are actively seeking alternatives to “Made in China.” This does not seem to be due to concerns about cost, but rather the worries about the escalating U.S.-China trade tensions.
Benefiting from the diversification away from China, Vietnam and Bangladesh are expected to play a bigger role as apparel suppliers for the U.S. market in the near future.
Rules of origin and the utilization of trade agreements for sourcing: Rules of origin, and exceptions to the rules of origin, significantly impact whether companies use free trade agreements (FTAs) and trade preference programs for sourcing.
While FTAs and trade preference programs remain largely underutilized by U.S. fashion companies, more companies are using NAFTA (65 percent), CAFTA-DR (58 percent) and AGOA (50 percent) than in the past two years.
Still, it’s concerning that companies often do not claim the duty-free benefits when sourcing from countries with FTAs or preference programs. Companies say this is primarily due to the strict rules of origin.
Exceptions to the “yarn-forward” rules of origin, including tariff preference levels (TPLs), commercial availability/short supply lists, and cumulation, are priorities for respondents; 48 percent say they currently use these mechanisms for sourcing. These exceptions provide critical flexibilities that make companies more likely to use FTAs and source from FTA regions.
NAFTA: U.S. fashion companies call for a further reduction of trade barriers and urge trade negotiators to “do no harm” to NAFTA, the most-utilized free trade agreement by respondents.
Respondents predominantly support initiatives to eliminate trade barriers of all kinds, from high tariffs to overcomplicated documentation requirements, to restrictive rules of origin in NAFTA and future free trade agreements.
More than half of respondents explicitly say NAFTA is important to their business—and they have grave concerns about the uncertain future of the agreement.
Sourcing in sustainable and socially compliant ways: Overall, U.S. fashion companies are making more commitments to sustainability and social responsibility.
85 percent of respondents plan to allocate more resources for sustainability and social compliance in the next two years, in areas including providing training to suppliers and internal employees, adding more employees, and working more closely with third-party certification programs on sustainability and social compliance. However, the availability of operational budget remains the primary hurdle for companies that want to do more.
100 percent of respondents map their supply chains (i.e., keep records of name, location, and function of suppliers), up from 90 percent in 2017. Over 80 percent of respondents track not only Tier 1 suppliers (i.e., factory where the final product is assembled), but also Tier 2 suppliers (i.e., subcontractors or major component suppliers, such as fabrics). However, it’s less common for companies to map Tier 3 (i.e., yarn spinners, finding and trimming suppliers) and Tier 4 suppliers (i.e., raw materials suppliers, such as cattle/pig hides, rubber, cotton, wool, goose down, minerals/metals and chemicals).
100 percent of respondents audit their suppliers for issues including building safety, fire safety, and treatment of workers. The vast majority of respondents (96 percent) currently use third-party certification programs to audit, with both announced and unannounced audits.
The US Fashion Industry Benchmarking Study from 2014 to 2017 can be downloaded from HERE
The picture above: Shannon Brady, Junior, UD Fashion Merchandising Major (Fourth one from the left in the front row) visited Cotton Inc together with other Cotton Student Ambassadors.
Question: What is the CottonWorks™ Ambassador program about and what is your role as an ambassador?
The CottonWorks™ ambassador program is a program where students in fashion and apparel related majors get to promote CottonWorks™ on their college campuses. Ambassadors are charged with helping faculty and students understand the resources available through CottonWorks™ as well as promote this resource through social media. This semester there are twelve ambassadors (including myself) from 12 different schools across the country.
My role as an ambassador is to raise awareness about CottonWorks™ on campus as it is a new program here at the University of Delaware. In January of this year, I had the opportunity to visit the Cotton Incorporated Headquarters in Cary, North Carolina. I, along with other CottonWorks™ ambassadors participated in an all-day CottonWorks™ training as well as a tour of the production facilities at Cotton Incorporated. I got to see everything from raw cotton to state-of-the-art laser finished denim. It was a unique experience and such a cool way to see the material I learned about in class come to life.
Question: Cotton Incorporated recently launched a new CottonWorksTMprogram to help industry professionals and emerging professionals (like our FASH students) know more about cotton. Can you give us an overview of the program, particularly the learning resources related to the sourcing of cotton products?
CottonWorks™ is a free website where students and professionals can access a multitude of resources about cotton and the fashion and apparel industry. The site offers many learning resources. Detailed guides are offered on topics such as sourcing and manufacturing, retail and marketing, fabric and technology, fashion and trend, and sustainability. These topics really apply to the fashion curriculum at UD. Additionally, the site offers a mobile-friendly textile encyclopedia where students can look up any textile related word anytime, anywhere.
However, the site offers more than just learning resources. CottonWorks™ is a great supplemental learning tool, but the site also offers emerging professionals ways to get engaged with their industry. Free webinars and workshops are offered through the website and are a great way to engage with industry professionals and learn about the issues pressing the industry right now. Their next webinar is on Tuesday 24 April 2018 registration is open on the CottonWorks™ website, and the topic of discussion is Cotton’s Biodegradability in Aquatic Environments.
Particularly regarding learning resources on sourcing cotton products, the sources and manufacturing topic on the website offers dozens of guides all kinds of cotton products, ranging from denim to cotton nonwovens.
Last but not the least, the Executive Cotton Update and Monthly Economic Letter, both posted every month at cottonworks.com/news are great resources for students and industry professionals interested in knowing what is happening in the U.S. and world cotton industry.
Question: Developing a sustainable supply chain is critical for the textile and apparel industry. So how is cotton related to sustainability? What are the facts important to know?
Cotton Incorporated is committed to being at the forefront of cotton sustainability, and the CottonWorks™ site offers many resources on how cotton is related to sustainability, including guides on responsible cotton production and manufacturing because sustainability happens throughout the lifecycle of cotton.
Cotton is a natural fiber, unlike some manmade fibers such as polyester it can biodegrade. If you log on to CottonWorks™ website you can view a recap of their webinar last month that went in depth about cotton’s biodegradability in soil and septic environments.
Additionally, CottonWorks™ has information on campaigns such as Cotton LEADS™ and Blue Jeans Go Green™ to promote the sustainability of cotton. Cotton LEADS™ is a joint program with Australia and the United States that supports a reliable and responsible cotton supply chain through five core principles of sustainability, use of best practices and traceability in the supply chain. Blue Jeans Go Green™ initiative collects denim sent to landfills and recycles it in partnership with Bonded Logic Inc. You can learn more about both these initiatives on the CottonWorks™ site at cottonworks.com/topics/sustainability.
Question: What are the opportunities for our FASH and UD students to get involved with CottonWorks™ and learn more about cotton?
Students can get started today! By registering for a free account on cottonworks.com, they have access to all of the amazing resources I touched on and many more. Additionally, they can follow @cotton_works on Instagram and Twitter to learn more about cotton and get cotton inspiration for their projects.
I will also be hosting a tabling event where students can learn more about these resources, talk to me, and win free food and prizes on Thursday 19April 2018 in Perkins! There will be more tabling events in the future that I will be posting about in my social media as well.
#1 How do rules of origin (RoO) and free trade agreement (FTA) regulations affect speed to market in apparel sourcing? Do countries who are part of an FTA find it to be easier to get to market in a shorter amount of time if they are working with other FTA members? Or could RoO slow down the production process because producers have to be more careful about compliance with the complicated RoO?
#2 Why or why not the “yarn forward” rules of origin remains an effective way to promote textile and apparel production in the Western-Hemisphere? What other options are available to improve the competitiveness of the Western-Hemisphere textile and apparel supply chain?
#3 What would happen to the Western-Hemisphere textile and apparel supply chain should NAFTA no longer exist?
#4 Should NAFTA be responsible for the loss of US apparel manufacturing jobs? Any hard evidence?
#5 If you were U.S. trade negotiators, what would you do with TPL in NAFTA given the competing views from the U.S. textile industry and U.S. fashion brands and retailers?
The Outlook of “Factory-Asia”
#6 From the perspective of the U.S. textile and apparel industry, is it a good idea for the United States to reach free trade agreement (FTA) with Asian countries? If so, what countries should be included in the new FTA? If not, why?
#7 How can U.S. companies get involved in the Asia-based textile and apparel supply chain?
#8 Why or why not is the “Flying geese model” unique to Asia? Can the model be replicated in America too?
(Welcome to join our online discussion. Please mention the question number in your reply)