COVID-19 and U.S. Apparel Imports (Updated: May 2020)

3

2

The latest statistics from the Office of Textiles and Apparel (OTEXA) show that the negative impact of COVID-19 on U.S. apparel imports deepened in March 2020. Specifically:

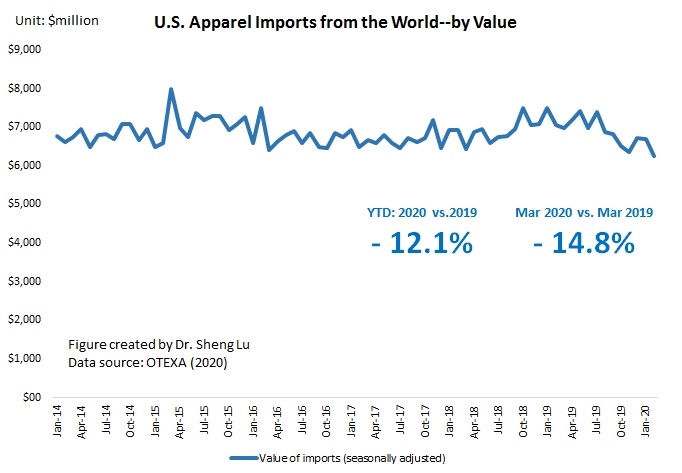
  • The value of U.S. apparel imports sharply decreased by 14.8% in March 2020 from a year ago. Between January and March 2020, the value of U.S. apparel imports decreased by 12.1% year over year, which has been worse than the performance during the 2008-2009 global financial crisis (down 11.8%).
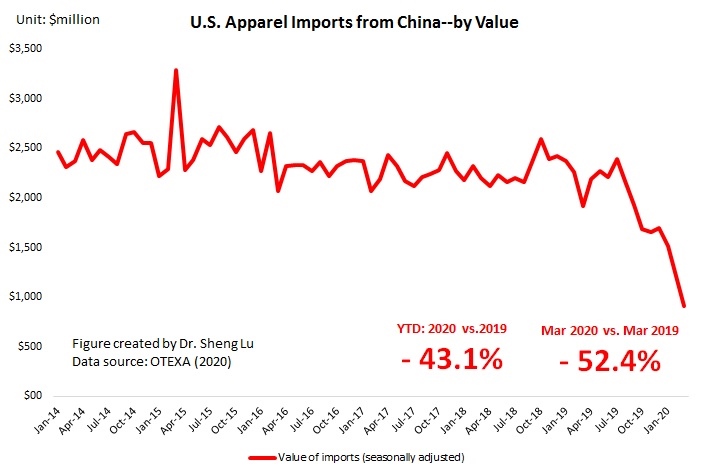
  • As the first country took a hit by COVID-19, China’s apparel exports to the United States continue to deteriorate—its value decreased by as much as 52.4% in March 2020 compared with a year ago (and -43.1% drop year to date in 2020). This result is also worse than the official Chinese statistics, which reported an overall 20.6% drop in China’s apparel exports in the first quarter of 2020.

Marh1

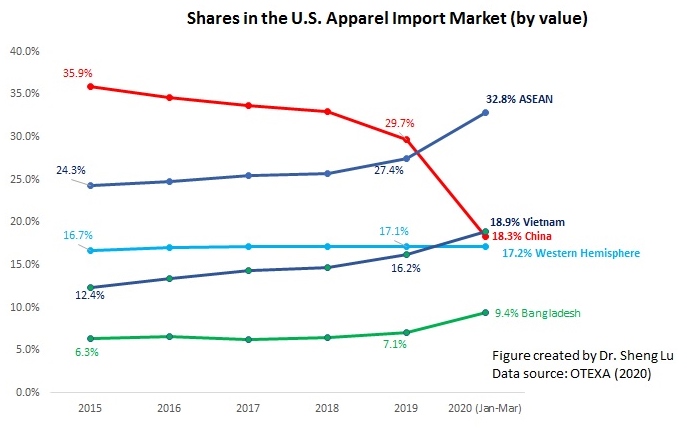
  • For the first time in history, Vietnam surpassed China and became the top apparel supplier to the U.S. market in March 2020. Notably, China’s market shares in the U.S. apparel import market dropped to only 11% in March 2020 (and 18.3% year to date in 2020), a new record low in history (was 30% in 2019). However, it should be noted that long before COVID-19, U.S. fashion brands and retailers have begun to reduce their exposure to sourcing from China, especially since October 2019 due to concerns about the US-China tariff war.

7

  • China’s lost market shares have been picked up mostly by other Asian suppliers, particularly Vietnam (18.9% YTD in 2020 vs. 16.2% in 2019) and Bangladesh (9.4% YTD in 2020 vs.7.1% in 2019). However, no clear evidence has suggested that U.S. fashion brands and retailers are giving more apparel sourcing orders to suppliers from the Western Hemisphere. In the first three months of 2020, still, only 10.3% of U.S. apparel imports came from CAFTA-DR members (no change from 2019) and 4.4% from NAFTA members (down from 4.5% in 2019).

8

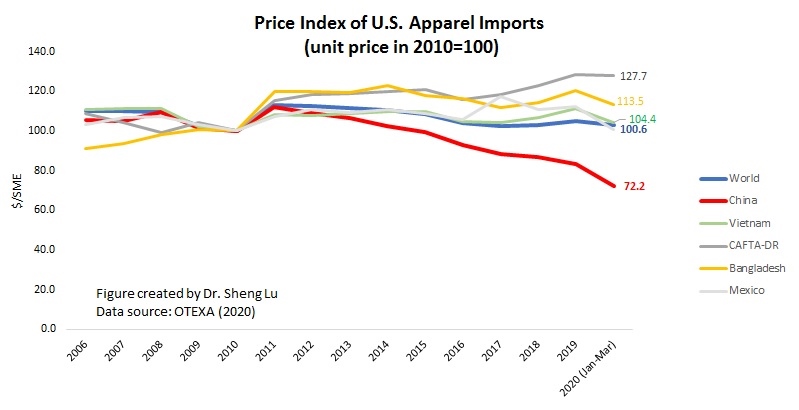
  • The unit price of U.S. apparel imports remains relatively stable. The price index (2010=100) in the first three months of 2020 was 103 compared with 104.7 in 2019. However, as a reflection of weak demand, the price index of U.S. apparel imports from China substantially dropped to 72.2 Year to Date in 2020 compared with 83.5 in 2019.

The discussion is closed for this post.

USITC Report: U.S. Apparel Sourcing under African Growth and Opportunity Act (AGOA)

Untitled

A newly released study by the U.S. International Trade Commission (USITC) suggests that the African Growth Opportunity Act (AGOA) and its “third-country fabric provision” are critical for U.S. apparel sourcing from sub-Saharan Africa (SSA). Specifically:

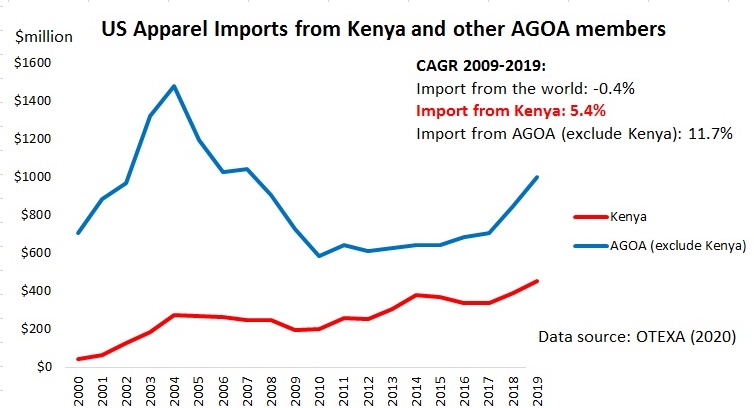
U.S. apparel imports from SSA grew faster than the world average. During 2016–19, U.S. apparel imports from SSA enjoyed a compound annual growth rate (CAGR) of 11.8 percent (compared with 1.3 percent CAGR of all countries), from $1.0 billion in 2016 to $1.4 billion in 2019. However, SSA overall remained a small apparel supplier to the U.S. market, accounting for only 1.7 percent of the market shares in 2019 (lower than 2.7 percent in 2004, but was a record high since 2015).
U.S. apparel imports from SSA remain uneven across countries. The five SSA countries–Kenya, Lesotho, Madagascar, Mauritius, and Ethiopia altogether accounted for almost 95 percent of all apparel imported from the SSA region under AGOA. The growth of U.S. apparel imports from Ethiopia was particularly fast (86.4% CAGR during 2016-2019), thanks to the country’s industrial parks and its increased use of AGOA benefits. Several global brands such as H&M, Calvin Klein, and Tommy Hilfiger currently source apparel from garment factories located in these industrial parks.

The USITC report suggests that the duty-free preferences awarded under AGOA and the liberal rules of origin available for apparel under the “third-country fabric provision”* are the key competitive advantages of SSA serving as an apparel sourcing destination for U.S. companies. Due to limited yarn and fabric production in SSA, the third-country fabric provision remained critical for SSA exports of apparel to receive duty-free entrance to the United States. Notably, nearly all U.S. imports of apparel from SSA countries entered under AGOA (98 percent). Of these imports, virtually all of them (95.8 percent) used the third-country fabric provision in 2018.

Further, the USITC report used Madagascar as an example to illustrate the significance of AGOA and its third-country fabric provision in particular to SSA countries’ apparel exports to the United States. As noted by USITC:

  • Madagascar was evidenced by the sharp decline in its apparel exports to the U.S. after the country lost its AGOA eligibility in 2009. Without duty-free access to the United States, the average duty rate for U.S. imports of apparel from Madagascar rose to 19.6 percent, and apparel exports to the United States from Madagascar fell from over $211 million in 2009 to only $40 million in 2011.
  • Madagascar’s AGOA benefits were reinstated in 2014. Just in two years, U.S. apparel imports from Madagascar bounced back to one-half of the 2009 level. In 2019, U.S. apparel imports from Madagascar totaled $243 billion, a new record high since 2015.

The USITC report mentioned several factors that are encouraging more U.S. apparel sourcing from SSA. For example:

  • U.S. fashion companies’ sourcing diversification strategy
  • U.S. fashion companies’ rising emphasis on corporate social responsibility (CSR) in sourcing
  • Deepened regional economic integration among SSA countries through regional trade arrangements such as the African Continental Free Trade Area

However, it remains a concern that SSA countries are lack of genuine competitiveness as apparel sourcing destinations. According to the USITC report, SSA countries’ current competitive advantage in apparel “comes solely through the cutting of tariffs on apparel to zero, since the apparel sectors of Bangladesh, Vietnam, and China are more cost-competitive than those of SSA countries. The current competitive advantage that SSA countries have in the apparel sector will decline significantly if AGOA expires in 2025. The uncertainty about AGOA renewal will likely discourage U.S. FDI in the SSA apparel sector.”

Related, as quoted by the USITC report, according to the 2019 Fashion Industry Benchmarking Study, almost half of the surveyed U.S. fashion companies expressed hesitancy about investing in the SSA region due to the temporary nature of AGOA. Moreover, long lead times, lack of infrastructure, and high logistical costs continue to deter apparel retailers from investing in the AGOA region.

*About the African Growth and Opportunity Act (AGOA)

The African Growth and Opportunity Act (AGOA) is a non-reciprocal trade agreement enacted in 2000 that provides duty-free treatment to US imports of certain products from eligible sub-Saharan African (SSA) countries. AGOA intends to promote market-led economic growth and development in SSA and deepen US trade and investment ties with the region.

Because apparel production plays a dominant role in many SSA countries’ economic development, apparel has become one of the top exports for many SSA countries under AGOA. Particularly, the “third-country fabric provision” under AGOA allows US apparel imports from certain SSA countries to be qualified for duty-free treatment even if the apparel use yarns and fabrics produced by non-AGOA countries/regions (such as China, South Korea, and Taiwan). This special rule is deemed as critical because most SSA countries still have no capacity in producing capital and technology-intensive textile products.

On 29 June 2015, the Obama Administration signed a new bill to extend the AGOA (including the third-country fabric provision) for another ten years (until 30 September 2025). The new law simplifies the AGOA rules of origin; gives the president the ability to withdraw, suspend or limit benefits (rather than just terminate eligibility) if designated AGOA countries do not comply with the eligibility criteria; adds notification and reporting requirements; and improves transparency and participation in the AGOA review process.

About the “Third-Country Fabric” provision under AGOA

This is a “Special Rule” for lesser-developed SSA countries (LDCs) under AGOA. According to the rule, these SSA LDCs can enjoy duty-free and quota-free access to the U.S. market for apparel made from yarns and fabrics originating from anywhere in the world. In comparison, most U.S. free trade agreements require the more restrictive “yarn-forward” rules of origin.

Related reading: Challenges facing Sub-Saharan Africa (SSA) as an Apparel Sourcing Base

COVID-19 and the Fashion Apparel Industry (updated April 2020)

FR_Blog_COVID_GarmentWorkers

It comes with no surprise that the fashion apparel industry has changed drastically in light of the novel coronavirus (COVID-19).

  • According to the latest statistics released by the U.S. Census Bureau, hit by COVID-19, the value of U.S. clothing and clothing accessories sales went down by 50.5% in March 2020, compared with a year earlier.
  • According to a recent NPR news report, in Bangladesh, the world’s second-largest garment exporter, about one million garment workers have lost their jobs as a direct result of sourcing changes. An online survey of Bangladesh employers, administered between March 21 and March 25, 2020, indicates that 72.4% of furloughed workers have been sent home without pay, and 80.4% of dismissed workers have not received severance pay.
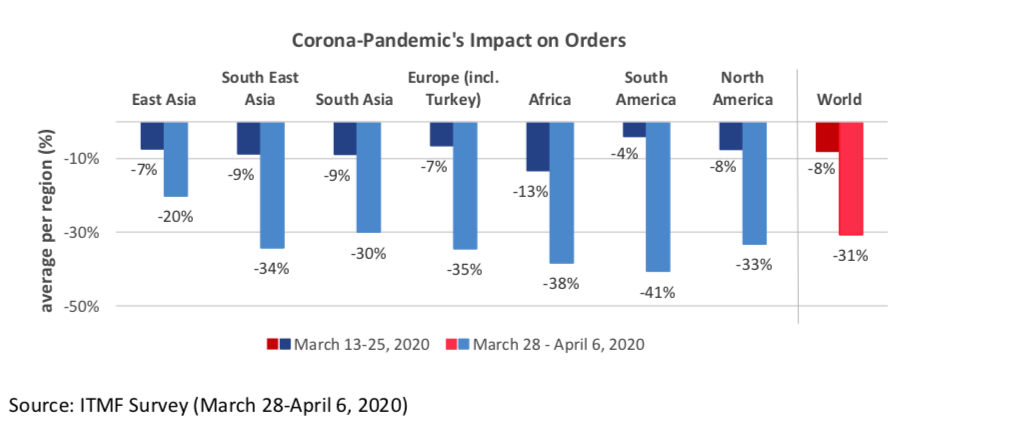
  • A survey of 700 companies conducted by the International Textile Manufacturers Federation (ITMF) between 28 March and 6 April 2020 shows that companies in all regions of the world suffered significant numbers of cancellations and/or postponements of orders. Globally, current orders dropped by 31% on average. The severity of the decrease ranges from 20.0% in East Asia to 41% in South America.

Screenshot 2020-04-08 at 08.01.40

  • According to a newly created COVID-19 Tracker developed by the Worker Rights Consortium, it is concerning that many large-scale fashion brands and retailers are not paying their overseas manufacturers back for the materials the manufacturers have already paid for to start making garments.

Additionally, here is a list of well-known fashion brands that have announced to cut or cancel sourcing orders as of April 13, 2020:

  • Primark has closed all its stores across Europe and the U.S. and asked all of its suppliers to stop production. However, the company has set up a fund to pay the wages of factory employees who worked on clothing orders that were canceled.
  • Ross Stores has announced to cancel all merchandise orders through mid-June, 2020.
  • Gap Inc. has decided to halt the shipments of their summer orders and the production of the fall products
  • H&M has also canceled orders but told its suppliers it would honor the orders it already placed before the COVID-19.

Additional reading:

Compiled by Meera Kripalu (Honors student, Marketing and Fashion Merchandising double majors) and Dr. Sheng Lu

The discussion is closed for this post.

EU Textile and Apparel Industry and Trade Patterns (Updated April 2020)

1

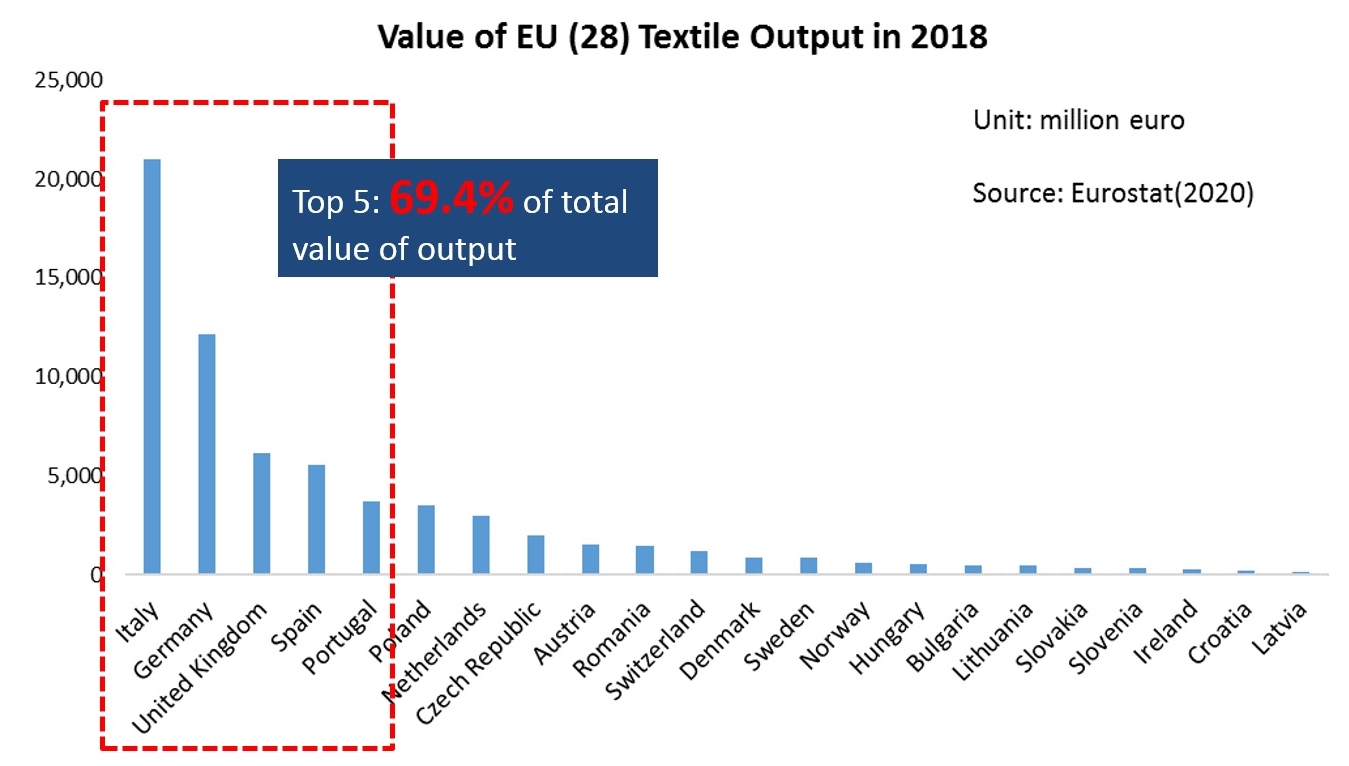
The EU region as a whole remains one of the world’s leading producers of textile and apparel (T&A). The value of EU’s T&A production totaled EUR146.2bn in 2018, marginally up 2% from a year ago (Note: Statistical Classification of Economic Activities or NACE, sectors C13, and C14). The value of EU’s T&A output was divided almost equally between textile manufacturing (EUR77.4bn) and apparel manufacturing (EUR70.0bn).

2

Regarding textile production, Southern and Western EU, where most developed EU members are located such as Germany, France, and Italy, accounted for nearly 73.7% of EU’s textile manufacturing in 2018. Further, of EU countries’ total textile output, the share of non-woven and other technical textile products (NACE sectors C1395 and C1396) has increased from 19.2% in 2011 to 23.0% in 2017, which reflects the on-going structural change of the sector.

3

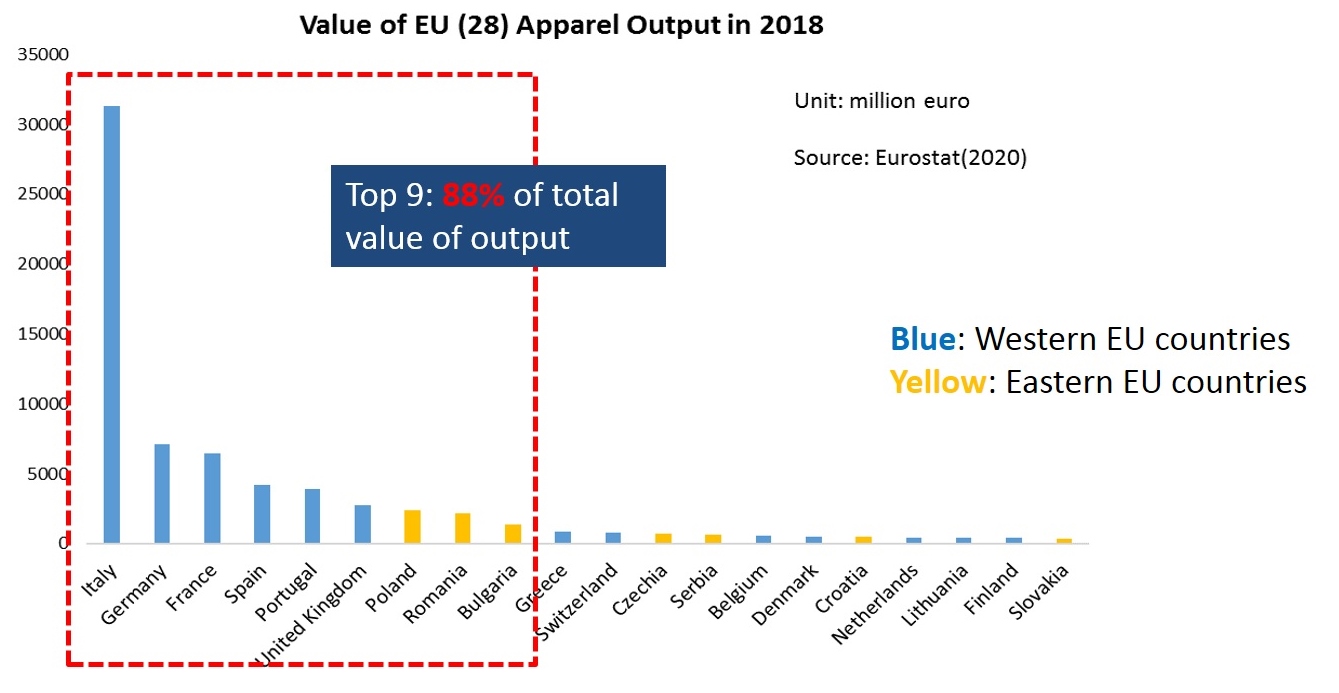
Apparel manufacturing in the EU includes two primary categories: one is the medium-priced products for consumption in the mass market, which are produced primarily by developing countries in Eastern and Southern Europe, such as Poland, Hungary, and Romania, where cheap labor is relatively abundant. The other category is the high-end luxury apparel produced by developed Western EU countries, such as Italy, UK, France, and Germany.

9

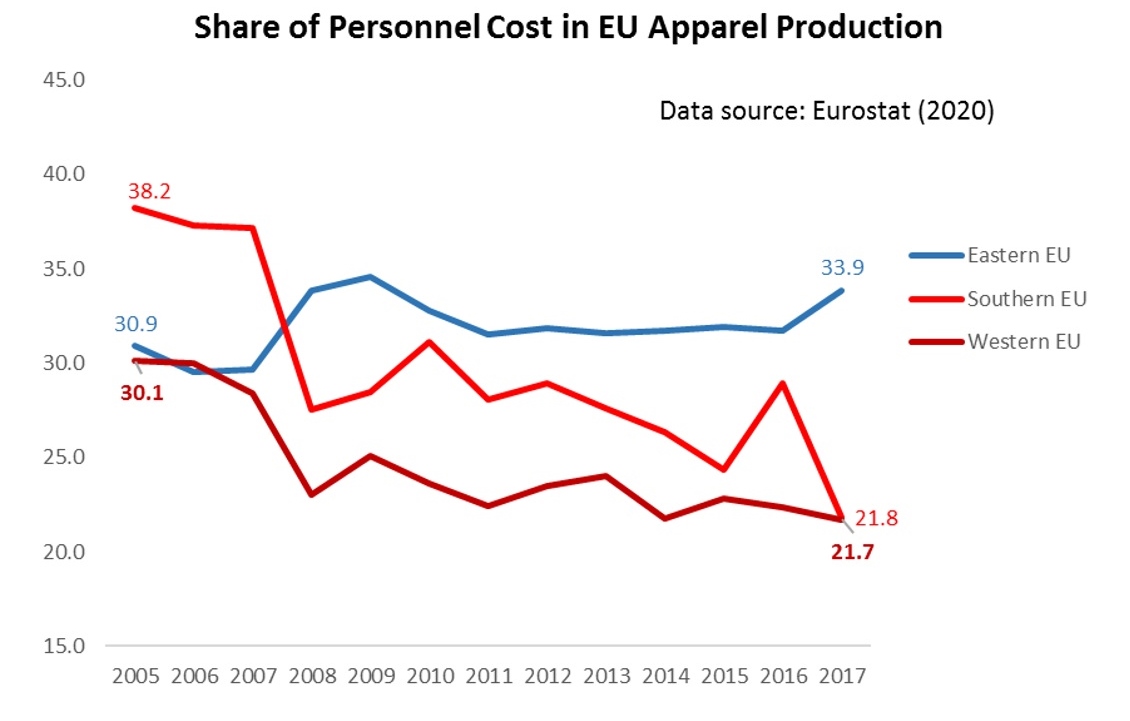
It is also interesting to note that in Western EU countries, labor only accounted for 21.7% of the total apparel production cost in 2017, which was substantially lower than 30.1% back in 2006. This change suggests that apparel manufacturing is becoming capital and technology-intensive in some developed Western EU countries—as companies are actively adopting automation technology in garment production.

5

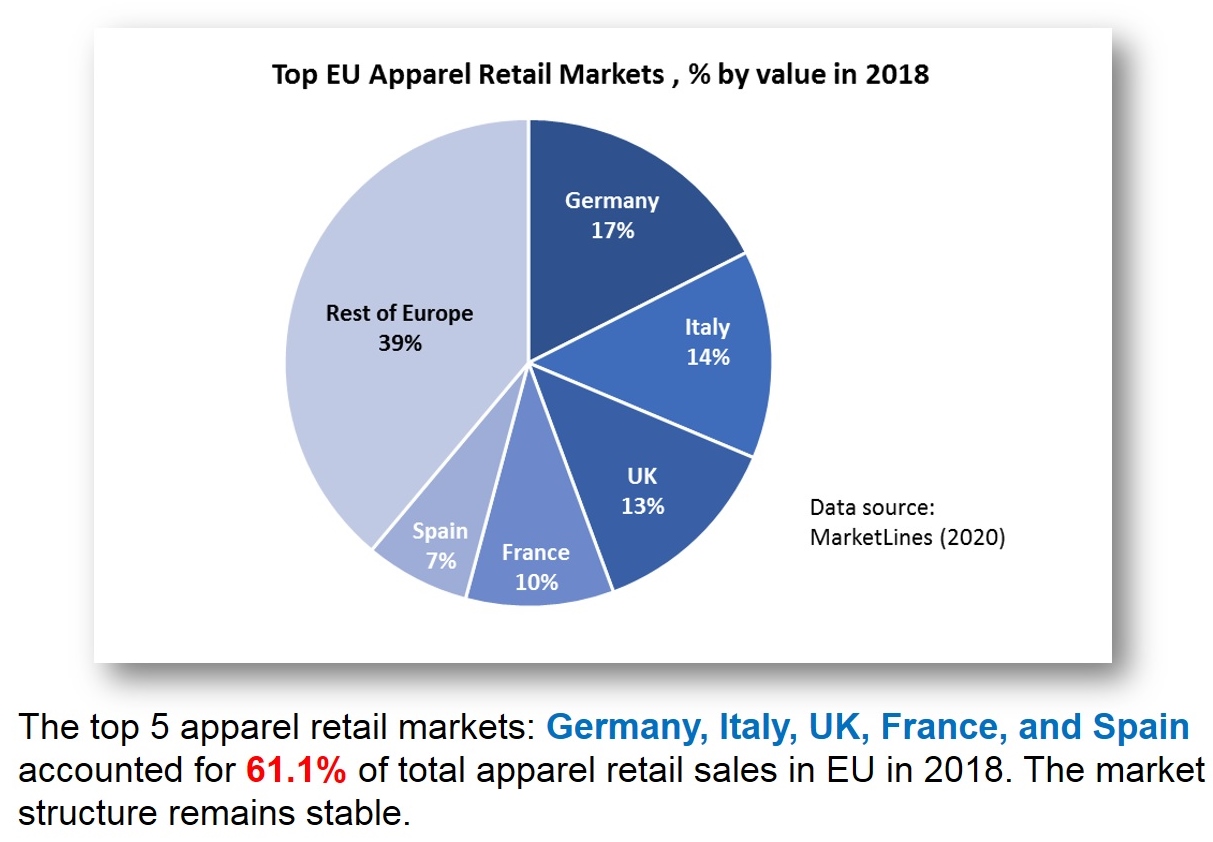
Because of their relatively high GDP per capita and size of the population, Germany, Italy, UK, France, and Spain accounted for 61.1% of total apparel retail sales in the EU in 2018. Such a market structure has stayed stable over the past decade.

8

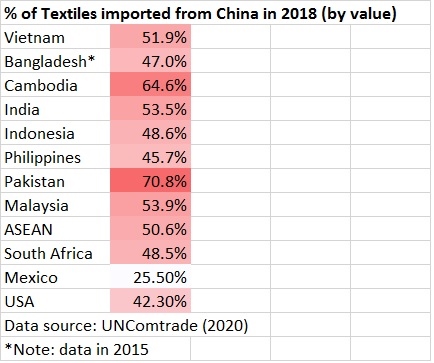
Data source: UNcomtrade (2020)

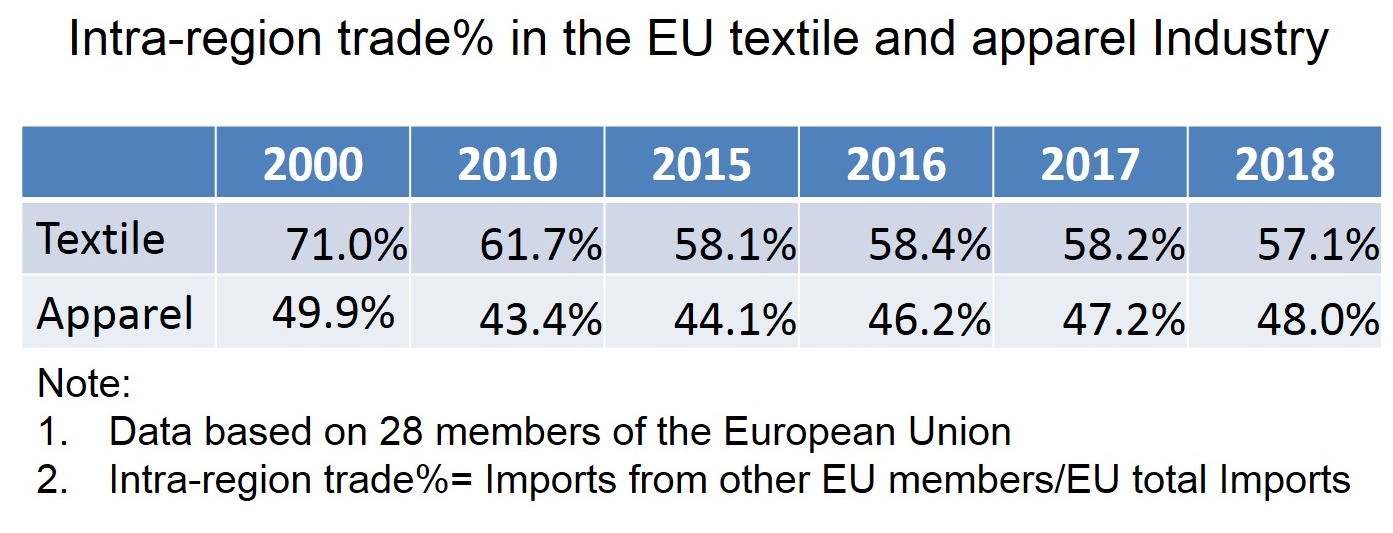
Intra-region trade is an important feature of the EU’s textile and apparel industry. Despite the increasing pressure from cost-competitive Asian suppliers, statistics from the World Trade Organization (WTO) show that of the EU region’s total US$73.7bn textile imports in 2018, as much as 57.1% were in the category of intra-region trade. Similarly, of EU countries’ total US$205.0bn apparel imports in 2018, as much as 48.0% also came from other EU members. In comparison, close to 97% of apparel consumed in the United States are imported in 2018, of which more than 80% came from Asia (Eurostat, 2020; WTO, 2020).

EURATEX-TC-Business-Confidence-Indicator (1)

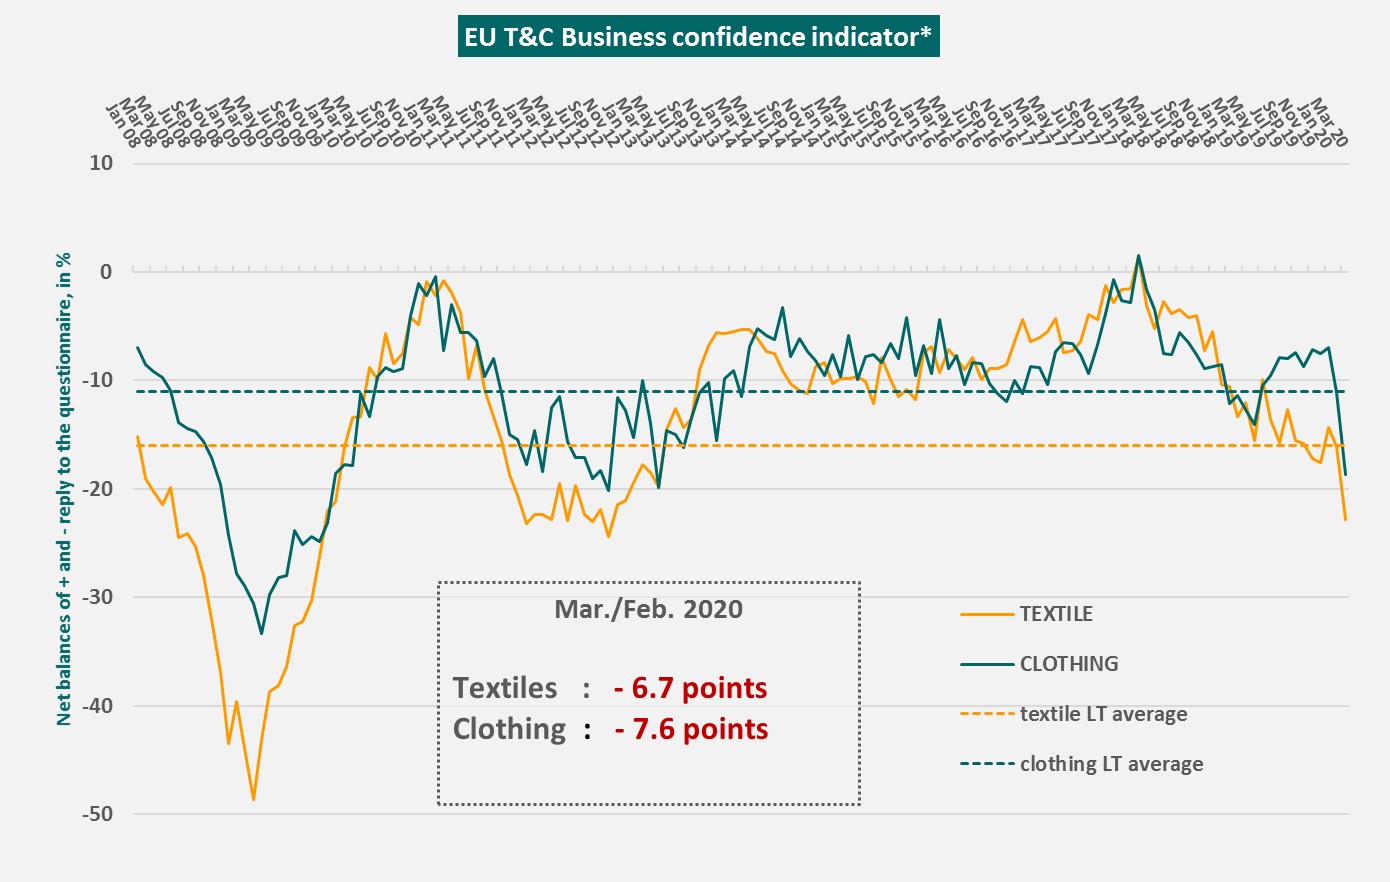
The EU textile and apparel industry is not immune to COVID-19. According to the European Apparel and Textile Federation (Euratex), the outbreak of COVID-19 may cause a 50% drop in sales and production for the EU textile and apparel sector in 2020. A recent survey of EU-based T&A companies shows that almost 9 out of 10 respondents reported facing serious constraints on their financial situation and 80% of companies had temporarily laid-off workers. Around 25% of surveyed companies were considering closing down their businesses. Further, EU T&A companies were concerned about EU’s tightened border controls, which have “increased sharply, leading to delays in supplies but also cancelling of orders, thus aggravating the economic impact.”

COVID-19 and U.S. Apparel Imports (Updated: April 2020)

11.2

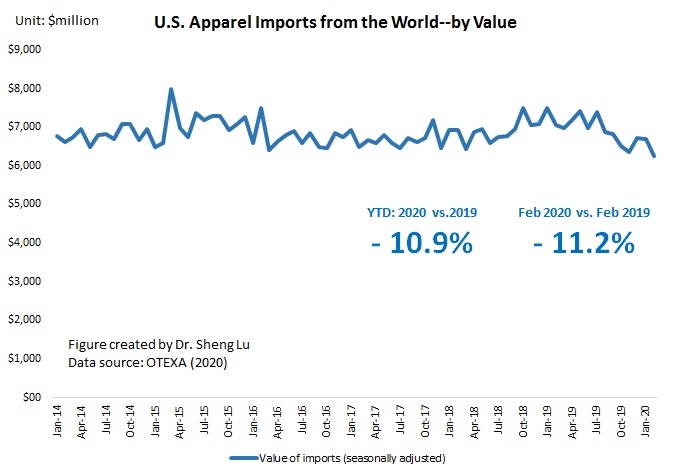
The spread of the coronavirus (COVID-19) has already resulted in a plummet of U.S. apparel imports that we have never seen in history. According to latest statistics from the Office of Textiles and Apparel (OTEXA) under the U.S. Department of Commerce, as of February 2020:

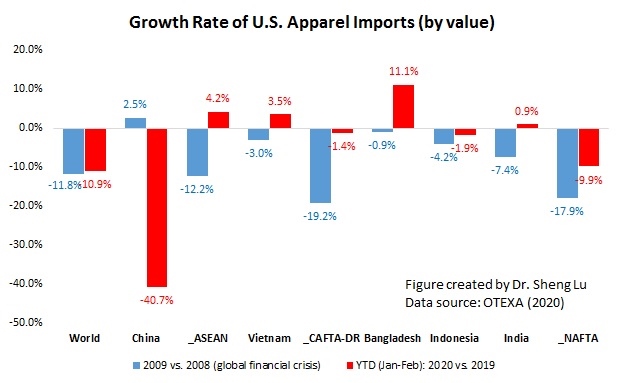
  • The value of U.S. apparel imports sharply decreased by 11.2% in February 2020 from a year earlier. Between January and February 2020, the amount of U.S. apparel imports decreased by 10.9% year over year, which is nearly the same loss as in the 2008-2009 global financial crisis.

5

  • As the first country took a hit by COVID-19, China’s apparel exports to the United States nearly collapsed in February 2020–down as much as 46.1% compared with a year ago (and -40.6% drop YTD). This result is also worse than the official Chinese statistics, which reported an overall 20% drop in China’s apparel exports in the first two months of 2020).

2

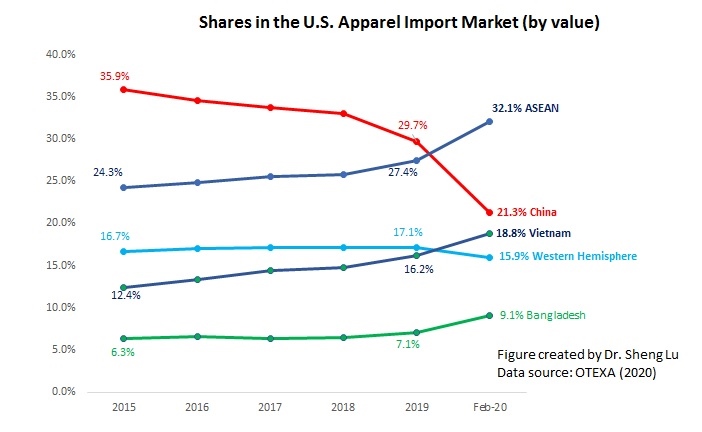
  • China’s market shares in the U.S. apparel import market dropped to 21.3% in February 2020, a new record low in history (was 30% in 2019 and 23.9% in January 2020). However, it is important to note that such a downward trend started in October 2019, as U.S. fashion brands and retailers were eager to reduce their exposure to sourcing from China.
  • China’s lost market shares have been picked up mostly by other Asian suppliers, particularly Vietnam (18.8% YTD in 2020 vs. 16.2% in 2019) and Bangladesh (9.1% YTD in 2020 vs.7.1% in 2019). However, there is no clear evidence suggesting that U.S. fashion brands and retailers are giving more apparel sourcing orders to suppliers from the Western Hemisphere. In the first two months of 2020, only 9.5% of U.S. apparel imports came from CAFTA-DR members (down from 10.3% in 2019) and 4.2% from NAFTA members (down from 4.5% in 2019).

How Might Covid-19 Affect Apparel Sourcing and Trade

The top challenge facing apparel sourcing and trade in the shadow of Covid-19 has quickly shifted from a lack of textile raw material to order cancellation. In major apparel consumption markets such as the EU and US, clothing stores are locked down, making retailers have no choice but to postpone or even cancel sourcing orders.

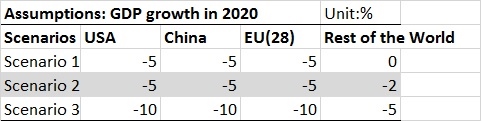
Based on the Global Trade Analysis Project Recursive Dynamic (GTAP-RD) Model and its latest database, we estimated the trade impact of Covid-19 in three possible scenarios, as summarized in the table below. All these three scenarios are pretty bad but likely situations we may have to face this year. (Note: Because China, US, and EU are the epic-centers of Covid-19, in the study, we assume these three countries/regions’ economies will be hit harder than the rest of the world.)

Untitled

There are four preliminary findings:

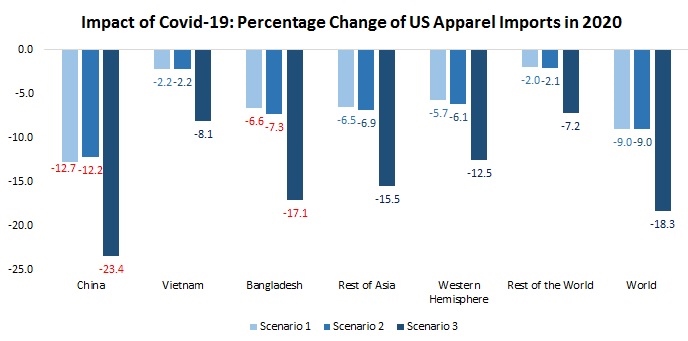
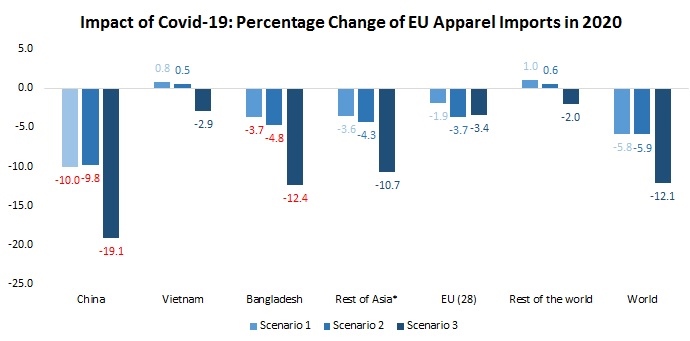
First, the volume of the world apparel trade will be hit hard by Covid-19. As clothing stores are forced to shut down and consumers are losing jobs and struggling financially, the demand for apparel consumption in the EU and US, the world’s top two apparel consumption markets, is expected to drop sharply. As shown in the figures below, every 1% decline in the US and EU Gross Domestic Product (GDP) in 2020 could lead to at least a 2-3% drop in the value of their apparel imports.  Notably, during the 2008 financial crisis, the value of world apparel imports also decreased by as much as 11.5% when the EU and US GDP suffered a 2.5-3% negative growth.

1

2

Second, with a sharp decline in U.S. and EU apparel imports this year, China could be hit the hardest. In all the three scenarios we estimated, China will suffer the most significant drop in its apparel exports to the US and EU markets. The reasons are threefold: The first factor is the size effect—as the largest source of US and EU apparel imports and with its unparalleled production capacity, China is often used to fulfill large-volume sourcing orders. In the current situation, however, retailers are most likely to cancel these large-quantity orders, resulting in a disproportional loss of China’s apparel exports. Secondly, the US and EU apparel imports from China currently cover almost all major categories, which also makes China the most exposed to order cancellation. Furthermore, jointly affected by last year’s US-China trade war and the outbreak of Covid-19 in China earlier this year, many US and EU fashion brands and retailers have been shifting sourcing orders from China to other Asian countries, such as Bangladesh and Vietnam. To prioritize their limited resources, US and EU retailers are most likely to accelerate this process in the current difficult time.

Other than China, apparel factories in Bangladesh also could suffer severe export decline. Similar to the case of China, Bangladesh serves as a leading apparel supplier for BOTH the EU and US markets, making it more exposed to order cancellation than other countries. Notably, as a beneficiary of the EU Everything But Arms (EBA) program, around 60% of Bangladesh’s apparel currently go to the EU. In comparison, with a more diversified export market, apparel factories in Vietnam are in a better position and have more flexibility to mitigate the impact of a declined import demand from the EU and the US. In 2018, around 40% of Vietnam’s apparel exports went to other markets in the world.

Third, the decreased US and EU apparel imports will have a notable impact on employment in many apparel exporting countries. In history, a 10% change in the value of apparel exports typically results in a 4%-9% change in garment employment. This means, should the US and EU apparel imports drop by 10% in 2020, leading apparel exporting countries such as Bangladesh, Vietnam, Cambodia and India may have to cut 4%-9% of their jobs in the garment sector accordingly.  Notably, in developing countries such as Bangladesh and Cambodia, the apparel sector remains the single largest job creator for the local economy, especially for women. The social and economic impact of job losses in the apparel sector due to Covid-19 is very concerning.

Fourth, the economic performance in the US, EU, and China will largely shape the pattern of apparel trade this year. The results in scenarios 1 and 2 overall are pretty close, suggesting the economic cloud of these three countries and regions altogether far exceed the rest of the world.

Last but not least, the global apparel supply chain could continue to face a turbulent time in the next 1-2 years, even if Covid-19 gradually gets under control in the second half of 2020. In history, affected by the 2008 global financial crisis, the value of world apparel exports dropped by 12.8% in 2009. However, the growth rate quickly rebounded to 11.5% the following year. Likewise, should the EU and US apparel imports were able to recover to its normal level in 2021, both importers and garment factories may have to deal with a new round of labor shortage, the price increase of raw material and a lack of production capacity.

by Sheng Lu

Additional reading:

COVID-19 and U.S. Apparel Imports (Updated: March 2020)

Untitled

3

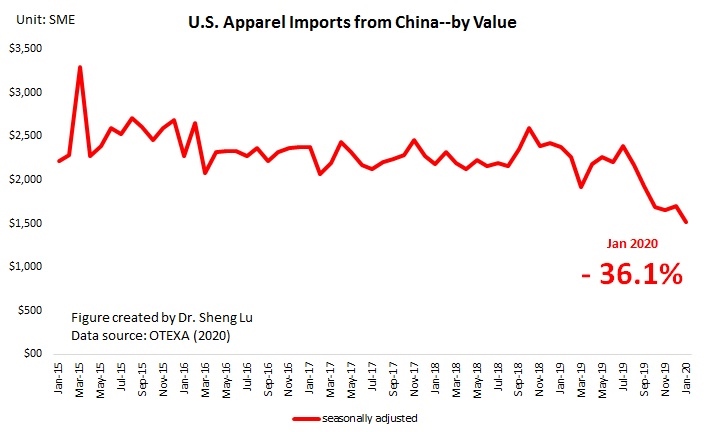
Jointly affected by the U.S.-China tariff war and the spread of the coronavirus, the value of U.S. apparel imports from China see a significant drop in January 2020.

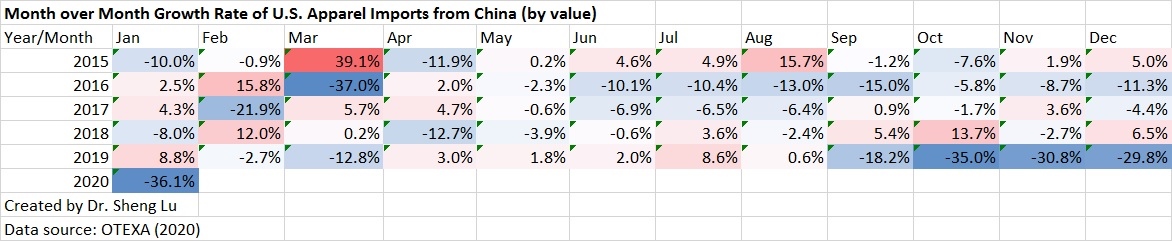
Specifically, the value of U.S. apparel imports from China went down by as much as 36.1% month over month in January 2020. As a result, China’s market shares also dropped from nearly 30% in 2019 to a new record low of 23.9% in January 2020. However, it is important to note that such a downward trend started in October 2019, as U.S. fashion brands and retailers were eager to reduce their exposure to sourcing from China.

6

China’s lost market shares have been picked up mostly by other Asian suppliers, particularly Vietnam and Bangladesh. However, there is no evidence showing that U.S. fashion brands and retailers are giving more apparel sourcing orders to suppliers from the Western Hemisphere. In January 2020, only 8.1% of U.S. apparel imports came from CAFTA-DR members (down from 10.3% in 2019) and 3.7% from NAFTA members (down from 4.5% in 2019). Recent studies show that there’s more divergence in the products imported into the US  from Asian countries and the western hemisphere.

Meanwhile, according to the latest statistics from China’s Customs, the value of China’s apparel exports in the first two months of 2020 dropped by nearly 20% from a year earlier.

Evolving Patterns and Social Economic Impacts of World Textiles and Apparel Trade: Discussions Questions from FASH455


Patterns of world textile and apparel trade

#1 Based on the readings, why or why not do you think Africa is on the right track to become the next hub for apparel sourcing for western fashion brands?

#2 Based on the readings, do you think that any of the countries/regions discussed can become the “next China?” If so, what are the challenges faced by these exporters that have been gaining market shares (such as Vietnam and Bangladesh)?

#3 Why is Asian companies investing the most into the apparel industry in Sub Saharan Africa (SSA) rather than U.S. or EU investors? Notably, the African Growth and Opportunity Act (AGOA) is a trade preference program between the U.S. and SSA countries.

#4 If the punitive tariffs on Chinese goods are removed next year, why or why do you think U.S. retailers will increase apparel sourcing from China again?

#5 To which extent do you think the comparative advantage theory can explain the evolving world textile and apparel trade patterns?

#6 What policies or strategies could the US government use to convince companies to invest in the Sub-Saharan African region instead of countries like China and Vietnam?

Debate on used clothing trade

#7 Did you feel that the United States really explored every and any possible solution before deciding to suspend Rwanda’s eligibility under the AGOA? If not, what more could they have done or done differently?

#8 The US-EAC trade dispute on used clothing import ban is a very multilayered matter, which can be broken down with the help of trade preference programs. How can we improve the effectiveness of these trade preference programs and revolutionize them to become more significant in today’s economy?

#9 EAC countries are having a difficult time developing their local textile and apparel industry due to the large amounts of used clothing being imported and even proposed a high tariff to lower the amount of clothing being imported. Do you believe the ban on used clothing is the only option they have left for economic growth? If not, what are some ideas of ways they can grow their economy?

#10 The EAC countries have shown their unwillingness to used clothing trade. However, the US has presented that they are indifferent to regulate the used clothing trade as they are one of the biggest used clothing exporters. Are there any solutions to achieve the win-win situation on used clothing trade?

#11 The used clothing ban is put in place in order to develop the apparel and textile industry, but there needs to be more education for countries on sustainability. There is a big stigma about used clothing that needs to be abolished as well. An alternative to this ban is allowing used clothing, but also creating new clothing more sustainably so apparel and textile companies can profit. What are some other sustainable alternatives that benefit both sides?

#12 Given the debate on used clothing trade and its impact on East African nations, will you continue to donate used clothing? Why or why not?

[For FASH455: 1) Please mention the question number in your comments; 2) Please address at least TWO questions in your comments]

Survey Results: Garment Factories in China Slowly Resume Production amid the Fight against the Coronavirus Outbreak

960x0

A recent survey of 294 apparel companies and 20 apparel industry clusters* in China was conducted by the China Garment Association between February 19 and 20, 2020, aiming to understand the impact of the coronavirus (2019-nCoV) on China’s garment industry and production. The respondents of the survey include both garment factories (63.3%) and apparel brands (36.7%). Around 83.4% surveyed companies reported over RMB20 million (or $2.85million) sales revenues.  Below are the key findings:

State of Production

  • 68.4% of surveyed companies say they have gradually resumed production. Of these companies, about 45.6% of their workers in need have returned. The surveyed companies also expect their production output to reach 50% of its normal level by March and could fully recover by April, should the situation stabilized.
  • However, still, as many as 31.6% of surveyed companies say they have not resumed production because of a mix of factors ranging from the need to prevent coronavirus, government restrictions, to the difficulty in recruiting workers. Further, for apparel companies from areas most affected by the coronavirus, they report no plan for reopening anytime soon.
  • Around 87.2% surveyed “large companies” have resumed production, much higher than “medium-sized” (65.4%) and “small-sized” (34.7%) enterprises. [Note: according to China’s Bureau of Statistics, for manufacturers, “large companies” typically refer to those with over 1,000 employees and over RMB400 million (or $57million) annual sales revenue; “small or mini-sized companies” are those with employees less than 200 and less than RMB3million (or $0.43million) annual sales revenues. “medium-sized companies” are those in between].
  • Further, around 74.3% of surveyed apparel brands have resumed business operations, higher than 64.9% of garment factories. Meanwhile, some apparel brands say only their management team have resumed work or those positions that can be done through work from home; however, their plants remain closed.
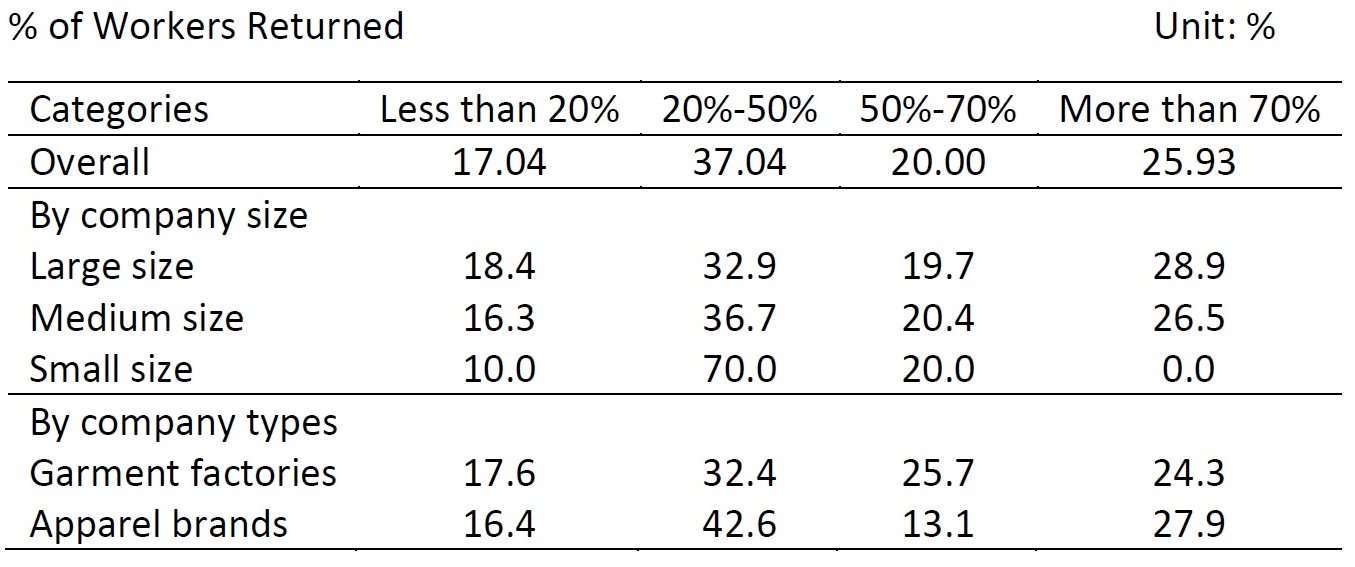
  • Over half of the surveyed companies (54.08%) say less than 50% of their workers have returned. The lack of workers is a more pressing issue for small-sized companies, with over 80% having less than 50% of workers returned.

1

Key challenges facing the surveyed companies:

  • #1: Lack of workers, especially to have those workers from other parts of China return to the factory due to travel restrictions (68.7%)
  • #2: Production cost increase and a lack of supply of raw material from the upstream sector (29.9%)
  • #3: Slow and stagnant sales, overstock of finished products due to delayed orders and tight with cash flows (20.6%)
  • #4: Weak market demand and cancellation of orders (19.2%)
  • #4: Disrupted logistics and transportation (19.2%)
  • #6: Hard to procure protective equipment for staffs and workers (such as facial masks) (16.8%)
  • #7: Cancellation of exhibitions, harder to explore markets and more financial burdens (8.4%)

(*Note: apparel industry clusters refer to geographic concentrations of interconnected factories that manufacture a particular type of apparel product)

Related reading: Apparel Sourcing in the Shadow of Coronavirus (updated February 2020)

Patterns of U.S. Textile and Apparel Imports (updated February 2020)

1

4

The value of U.S. textile imports totaled $27,461 million in 2019, down 2.3 percent from 2018. This is the first time since 2016 that U.S. textile imports incurred a negative growth, which could be related to the slowed U.S. domestic textile and apparel production. Meanwhile, the value of U.S. apparel imports reached $83,822 million in 2019, up 1.2 percent from a year earlier but was substantially lower than a 3.4% growth between 2017 and 2018. Despite the trade uncertainties, the U.S. apparel imports overall still mirror the trend of apparel retail sales in the U.S. market.

Looking ahead, while the reaching of the “phase one” U.S.-China trade deal was a relief to U.S. fashion companies, the unexpected outbreak of the coronavirus in China since January and its fast spread had cast a new shadow on the outlook of the world economy. U.S. Fed Chairman Jerome Powell recently cited the prospect of a hit to tourism, exports and financial markets as ways the coronavirus could dent U.S. economic growth. As a consequence, the value of U.S. textile and apparel imports in 2020 could grow at a more modest rate than previously expected.

2

Because the United States is no longer a major apparel manufacturer but one of the largest apparel consumption markets in the world, apparel products accounted for 75.3 percent of total U.S. textile and apparel imports in 2019, followed by made-up textiles (17.9 percent), fabrics (5.6 percent) and yarns (1.2 percent). This structure has remained quite stable over the past decade.

1

The U.S. imported apparel from more than 150 countries in 2019. Meanwhile, the Herfindahl index declined from 0.269 in 2010 to 0.253 in 2019, suggesting that overall the U.S. apparel import market is becoming less concentrated. This result is consistent with some recent studies, which show that U.S. fashion brands and retailers continue to diversify their sourcing bases gradually. Reducing the dependence on sourcing from China, catering to the increasing demand for speed to market and fulfilling the market expansion needs were among the top-cited reasons for companies’ sourcing diversification strategy.

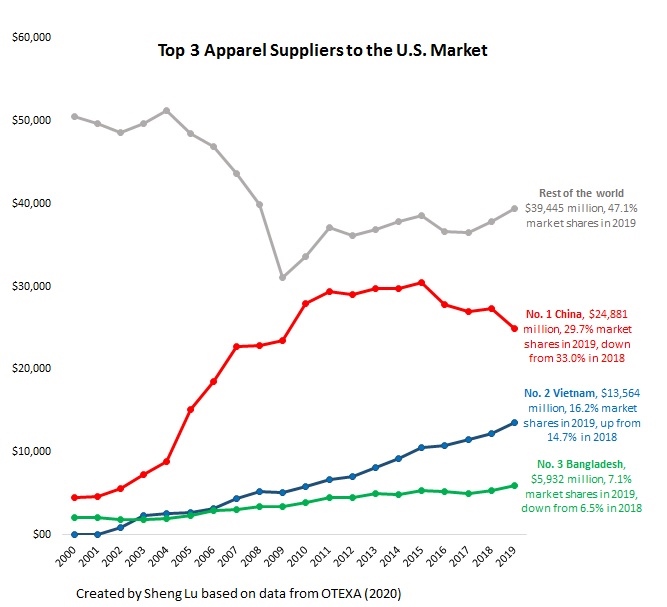
Specifically, all top apparel suppliers to the United States in 2019 (by value) were developing countries and most of them were located in Asia, including China (29.7%, down from 33.0% in 2018), Vietnam (16.2%, up from 14.7% in 2018), Bangladesh (7.1%, up from 6.5%), Indonesia (5.3%, down from 5.4% in 2018), India (4.8%, up from 4.6% in 2018) and Mexico (3.7%, down from 4.0% in 2018).

6

Except for China, the average unit price of U.S. apparel imports from other major sources all went up in 2019, including Vietnam (up 4.6%), Bangladesh (up 5.6%), Indonesia (up 2.1%), India (up 3.1%), Cambodia (up 7.5%) and CAFTA-DR members (up 4.4%). The results suggest that U.S. fashion brands and retailers had to pay a higher price when they move their sourcing orders from China to other alternatives, due to much smaller production capacity and more costly raw material supply there.

Additional reading: US apparel Sourcing Patterns are Changing. Here is How (by Sheng Lu, on just-style). Key findings:

  • Consumption demand remains the most significant factor in shaping the volume of U.S. apparel imports. Between 2010 and 2019, the value of U.S. apparel retail sales always stayed at around three times as much as the value of U.S. apparel imports. Over the same period, the amount of U.S. apparel retail sales and apparel imports also changed in the same direction, and both enjoyed a roughly 3.0% annual growth on average. Such a synchronized move reminds us about the buyer-driven nature of the apparel business today and explains why this industry is so sensitive towards the health of the national economy.
  • The U.S.-China tariff war had resulted in a change of the seasonal patterns for apparel sourcing and shipment. While July to October used to be the busiest time for U.S. fashion brands and retailers to receive their sourcing orders from China, in 2019 the peak season started earlier in June and ended in September–mostly because U.S. fashion companies tried to avoid the hit of the proposed 15% Section 301 punitive tariffs on Tranche 4A products, which covered most apparel items. For the same reason, U.S. apparel imports from China in November and December 2019 were much lighter than usual.
  • U.S. fashion brands and retailers continue to diversify their sourcing base, yet the options available remain limited. The lack of qualified alternatives to “Made in China” is one big challenge. Despite the hundreds of apparel exporting countries in the world, only nine of them met the following two criteria: 1) enjoyed a 5% or higher growth of their apparel exports to the U.S. for two consecutive years since 2017; 2) achieved a minimum 1% market share as of 2019. Of these nine countries, only Vietnam, Bangladesh, and Cambodia ranked the top 10 apparel suppliers for the U.S. market in 2019.
  • U.S. fashion brands and apparel retailers increasingly source both from Asia and the Western Hemisphere, but for different purposes. Notably, the value of export similarity index (ESI) between China and the Western Hemisphere was as low as 40.8 in 2015 and went down further to only 39.6 in 2019, suggesting their export product structure had turned even more heterogeneous. In contrast, between 2015 and 2019, China, ASEAN (whose members include leading apparel exporting countries such as Vietnam, Indonesia, Cambodia, Malaysia, and Thailand) and Bangladesh appear to export increasingly similar products to the United States. This explained why Asian suppliers rather than NAFTA and CAFTA-DR members saw their apparel exports to the United States increased in 2019 as a result of the U.S.-China tariff war.

Apparel Sourcing in the Shadow of Coronavirus (updated February 2020)

[The situation has been quickly evolving. Please check the updated analysis: How Might Covid-19 Affect Apparel Sourcing and Trade ]

  • The real impact of the coronavirus is yet to come. Western fashion brands and retailers know that sourcing from China is always slow in January and early February because of the Chinese New Year (CNY). Instead, the immediate economic impact of the coronavirus right now is on China’s domestic retail market, as many stores (including well-known clothing and footwear brands) have been closed.
  • As the disease continues to spread quickly, the concerns about the outlook of sourcing from China are growing. Even though factories in China are scheduled to reopen on February 3, according to the latest government announcement, over dozens of major cities in the country have been locked down (encircling roughly 50 million people so far), making it impossible for many workers to return to their job. Further, it is hard to predict how long such an unprecedented large-scale lockdown will last.

1

2

  • Many Western fashion companies are in the status of “wait and see what is going to happen.” Some delays in the arrival of their orders seem unavoidable. However, shifting sourcing orders to other countries does not seem to be a quick solution at this point either for three reasons: 1) China remains the single largest textile and apparel supplier with no alternatives (see the table above); 2) other apparel exporting countries (especially those in Asia) rely heavily on textile raw material, such as yarns and fabrics made in China. 3) for apparel factories in Asia and Africa, it is not rare to see their management team is from China. However, starting from the end of January, countries around the world have begun to impose travel restrictions targeting Chinese travelers.
  • While last year’s tariff war had already pushed Western fashion brands to source less from China, the coronavirus could accelerate companies’ sourcing diversification strategy further. Western fashion brands and retailers may also see their overall sourcing cost to go up as it requires additional resources to move products around and build new supply chains.

Top Ten Most-read Blog Posts on Shenglufashion in 2019

download.png

#1 WTO reports world textile and apparel trade in 2018

#2 Wage level for garment workers in the world (updated in 2017)

#3 China’s changing role in the world textile and apparel supply chain

#4 Timeline of trade policy in the Trump administration

#5 State of the EU textile and apparel industry (updated April 2019)

#6  2019 U.S. fashion industry benchmarking study released

#7 U.S. textile and apparel industry is NOT immune to the U.S.-China tariff war

#8 U.S. apparel retailers’ shifting sourcing strategy for “Made in China” under the shadow of the tariff war

#9 Demystify the “Made in the USA” apparel sourcing strategy

#10 U.S. textile and apparel industry assesses the impacts of USMCA (NAFTA2.0)

Happy Holidays!

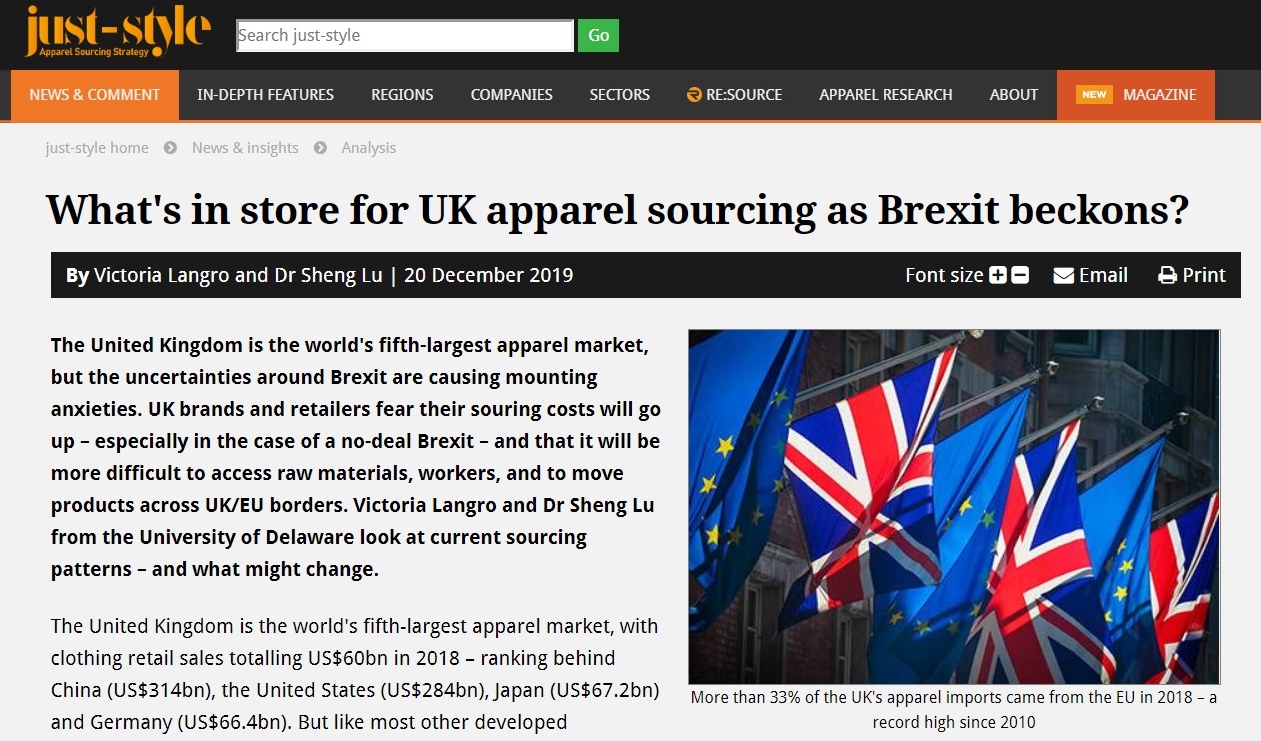
New Analysis: UK’s Apparel Sourcing Patterns under the Shadow of Brexit

UK1.jpg

The full article is available HERE

Key findings:

First, mirroring the trend of aggregate market demand, the value of UK’s apparel imports has only grown marginally over the past decade. Specifically, between 2010 and 2018, the compound annual growth rate of UK’s apparel imports was close to zero, which was notably lower than 1.4% of the world average, the United States (1.9%), Japan (1.5%) and even the European Union as a whole (1.1%).

Second, UK’s fashion brands and retailers are gradually reducing imports from China and diversifying their sourcing base. Similar to other leading apparel import markets in the world, China was the largest apparel-sourcing destination for UK fashion companies, followed by Bangladesh, which enjoys duty-free access to the UK under EU’s Everything But Arms (EBA) program. Because of geographic proximity and the duty-free benefits under the Customs Union with the EU, Turkey was the third-largest apparel supplier to the UK.

Affected by a mix of factors ranging from the increasing cost pressures, intensified competition to serve the needs of speed-to-market better, the market shares of “Made in China” in the UK apparel import market had dropped significantly from its peak of 37.2% in 2010 to a record low of 21.4% in 2018. However, no single country has emerged to become the “next China” in the UK market. Notably, while China’s market shares decreased by 6.3 percentage points between 2015 and 2018, the next top 4 suppliers altogether were only able to gain 0.7 percentage points of additional market shares over the same period.

Third, despite Brexit, the trade and business ties between the UK and the rest of the EU for textile and apparel products are strengthening. Thanks to the regional supply chain, EU countries as a whole remain a critical source of apparel imports for UK fashion brands and apparel retailers. More than 33% of the UK’s apparel imports came from the EU region in 2018, a record high since 2010. On the other hand, the EU region also is the single largest export market for UK fashion companies.

UK2

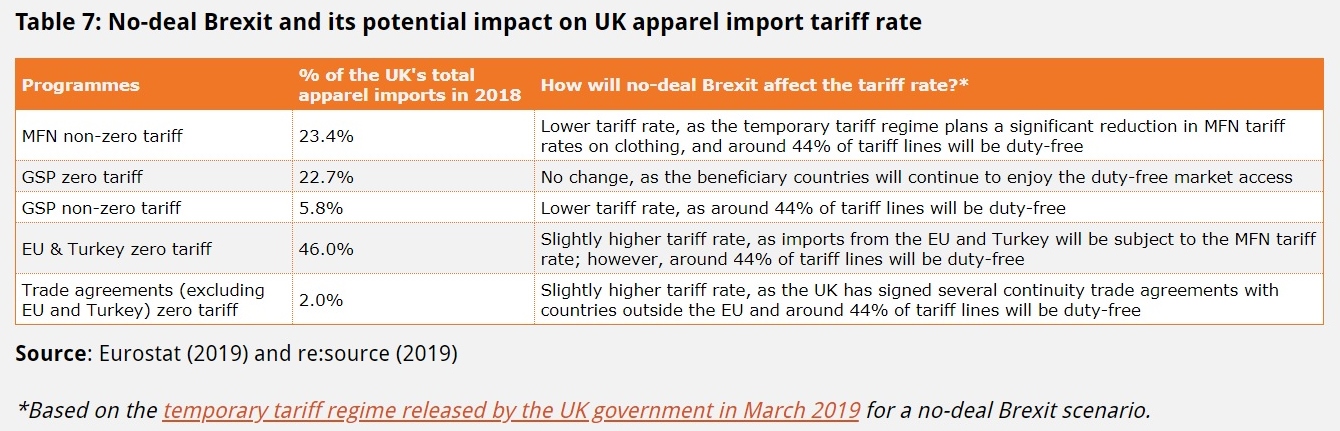
Fourth, the potential impacts of no-deal Brexit on UK fashion companies’ sourcing cost seem to be modest:

  • For products currently sourced from countries without a free trade agreement with the EU (such as China) and those Generalized System of Preferences (GSP) beneficiaries that enjoy non-zero preferential duty rates, the tariff rate in the no-deal Brexit scenario will be lower than the current level, as round 44% of tariff lines will be duty-free.
  • For products currently sourced from countries that enjoy duty-free benefits under the GSP program (such as EBA beneficiary countries), their duty-free market access to the UK will remain unchanged according to the temporary tariff regime.
  • Products currently sourced from EU countries and Turkey will lose the duty-free benefits and be subject to the MFN tariff rate. However, because around 44% of tariff lines will be duty-free, the magnitude of tariff increase should be modest.
  • Likewise, products currently sourced from countries that enjoy duty-free benefits under an EU free trade agreement could lose the duty-free treatment and be subject to the MFN tariff rate. However, as around 44% of tariff lines will be duty-free and the UK has signed several continuity trade agreements with some of these countries, the magnitude of tariff increase should be modest overall too. Additionally, these countries are minor sourcing bases for UK fashion companies.

 About the authors: Victoria Langro is an Honors student at the University of Delaware; and Dr. Sheng Lu is an Associate Professor in Fashion and Apparel Studies at the University of Delaware.

How Has the Tariff War Affected the Competitiveness of China’s Textile and Apparel Exports to the U.S.? (December 2019)

yarns.jpg

fabric.jpg

apparel.jpg

made up textiles.jpg

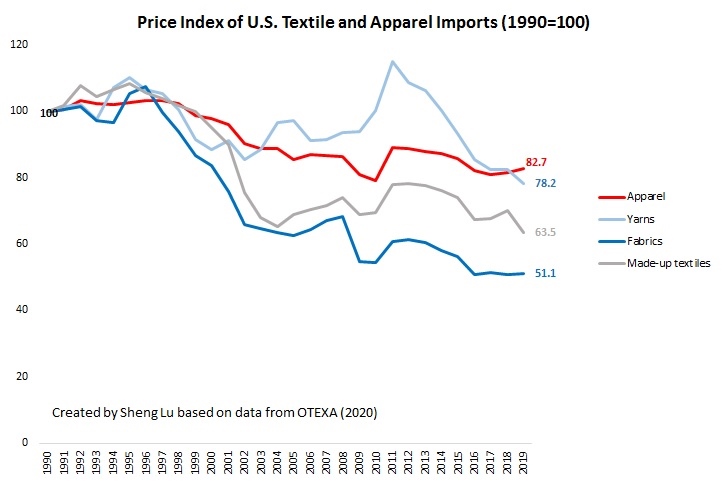
This study intends to explore how has the U.S.-China trade tension since 2017 affected the competitiveness of China’s textile and apparel (T&A) exports to the U.S. market. The findings of the study will shed new light on the mega-trend of T&A sourcing from China in the medium term, and support T&A companies’ sourcing decision making in the current uncertain business environment.

Data for the analysis were collected from the Office of Textiles and Apparel (OTEXA) under the U.S. Department of Commerce, including the value of U.S. imports from China between 2016 (i.e., the year before the U.S. launched the section 301 investigation against China) and October 2019 (the latest data available) for a total of 167 categories of T&A products.

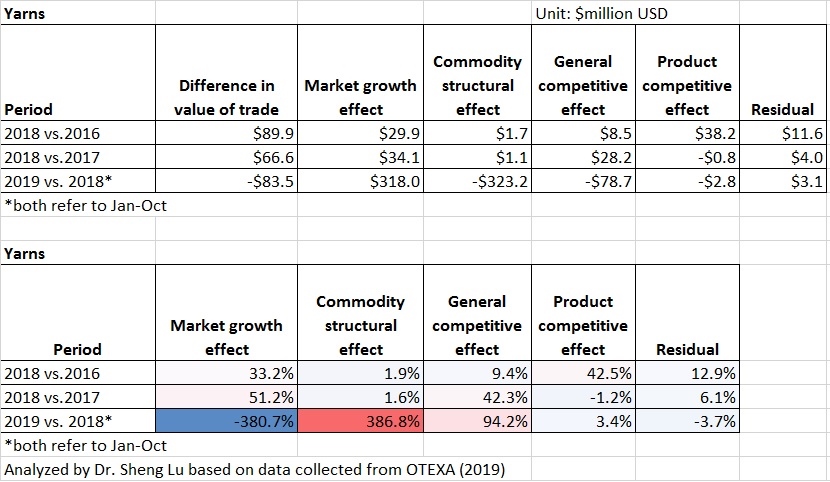
Specifically, based on the constant market share (CMS) model, a commonly adopted international trade analysis tool, this study decomposed the value of U.S. T&A imports from China into the following four factors:

  • Market growth effect: changes in China’s T&A exports to the U.S. due to the growth of total U.S. import demand for T&A
  • Commodity structural effect: changes in China’s T&A exports to the U.S. due to the shifting product structure of China’s T&A exports
  • General competitive effect: changes in China’s T&A exports to the U.S. due to the shifting competitiveness of Chinese T&A products in the U.S. market (measured by China’s market shares)
  • Product competitive effect: changes in China’s T&A exports to the U.S. due to the joint effect of the product structure of China’s T&A exports and the shifting competitiveness of Chinese T&A products in the U.S. market (measured by China’s market shares)

Four findings are of note:

First, the U.S.-China trade tension has affected China’s T&A exports to the U.S. negatively. Even though Section 301 tariffs on the majority of apparel products didn’t start until September 2019, China’s T&A exports to the U.S. had suffered a significant drop. This result, however, was at odds with the overall trend of China’s T&A exports to the U.S. in recent years. Notably, except apparel, China’s yarns, fabrics and made-up textile exports to the U.S. all enjoyed a steady and positive growth between 2016 and 2018. The impact of the tariff war is real.

Second, the increased U.S. import demand has partially mitigated the negative impact of trade tension on China’s T&A exports to the U.S. market. Results of the CMS model indicate that expanded total U.S. import demand for T&A driven by the booming U.S. economy had avoided an even worse decline of U.S. T&A imports from China. In other words, without such a market growth, China’s T&A exports to the U.S. would have been $2,065 million less in 2018 (including $528 million for apparel) and $878 million less (including $613 million for apparel) in the first ten months of 2019 than their current level.

Third, China’s export competitiveness is shifting from apparel to textiles. Results of the CMS model show that even before the tariff war, the competitiveness of China’s apparel exports has been weakening steadily, which was the most significant contributing factor to the decline of $530 million U.S. apparel imports from China between 2016 and 2018. In comparison, China is exporting more yarns and fabrics to the U.S. in recent years. Data from OTEXA shows that between 2016 and 2018, China’s yarn and fabric exports to the U.S. enjoyed a 13.1% and 2.6% compound annual growth, respectively, compared with a 0.6% decline of apparel. The CMS model further suggests that China’s improved export competitiveness can explain the majority of these increased exports.

Fourth, China is adjusting its T&A export structure to mitigate the negative impact of the tariff war. As estimated, through targeting those product categories with higher growth in import demand, China was able to achieve an additional $36.7 million apparel export to the U.S. in the first ten months of 2019.  Likewise, the commodity structural effect also favored China’s made-up textile exports to the U.S. market in 2019, resulting in $148.7 million more exports than otherwise.

By Sheng Lu

Japan’s Apparel Sourcing Patterns

Untitled.jpg

(The full article is available HERE)

Key findings:

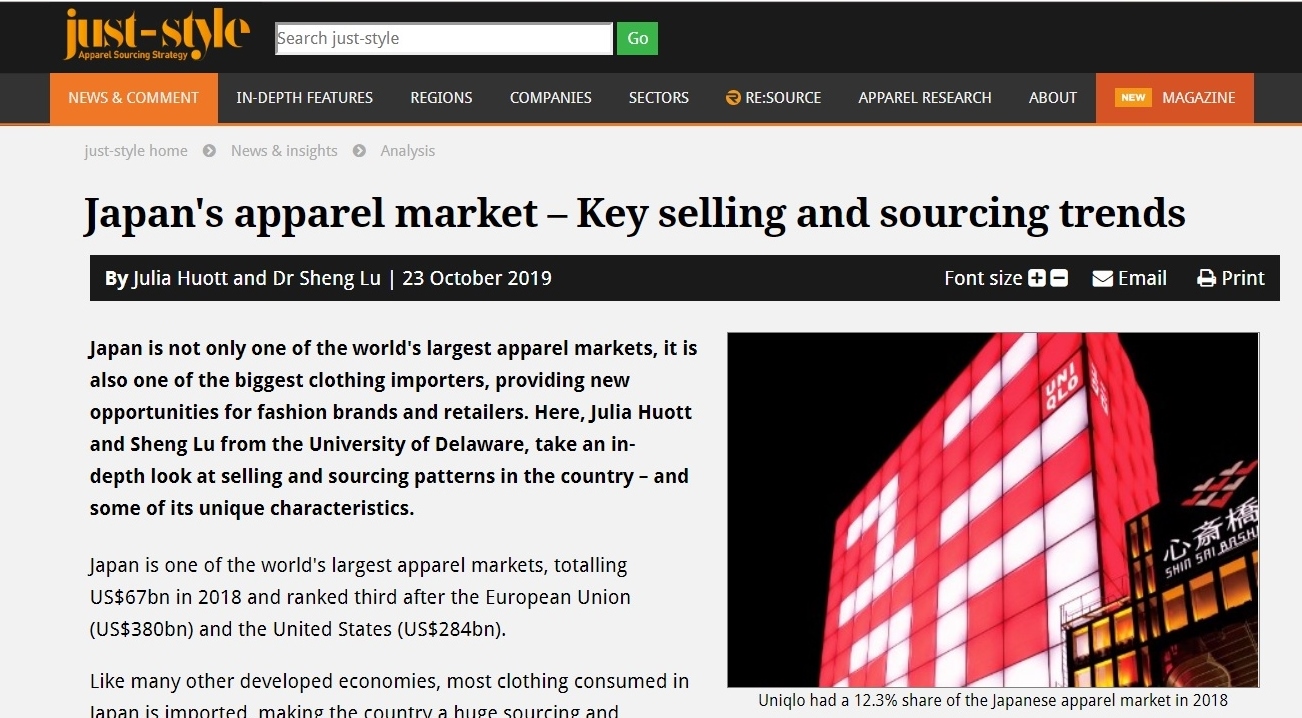
First, the total value of Japan’s apparel imports has been growing steadily in line with consumption patterns. Between 2010 and 2018, the value of Japan’s apparel imports enjoyed a 2.7% compound annual growth rate, which was lower than the US (3.4%), but higher than the EU (1.9%) and the world average (1.3%) over the same period.

Second, while China remains the top supplier, Japanese fashion brands and retailers are also diversifying their sourcing bases. Similar to their counterparts in the US and EU, Japanese fashion brands and retailers are actively seeking alternatives. Imports from Vietnam, Bangladesh, and Indonesia have been growing particularly fast, even though their production capacity and market shares are still far behind China.

helmut-lang-cream-silk-v-neck-asymmetrical-sweaterpullover-size-0-xs-4-0-960-960.jpg

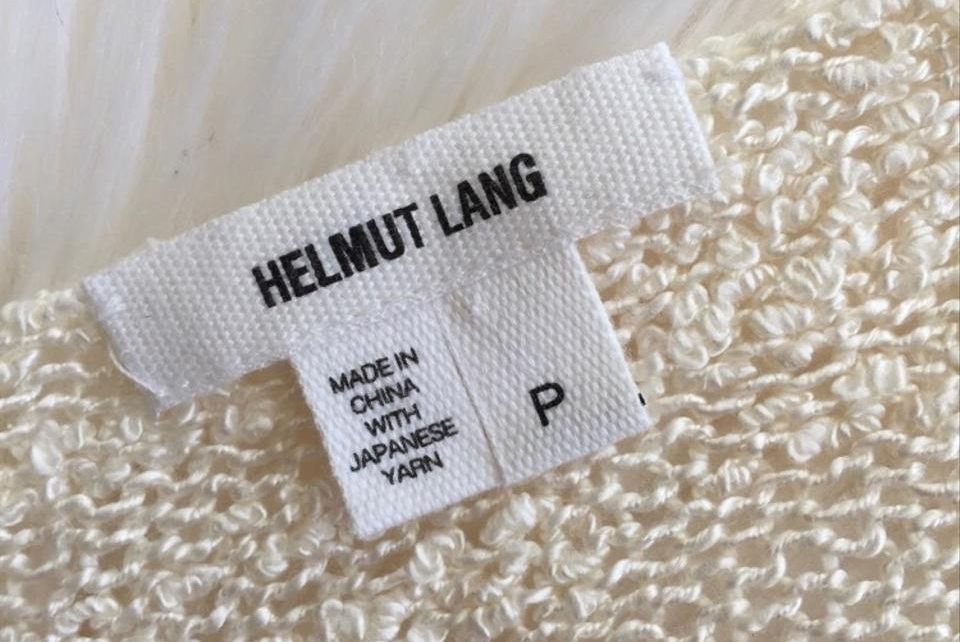
Third, Japanese fashion companies are increasingly sourcing from Asia. As of 2018, only 7.5% of Japan’s apparel imports came from non-Asian countries (mostly western EU countries), a notable drop from 11.4% back in 2000. A good proportion of Japan’s apparel imports from Asia actually contain fibers and yarns originally made in Japan. For example, it is not difficult to find clothing labeled ‘Made in China’ or ‘Made in Vietnam’ that also includes phrases such as ‘Using soft, slow-spun Japanese fabric’ and ‘With Japanese yarns’ in the detailed product description.

Fourth, overall, Japan sets a lower tariff barrier for apparel than other leading import countries. As of September 2019, there were around 15 FTAs and TPAs in force in Japan, whose members include several 1st tier apparel supplying countries in Asia, such as Vietnam, Bangladesh, India, Indonesia, and Cambodia. Most of these trade programs adopt the so-called “fabric-forward” rules of origin (also known as “double-transformation” rules of origin). Additionally, Japan is actively engaged in negotiations on a trilateral free trade agreement with China and South Korea, and the Regional Comprehensive Economic Partnership (RCEP), which involves Japan, South Korea, China and members of the Association of Southeast Asian (ASEAN) countries. Once reached and implemented, these trade agreements will provide new exciting duty-saving sourcing opportunities, including from China, the top apparel exporter in the world.

New Report: Fashion’s New Must-have—Sustainable Sourcing at Scale

Untitled

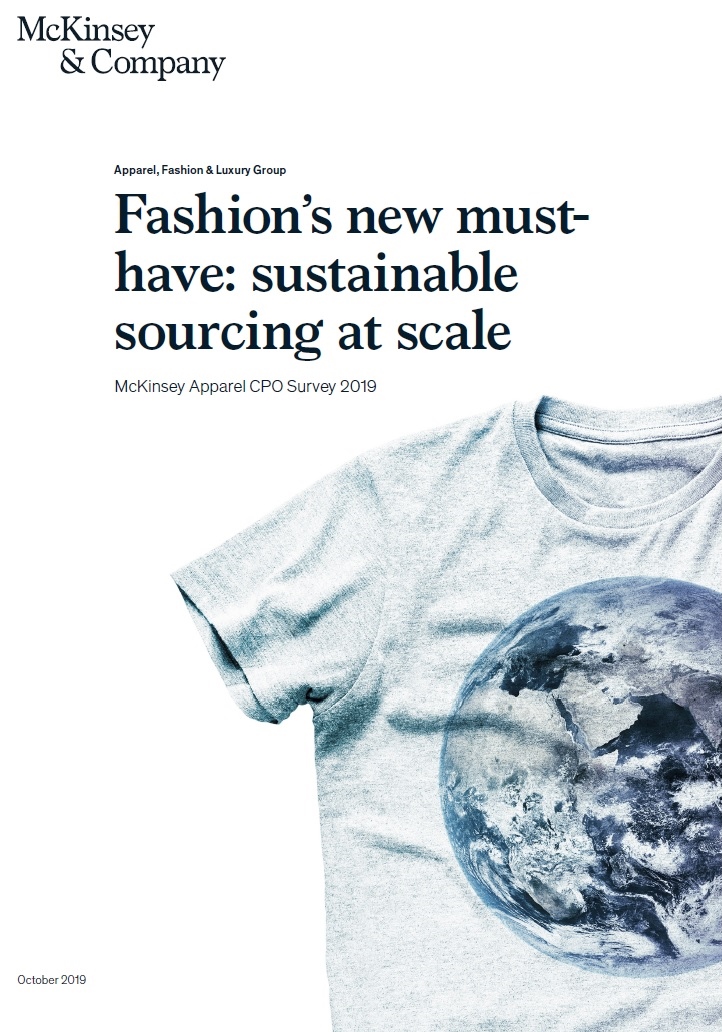
The study was based on a survey of 64 sourcing executives from vertical apparel retailers, hybrid wholesalers, and sportswear companies, with a total sourcing volume of $100 billion. Below are the key findings of the report:

  • More sourcing executives now focus on process improvements in their companies, such as sustainability and transparency (56% of respondents), digitalization of sourcing process and related areas (45% of respondents), consolidation of supplier base (42% of respondents), end-to-end process efficiency (41% of respondents) than shifting sourcing countries (20% of respondents). Related, as cost gaps between sourcing destinations are narrowing, apparel companies are shifting from minimizing the price of supply to a focus on customer-centric, agile product development to meet customer demand. Digitalization, such as intelligent sourcing, is one of the most promising areas.
  • Affected by the on-going U.S.-China tariff war, two-thirds of surveyed companies expect their overall sourcing cost to increase in the years ahead, including 37.5% expecting a 2-4% increase and 25% expecting 1-2% increase. However, only 3.1% of respondents expect a significant cost increase (>4%).
  • Echoing the findings of other recent studies, respondents plan to source relatively less from China through 2025. Bangladesh, Vietnam, Myanmar, and Ethiopia are among the top alternative sourcing destinations. Meanwhile, more companies are considering near-sourcing. The biggest challenge, however, is limited fabric production capacity, NOT higher wages.
  • Sustainable apparel sourcing is regarded as a must—70% of EU companies and 35% of North American companies surveyed say “responsible and sustainable sourcing was on the CEO agenda.” Top challenges to achieve sustainable apparel sourcing include “no common, objective industry standard on sustainable sourcing”, “consumers lack a clear picture of what sustainable fashion is all about”, “mixed influence of the sourcing function in company-wide sustainability strategy.” Further, more companies prioritize environmental-sustainability initiatives (issues such as sustainable material, recycled material, traceability, and packing) than social sustainability initiatives (issues such as) fair on living wage and decent work). Additionally, respondents hold competing views on whether sustainability will increase sourcing costs overall. Around 58% of respondents see additional costs for sustainable sourcing between 1% and 5%.
  • Sustainability will play an increasingly important role in how apparel companies select their suppliers. Some surveyed apparel brands and retailers say they have upgraded their supplier ratings over the last couple of years, moving away from viewing sustainability simply as a compliance-based hygiene factor and instead embracing criteria that are more sophisticated.
  • There is also a need to shift from the transactional-based, season-by-season and the low-commitment relationship between apparel companies and their vendors to strategic partnerships between the two. Around 73% of respondents plan to consolidate their supplier base by at least 5% over the next few years. Related, apparel companies increasingly empower suppliers for self-auditing with tools like the Higg Index.

Textile and Apparel as an Academic Discipline

This video is a joint effort by faculty in the textile and apparel (T&A) programs across the country, hoping to inspire critical thinking on the future of the T&A academic discipline and help others know better about what we are doing in terms of teaching and scholarships.

This video, produced by the Economist, highlights the changing nature of the fashion industry driven by material science and data science.

U.S.-Japan Trade Agreement (Updated: September 2019)

US_Japan_flags

On 16 September 2019, the Trump administration notified U.S. Congress of its intent to enter into a trade agreement on “tariff barriers” with Japan as well as an “executive agreement” on digital trade. According to the announcement, the Trump administration plans to utilize Section 103(a) of the 2015 Trade Promotion Authority law, which allows the president to modify tariffs WITHOUT congressional approval. While details of the tariff agreement are not yet available, U.S. Trade Representative Robert Lighthizer in August said the deal with Japan would focus on beef, pork, wheat, dairy products, wine, and ethanol, as well as on industrial goods.

The 16 September notification also says the Trump administration will “further negotiations with Japan to achieve a comprehensive trade agreement that results in more fair and reciprocal trade between the United States and Japan.” Such a more comprehensive trade agreement, however, will require congressional approval.

On December 21, 2018, Office of the U.S. Trade Representative (USTR) released negotiating objectives of the proposed U.S.-Japan Free Trade Agreement (USJTA). Overall, USJTA aims to address both tariff and non-tariff barriers to achieve fairer and more balanced trade between the two countries. Regarding the textiles and apparel sector, USTR says it will “secure duty-free access for U.S. textile and apparel products and seek to improve competitive opportunities for exports of U.S. textile and apparel products while taking into account U.S. import sensitivities” during the negotiation. USJTA also will “establish origin procedures for the certification and verification of rules of origin that promote strong enforcement, including with respect to textiles.”

Should the newly announced U.S.-Japan trade deal remove the tariffs for textiles and apparel traded between the two countries, the overall economic impact on related trade flows could be modest. Data from the UNComtrade shows that in 2018 U.S. imported $656 million textiles (SITC 26 and 65) and $88 million apparel (SITC 84) from Japan, accounting for 2.1% and 0.1% of total U.S. textile and apparel imports respectively. Meanwhile, in 2018 Japan imported around $353 million textiles and $121 million apparel from the U.S., accounting for 3.7% and 0.4% of Japan’s total textile and apparel imports that year respectively.

In comparison, over 70% of U.S. textile and apparel exports went to the Western-Hemisphere and U.S. imported textiles and apparel mostly from NAFTA & CAFTA-DR members and other Asian countries (such as China and Vietnam). Likewise, Japan also has a much closer trade tie with other Asian countries because of the regional textile and apparel trade patterns (or commonly known as “factory Asia”).

japanUS

On the other hand, the elimination of tariffs and potentially non-tariff barriers under the U.S.-Japan trade deal could expand the bilateral trade flows for technical textiles. Notably, the top categories of U.S. textile and apparel exports to Japan in 2018 were mostly technical textiles such as specialty and industrial fabrics, filament yarns, and non-woven textiles. Likewise, the top categories of Japan’s textile and apparel exports to the U.S. in 2018 also include special-purpose fabric, non-woven fabric, and synthetic filament fabrics.

Additionally, the textiles and apparel-specific rules of origin (RoO) is likely to remain a heated debate in the US-Japan trade negotiation. To protect the interests of the U.S. textile industry and the Western-Hemisphere regional textile and apparel supply chain, most free trade agreements enacted in the United States adopt the so-called “yarn-forward” RoO. Even though the U.S.-Japan trade agreement may not be a too big deal economically, the U.S. textile industry is unlikely to give up the RoO fight. However, most free trade agreements enacted in Japan adopt more liberal fabric-forward rules of origin (or commonly called “double transformation”). As textile and apparel production in Japan is increasingly integrated with other Asian countries, the strict “yarn-forward” RoO could prevent Japanese textile and apparel exporters from enjoying the preferential duty benefits under the U.S.-Japan trade agreement fully.

Brexit and the Global Fashion Industry: Discussion Questions from FASH455

skynews-brexit-westminster_4764028

#1 To which extent should globalization be responsible for Brexit? Does Brexit imply globalization is in retreat? Why or why not?

#2 Why do you think the fashion industry is a stakeholder of “Brexit”? It is said that “some of the world’s poorest countries may end up the victims of Brexit.” Why is that?

#3 The article mentioned the possibility of London losing its reputation as a global fashion capital because of Brexit. What is your evaluation?

#4 Should the UK fashion industry vote for Brexit? Why or why not?

#5 Overall, from the case of Brexit, how do you understand that textile and apparel is a global sector?

[For FASH455: 1) Please mention the question number in your comments; 2) Please address at least TWO questions in your comments]

[Discussion for this post is closed]

15% and 25% Section 301 Punitive Tariffs on Apparel Imports from China: Retail Price Impact Assessment

1

2.jpg

3.jpg

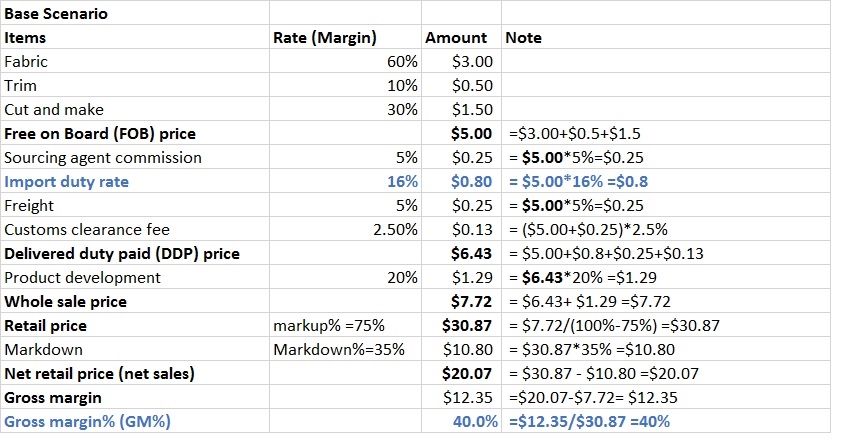
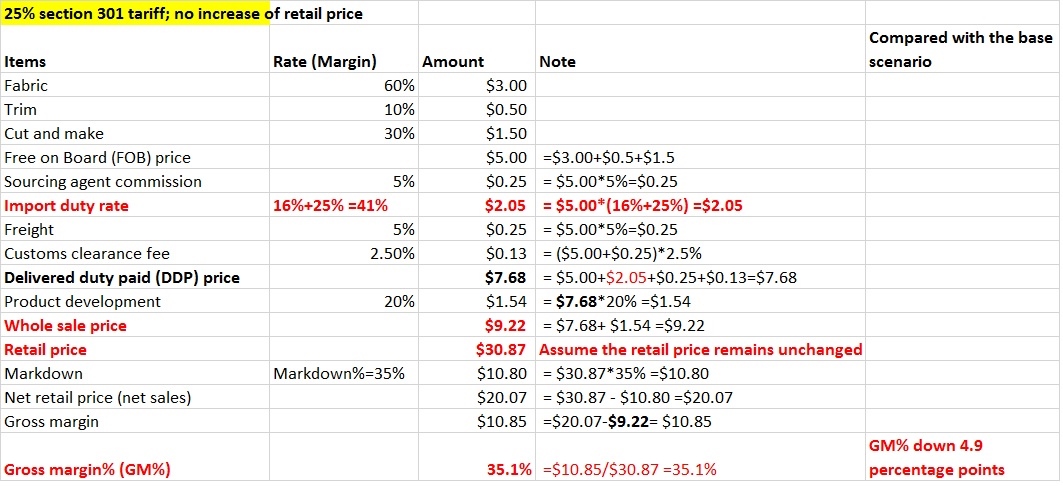
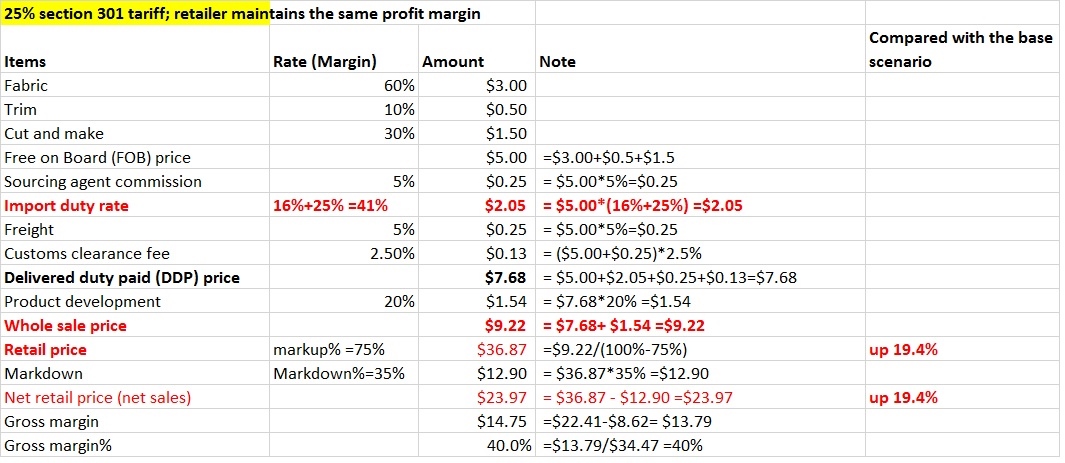
The Trump administration has imposed 15% Section 301 punitive tariffs on $300 billion Chinese products (tranche 4) effective September 1, 2019, which includes almost 80% of U.S. apparel imports from China. As illustrated above, 15% punitive tariffs mean:

  • If the retailer keeps the retail price unchanged, its gross margin% could drop around 2.9-3 percentage points.
  • If the retailer tries to maintain a gross margin% of 40%, it may have to increase the retail price by around 11.5-12%.

3.jpg

4.jpg

Likewise, should the punitive tariffs reach 25%, it means:

  • If the retailer keeps the retail price unchanged, its gross margin% could drop around 4.9-5.0 percentage points.
  • If the retailer tries to maintain a gross margin% of 40%, it may have to increase the retail price by around 19.4-20%.

(Welcome for any comments and suggestions)

by Sheng Lu

American Giant: $108 Hoodie Made in the USA

Untitled

Discussion questions:

  1. Is it still meaningful to promote apparel 100% “Made in the USA” in today’s global economy? Why or why not?
  2. From the video, what is your evaluation of the strength, weakness, opportunity, and threat of American Giant’s business?
  3. From the video and our class discussions, why or why not do you think the U.S.-China tariff war has benefited textiles and apparel “Made in the USA”?
  4. Will you be interested in working in a textile mill/garment factory as featured in the video after graduation? Why or why not?
  5. Any other thoughts/reflections from the video?

[For FASH455: 1) Please mention the question number in your comments; 2) Please address at least TWO questions in your comments]

Additional readings:

U.S.-China Tariff War Escalates–Impact on Apparel and Footwear

Background: In response to China’s decision to impose 5%–10% retaliatory tariffs on $75 billion U.S. products, on August 23, 2019, the Trump administration announced to raise the Section 301 tariffs from 25% to 30% for around $250 billion Chinese products (tranche 1, 2 and 3), effective October 1, 2019. The scheduled Section 301 tariffs on $300 billion Chinese products (tranche 4) to take into effect on September 1, 2019 and December 15, 2019 will also be increased from 10% to 15%.

IMG_0998
Trump lashes out at China, sending markets reeling

U.S. fashion brands and retailers are deeply concerned about the negative impacts of the tariff war on their businesses. According to the 2019 U.S. Fashion Industry Benchmarking Study released by the U.S. Fashion Industry Association, even without considering the upcoming 10-15% tariffs to be imposed on around $35.7 billion Chinese textiles and apparel covered by tranche 4:

  • The trade diversion effect of Section 301 has accelerated U.S. fashion companies’ pace of reducing sourcing from China. About 83 percent of respondents expect to decrease sourcing from China over the next two years, up further from 67 percent in 2018.
  • The Section 301 action is pushing up the price of U.S. apparel imports across the board, making “increasing production and sourcing cost” the top business challenge for respondents in 2019. As much as 63 percent of respondents explicitly say the U.S. Section 301 tariff action against China “increased my companies’ sourcing cost” in 2019. As companies are moving sourcing orders to Bangladesh, Vietnam, and India, the average price of U.S. apparel imports from these countries – the main alternatives to China — have all gone up very quickly.
  • No evidence shows that Section 301 has benefited near-sourcing from the Western Hemisphere and reshoring from the United States significantly. Instead, respondents say Section 301 has increased the production costs of textiles and apparel “Made in the USA.”
  • Respondents say they are reluctant but may have to increase their retail prices, should the U.S.-China tariff war escalate further.

Related reading:

When ‘Made in Vietnam’ Products Are Actually From China

As described in the video, transshipment is one form of illegal import activities and occurs when false country-of-origin information is provided for imported goods in order to evade U.S. customs duties. Transshipment was a major issue in textile and apparel trade back in days when the quota system was still in place.

According to the media, because of the escalating U.S.-China tariff war, customs fraud such as transshipment is thriving again. Some fashion companies are also using tariff engineering to avoid paying the punitive tariffs in a legal way. Indeed, how to label “Made in ___” can be much more complicated, technical and subtle than we realize.

Related reading:

WTO Reports World Textile and Apparel Trade in 2018

Updated data in 2019 is now available: WTO Reports World Textiles and Apparel Trade in 2019
1

2.jpg

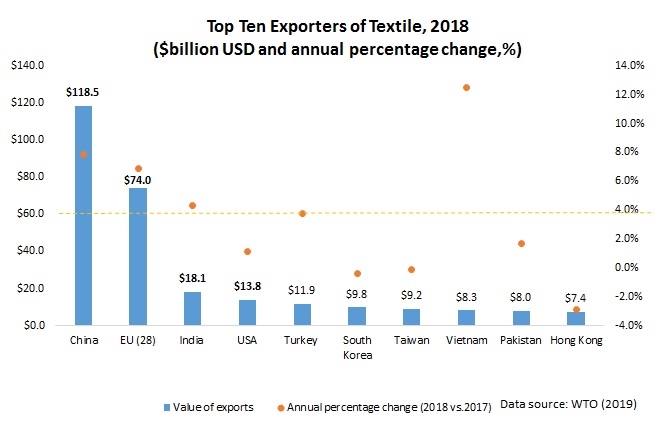
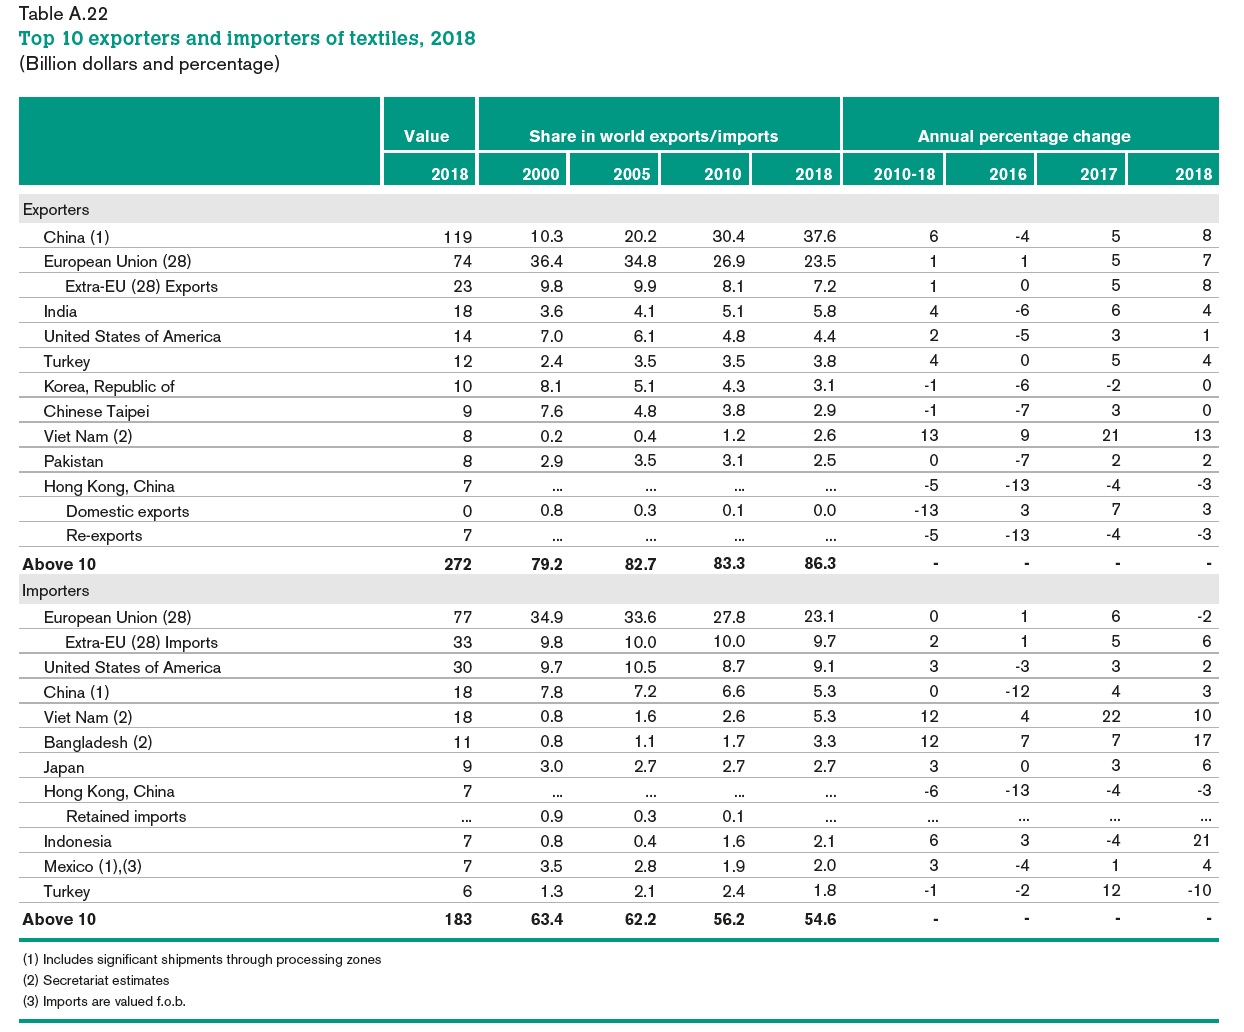
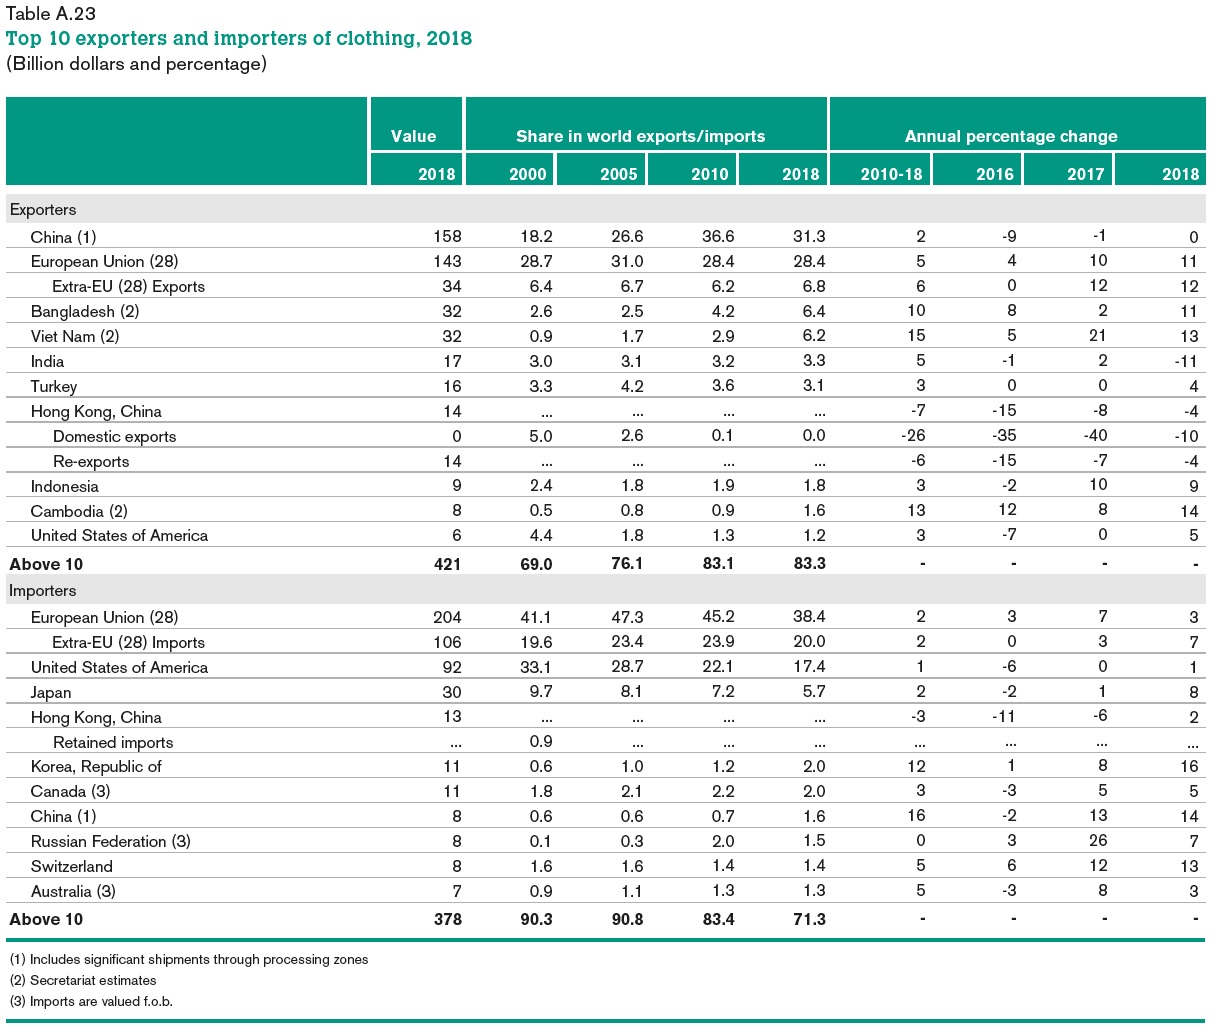
According to the World Trade Statistical Review 2019 newly released by the World Trade Organization (WTO), the current dollar value of world textiles (SITC 65) and apparel (SITC 84) exports totaled $315 billion and $505 billion in 2018 respectively, increased by 6.4% and 11.1% from a year earlier. This has been the fastest growth of world textile and apparel trade since 2012. Specifically: 

I. Textile export

China, European Union (EU28), and India remained the world’s top three exporters of textiles in 2018. Altogether, these top three accounted for 66.9% of world textile exports in 2018, a new record high since 2011. Notably, China and EU (28) also enjoyed a faster-than-world-average export growth in 2018, up 7.9% and 6.9% respectively. The United States remained the world’s fourth top textile exporter in 2018, accounting for 4.4% of the shares, down slightly from 4.6% in 2017.

II. Apparel export

China, the European Union (EU28), Bangladesh, and Vietnam unshakably remained the world’s top four largest exporters in 2018. Altogether, these top four accounted for as much as 72.3% of world market shares in 2018, which, however, was lower than 75.8% in 2017 and 74.3% in 2016—primarily due to China’s declining market shares. Notably, even though apparel exports from Vietnam (up 13.4%) and Bangladesh (up 11.1%) enjoyed a fast growth in absolute terms in 2018, their gains in market shares were quite limited (up 0.3 percentage point from 5.9% to 6.2% for Vietnam and up 0.1 percentage point from 6.4% to 6.5% for Bangladesh). This result once again suggests that due to capacity limits, no single country has emerged to become the “Next China.” Instead, China’s lost market shares in apparel exports were fulfilled by a group of countries, a phenomenon which can be linked with fashion brands and retailers’ sourcing diversification strategy.

III. Textile import

The European Union (EU28), the United States, and China were the top three largest importers of textiles in 2018, accounting for 37.5% of the world’s total textile imports that year. Although the market shares of the top three in 2018 were close to 37.7% a year earlier, it nevertheless was much lower than over 50% back in the 2000s. The increasing diversification of textile import market is associated with the shifting pattern of world apparel manufacturing and export closely.

IV. Apparel import

Affected by consumers’ purchasing power (often measured by GDP per capita) and size of the population, the European Union, the United States, and Japan remained the world’s top three importers of apparel in 2018. Altogether, these top three absorbed 61.5% of world apparel in 2018, which, however, was lower than 62.3% in 2017 and a significant drop from 84% back in 2005. Behind the result, it is not the case that consumers in the EU, U.S., and Japan are importing less clothing. Instead, several emerging economies (such as China) are becoming fast-growing apparel consumption markets and starting to import more. As consumers’ purchasing power in these emerging economies continues to improve, we could expect a more diversified world apparel import market in the years ahead.

textile

clothing.jpg

Additional reading: Latest trends in world textile and apparel trade

Why Fashion Merchandisers Need to Know about Sourcing

U.S. Textile and Apparel Industry is NOT Immune to the U.S.-China Tariff War

The full article is available HERE

This article tries to evaluate the potential impact of the U.S.-China tariff war on the U.S. textile and apparel (T&A) industry, including manufacturing and related trade activities.

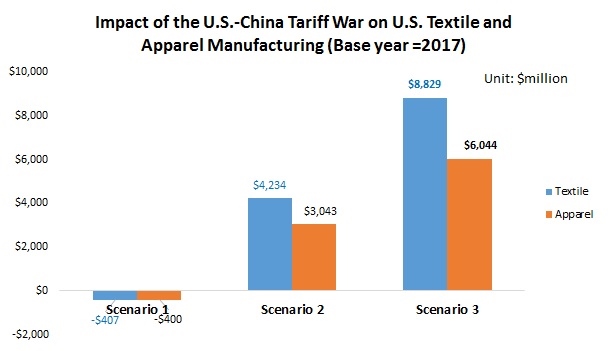
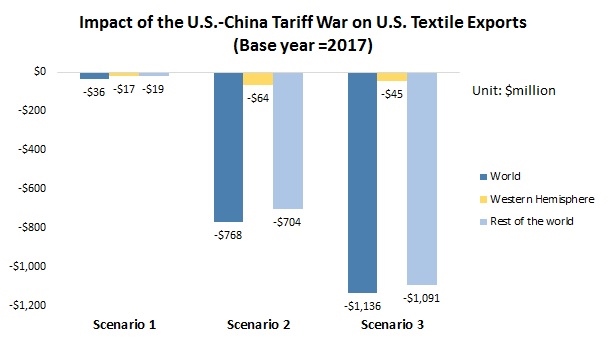
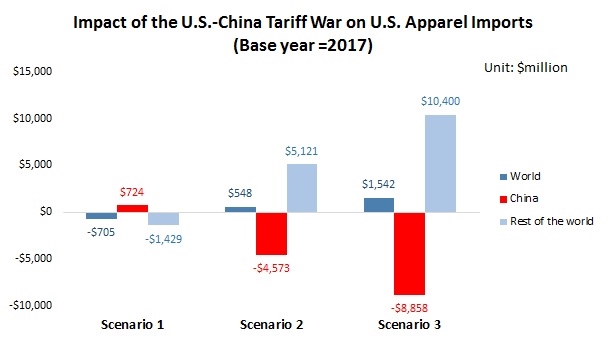
The quantitative evaluation conducted is based on the Global Trade Analysis Project (GTAP) model. Data came from the latest GTAP9 database, which covers trade, employment and production in 57 sectors in 140 countries. In correspondence to the recent development of the U.S.-China tariff war, the analysis focuses on the following three scenarios:

  • Scenario 1: 10% punitive tariff + base year tariff rate in 2017 applied to products traded between the U.S. and China, except textiles and apparel
  • Scenario 2: 10% punitive tariff + base year tariff rate in 2017 applied to products traded between the U.S. and China, including textiles and apparel
  • Scenario 3: 25% punitive tariff + base year tariff rate in 2017 applied to products traded between the U.S. and China, including textiles and apparel

Three findings are of note:

First, the tariff war with China will increase the market price for T&A in the United States and consequentially incentivize more production of T&A “Made in the USA.” As shown in Figure 1, the annual U.S. T&A production will increase when the punitive tariff is imposed on textile and apparel imports from China. The most significant increase will happen in scenario 3 (textile output expands by US$8,829 million and apparel output expands by US$6,044 million) when a 25 percent punitive tariff is imposed and the market price of T&A in the U.S. also correspondingly goes up by nearly 1.5% compared with the base year level in 2017.

Second, the tariff war with China will hurt U.S. textile exports. The results show that the tariff war will increase the production cost of “Made in the USA,” and result in a decline of U.S. textile exports due to reduced price competitiveness. This is the case even in scenario 1 when the tariff war does not target T&A directly, but nevertheless, raises the price of intermediaries for producing textiles in the United States. The results further show that the annual U.S. textile exports will suffer the most significant decline in scenario 3 (down US$1,136 million), especially to China and other Asian countries where U.S. textile products are facing intense competition from local suppliers. In comparison, U.S. textile exports to the Western Hemisphere will suffer a loss as well in the tariff war, but to a much less extent due to the strong supply-chain relationship with the region.

Third, the trade diversion effect of the tariff war will bring in more apparel imports to the U.S. market from Asian suppliers other than China. As shown in the figure above, when the punitive tariff imposed on textile and apparel products, the value of U.S. apparel imports from China will decline ranging from US$4,573 million (10 percent punitive tariff imposed) to US$8,858 million (25 percent punitive tariff imposed) annually compared with the base year level in 2017. This result reflects U.S. apparel importers and retailers’ mounting concerns about sourcing cost in the setting of the tariff war. However, apparently, the tariff war will do little to help U.S. domestic apparel manufacturers reduce the competitive pressure with imports. Particularly, in scenario 3, U.S. apparel imports from suppliers other than China will increase as much as US$10,400 million, worsening the U.S. trade deficit in the apparel sector further.

by Sheng Lu

Challenges facing Sub-Saharan Africa (SSA) as an Apparel Sourcing Base

2559302604b1a6b334ad302dec1864ce

Sub-Saharan Africa (SSA) is widely regarded as a growing apparel-souring destination. Particularly, U.S. Congress established the African Growth and Opportunity Act (AGOA), a non-reciprocal trade preference program, in 2000, to help developing SSA countries grow their economy through expanded exports to the United States. Because apparel production plays a dominant role in many SSA countries’ economic development, apparel has become one of the top exports for many SSA countries under AGOA. Notably, the “third-country fabric provision” under AGOA allows US apparel imports from certain SSA countries to be qualified for duty-free treatment even if the apparel items use yarns and fabrics produced by non-AGOA members, such as China, South Korea, and Taiwan. This special rule is deemed as critical as most SSA countries still have no capacity in producing capital and technology-intensive textile products.

That being said, to play a bigger role as an apparel sourcing base, SSA is not without significant challenges:

Challenge 1: limited industry upgrading and local textile production capacity

Theoretically, as a country’s economy advances, it should gradually be producing and exporting more capital and technology-intensive textiles versus labor-intensive apparel products. This is the notable trends in many Asian countries (such as China and Vietnam), where the textile/apparel export ratio has been rising steadily between 2005 and 2017. However, as a reflection of the stagnant industry upgrading, the textile/apparel export ratio remains fairly low in SSA, including in Lesotho, Kenya, and Mauritius, the top three largest apparel exporters in the SSA region.

Challenge 2: Slow and no progress in export diversification

Ideally, as the economy becomes more sophisticated, textiles and apparel (T&A) should account for a declining share in a country’s total merchandise exports. Countries such as China, Vietnam, and ASEAN demonstrate perfect examples. However, in some SSA countries (e.g., Lesotho), T&A has stably accounted for over 80% of their total merchandise exports over the past 17 years, a sign of slow or no progress in export diversification. In other SSA countries, T&A accounted for less than 10% of their total merchandise exports, suggesting the sector is not a priority to the local economy.

Challenge 3: Intense competition both in key export markets and domestic market

As of 2017, over 96% of SSA countries’ T&A exports went to three markets: the United States, the EU, and other SSA members. However, because of the intense competition, except for the regional SSA market, SSA countries account for merely 1.4% and 0.2% of total U.S. and EU textile and apparel imports in 2017 respectively.

5

Even more concerning, the T&A industry in SSA countries is facing growing competition in the domestic market with cheap imports, mostly from Asia. Notably, SSA countries import MORE apparel than they export, a phenomenon rarely seen among developing countries in a similar stage of economic development.

Challenge 4: U.S. companies remain low interest in investing in the region directly

According to several recent studies, leading U.S. fashion brands and retailers remain low interest in investing in the SSA region directly, even though companies admit more investments in areas such as infrastructure are critical to the success of SSA countries serving as competitive apparel sourcing bases. Some argue that the “temporary” nature of AGOA make companies hesitant to build factories in SSA. However, should AGOA become a permanent free trade agreement, which follows the principle of reciprocity, SSA countries would have to lower their trade barriers to U.S. products, including eliminating the tariffs and non-tariff barriers, in exchange for the reciprocal market access benefits from the United States. It doesn’t seem most AGOA members are ready for that stage yet.

by Sheng Lu

Further reading:

USITC Economic Assessment Report on USMCA—Textile and Apparel Sector Summary

On April 19, 2019, the U.S. International Trade Commission (USITC) released its independent assessment report on the likely economic impact of the U.S.-Mexico-Canada Free Trade Agreement (USMCA or NAFTA2.0). Below are the key findings of the report:

Impact of USMCA on the U.S. economy

USITC found that because of the size of the U.S. economy relative to the size of the Mexican and Canadian economies and the reduction in tariff and nontariff barriers that has already taken place among the three countries under the North American Free Trade Agreement (NAFTA), the overall impact of USMCA on the U.S. economy is likely to be moderate. For example, USITC’s computable general equilibrium (CGE) model suggests that compared to the base year level in 2017, USMCA could increase the U.S. GDP by 0.35% (or $68.2 billion) and create 0.17 million new jobs when other factors held constant.

Impact of USMCA on the textile and apparel sector

First, USITC found that the USMCA overall is a balanced deal for the textile and apparel sector, particularly regarding the rules of origin (RoO) debate. As USITC noted, USMCA eases the requirements for duty-free treatment for certain textile and apparel products, but tighten the requirements for other products. For example, USMCA eliminates the NAFTA requirements that visible linings must be sourced from members of the agreement; however, USMCA adds more restrictive new requirements for narrow elastic fabrics, sewing thread, and pocket bag fabric.

Second, USITC found that the USMCA changes to the Tariff Preference Level (TPLs) would not have much effect on related trade flows. As USITC noted in its report, where USMCA would cut the TPL level on particular U.S. imports from Canada or Mexico, the quantitative limit for these product categories was not fully utilized in the past.  Meanwhile, the TPL level for product categories typically fully used would remain unchanged under USMCA. The only trade flow that might enjoy a notable increase is the U.S. cotton and man-made fiber (MMF) apparel exports to Canada—the TPL is increased to 20million SME annually under USMCA from 9 million under NAFTA.

Third, USITC suggested that in aggregate, the changes under USMCA for the textile and apparel sector will more or less balance each other out and USMCA would NOT affect the overall utilization of USMCA’s duty-free provisions significantly. Notably, the under-utilization of free trade agreements (FTAs) by U.S. companies in apparel sourcing has been a long-time issue. Data from the Office of Textiles and Apparel (OTEXA) shows that of the total $4,292.8 million U.S. apparel imports from the NAFTA region in 2018, only $3,756.1 million (or 87.5%) claimed the preferential duty benefits under the agreement. As noted in the U.S. Fashion Industry Benchmarking Study, some U.S. fashion companies do not claim the duty savings largely because of the restrictive RoO and the onerous documentation requirements.

However, interesting enough, the USITC report says little about the potential impact of USMCA on U.S. textile and apparel manufacturing.

Timeline

On 30 September 2018, the United States reached USMCA with Canada and Mexico. On 30 November 2018, USMCA was officially signed by Presidents of the three countries. According to the Bipartisan Congressional Trade Priorities and Accountability Act of 2015 (the picture above), after the release of the USITC economic assessment report on USMCA, the Trump Administration will need to work with U.S. Congress to develop legislation to approve and implement the agreement. However, there remains huge uncertainties over USMCA’s prospect.

Related reading:

Trade 2030: The Future of World Trade


A group of eminent panelists will bring their experience on how digital technologies are changing international trade and how international trade cooperation can help governments reap the benefits and address the challenges of digital trade.

Speakers/Panalists:

  • Roberto Azevêdo, Director-General, World Trade Organization
  • Abdoullah Cisse, Professeur-Avocat, Carapaces Stratégies & Conformités
  • Caroline Freund, Director, Macroeconomics, Trade, and Investment Climate, World Bank
  • Susan Lund, Partner, McKinsey Global Institute