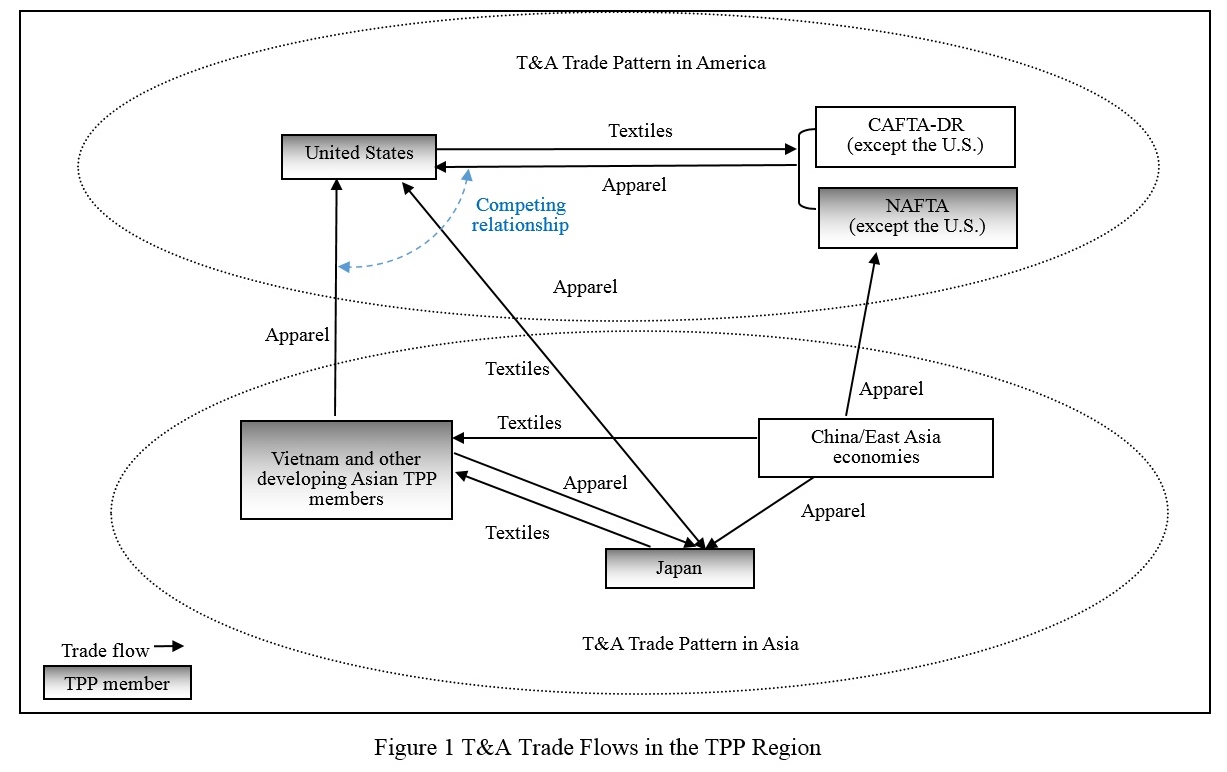
(Picture credit: Lu, S. (2015) Does Japan’s accession to the Trans-Pacific Partnership mean an opportunity or a threat to the U.S. textile industry? A quantitative evaluation, Journal of the Textile Institute, 106(5), 536-549.)
With the conclusion of the Trans-Pacific Partnership (TPP) negotiation on Oct 5, 2015, it is time to think about its potential impact. Specifically for the textile and apparel (T&A) industry, the followings studies may offer some hints (to read more, you can click each title):
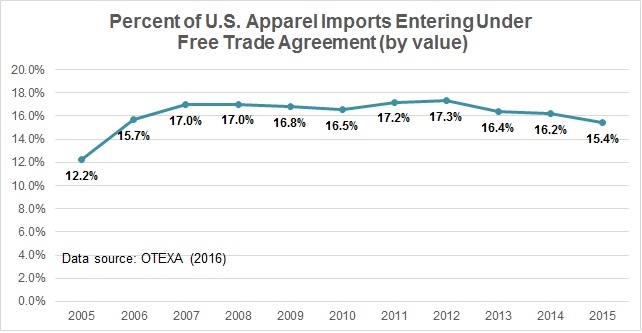
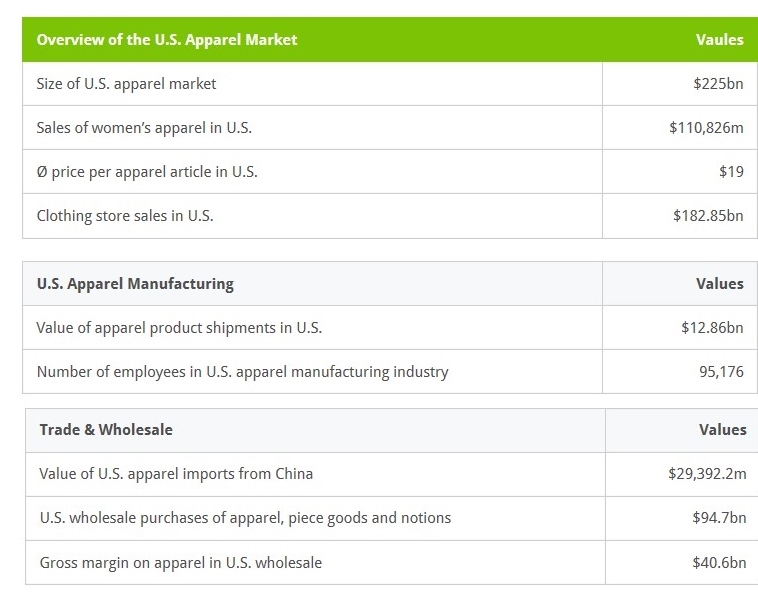
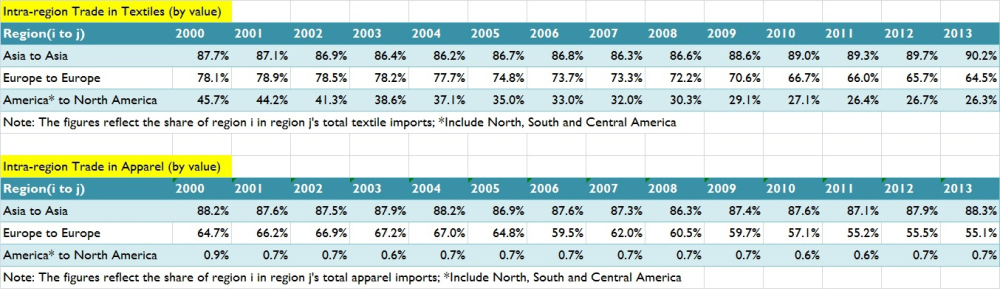
Trade Statistics
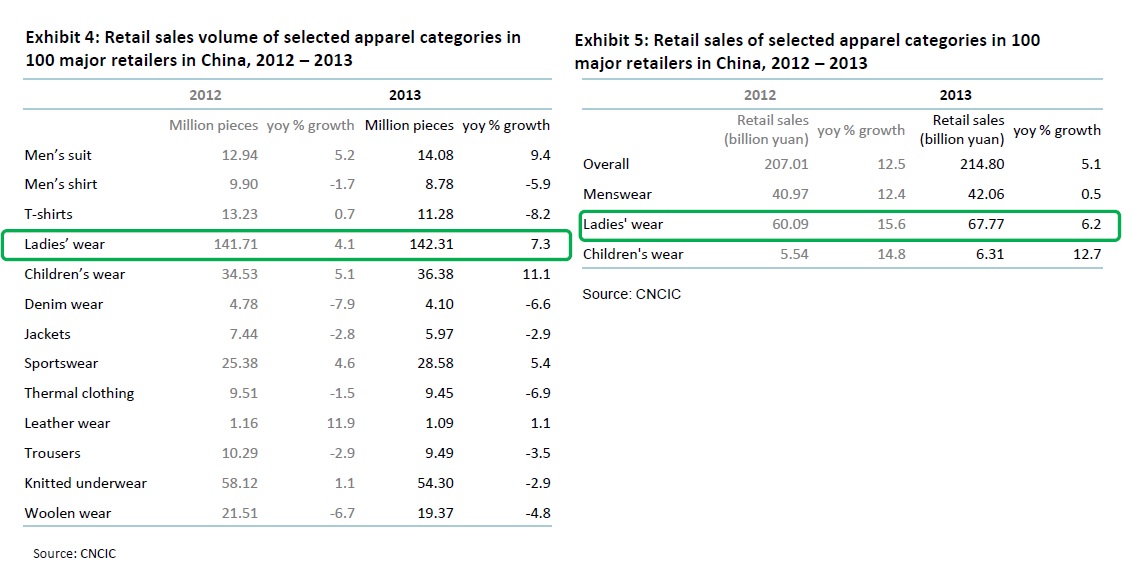
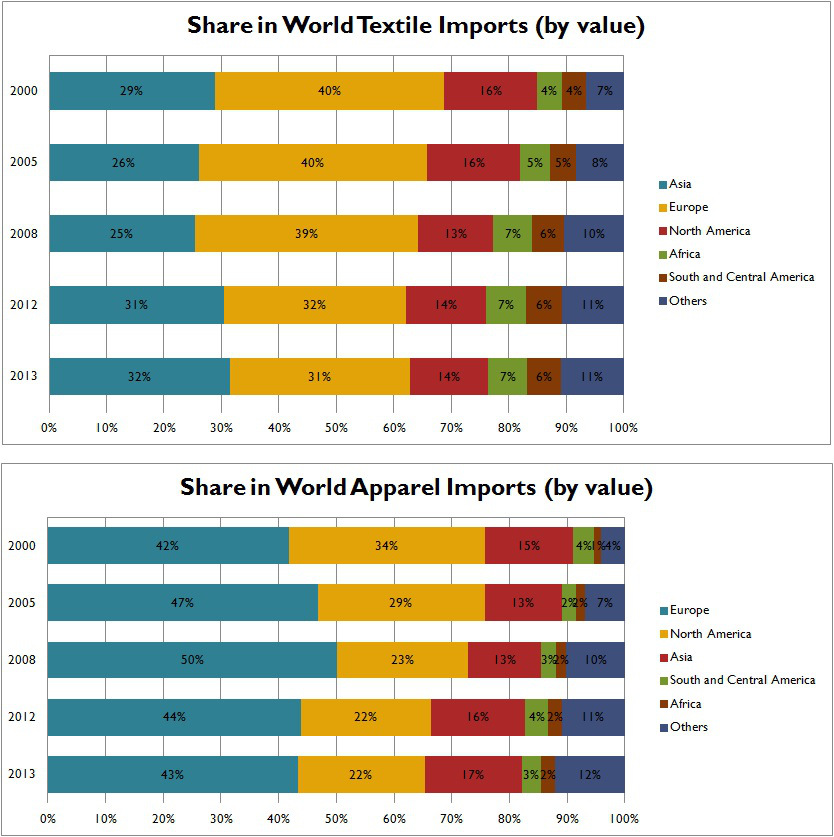
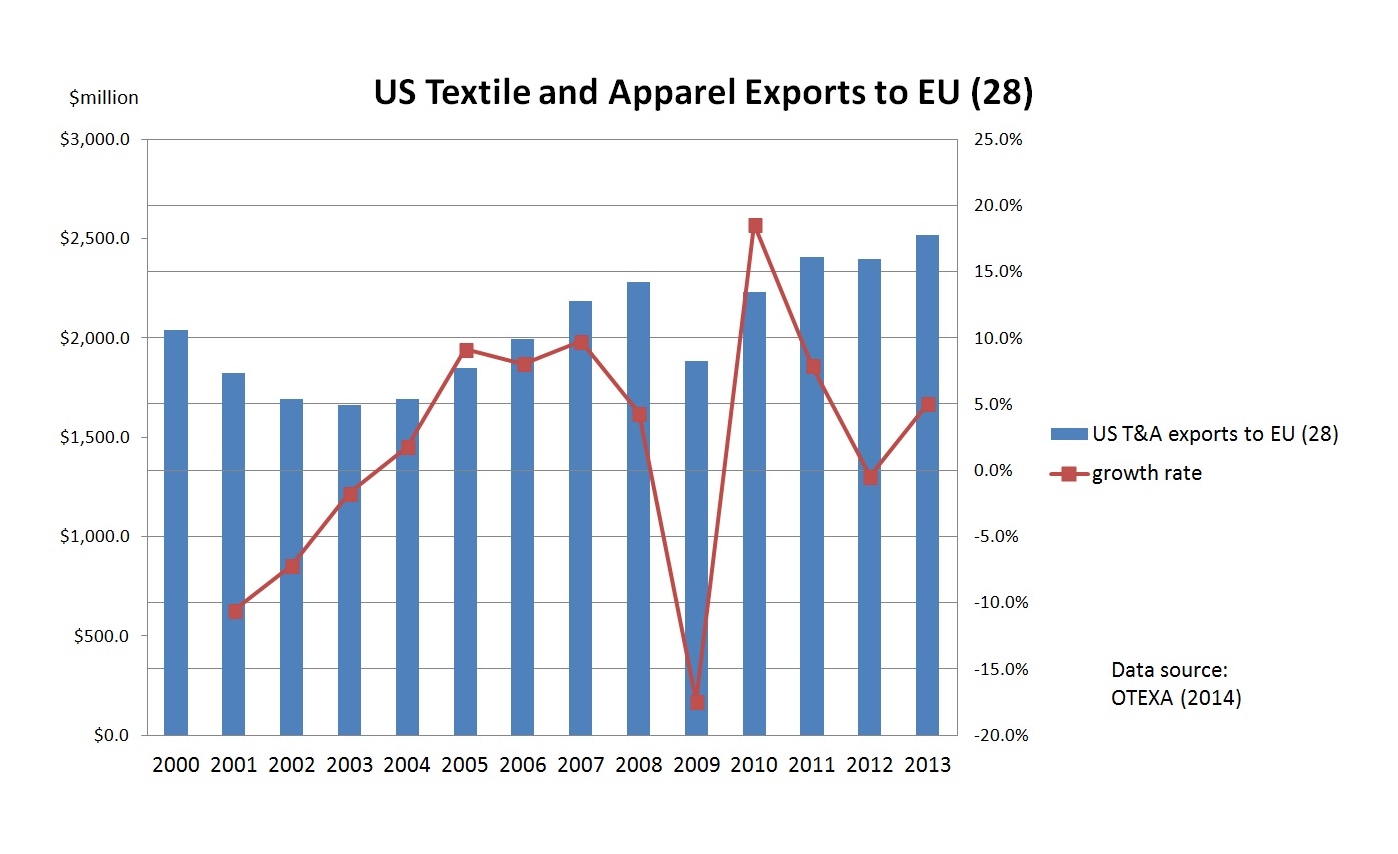
Statistics show the 12 TPP partners altogether imported $65 billion worth of textiles and $154 billion worth of apparel in 2013, which accounted for a world import share of 20 percent and 32 percent, respectively (WTO, 2015). In 2014, around 55 percent of U.S. textile and apparel exports (or $13.3 billion) went to the other 11 TPP partners, and 17 percent of U.S. textile and apparel imports (or $17.8 billion) came from the TPP region (OTEXA, 2015).
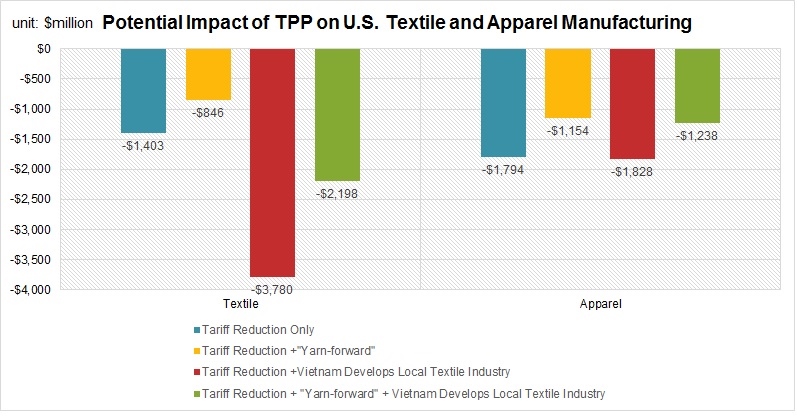
Impact of TPP on U.S. Textile and Apparel Manufacturing: A Preliminary Estimation
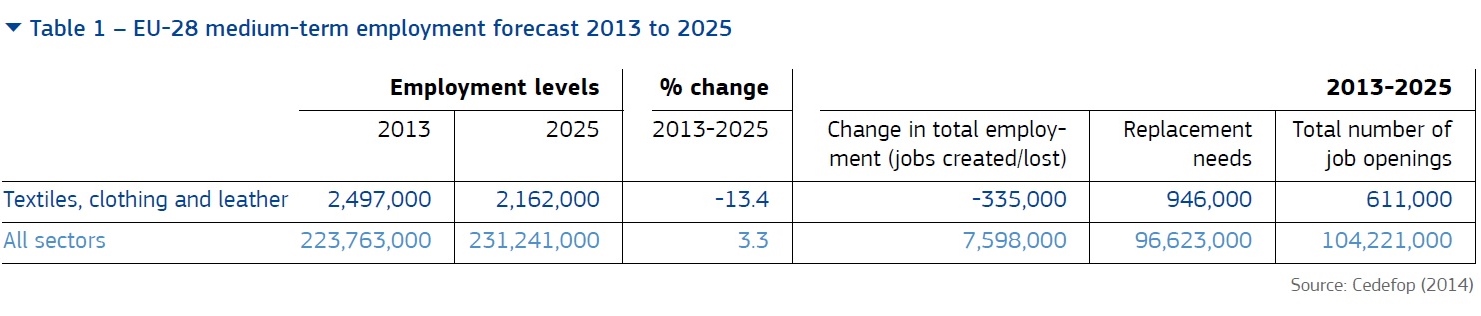
TPP overall will have a negative impact on U.S. domestic textile and apparel manufacturing. In all simulated scenarios, the annual manufacturing output in the United States will decline by $846 million–$3,780 million for textile and $1,154 million–$1,828 million for apparel than otherwise.
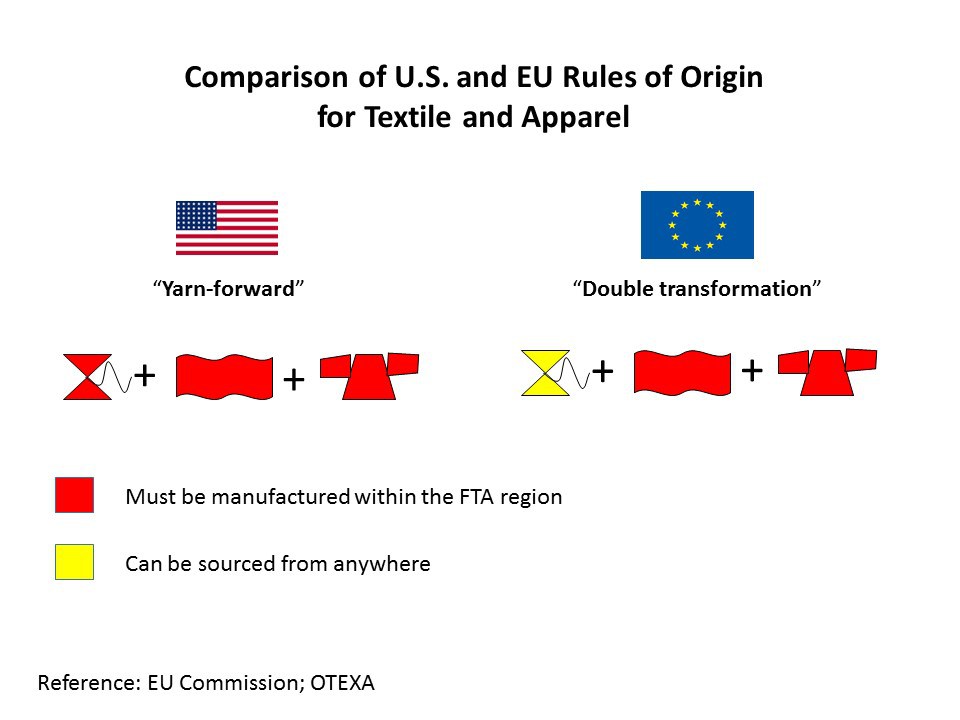
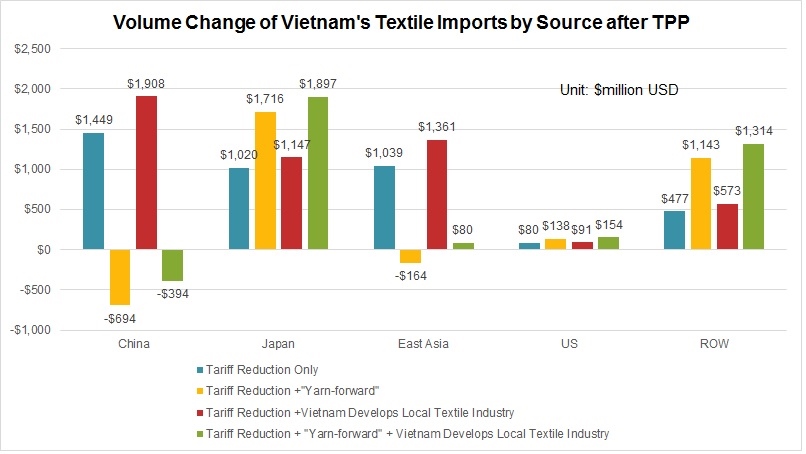
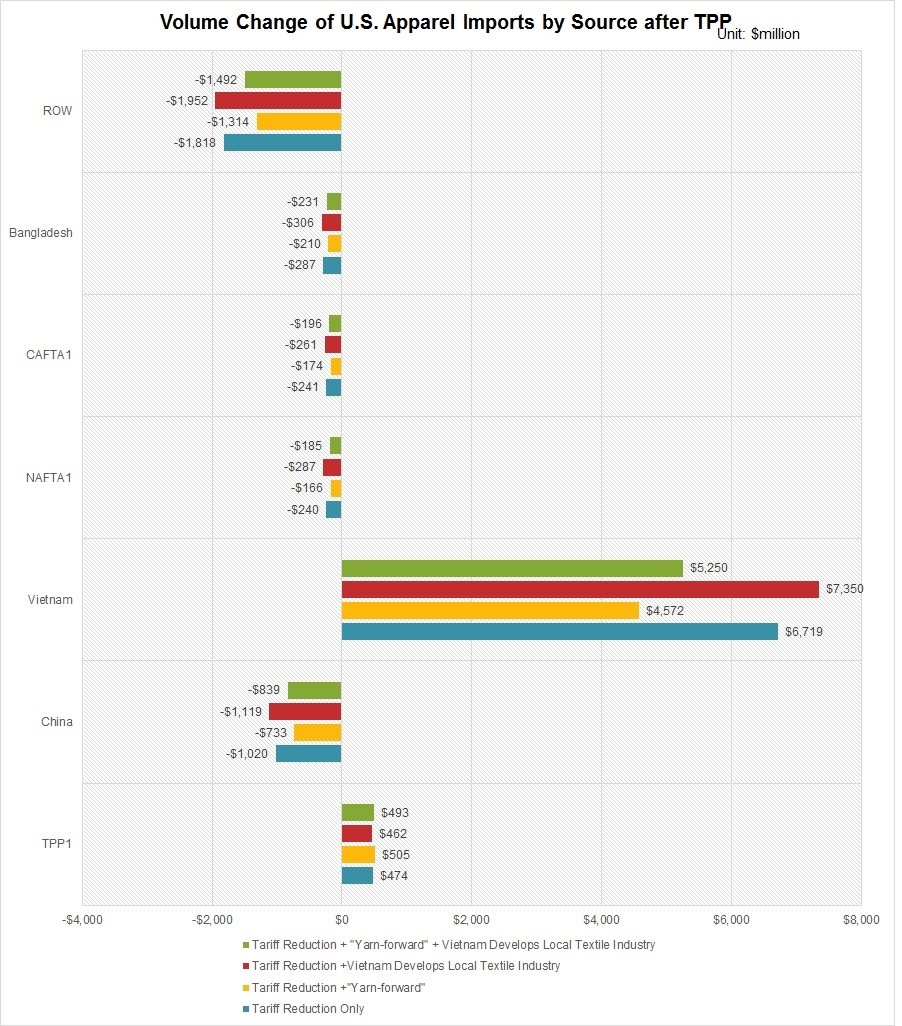
2.The “yarn-forward” rule may not substantially benefit U.S. domestic textile and apparel manufacturing as some people had suggested, for two reasons: 1) results show that Vietnam is more likely to use Japanese textiles than U.S. textiles when yarn-forward rule is in place. 2) U.S. apparel imports from Vietnam directly compete with those imported from NAFTA and CAFTA regions, the largest export market for U.S.-made yarns and fabrics. When NAFTA and CAFTA’s market share in the U.S. apparel import market is taken away by Vietnam, U.S. textile exports to NAFTA and CAFTA will decline anyway, regardless of whether Vietnam uses U.S.-made textiles.
3.Results suggest that compared with the “yarn-forward” rule, development of Vietnam’s local textile industry will have an even larger impact on the future of U.S. domestic textile and apparel manufacturing. Particularly, when Vietnam becomes more capable of making textile inputs by its own, not only Vietnam’s overall demand for imported textiles will decline, but also Vietnam’s apparel exports will become even more price-competitive in the U.S. as well as the world marketplace.
“Import Sensitive” Clothing and the TPP X-basket : What might include

Based on examining three recent trade programs, including: U.S. International Trade Commission (USITC) monitoring program on T&A imports from China based on the U.S.-China Textile Memorandum of Understanding (MOU) (2008—present), Office of Textiles and Apparel (OTEXA) monitoring program on U.S. T&A imports from Vietnam (2007-2008) and U.S. textile safeguard measures against China (2003-2005), it seems “import sensitive” T&A in the United States mostly refer to cotton and man-made fiber apparel and fabrics. OTEXA product Code 338, 339, 340, 345, 347, 348, 352, 447, 638, 639, 640, 645, 646, 647, 648 and 652 are most likely to be included in the TPP X-basket.
Because Vietnam’s T&A exports to the United States heavily concentrate on these “import sensitive” T&A categories, the X-basket has the potential to substantially affect the actual trade liberalization that can be enjoyed by the T&A sector under TPP:
- By the most conservative estimation, i.e. the X-basket only covers Category A “import sensitive” apparel products, it will affect about 41.6 percent of U.S. apparel imports from Vietnam (or 38.7 percent of total U.S. T&A imports from Vietnam) if trade pattern remains the same as in 2014.
- In the worst case, i.e. the X-basket covers all “import sensitive” T&A products identified by this study, it will affect about 70.0 percent of total U.S. T&A imports from Vietnam, if trade patterns remains the same as in 2014.
2015 US Fashion Industry Benchmarking Study

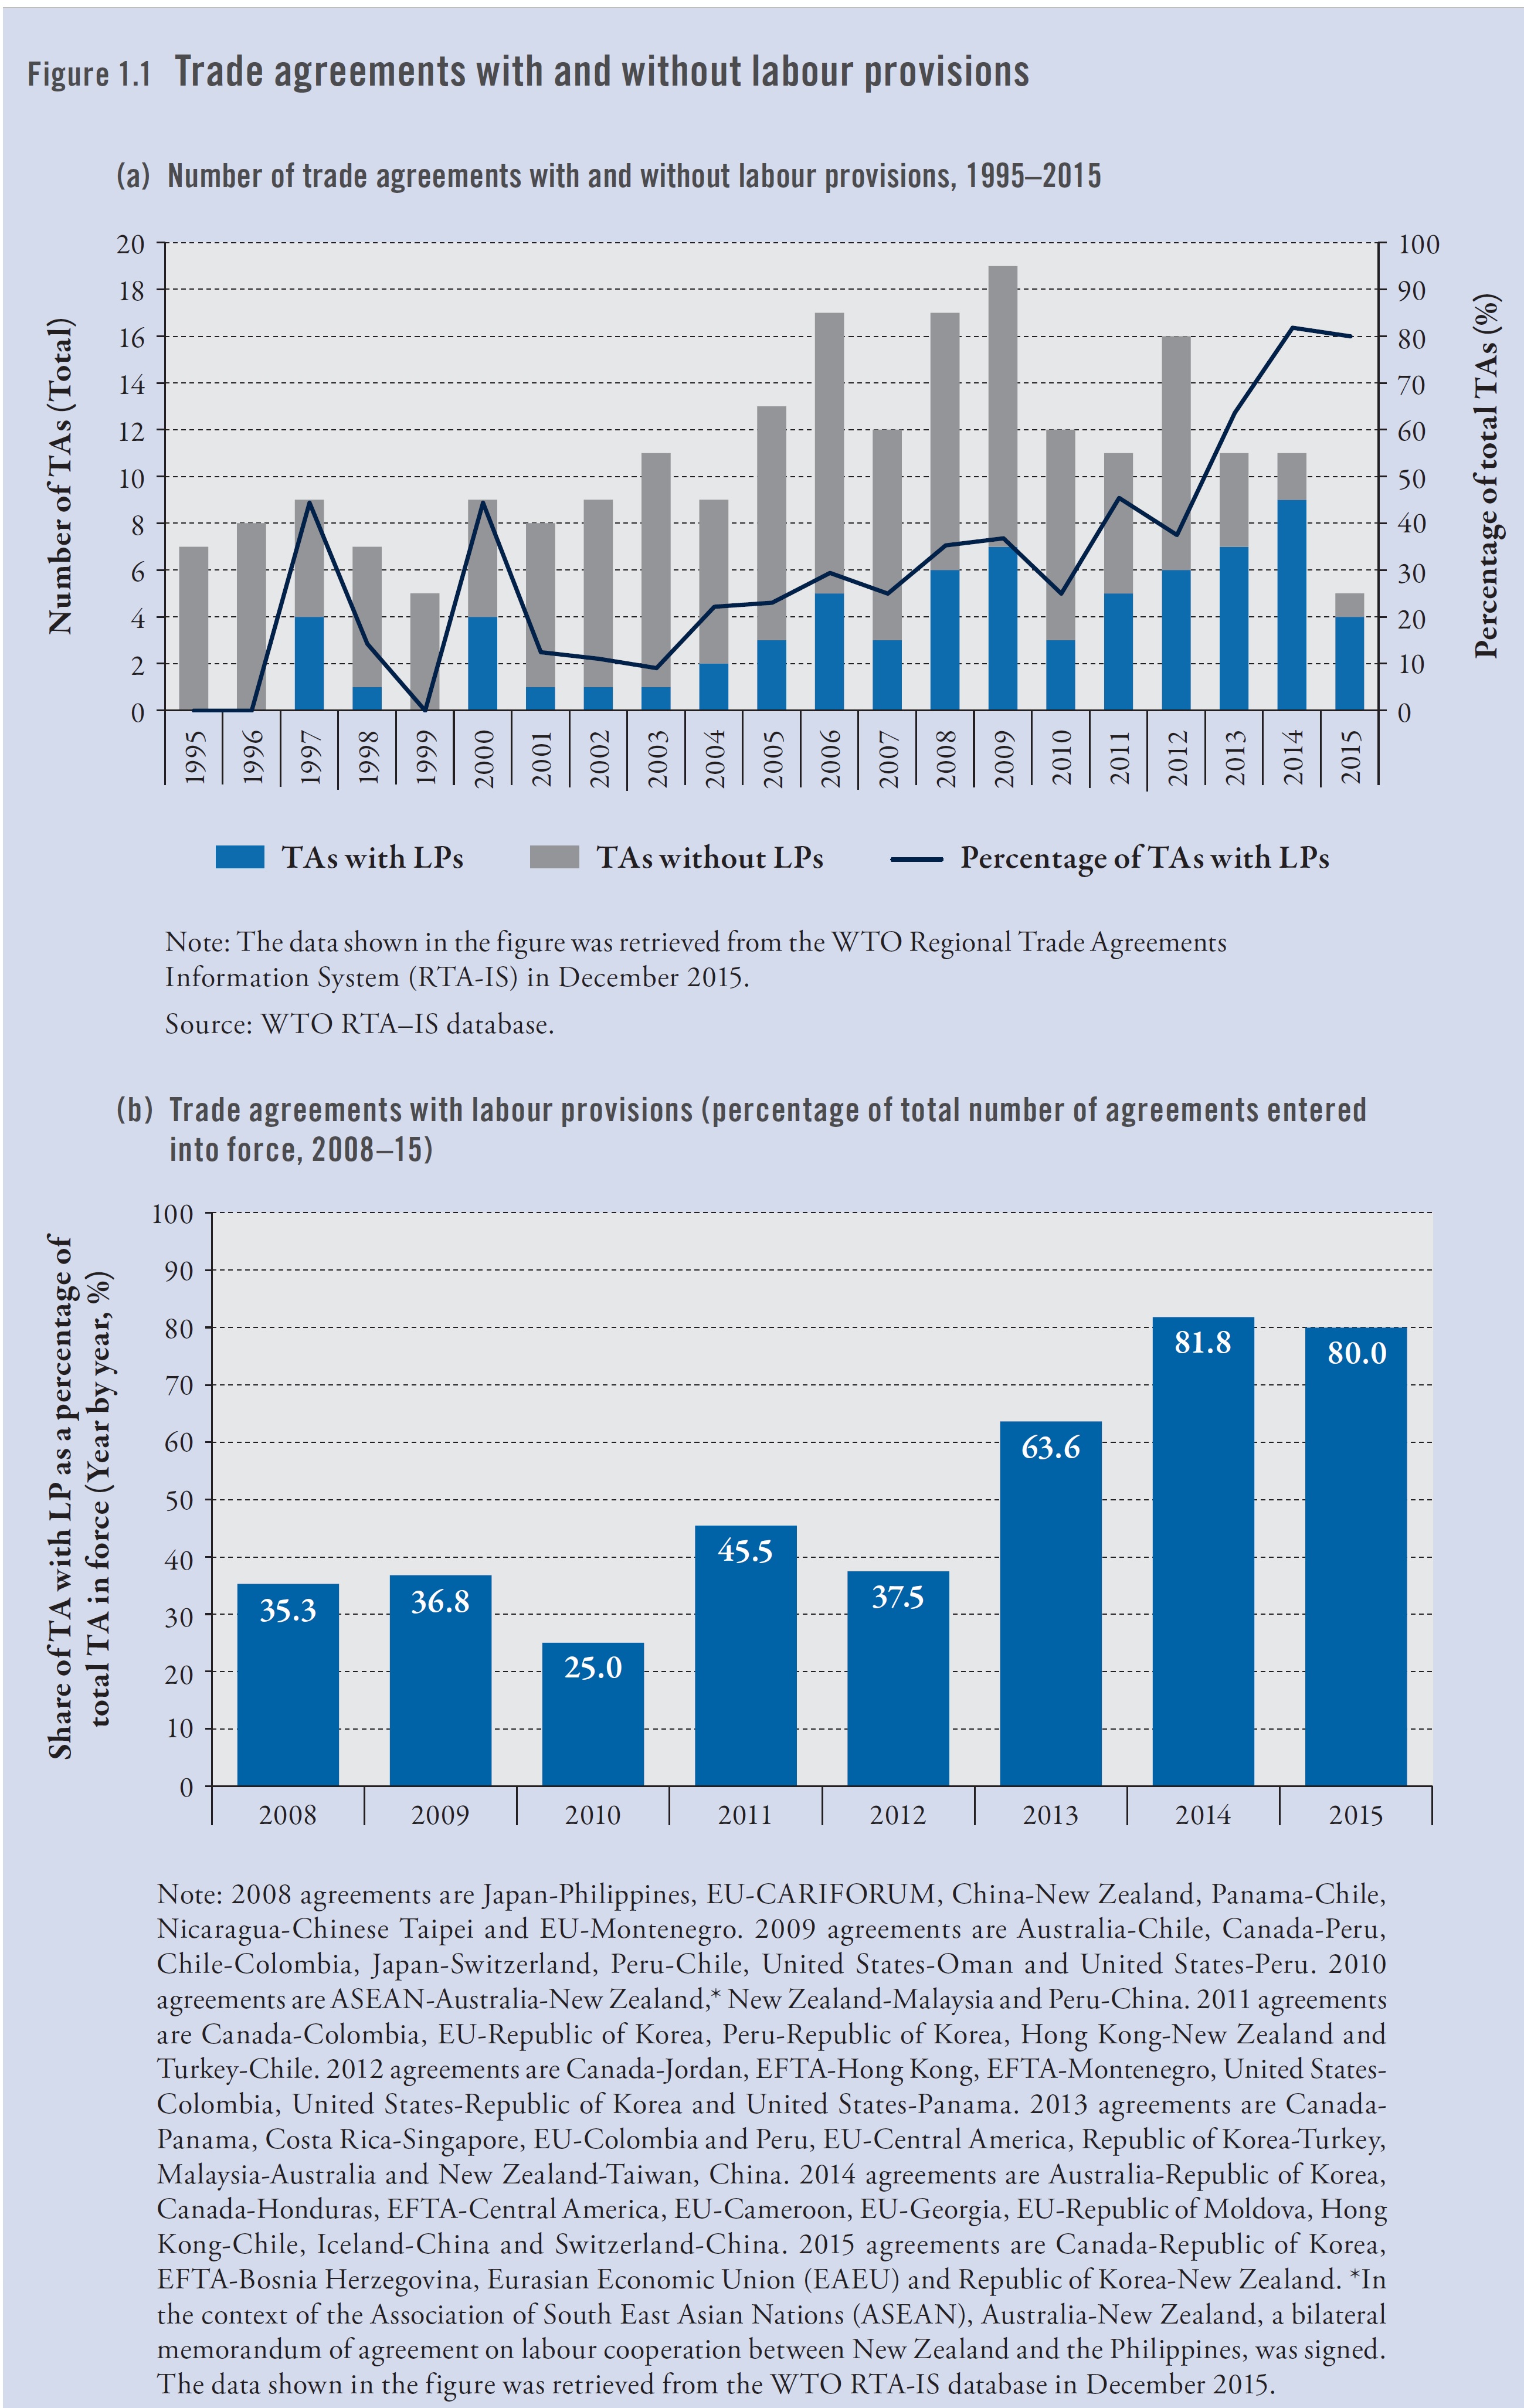
The survey results show that TPP matters for the U.S. fashion industry, with as many as 79 percent of respondents saying implementation of the agreement will impact their business practices. Specifically:
- 72 percent expect to source more textiles and apparel from TPP partners, suggesting the imminent impact of TPP for the U.S. fashion industry could be trade creation.
- Fewer than 10 percent expect to source less from non-TPP members after the implementation of the agreement, suggesting the trade diversion effect of TPP could be limited.
- 48 percent expect to strategically adjust or redesign their supply chain based on TPP, implying TPP could be a game changer and has the potential to shape new patterns of textile and apparel trade in the Asia-Pacific region in the long term.
- However, as few as 7 percent expect to export more products to TPP partners, while only 10 percent expect to invest more in TPP partners (building factories, operating retail stores and e-commerce operations) after implementation of the agreement. It seems the U.S. fashion industry hasn’t focused much on TPP’s potential to promote exports and achieve greater market access.
- Additionally, 45 percent say the TPP Short-Supply List should be expanded, and comments indicate the proposed “yarn-forward” Rule of Origin is a major hurdle to the industry realizing real benefits from the agreement. In fact, as many as 83 percent support or strongly support abandoning the strict “yarn-forward” Rule of Origin and adopting a more flexible one in future FTAs (Figure 21). This suggests that the benefit of TPP for the U.S. fashion industry and the utilization of the agreement will largely depend on the Rule of Origin. In particular, there is a strong call among U.S. fashion companies to make the textile and apparel Rule of Origin less restrictive and more flexible in TPP.
Why does the US Textile Industry Want Yan-forward Rule of Origin (RoO) in TPP?
The US textile industry insists yarn-forward RoO in TPP is not because they expect a substantial increase of textile exports to Vietnam as the case of NAFTA and CAFTA which help capture the export markets in Mexico and Central America. But rather it is because:
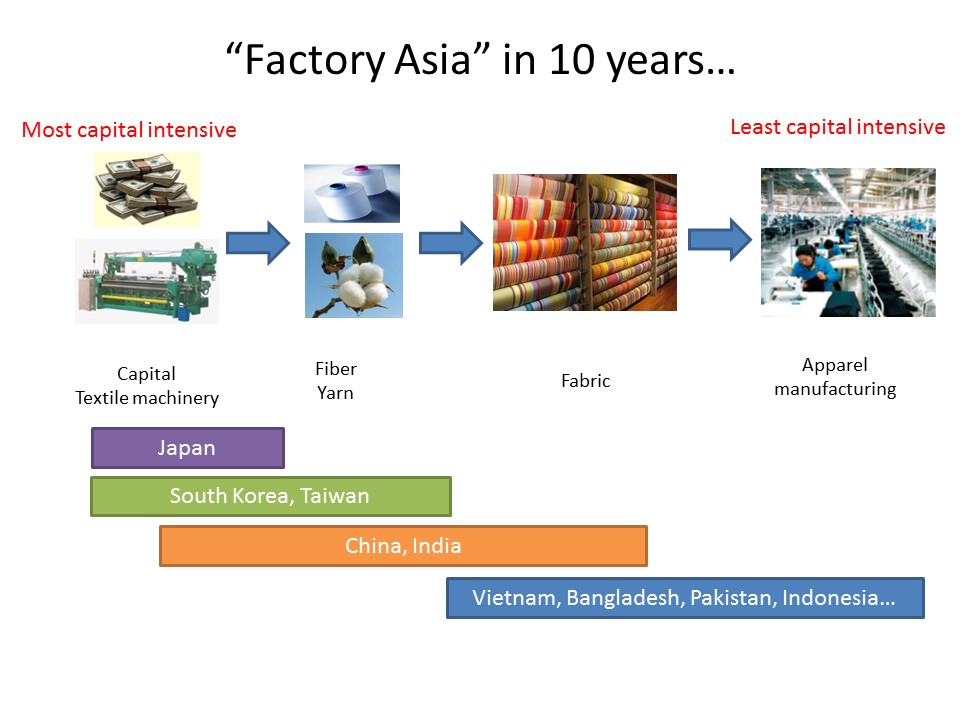
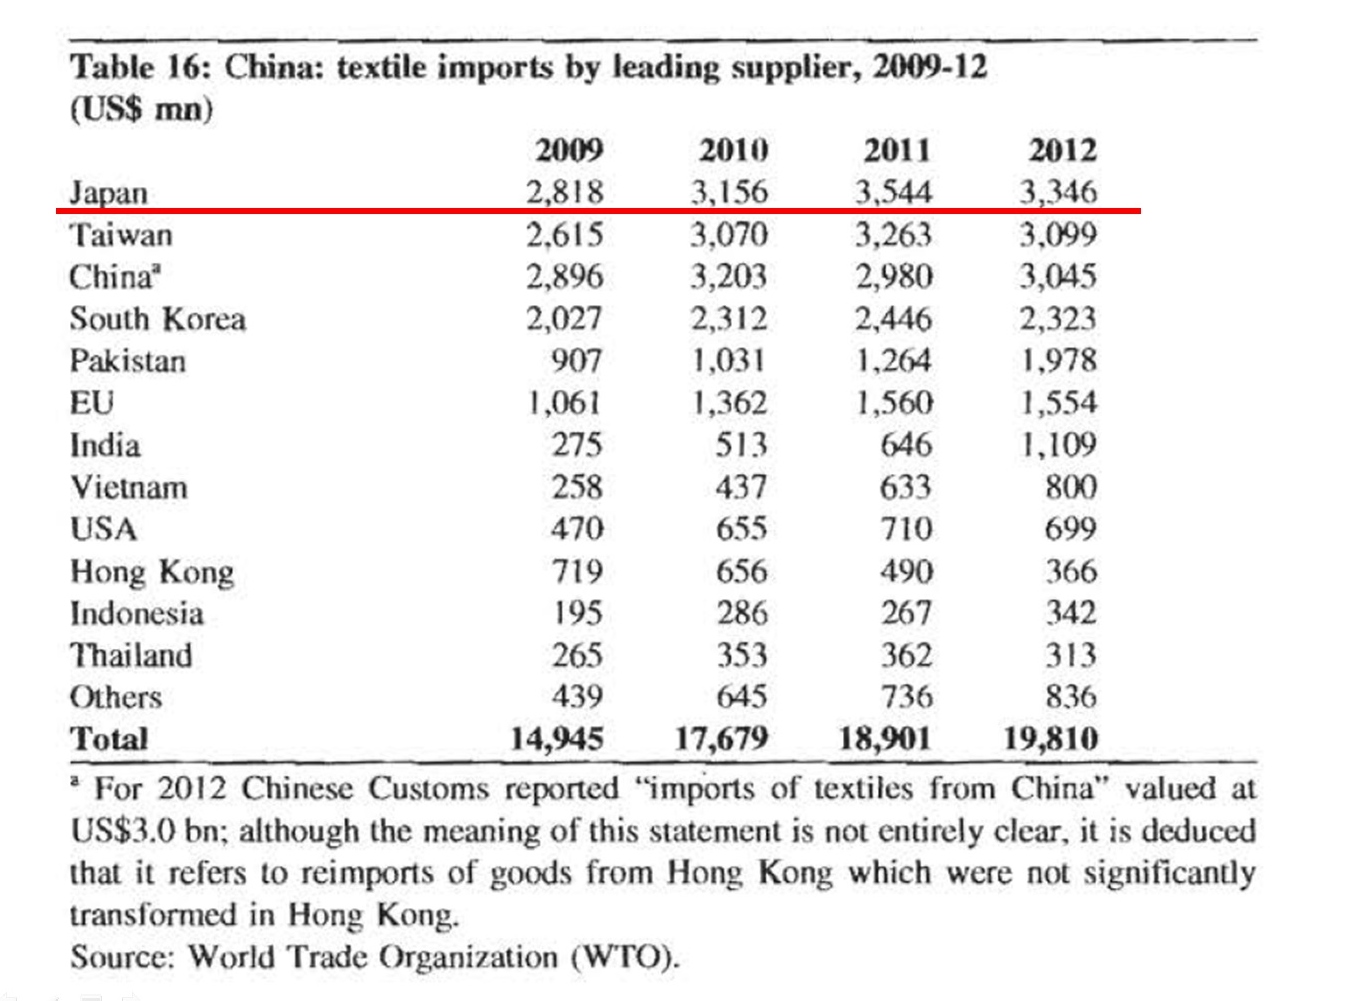
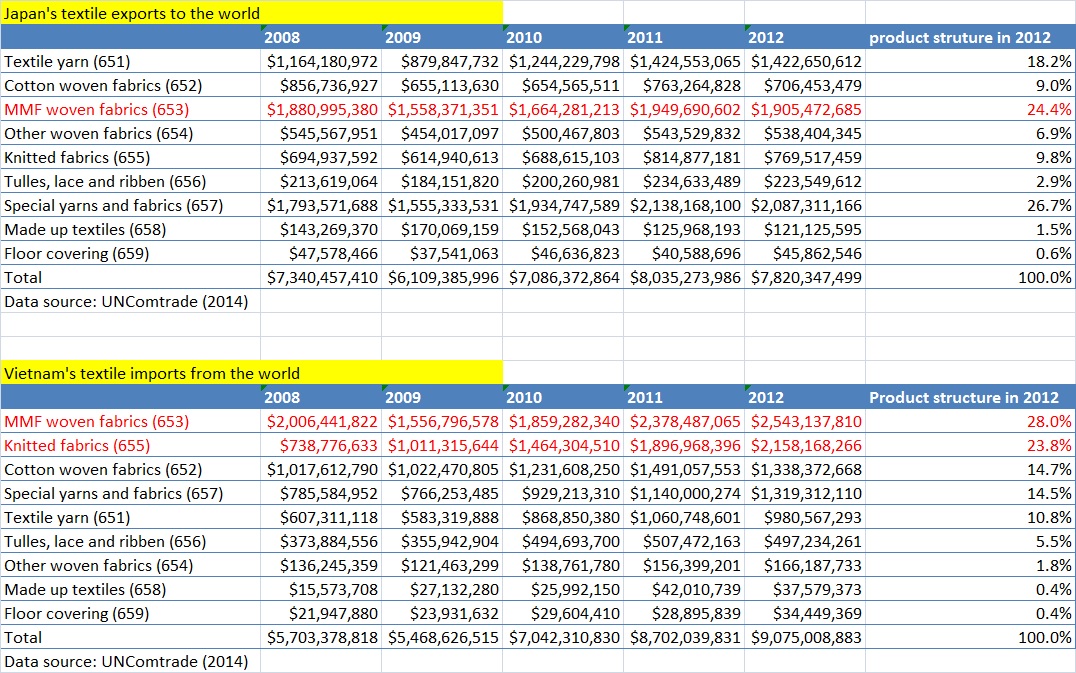
1) Without yarn-forward, situation will get even worse. Particularly, a less restrictive RoO will make Vietnam’s apparel exports which contain textiles made in China, Taiwan or South Korea qualified for duty free access to the US market. Definitely this will be a more imminent and bigger threat to the US textile industry than simply facing competition from Vietnam’s apparel which contains Japanese made textiles. And still many US textile companies don’t treat the Japanese textile industry very seriously, although I think they should. Remember, Japan currently is the fourth largest textile supplier to Vietnam and the NO.1 textile supplier to China.
2) With yarn-forward RoO in place, at least US textile companies can invest in Vietnam (remember, globalization is about movement of capital as well. Many apparel companies in Mexico and Central America actually are invested by US companies). Without yarn-forward RoO however, Vietnam can simply rely on imported textiles as the case mentioned in (1) and there will be no incentive for US textile companies to move factories to Vietnam (meaning, capital holders will lose).
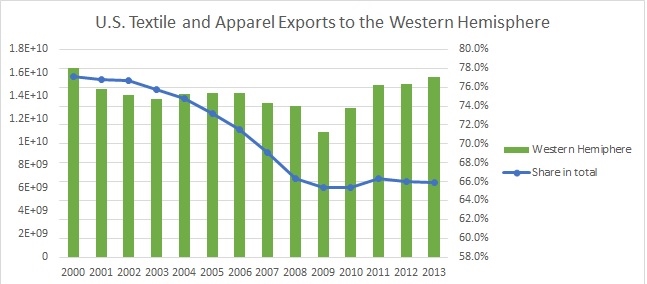
So overall yarn-forward RoO may win a few more years for the US textile industry. But in the long run, it is my view that the US textile production and its exports to the Western Hemisphere countries may still inevitably decline (especially those output to be used for apparel assembly purposes) after the implementation of TPP. In the 21st century, the nature of competition is supply chain v.s. supply chain.