Patterns of U.S. Apparel Imports (updated September 2025)

First, as a result of the IEEPA reciprocal tariff, the average tariff rate for U.S. apparel imports (HS Chapters 61 and 62) reached 26.4% in July 2025, marking a new high in decades (note: was 25.4% in June, 23.8% in May and 20.2% in April 2025), and a substantial increase from 14.7% in January 2025, prior to Trump’s second term. Even apparel imports from traditional U.S. free trade agreement partners, such as CAFTA-DR members, now have to be subject to about 10% applied tariffs. And apparel imports from Mexico still enjoyed a relatively low 1.6% tariff rate in July 2025. [Check the applied US apparel import tariff rate here]

Second, U.S. apparel imports fell in July 2025, negatively impacted by the hiking of tariffs and consumers’ growing hesitancy in clothing spending amid uncertainty about their household financial outlook. Specifically, U.S. apparel imports in July 2025 decreased by 3.0% in value and 5.2% in quantity from a year ago, indicating both an overall shrinking import demand and a more notable import price increase. [Check U.S. apparel import index here]

Statistics also show that after removing the seasonal factor, the average U.S. apparel import price went up by nearly 3% from April to July. This trend could become even worse in the coming months as more countries face even higher “reciprocal tariffs” starting from August 2025. However, the average U.S. apparel retail price has not significantly increased, likely because fashion companies fear losing sales at a time when consumers’ clothing spending is already weak. [Check the U.S. clothing retail price index here]

Third, continuing the trends from previous months, U.S. apparel imports from China again fell sharply in July 2025. Facing nearly 50% tariff rates—much higher than those applied to other sourcing countries—U.S. apparel imports from China decreased by 38.4% in value and 27.3% in quantity in July 2025 from a year ago. As a result, in value, China’s market share fell to just 15.6% in July 2025 (was 24.6% in July 2024), significantly lower than Vietnam’s 22.1% (was 19.1% in June 2024). In other words, it may signal a new era where China is no longer the top source of U.S. apparel imports. [Check market shares in U.S. apparel imports here]

Fourth, while Asia as a whole still dominates, trade data suggests more notable trends of sourcing diversification. In July 2025, about 72.9% of U.S. apparel imports came from China, far exceeding the Western Hemisphere (14.8%) and the rest of the world (12.4%). However, Asia’s market share in July 2025 was slightly lower than 74.7% a year ago, suggesting that more imports came from other regions. For example, at the country level, US apparel imports from several emerging Asian suppliers and those in the Middle East and Africa enjoyed fast growth, including Vietnam (up 12.5%), Cambodia (up 25.2%), Pakistan (up 14.7%), Jordan (up 21.6%), and Egypt (up 30.3%).

Meanwhile, U.S. apparel imports from India in July 2025 also increased by over 15%, although the newly imposed higher tariffs on India could alter the trend in the next few months.

Additionally, there is still no evidence that Trump’s tariff policy has meaningfully boosted nearshoring from the Western Hemisphere. On the contrary, in July 2025, U.S. apparel imports from Mexico grew by just 0.5%, despite the significant tariff advantage offered to USMCA-qualifying products. Similarly, imports from CAFTA-DR members decreased by 2.7%. The results revealed the adverse effects of uncertainty in the Trump administration’s tariff policy on encouraging long-term sourcing and investment commitment to the region.

(note: this post is not open for discussion)

By Sheng Lu

FASH455 Exclusive Interview with Karin De León, Investment and Promotion Director, Apparel and Textiles Association of Guatemala (VESTEX)

About Karin De León

Karin De León has been working in the textile and apparel sector in Guatemala for more than 25 years, promoting the development of the industrial cluster, participating in the creation of strategies, supporting the strengthening of the supply chain, and attracting investment.

As part of her role at the Apparel and Textile Association of Guatemala (VESTEX), for 10 years she held the position of Executive Director of CECATEC-RD (Central American and Dominican Council of Clothing and Textiles), the entity that integrates textile & apparel industry associations of Central America and the Dominican Republic and which is responsible for coordinating the inter-institutional relationship with public and private entities of the United States of America, Mexico and Colombia mainly.

From 2020 to the beginning of 2022, she served as Chief of Staff of the Ministry of Economy of Guatemala and later became General Coordinator of the National Competitiveness Program (PRONACOM), a government entity responsible for promoting the country and attracting investment.

Karin is currently VESTEX’s investment and promotion director, and representative of Guatemala in CECATEC-RD. She coordinates the inter-institutional relationship with government entities of the United States (such as the United States Trade Representative and the Department of Commerce) as well as private institutions mainly related to the United States, Mexico, and Colombia.

Sheng: Can you provide a brief introduction to VESTEX and a general overview of your member companies?

Karin: VESTEX is the Apparel and Textile Association of Guatemala, a private association representing the Guatemalan textile and apparel export sector. It focuses on promoting the industry’s exports through strategic alliances with public and private institutions at the national and international levels.  Its strategic axes are Sectoral Resilience, which seeks to position the industry as a generator of investment and formal employment in the country; Sectoral Sustainability, through the promotion of sustainability as a long-term strategy for industry continuity and compliance, providing companies in the sector with tools that facilitate compliance with the obligations established in the laws and regulations.

VESTEX partners comprise companies that integrate the entire supply chain of the apparel and textile sector, encompassing yarn and fabric manufacturers, apparel producers, as well as firms providing specialized services and accessories to the industry.

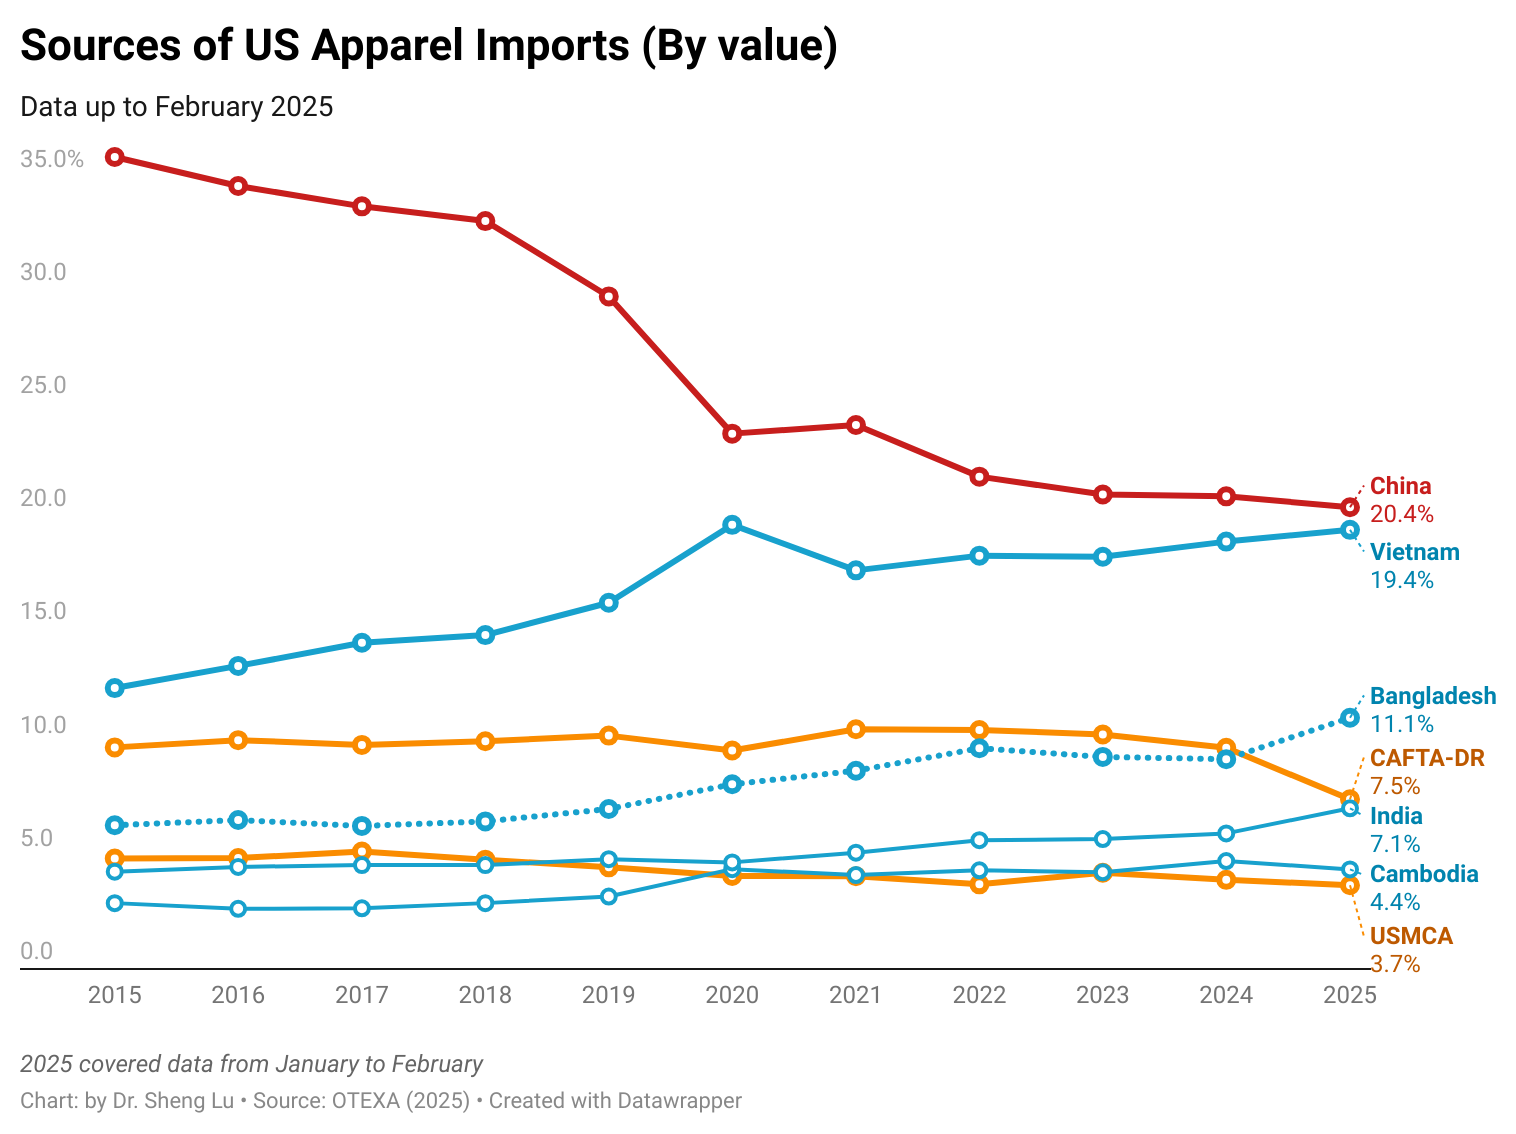
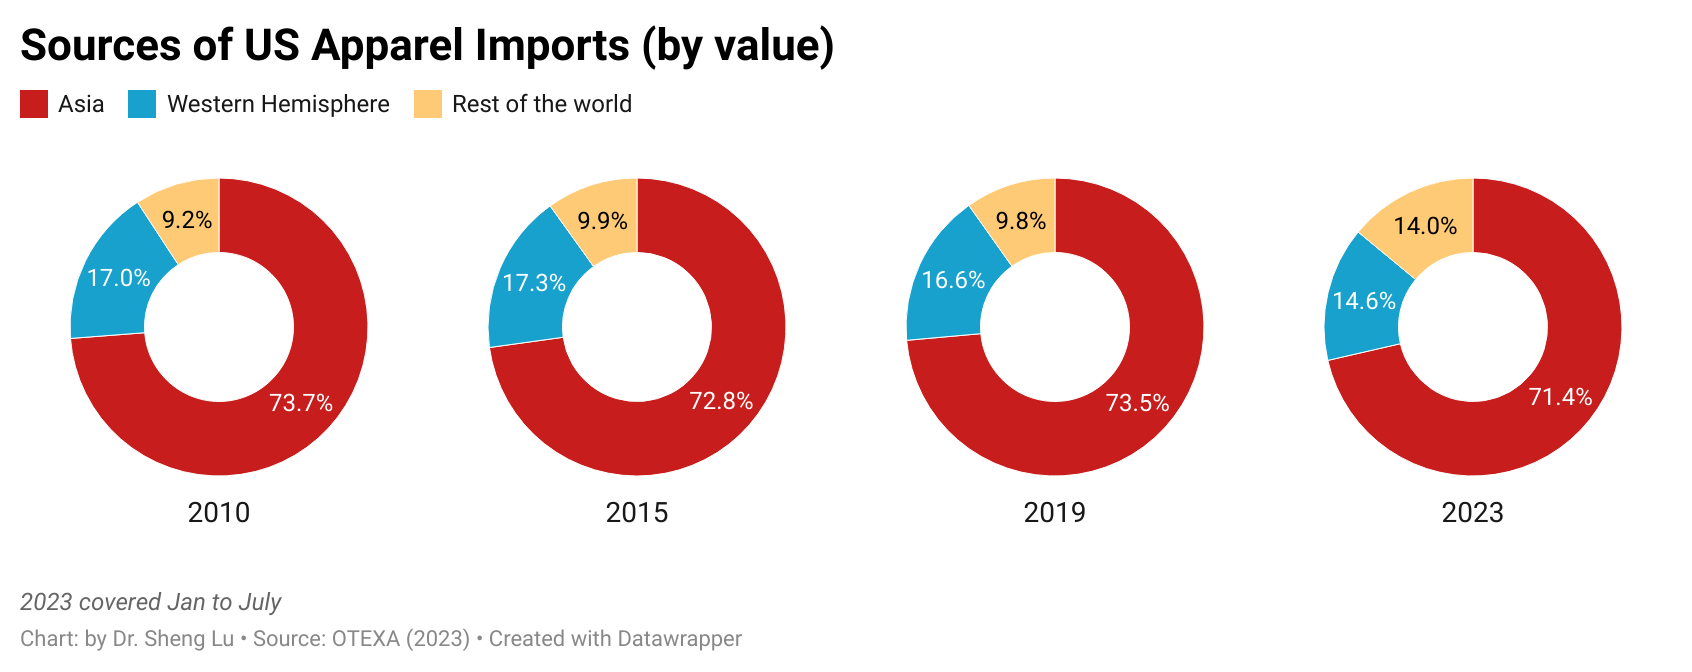
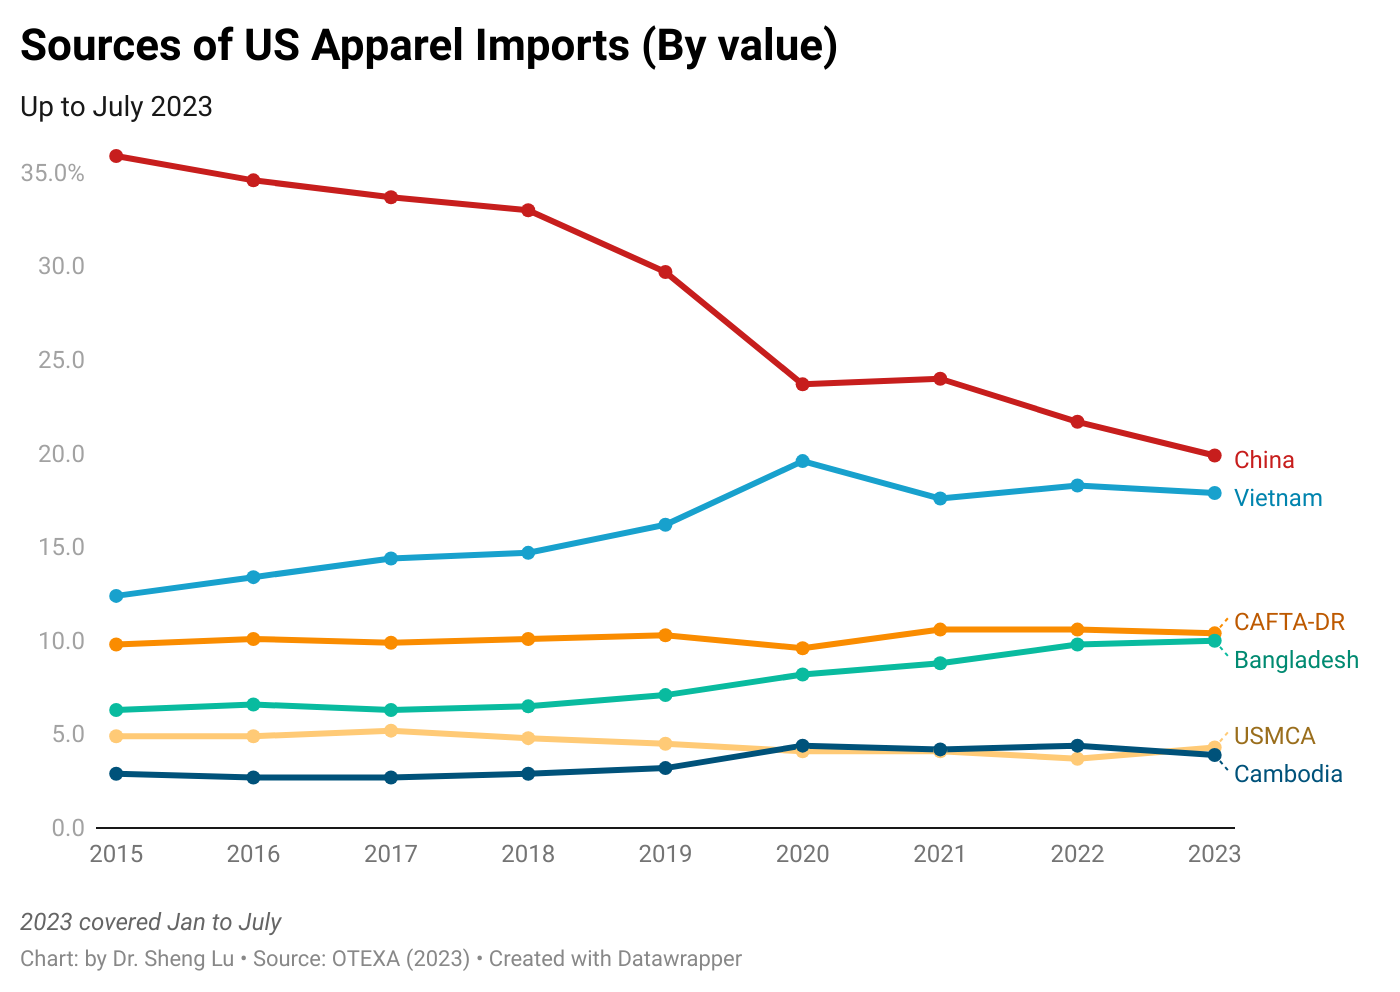
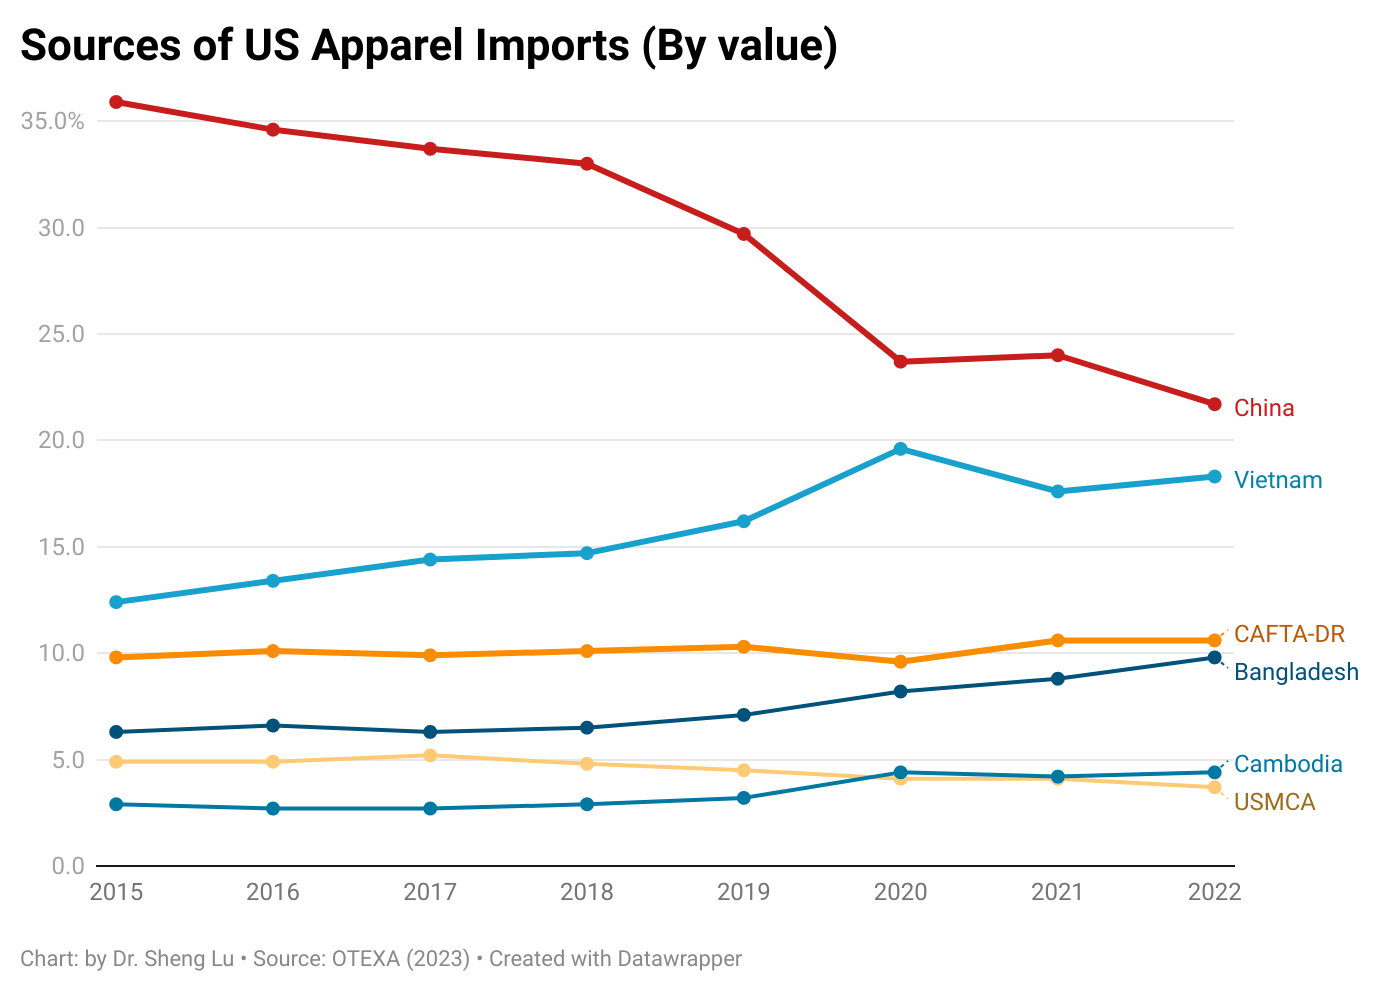
Sheng: Studies show that there is consistent interest among U.S. fashion companies in expanding nearshoring from the Western Hemisphere, including Guatemala. What is your observation? What makes Guatemala an attractive destination for apparel sourcing today? What are the unique advantages of sourcing from the country?

Karin:Guatemala has become an increasingly attractive destination for apparel sourcing due to its unique combination of industrial integration, geographic advantages, and strong compliance standards. The country offers a highly integrated apparel cluster that encompasses every stage of the supply chain—from spinning yarn and weaving fabrics to apparel manufacturing, printing, finishing, and packaging. This full-package model not only streamlines operations and enhances traceability but also allows for greater flexibility and product diversity, raising the added value of garments and positioning Guatemala as a competitive supplier for niche and complex products requiring skilled labor and high-quality materials.

Another key differentiator is Guatemala’s strategic location. With access to ports on both the Atlantic and Pacific coasts—separated by only 249 miles—the country can efficiently serve both the East and West coasts of the United States. Guatemala manages the second-largest maritime cargo operation in Central America (after Panama), which is critical for companies seeking to balance and mitigate geopolitical and logistical risks. In addition, proximity to the U.S. substantially reduces environmental impact: sourcing from Guatemala lowers CO₂ emissions from maritime transport by approximately 84% compared to sourcing from Asia. Transit times are also highly competitive, with shipments reaching Miami in as little as three days, enabling U.S. buyers to manage inventories more effectively and respond to market demands with agility.

Equally important, Guatemalan apparel companies operate under a strong framework of labor and environmental compliance. Companies demonstrate a full-spectrum commitment to input traceability, adherence to strict rules of origin, and continuous process improvement to reduce resource consumption. Investments in monitoring and ESG systems underscore their transparency and alignment with global sustainability standards.

Taken together, this integration of cluster capabilities, geographic proximity, and compliance with international norms positions Guatemala as a reliable, sustainable, and strategically advantageous sourcing partner for U.S. fashion companies.

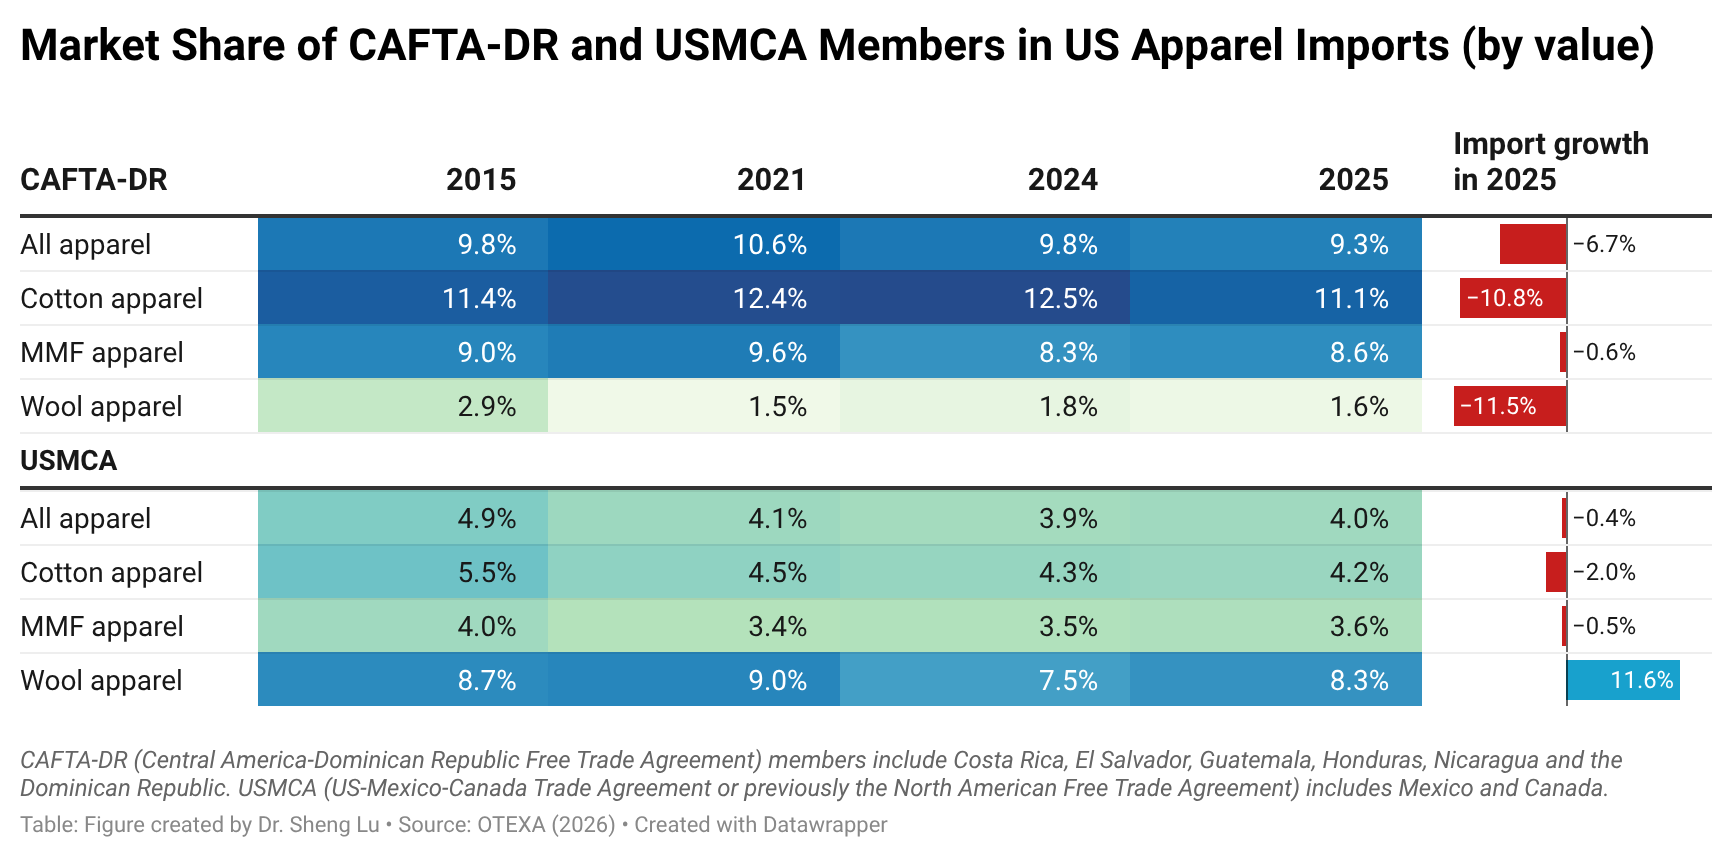
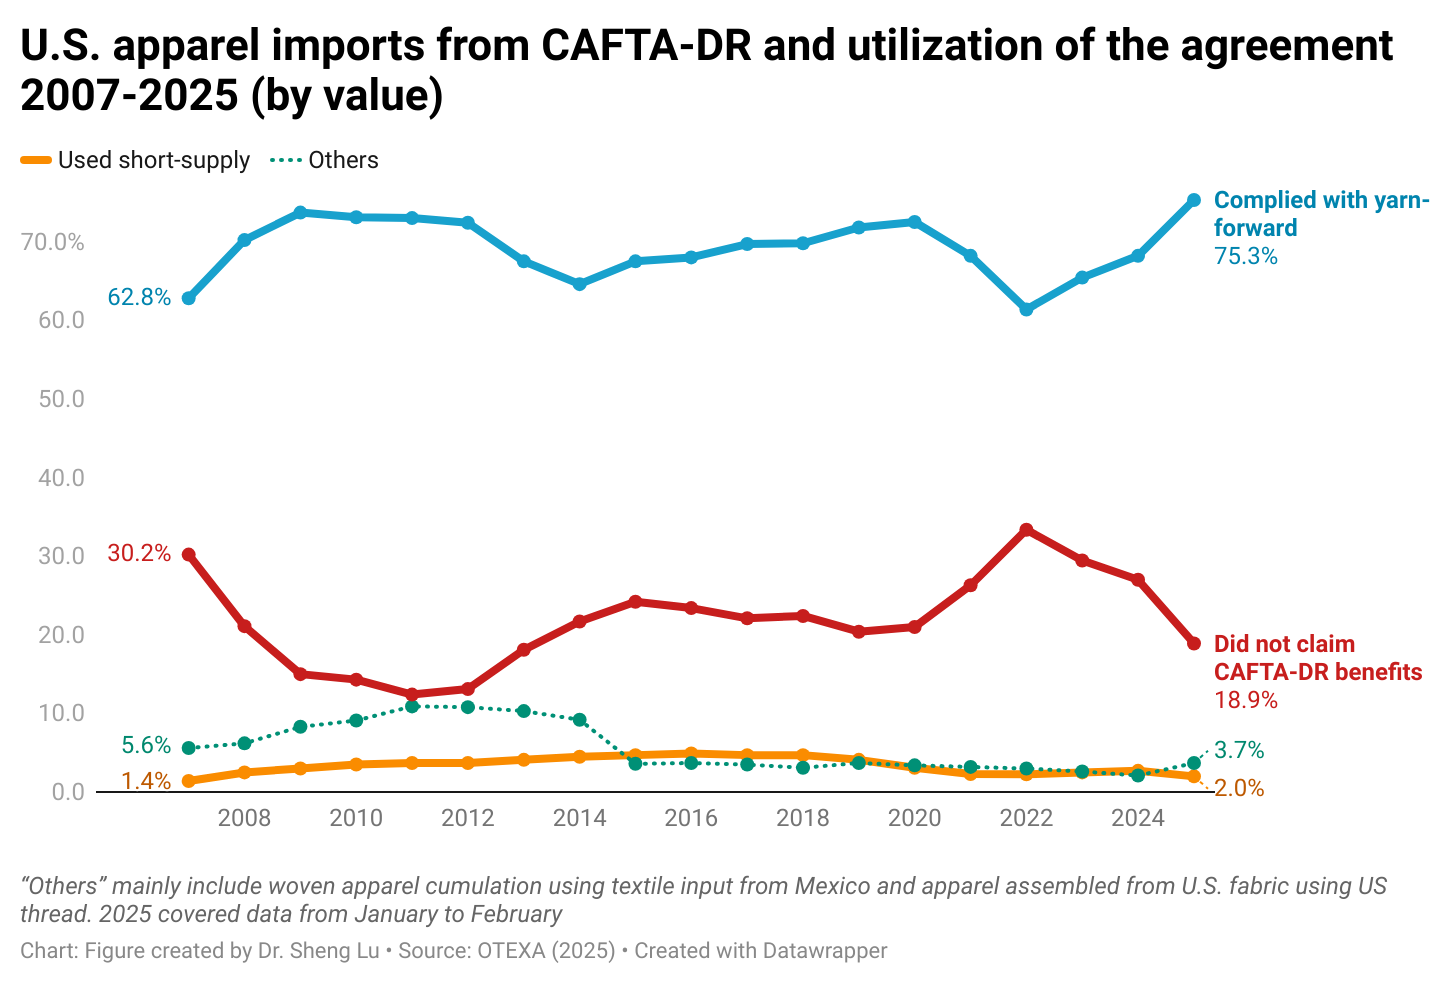
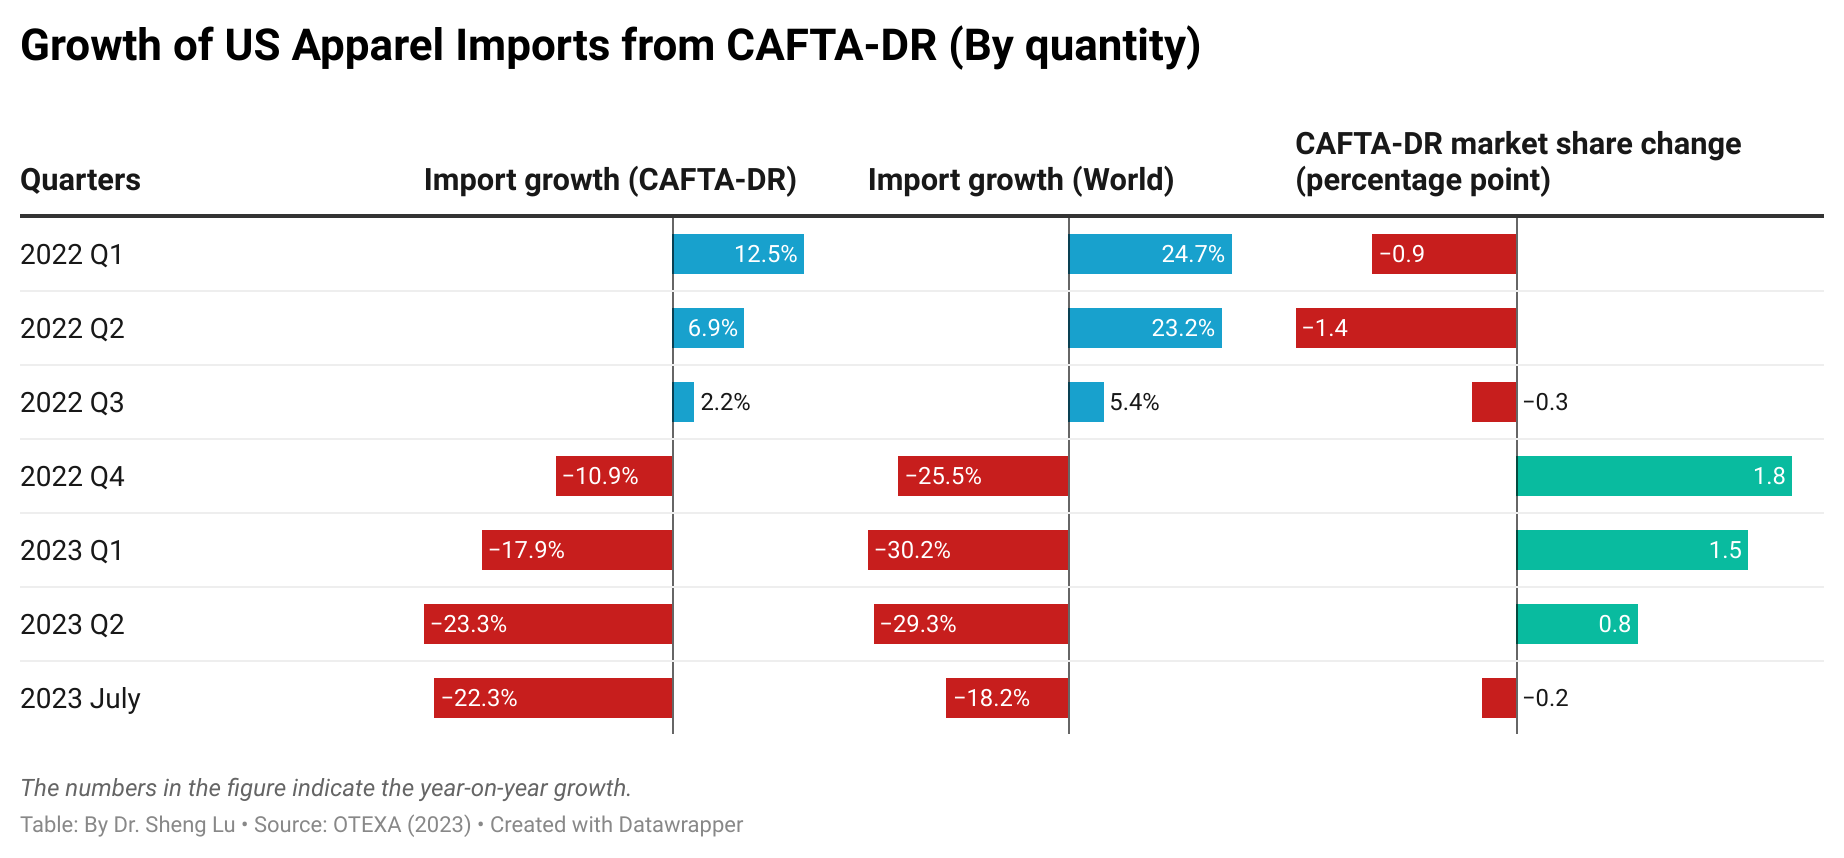
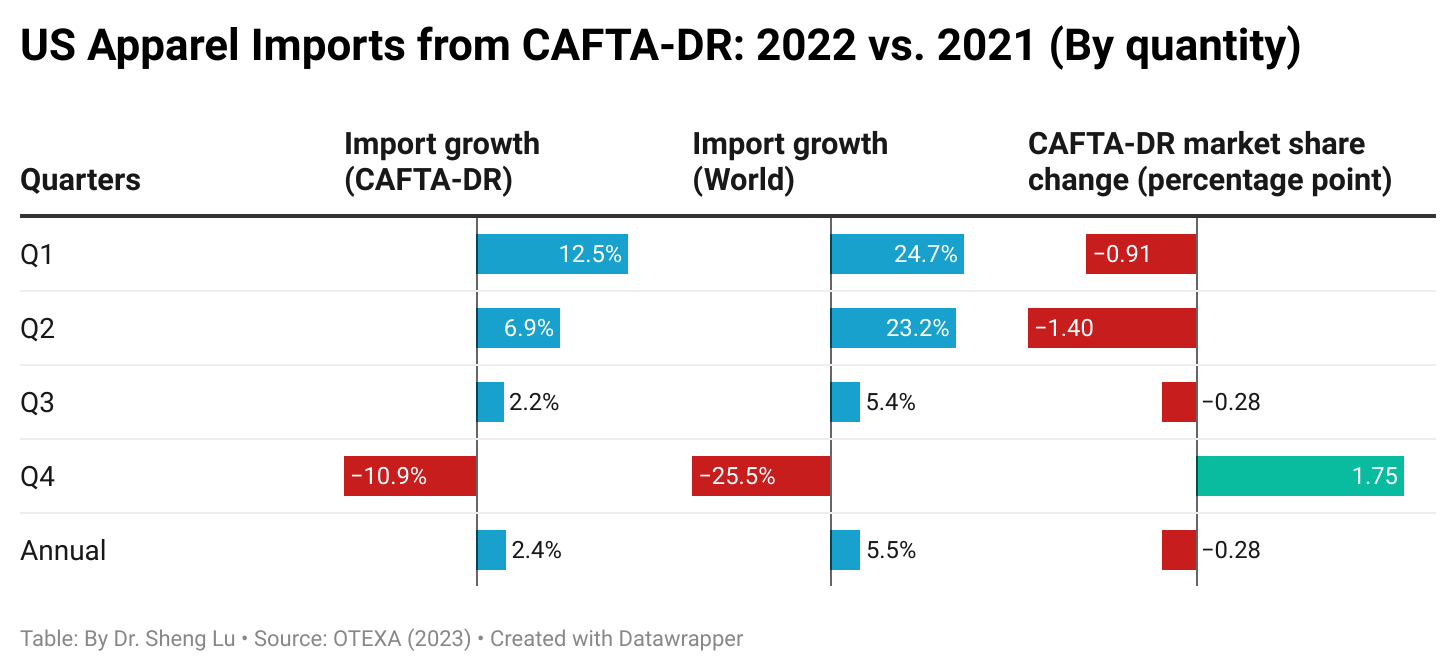
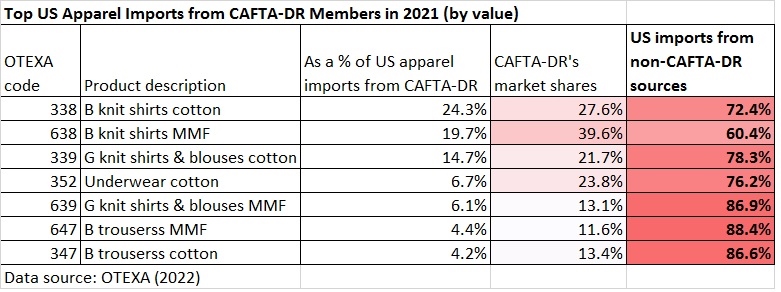
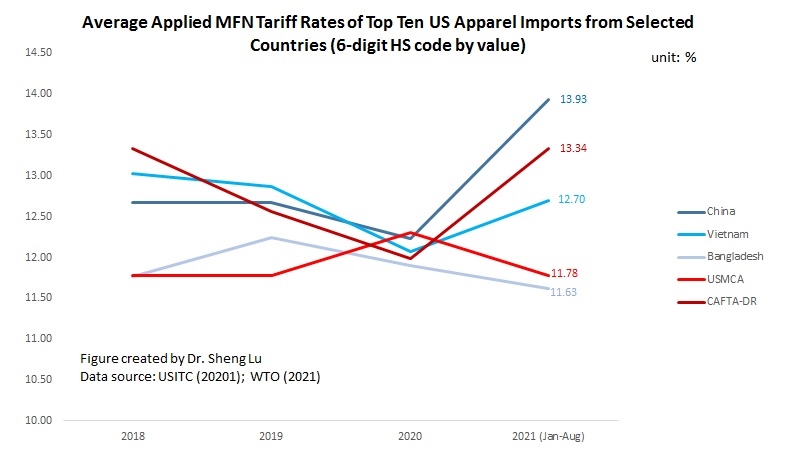
Sheng: How important is the Dominican Republic-Central America Free Trade Agreement (CAFTA-DR) in supporting Guatemala’s apparel exports to the U.S. market? What impact do CAFTA-DR’s apparel-specific rules of origin have on garment exporters’ supply chains and export strategies in Guatemala?

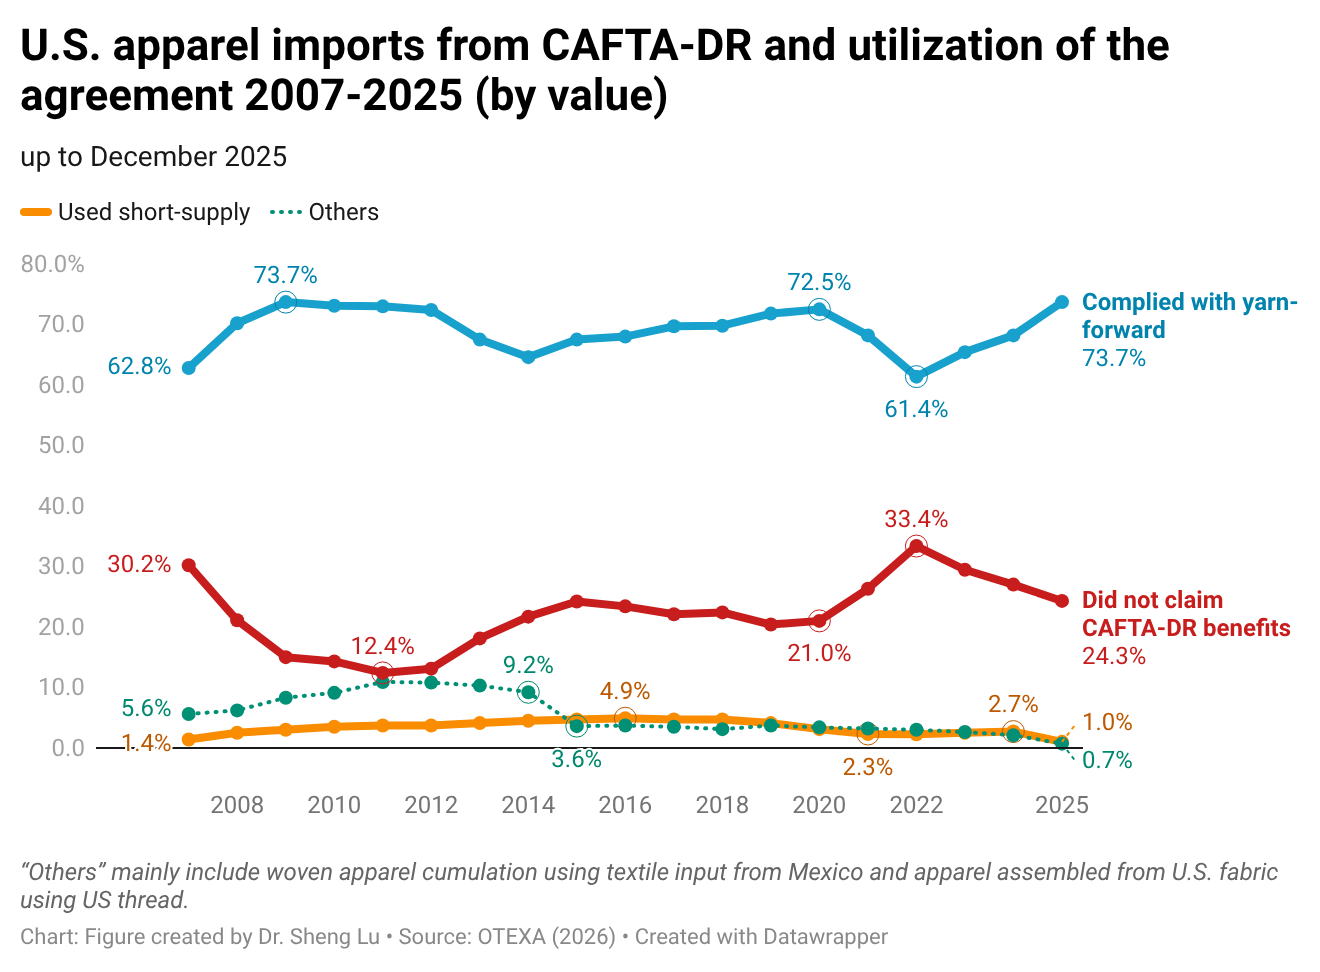
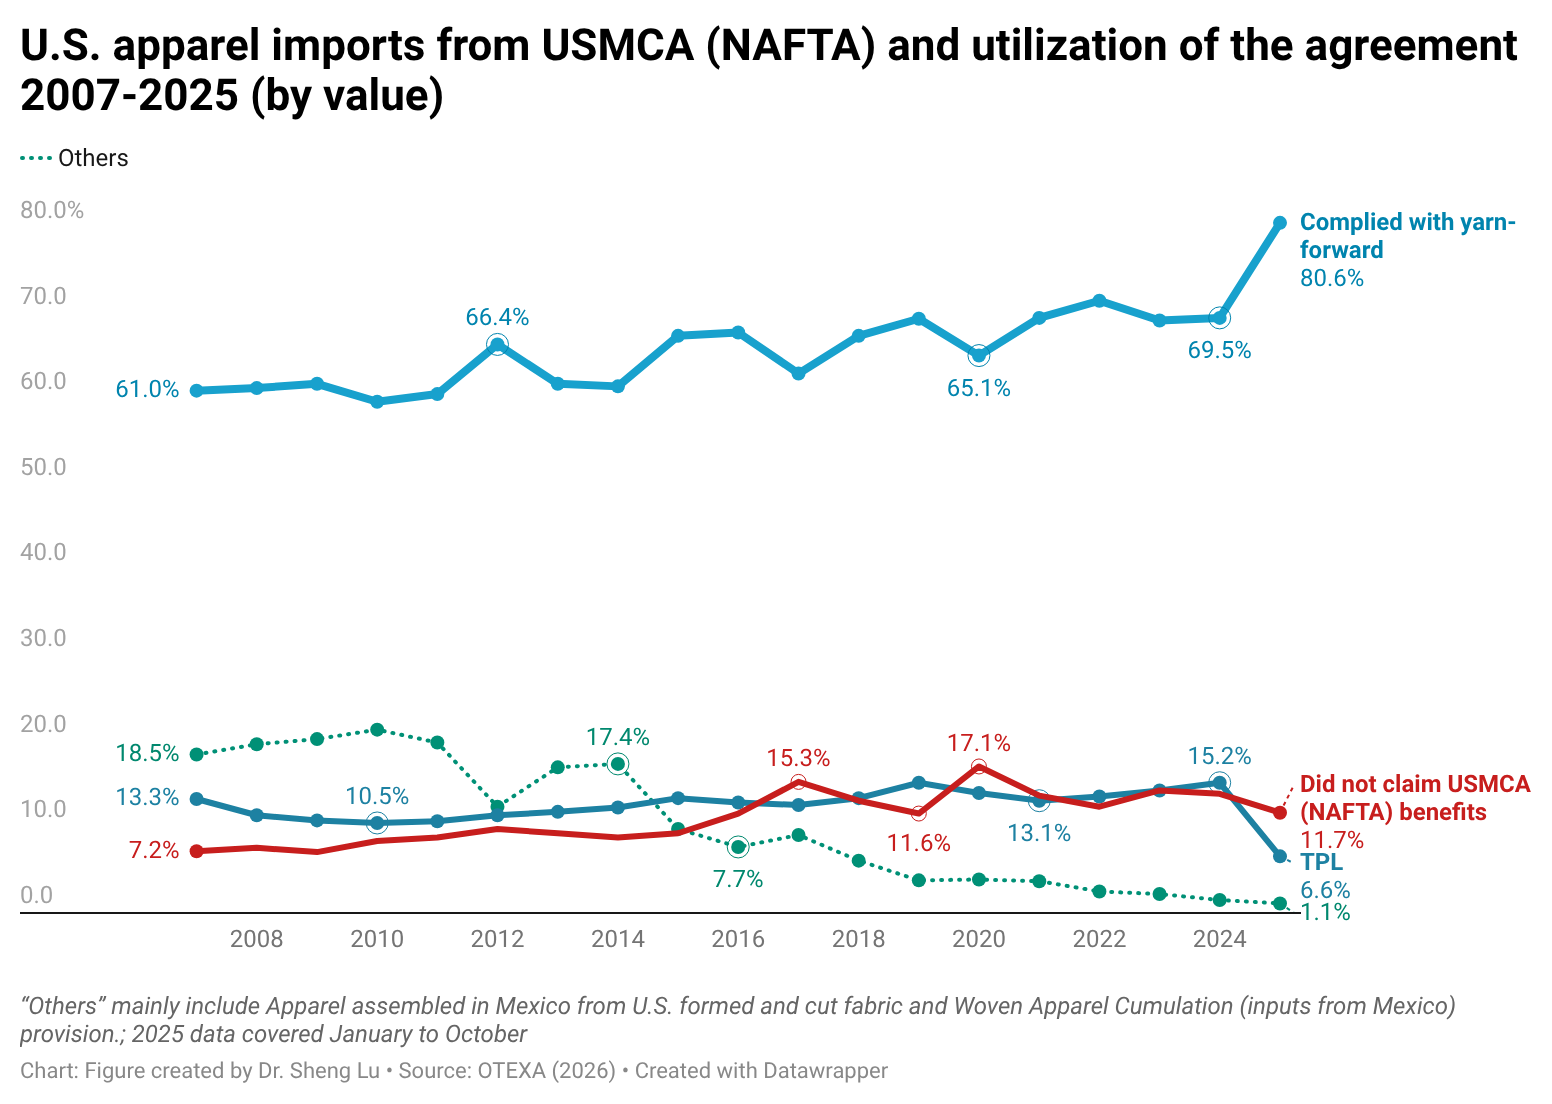
Karin:CAFTA-DR has provided certainty by encouraging long-term investments in textile infrastructure and capabilities. CAFTA-DR has been the basis for the development of Guatemala’s apparel industry.  The yarn-forward rule established under the agreement has not only fostered integration with the U.S. supply chain but also promoted stronger collaboration among Central American countries. By allowing the accumulation of inputs and processes within the region, CAFTA-DR has significantly strengthened intraregional trade.

This integration has facilitated the specialization of each Central American country. In Guatemala’s case, it has enabled the use of specific yarns and fabrics produced in other countries and manufactured locally, fostering a greater diversification of production.

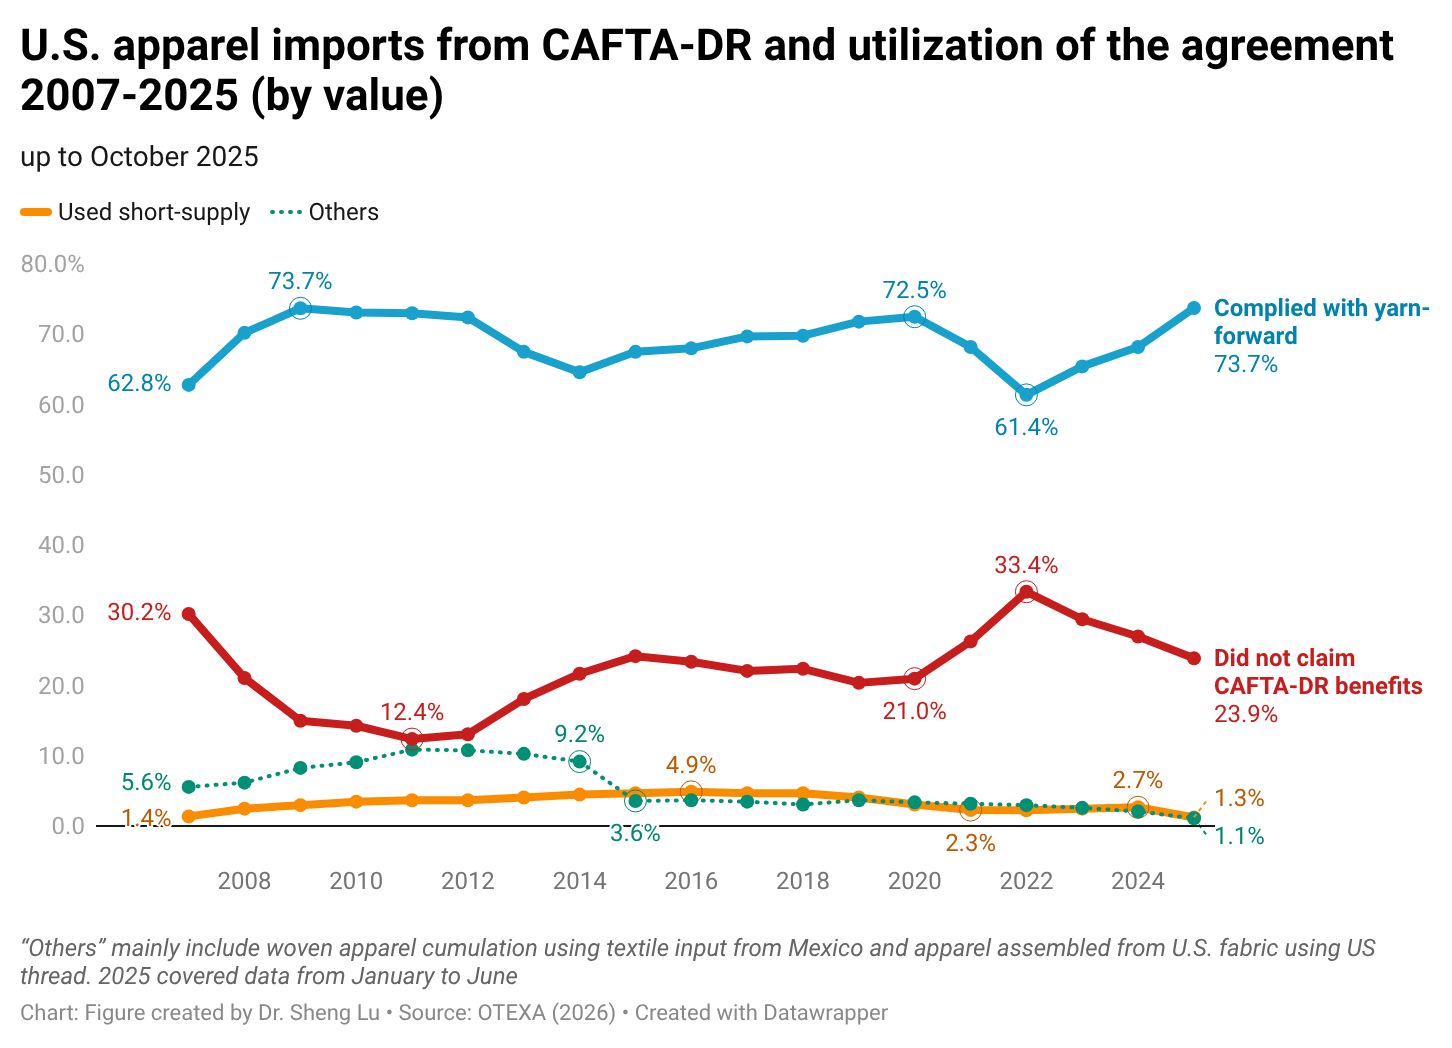
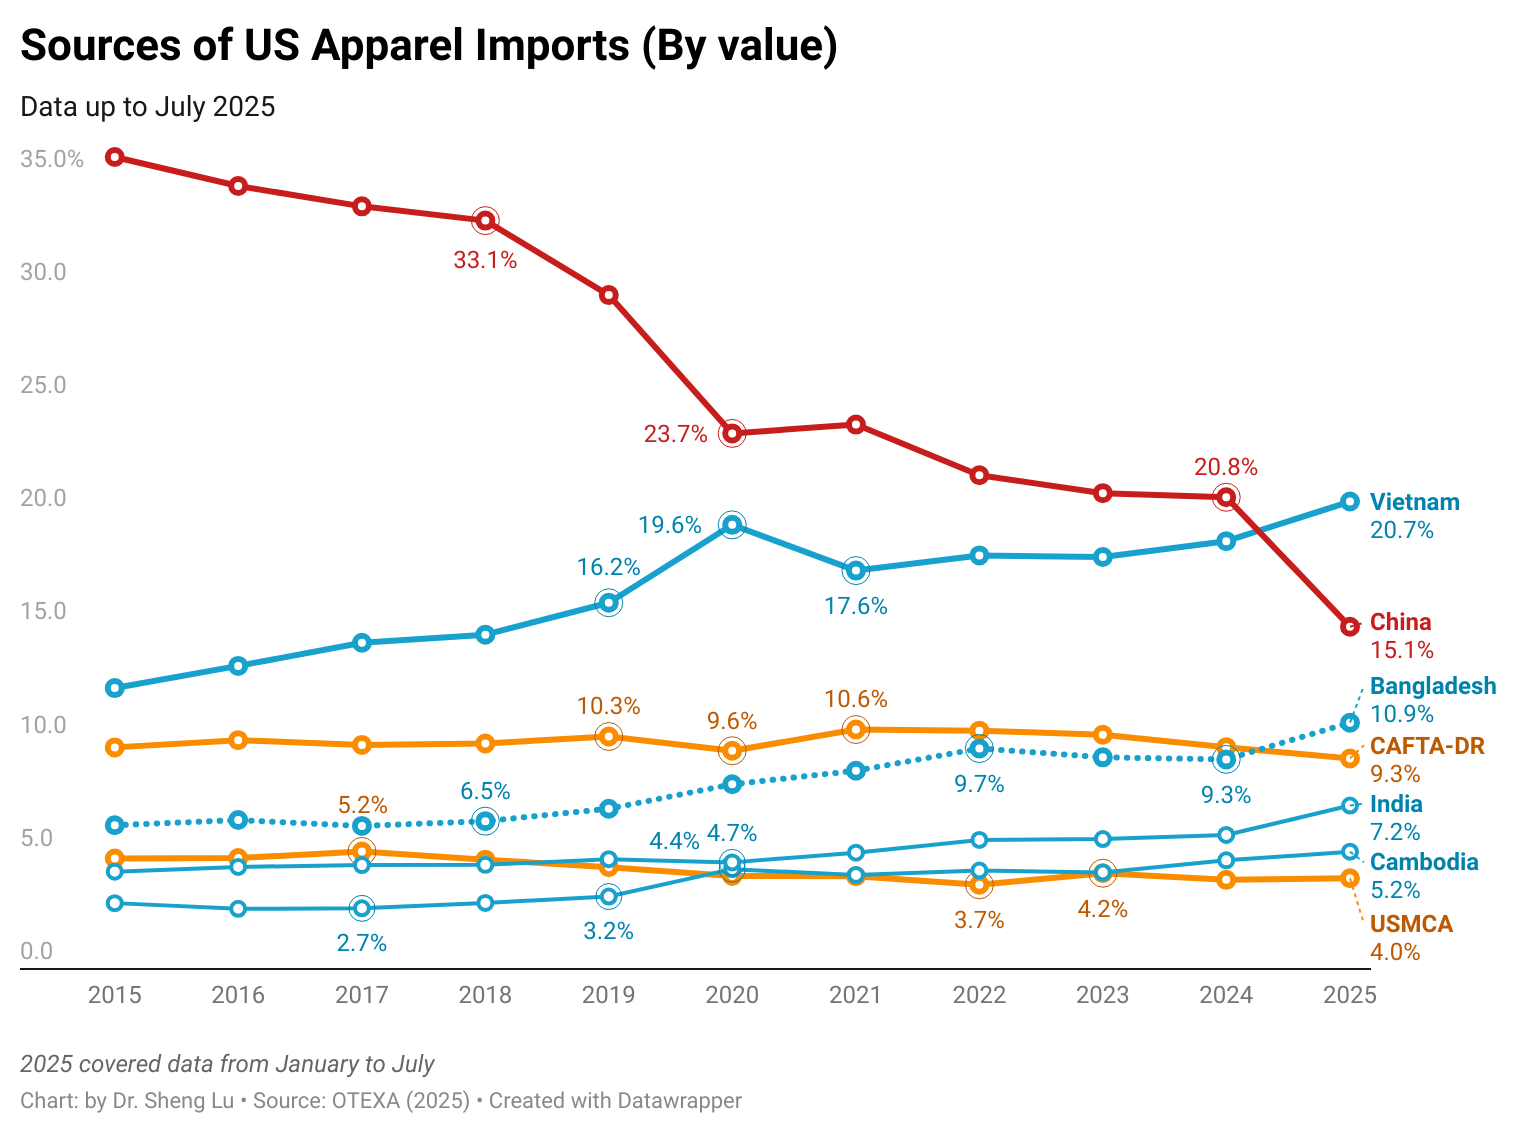
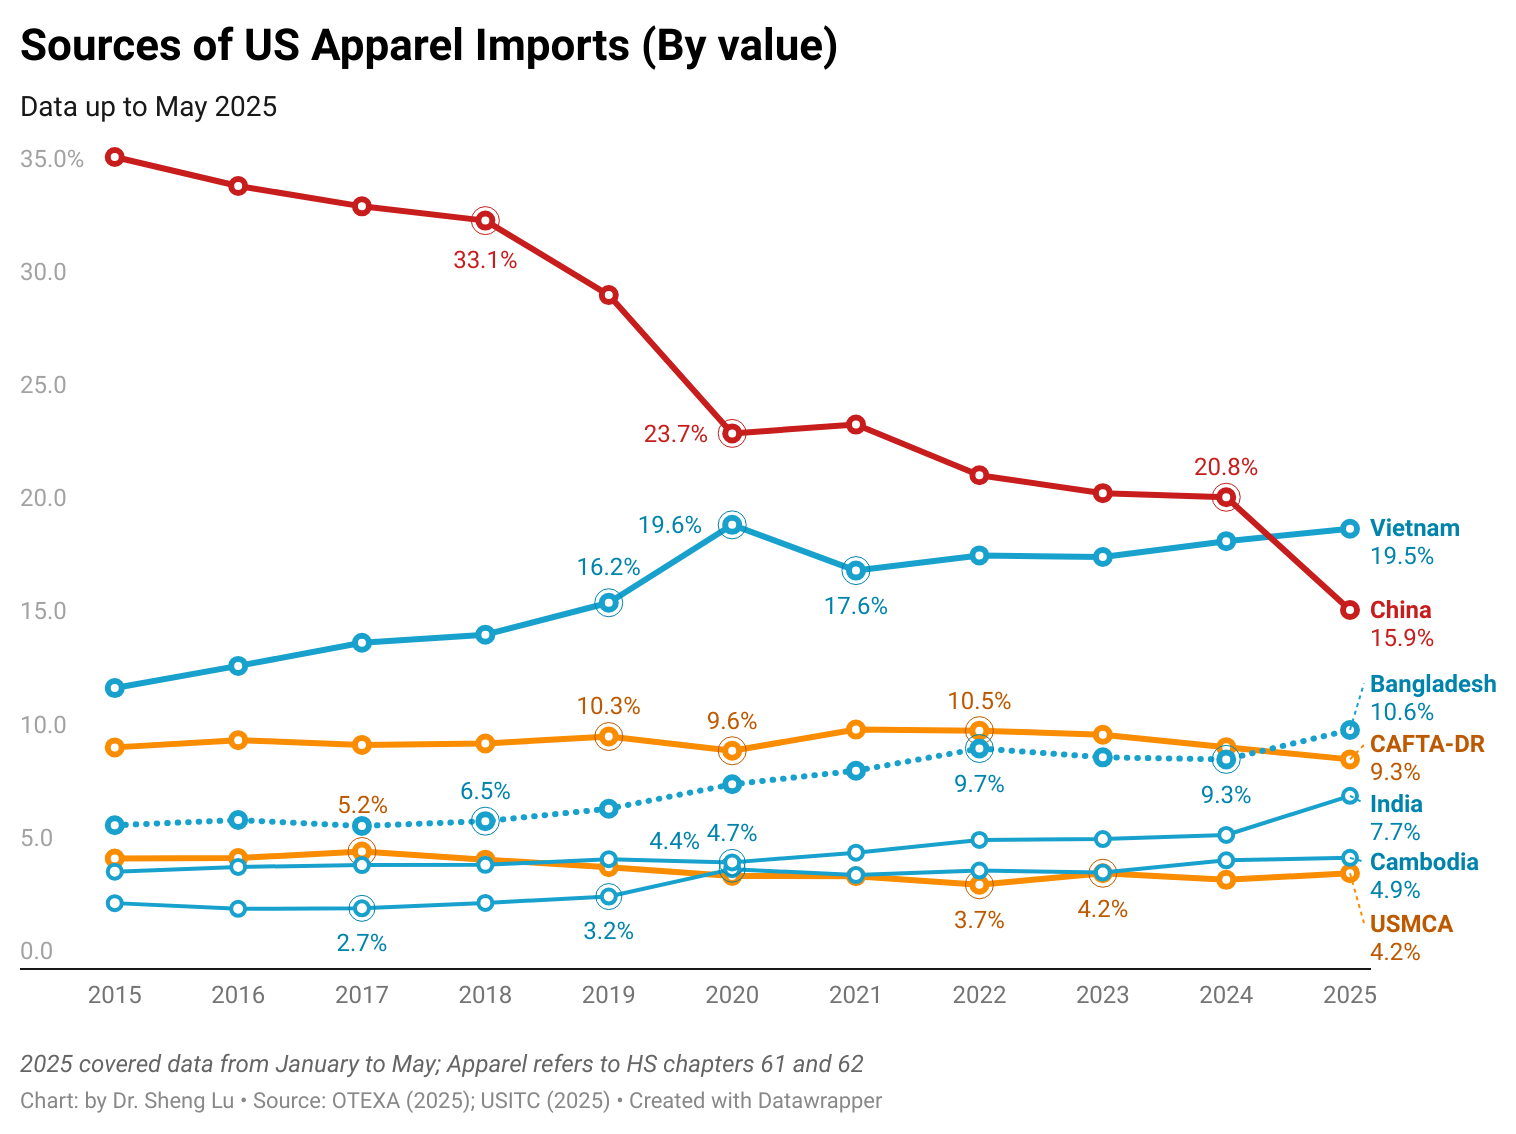
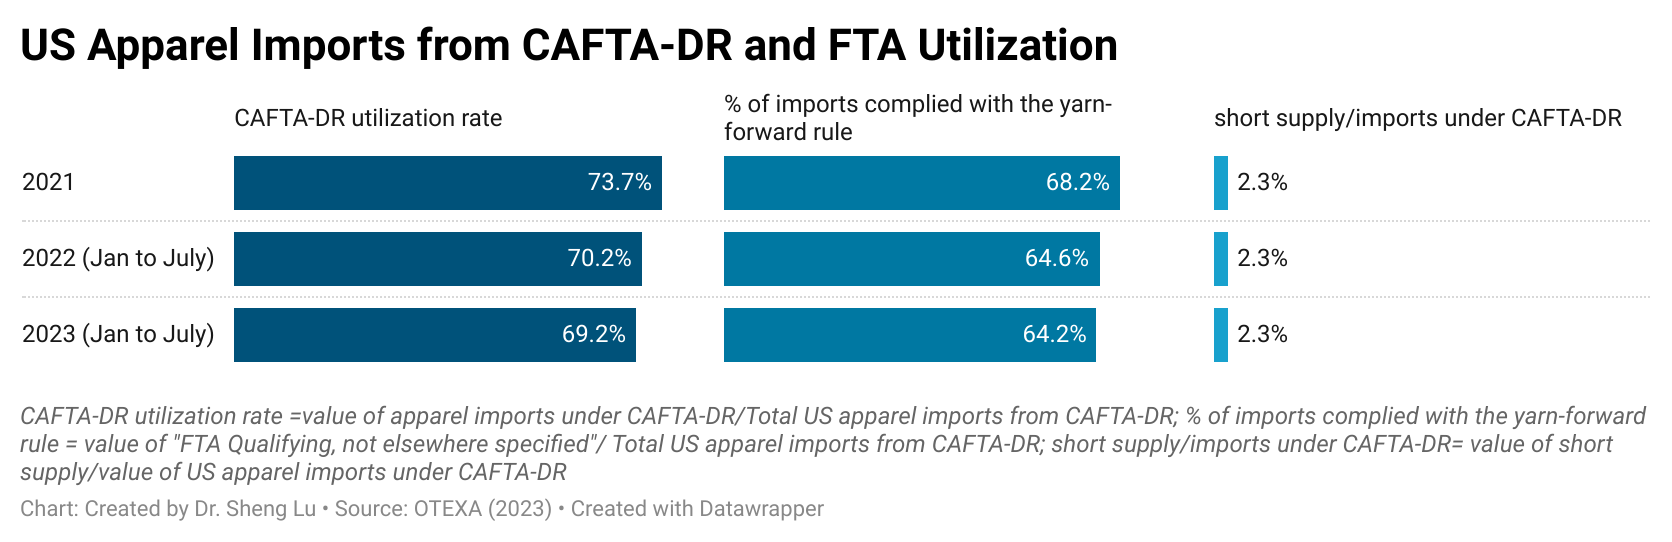
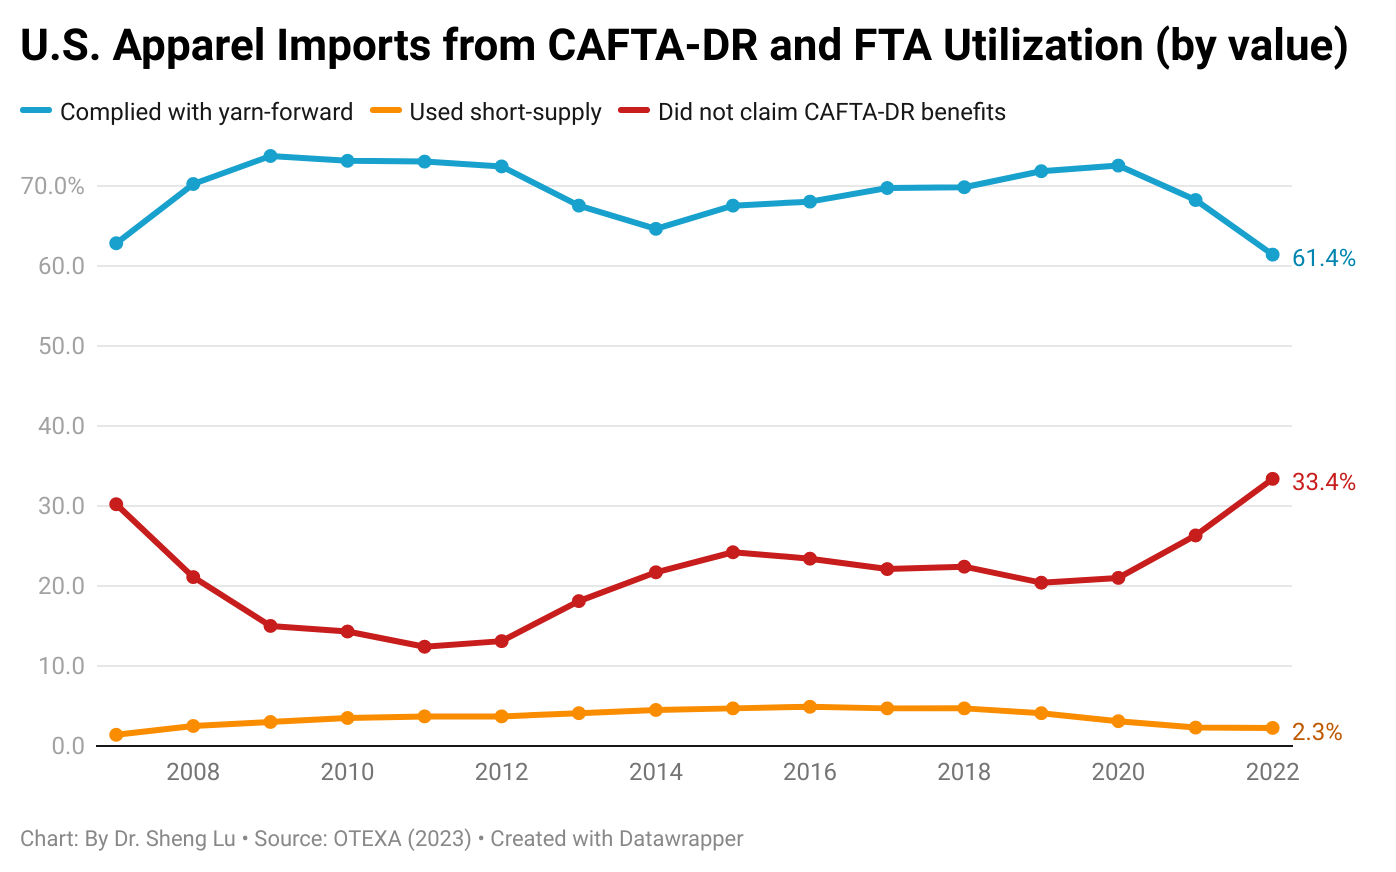
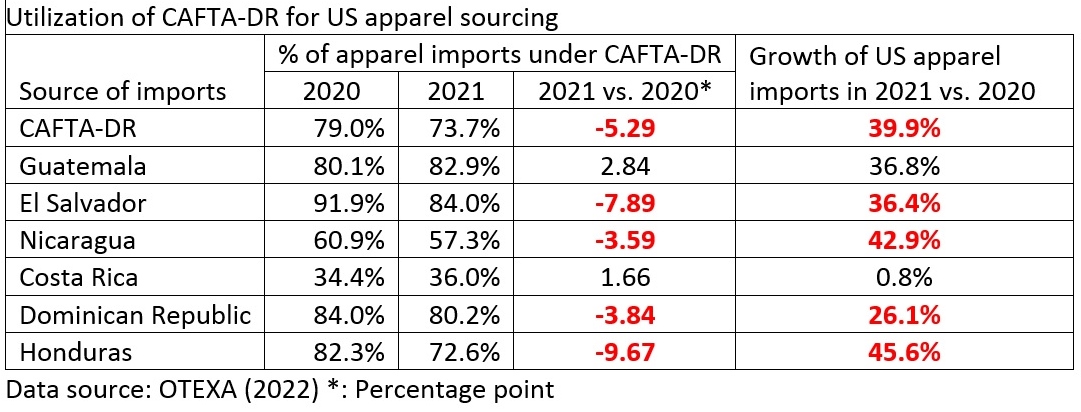
According to OTEXA figures, in the year ending June 2025, 89.17% of Guatemala’s total apparel exports to the U.S. entered under the Free Trade Agreement preferences. Of this total, 79.69% qualified under the yarn-forward rule—that is, garments made with yarn from the U.S. or yarn produced within one of the Central American countries. CAFTA-DR, and particularly its rules of origin, have been the basis of Guatemala’s strategy in recent years, not only to attract foreign direct investment but also to encourage significant reinvestments.

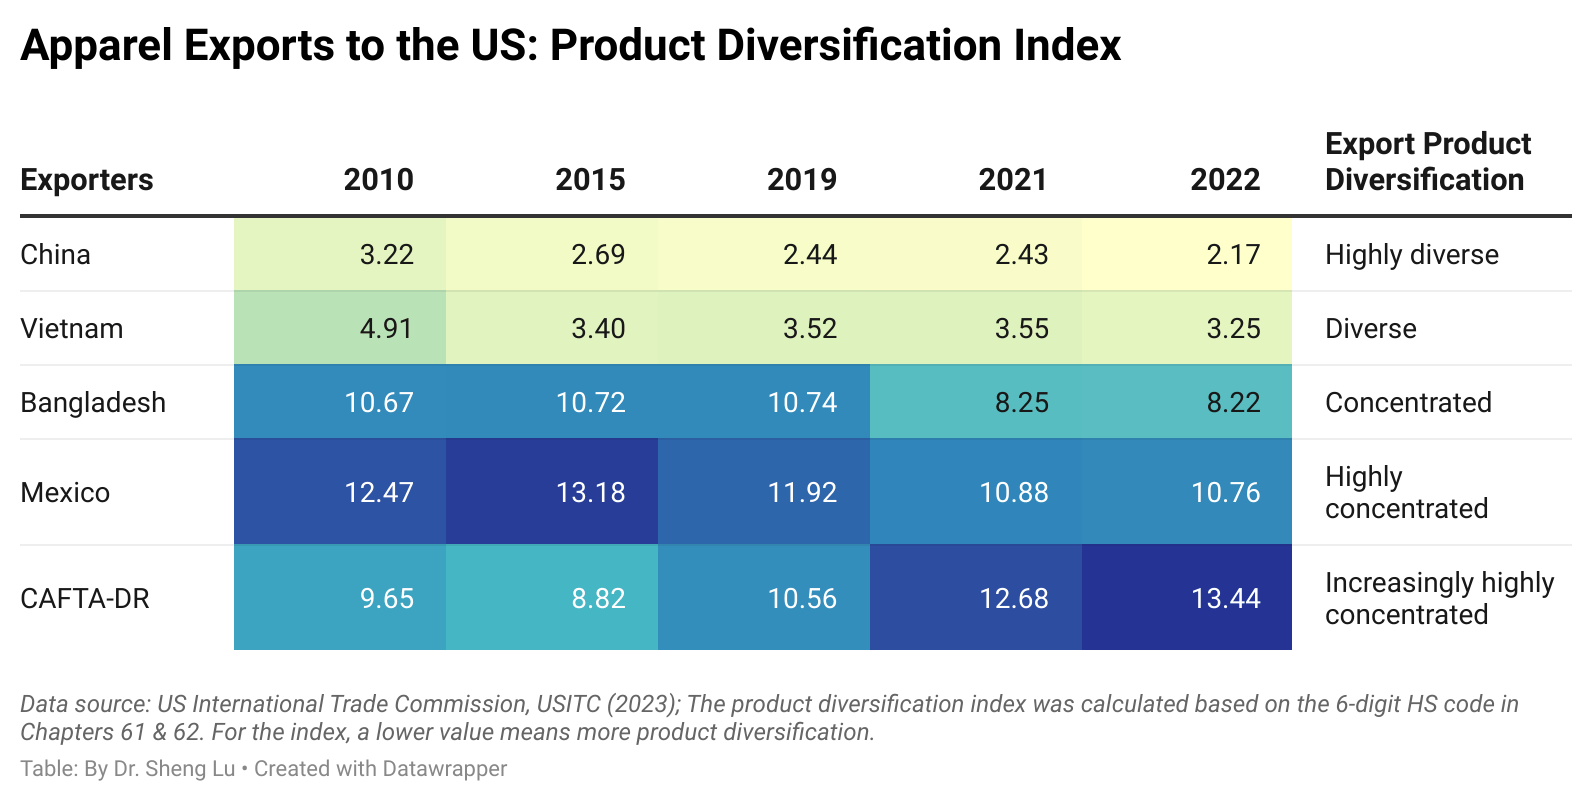
Sheng: Data shows that an increasing share of yarns and fabrics used by Guatemala garment factories are now locally made in Guatemala and other Central American countries. Could you discuss the recent trends in textile manufacturing capacity building in Guatemala, as well as the industry’s current priorities in building a more vertically integrated regional supply chain?

Karin:Guatemala offers a series of competitive advantages that are reinforcing its role as a regional hub for textile and apparel manufacturing. At the country level, it benefits from a stable macroeconomy, a solid exchange rate, competitive electricity prices within the region, and a reliable energy supply. At the industry level, Guatemala stands out for its robust apparel and textile cluster and highly skilled workforce.

Since the pandemic in 2020, when many global companies accelerated nearshoring strategies, Guatemala has successfully attracted new foreign investment and supported the expansion of companies already established in the country, particularly in the spinning industry. Installed capacity is primarily focused on cotton, although blends are also produced. By the end of 2024, apparel exported to the U.S. consisted of 62.8% cotton, 36.4% synthetics, and 0.8% wool, reflecting the central role of cotton in the country’s production while also showing diversification into other fibers.

Driven by shifting market demand, textile production in Guatemala has been expanding beyond knits, with a modest increase in woven fabrics as well. Investments in innovation and technology have enabled the industry to offer specialized processes, including antimicrobial treatments, absorption, UPF protection, enzymatic washing, softening, and plush finishing, among others. A particularly important advancement has been the investment in elastic knit fabrics, which has opened the door to the production of categories such as sportswear, intimate apparel (seamless), shapewear (technical lingerie and compression fabrics), and medical textiles.

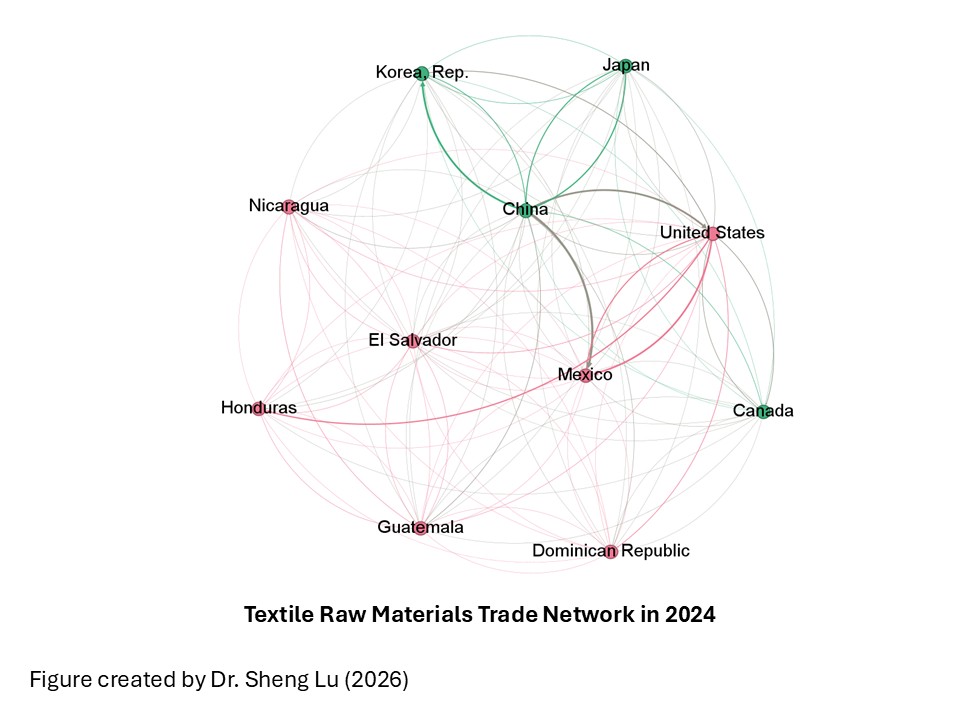
We recognize, however, that there remain challenges and opportunities to broaden the regional textile offering—particularly in the production of yarns and fabrics made from fibers not yet manufactured locally. Expanding capacity in these areas would further strengthen vertical integration and supply chain resilience.

In this context, VESTEX has taken a leading role in supporting and guiding companies interested in exploring these opportunities. In coordination with Guatemala’s foreign direct investment promotion agency, efforts are underway to identify high-demand inputs that are currently unavailable in the region but represent strategic opportunities for local production.

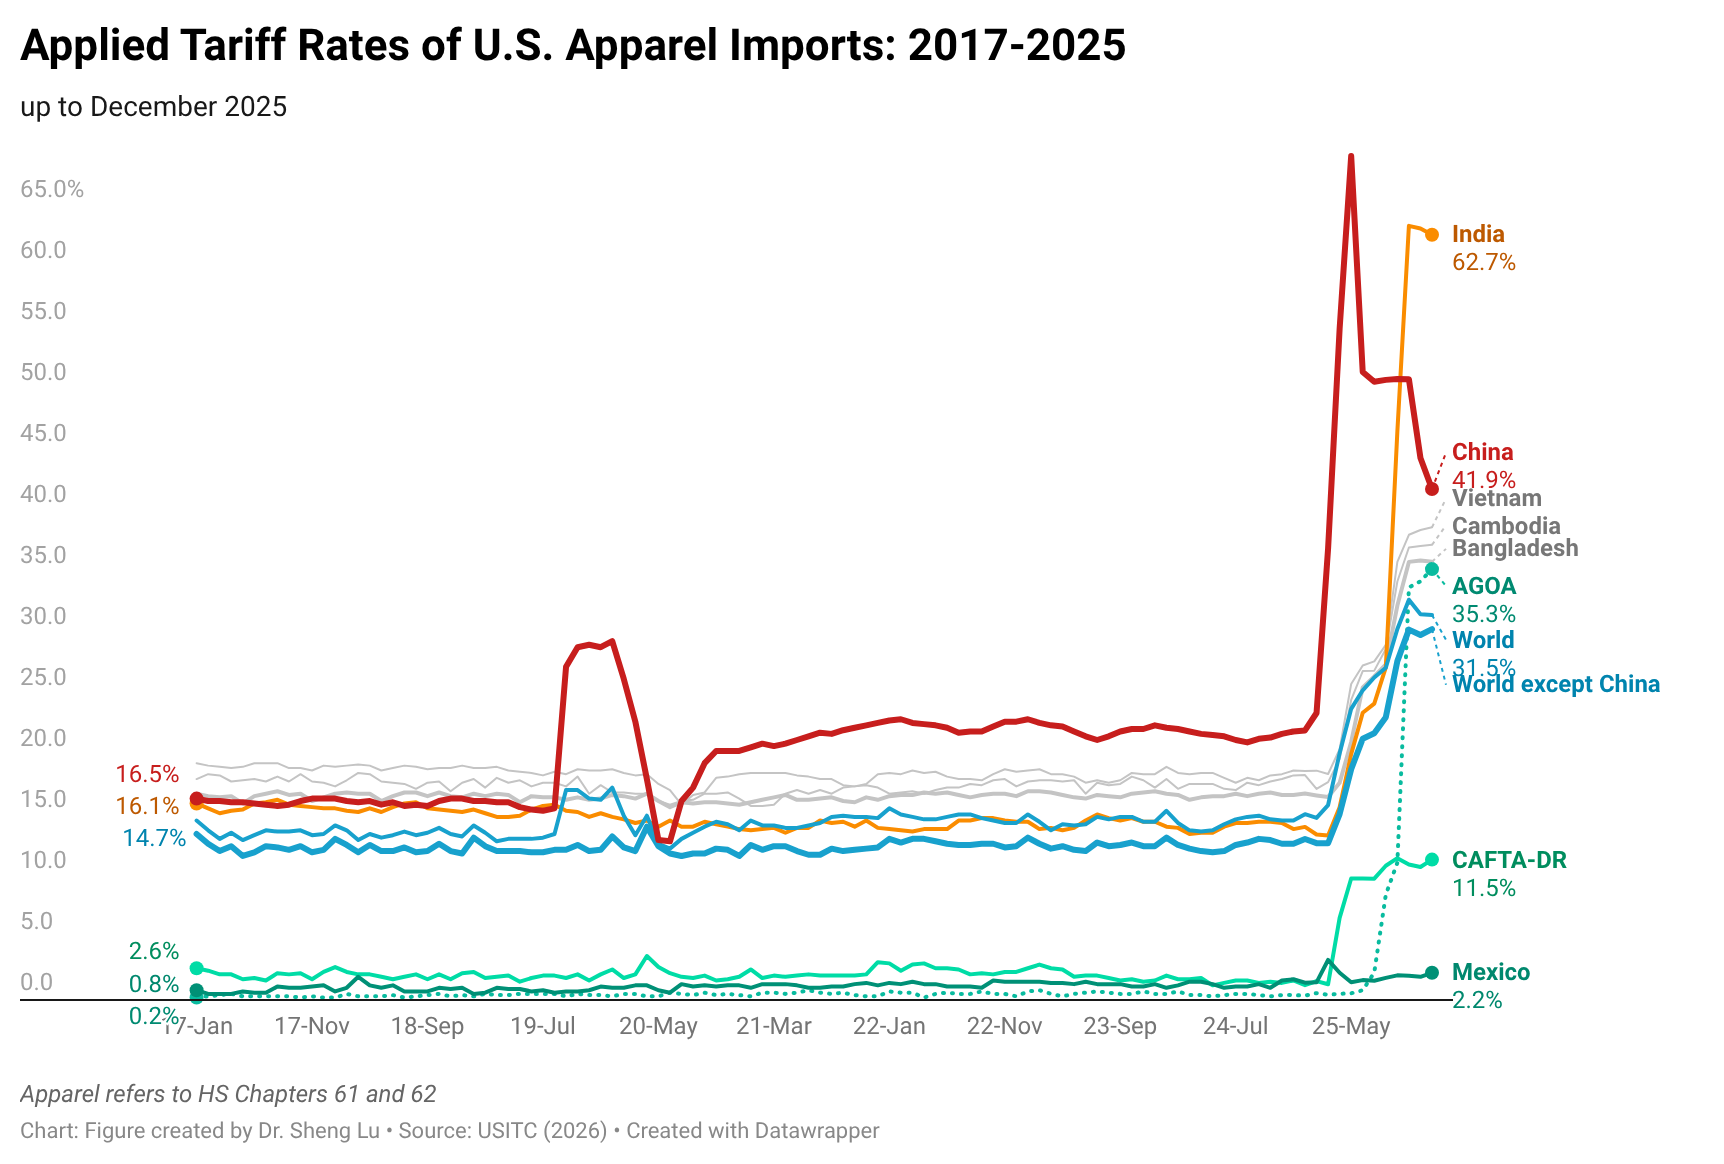
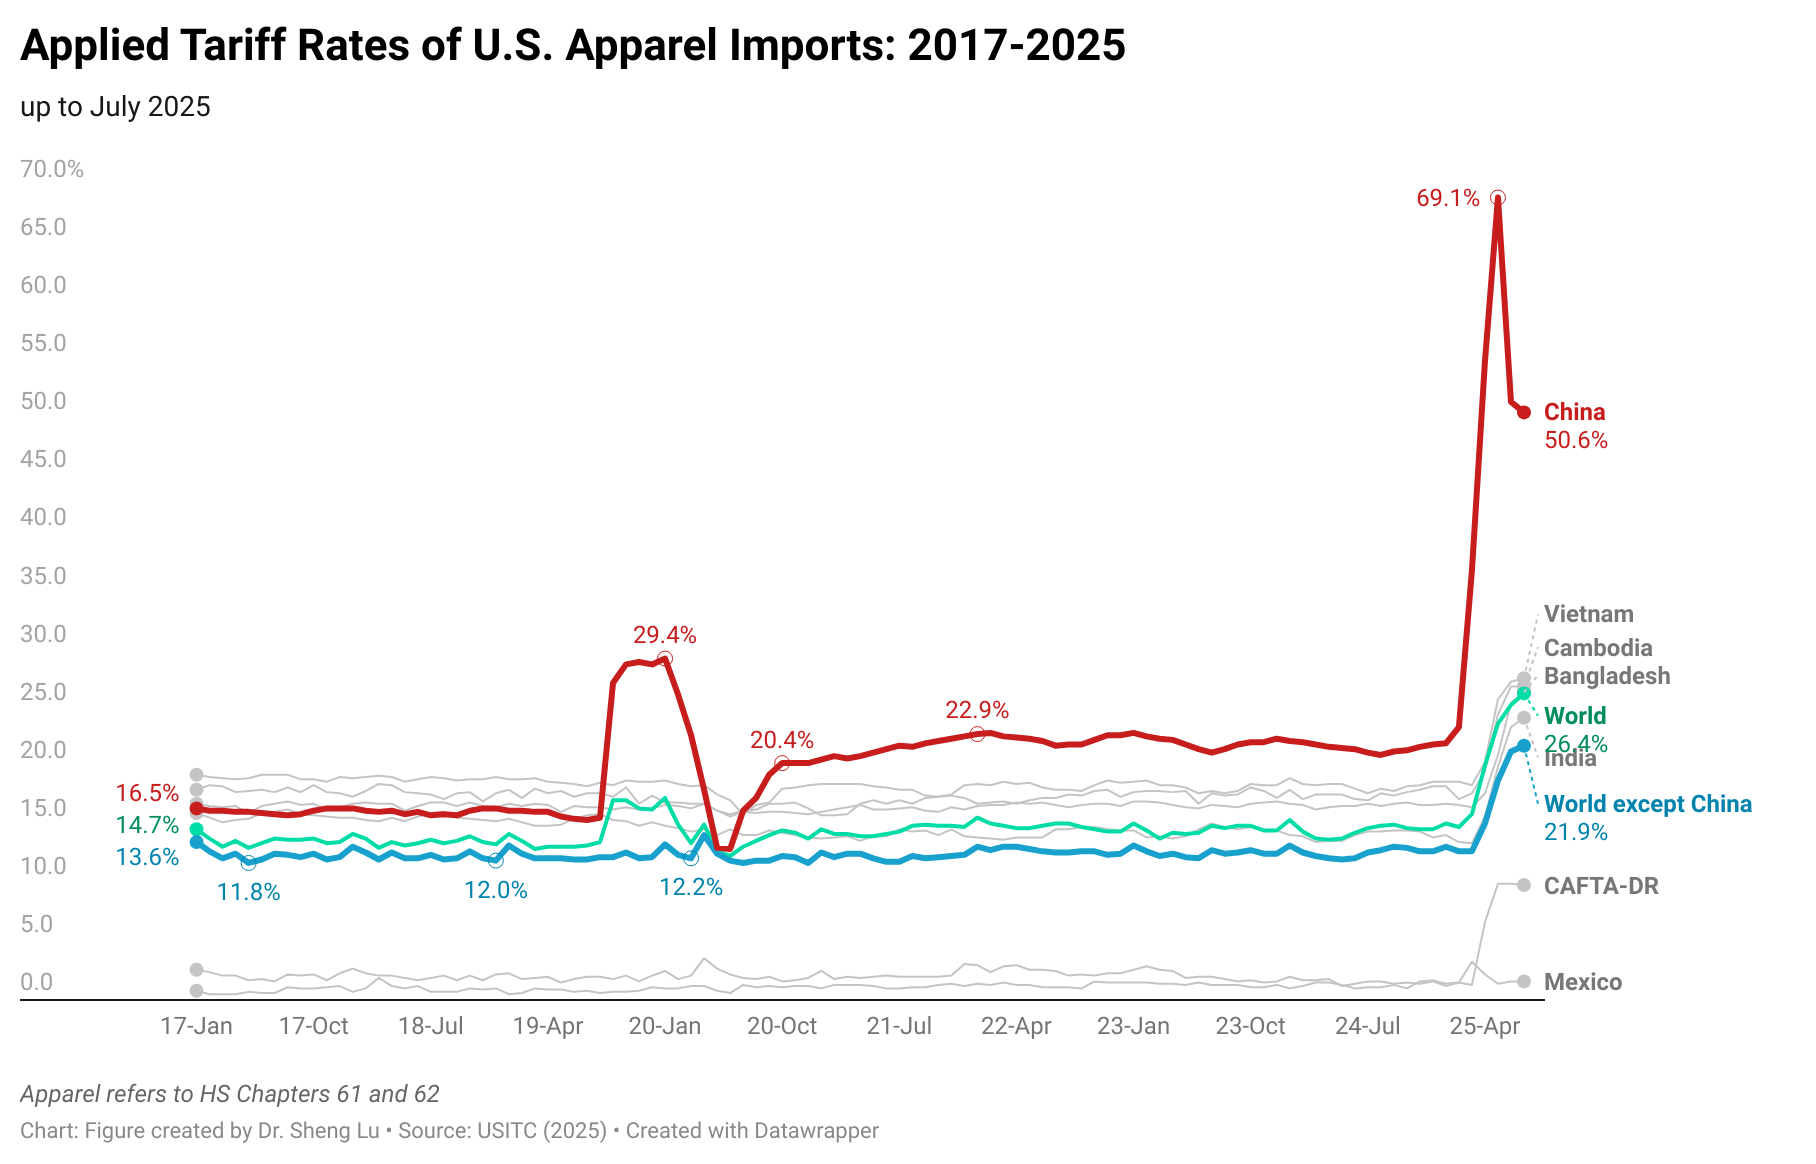
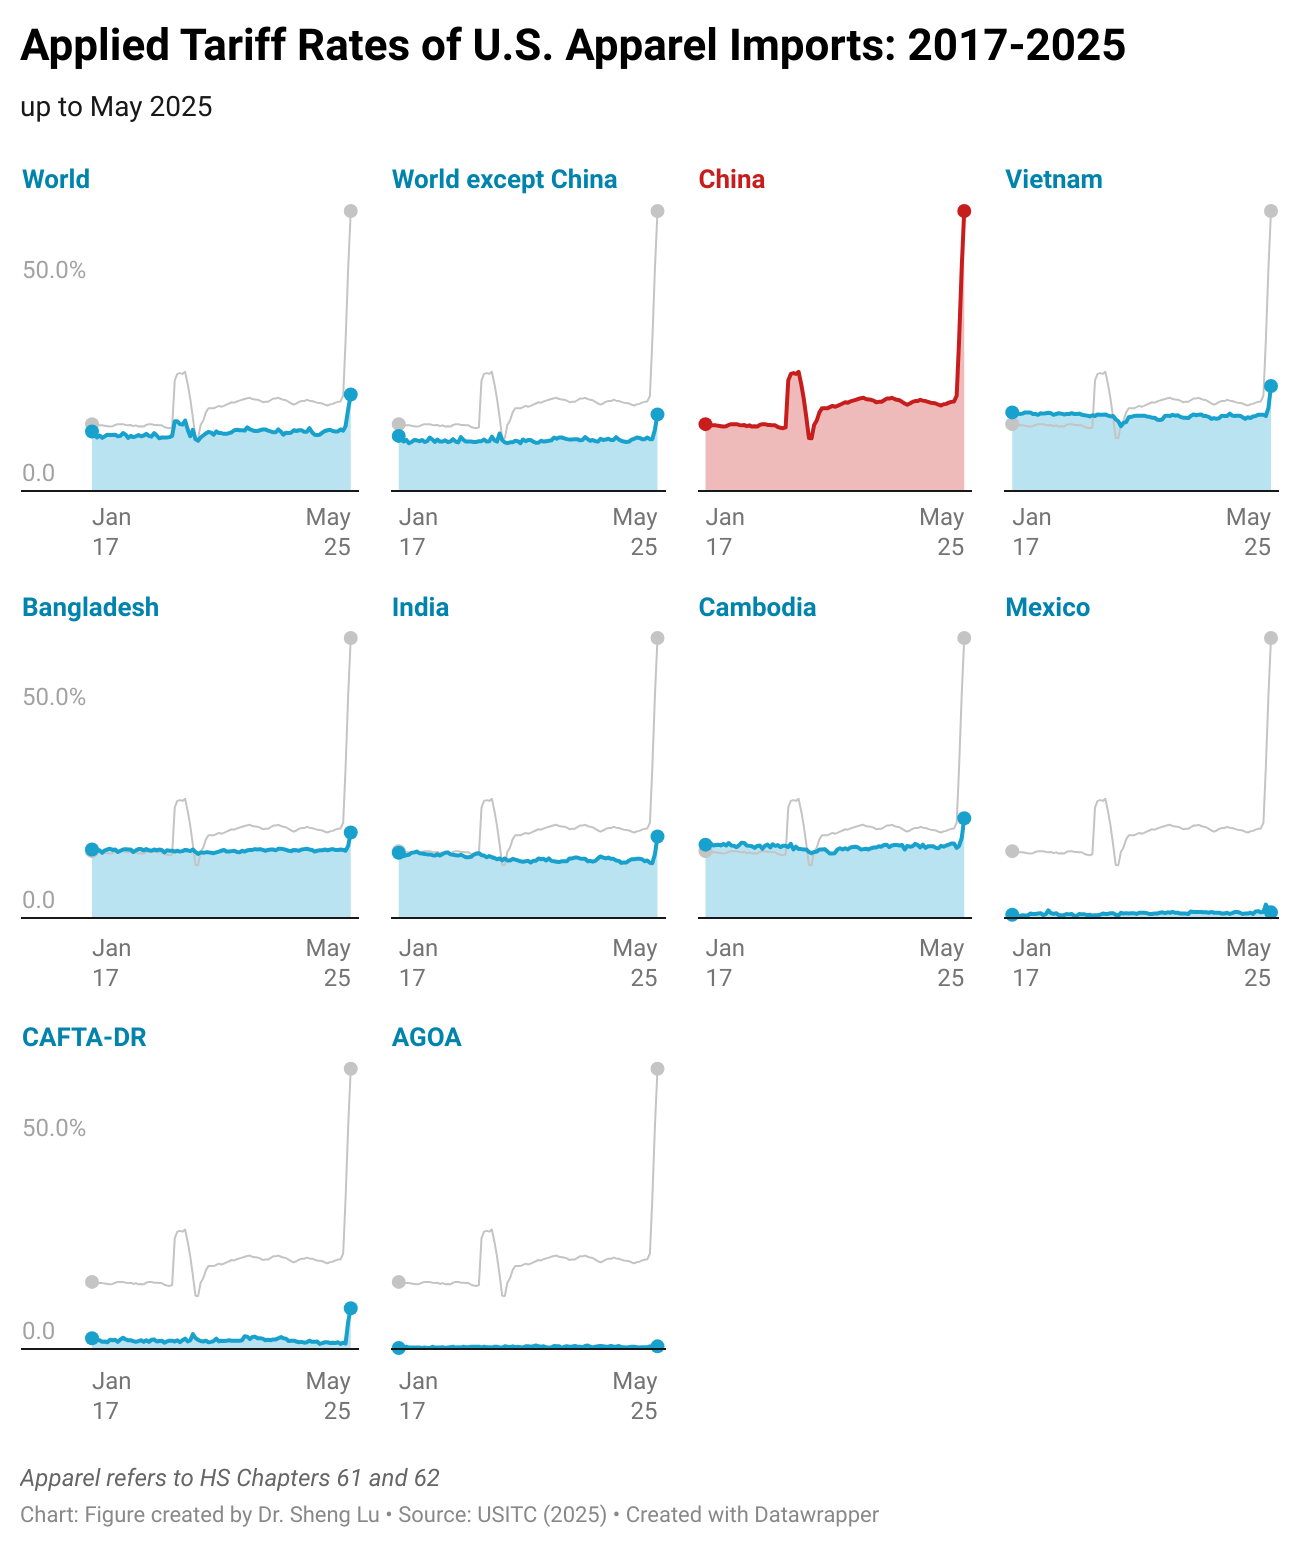
Sheng: Since April 2025, U.S. apparel imports from CAFTA-DR countries, including Guatemala, are subject to a new 10% “reciprocal tariff.” How has this tariff increase and the Trump administration’s trade policy so far impacted Guatemala’s garment industry and exports? 

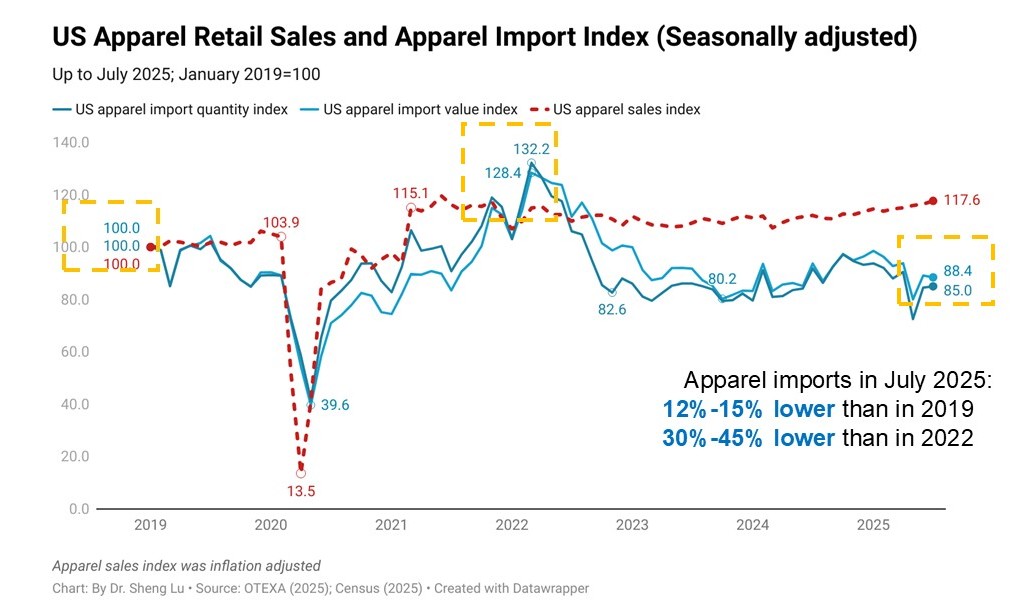
Karin:The main challenge for Guatemala’s apparel industry under the current U.S. trade policy has been the high degree of uncertainty. Markets and buyers demand stability, yet in recent months orders have slowed significantly as companies await clarity on the tariffs that will ultimately apply to each country. This hesitation has already resulted in lost opportunities: seasonal orders cannot be recovered once the selling window has passed.

Traditionally, Guatemala’s apparel sector grows between 3% and 5% annually; however, 2025 projections have been revised downward, and current expectations suggest growth closer to 1–2%. According to the Central Bank of Guatemala, as of June 2025, exports registered a modest 1.36% increase—well below what was anticipated under normal conditions.

Another major impact has been the need for companies to absorb additional costs to maintain contracts with international brands. This has reduced profit margins, limited reinvestment capacity, and increased pressure on already tight production cycles. Buyers face uncertainty as well: they do not know how much a garment ordered today will cost by the time it is delivered six to nine months later, since tariff rates are subject to abrupt changes. The volatility recalls past episodes in China, where tariffs under former President Trump rose as high as 145% before being reduced to 30%, creating unpredictable supply conditions.

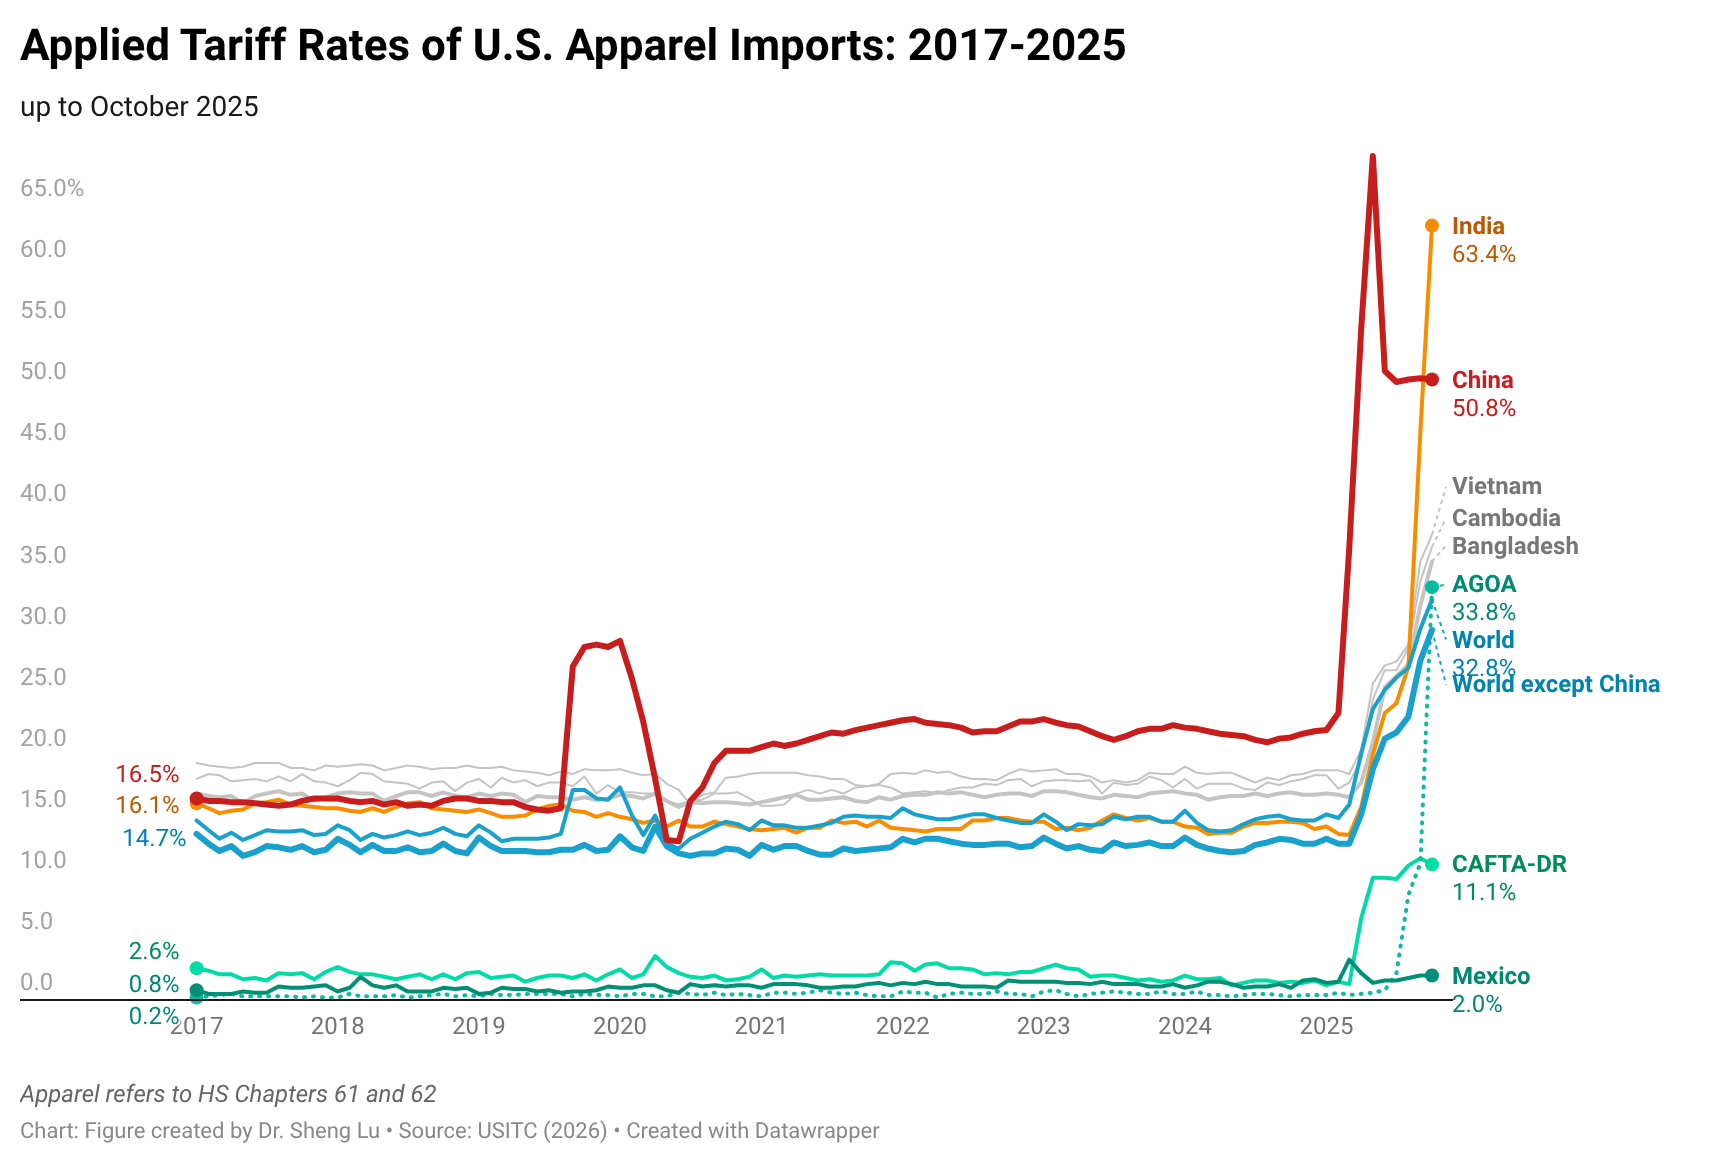
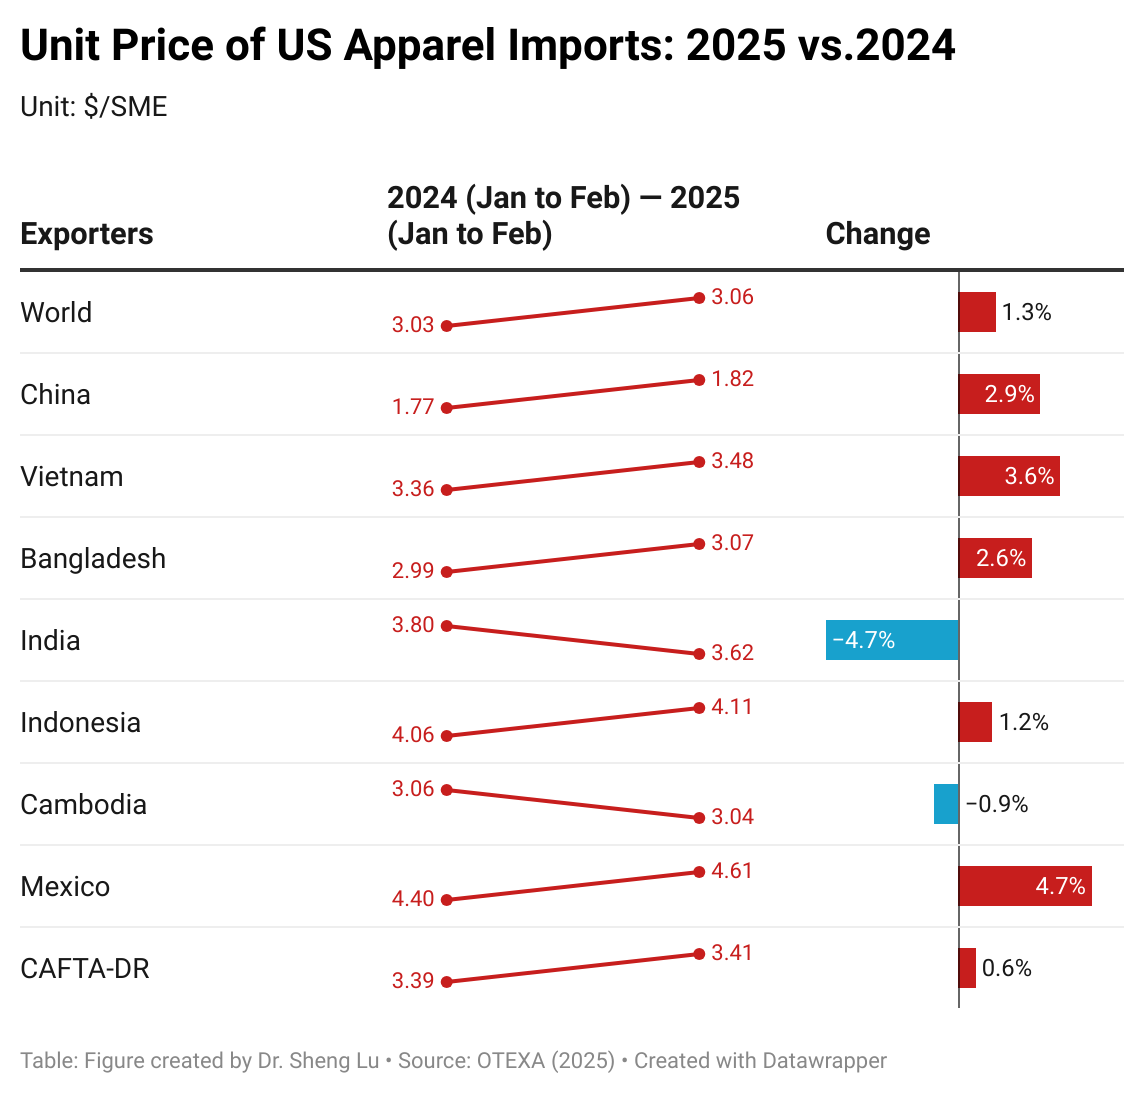
That said, Guatemala continues to hold a relative tariff advantage compared with Asian competitors, where rates now reach 15%, 18%, 25%, or even higher. This gap may ultimately favor Guatemala if U.S. buyers reconfigure sourcing strategies to prioritize suppliers who are both geographically closer and more reliable. Indeed, global sourcing is shifting away from a purely low-cost model toward one that values resilience, speed to market, and compliance.

Sheng: The 2025 US Fashion Industry Association Benchmarking Study indicates that U.S. fashion companies are increasingly seeking sourcing destinations that can provide sustainable apparel products, including those made with preferred fibers such as organic, recycled, regenerative, and biodegradable materials. What strategies or recent initiatives has the Guatemalan textile and apparel industry undertaken to meet this demand for sustainability?

Karin: Guatemalan mills already source recycled polyester yarns, organic or regenerative cotton, and biodegradable materials. Brands are actively demanding these products. In fact, mills have obtained various certifications and adhere to practices focused on circular economy, science-based target initiatives, and other sustainability standards.

Traceability is key for the textile and apparel industry, and Guatemala has managed to implement measures such as data management and continuous improvement as a way to demonstrate this.

  • Adoption of Sustainable Certifications and Standards: Guatemalan manufacturers are obtaining certifications like GOTS (Global Organic Textile Standard), OEKO-TEX, Global Recycled Standard, Recycled Claim Standard, Blue Sign, Higg FEM, among others, ensuring their products meet international sustainability standards.
  • Investment in Technologies: Many mills are upgrading to water and energy-efficient machinery, as well as more sustainable dyeing and finishing processes.
  • Training and Capacity Building: Initiatives to train and certify workers and management on sustainable practices and standards are increasing, promoting a culture of sustainability throughout the industry.
  • Integration of Circular Economy Principles: Some mills are exploring design for recyclability techniques to align with circular economy goals.

These initiatives collectively position the Guatemalan textile and apparel sector as a viable sourcing destination for sustainable fashion, aligning with global market trends and buyer preferences for more sustainable products.

Sheng: In addition to the questions discussed earlier, what are the top business and policy issues facing Guatemala’s textile and apparel industry over the next 1–2 years?

Karin:Over the next 1–2 years, Guatemala’s textile and apparel industry will face several pressing business and policy issues that will shape its competitiveness.

1. Infrastructure and logistics.
A key issue remains the need to strengthen national infrastructure, particularly ports, customs processes, and internal transport routes.

2. Limited availability of regional inputs.
The industry continues to face constraints in the local production of certain yarns, fabrics, and specialized fibers. Inputs such as viscose, spandex, and rayon are not yet manufactured in the region at scale, which limits vertical integration and forces reliance on imports from outside the hemisphere. Expanding textile capacity in these areas is a central issue to ensure resilience and broaden the exportable supply.

3. Market visibility and buyer perception.
Despite its high level of integration, many international buyers remain unaware of Guatemala’s strengths in complex products, compliance, and sustainability. A persistent challenge is to raise global awareness of the country’s capabilities in order to capture greater sourcing opportunities.

4. Policy uncertainty and trade volatility.
The recent 10% reciprocal tariff applied to CAFTA-DR countries has introduced significant uncertainty. Buyers hesitate to place long-term orders when tariff levels are unclear, and this volatility affects sourcing decisions. Stability and predictability in trade policy remain critical issues for the sector.

5. Differentiation and specialization under nearshoring.
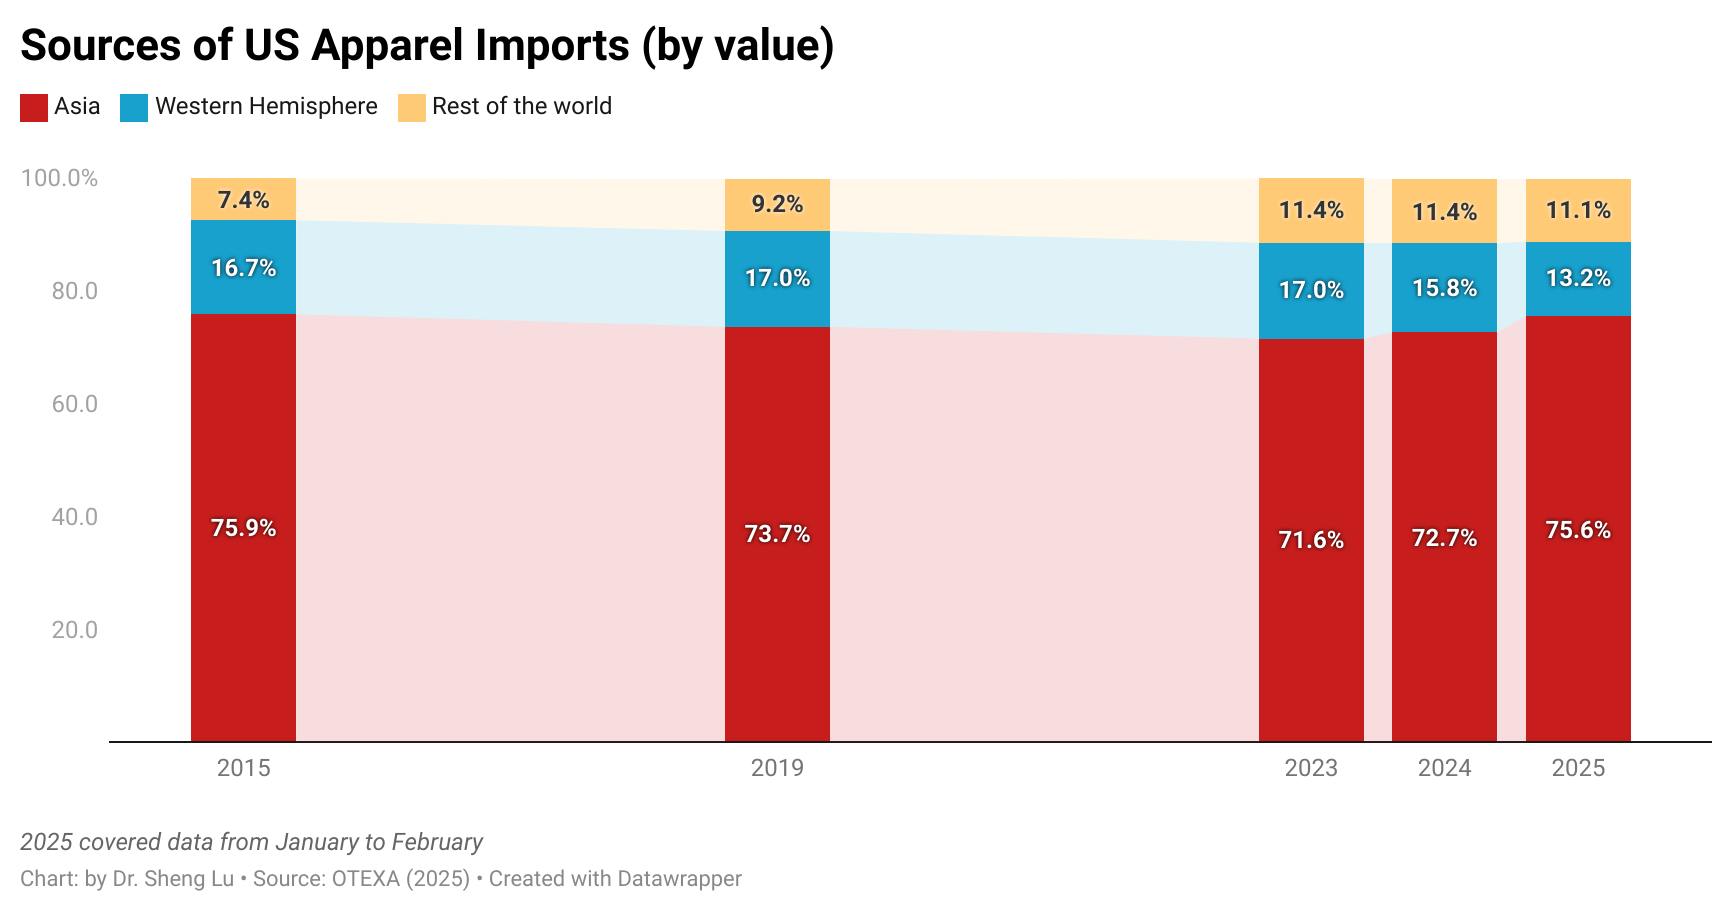
Another key challenge is sustaining competitiveness through higher-value products. Today, 54.11% of Guatemala’s apparel exports already include advanced finishing processes, and the industry is investing in spinning, woven fabrics, and technical textiles. However, scaling these capabilities requires reinvestment and foreign capital inflows—both of which are being constrained by global uncertainty. Given that Guatemala currently supplies only about 2% of U.S. apparel imports, a major issue ahead is how to convert this untapped potential into tangible growth.

In short, while the country is positioning itself strategically with competitive tariffs, geographic proximity, and an increasingly sophisticated textile base, the top issues over the next two years will be overcoming infrastructure and logistics bottlenecks, reducing dependence on imported inputs, strengthening promotion to buyers, and navigating trade policy volatility. Addressing these challenges will be crucial for Guatemala to capitalize on long-term opportunities in the ongoing global supply chain reconfiguration.

-The End-

Average Tariff Rates for U.S. Apparel Imports under Trump’s “Reciprocal Tariff” Policy (Updated July 2025)

The latest data from the U.S. International Trade Commission (USITC) indicates that Trump’s “Reciprocal Tariff” has led to higher import duties on U.S. apparel imports, although the impact on sourcing appears to be more nuanced than expected. Specifically:

As a result of the reciprocal tariff, the average tariff rate for U.S. apparel imports (HS Chapters 61 and 62) reached 23.8% in May 2025, increased further from 20.8% in April 2025 and much higher than 13.9% in May 2024 and 14.7% in January 2025, prior to Trump’s second term. This tariff rate also hit its highest level in decades. Similarly, while the value of U.S. apparel imports in May 2025 decreased by 7% from May 2024, the import duties skyrocketed by nearly 60% over the same period. [View detailed data HERE]

Due to numerous punitive tariffs beginning in February 2025, the average tariff rate for U.S. apparel imports from China reached an unprecedented 69.1% in May 2025, a further increase from 55.0% in April 2025, 37.0% in March 2025 and 22.1% in January 2025. In theory, U.S. apparel imports from China in May should be subject to a tariff rate of over 145%, as mandated by a series of executive orders. However, as “goods loaded onto a vessel at the port of loading and in transit on the final mode of transit before 12:01 a.m. eastern daylight time on April 5, 2025,“ were excluded from Trump’s reciprocal tariffs, it explains why the actual tariff rate in April and May 2025 appeared lower than the theoretical one.

Nonetheless, affected by the high tariffs, the value of US apparel imports from China in May 2025 was cut by more than half from a year ago (down 52%). China’s market share in US apparel imports in May 2025 also dropped to 9.9%, a new low in decades (note: was 19.9% in May 2024). [View detailed data HERE]

Additionally, the average tariff rate for U.S. apparel imports from countries other than China reached 18.9% in May 2025, up from 15.2% in April 2025. Although this rate was higher than approximately 12-13% before Trump’s second term in early 2025, the increase was still much more modest than the theoretical 10% universal reciprocal tariff rate announced by the Trump administration. The average tariff rates for U.S. apparel imports from leading Asian suppliers such as Vietnam, Bangladesh, and Cambodia followed similar patterns (i.e., higher tariff rates but well below a 10% increase). Similar to China’s case, it appears that U.S. apparel imports from other countries in April 2025 included a significant proportion of products that were exempt from reciprocal tariffs because they were “loaded onto a vessel” early enough. [View detailed data HERE]

It is interesting to note that the reciprocal tariff resulted in the most significant increase in tariff rates on U.S. apparel imports from CAFTA-DR members. While imports from these countries were supposed to be duty-free under the trade agreement, the average tariff rate reached 10% in May 2025, up from 6.7% in April 2025. In other words, the short shipping distance unintentionally “disadvantaged” near-shoring imports from being exempted from the reciprocal tariffs, as they could be mostly loaded after the deadline.

Overall, it remains uncertain how the U.S. apparel tariff rates will continue to evolve in response to Trump’s shifting tariff policy. It appears that the trade volume and timing of shipment will be highly sensitive to short-term tariff rate changes, whereas adjusting sourcing bases and product structures will be a consideration for U.S. fashion companies in the medium to long term.

By Sheng Lu

Additional reading: Apparel Tariffs Climbed to Historic Highs in April (Sourcing Journal, June 13, 2025)

Patterns of U.S. Apparel Sourcing and Imports (updated April 2025)

The following analysis was based on the latest trade statistics from the Office of Textiles and Apparel (OTEXA) under the U.S. Department of Commerce.

First, the growth of U.S. apparel imports significantly slowed as fashion companies shifted from eagerly piling up stock to the wait-and-see mode. Specifically, in February 2025, U.S. apparel imports moderately went up 3.2% in value and 1.5% in quantity, much lower than the 18-19% increase seen in late 2024 and January 2025. The much-slowed growth confirmed that the earlier U.S. apparel import surge was largely driven by fashion companies’ worries about the upcoming tariff hikes rather than an actual increase in consumer demand.

Adding to the concern, U.S. consumer confidence fell sharply, which could lead to a steep drop in U.S. apparel imports ahead. For example, the Consumer Confidence Index dropped to a two-year low of 92.9 in March 2025, down from 100.1 the previous month (1985=100). Similarly, the Expectations Index—which measures consumers’ short-term outlook for income, business, and labor market conditions—plunged to 65.2, marking its lowest level in 12 years. With the announcement of reciprocal tariffs and the growing likelihood of an economic recession, U.S. consumer demand for clothing may decline significantly, potentially leading to the cancellation of many sourcing orders.

Second, apparel imports have become more expensive. Measured in dollars per square meters equivalent (SME), the unit price of U.S. apparel imports averaged $3.06/SME in the first two months of 2025, up from $3.03/SME a year ago (or a 1.3% increase). The unit price of U.S. apparel imports from many leading Asian countries rose at a notably higher rate, including China (up 2.9%), Vietnam (up 3.6%), and Bangladesh (up 2.6%), as well as those from Mexico (up 4.7%) and CAFTA-DR (up 0.6%). This result reflected the growing pressure of sourcing and production costs facing U.S. fashion companies and their suppliers, driven by rising labor costs and raw material prices among other factors. Indeed, if Trump’s reciprocal tariffs ultimately take effect, import prices could increase even more significantly.

Third, U.S. fashion companies’ sourcing diversification efforts appeared to slow amid rising uncertainty. In February 2025, Asian countries collectively accounted for 71.5% of the total value of U.S. apparel imports—unchanged from a year earlier. Similarly, in the first two months of 2025, the top five suppliers (China, Vietnam, Bangladesh, Cambodia, and India) made up 63.7% of total apparel imports by value, up from 59.7% during the same period in 2024. Even China’s market share remained largely stable at 18.4% in value and 32% in quantity, compared to a year ago.

These figures suggest that U.S. fashion companies somehow have become more hesitant to adjust their sourcing base in response to the universal tariffs imposed by the Trump administration, which target nearly all U.S. trading partners. As a result, U.S. fashion companies may find the sourcing diversification strategies no longer as effective as in the past in effectively mitigating their sourcing risks.

Meanwhile, data from the United Nations (UN Comtrade) show that Asian countries’ dependence on the U.S. market for apparel exports varied. In 2024, Vietnam, Sri Lanka, and ASEAN members exported about 40% of their apparel to the U.S., whereas the U.S. accounted for only about 20% of China’s and Bangladesh’s total apparel exports to the world. At the same time, the U.S. remained the single largest export market for Mexico and CAFTA-DR members, due to the integrated Western Hemisphere textile and apparel supply chain.

Fourth, no evidence shows that the current trading environment has benefited from near-shoring from the Western Hemisphere. On the contrary, measured in quantity, in February 2025, only 7.6% of U.S. apparel imports came from CAFTA-DR members, a notable drop from 9.6% a year ago. Similarly, Mexico accounted for 2.3% of U.S. apparel imports in February 2025, also lower than 2.4% a year earlier.

As a silver lining, the utilization rate of CAFTA-DR reached 81.1% in 2025 (January to February), much higher than 73.8% over the same period in 2024. About 75.3% of U.S. apparel imports from CAFTA-DR in 2025 (January to February) complied with the yarn-forward rules of origin compared to 67.4% a year ago. However, the use of “short-supply” remained low–only about 2.0% in 2025 so far.

by Dr. Sheng Lu

Related analysis: Lu, S. (2025). Patterns of U.S. Apparel Imports in 2024. Global Textile Academy, International Trade Centre, Geneva, Switzerland.

New Study: How Has the Uyghur Forced Labor Prevention Act (UFLPA) Affected U.S. Apparel Import?

Implemented in June 2022, the Uyghur Forced Labor Prevention Act (UFLPA) prohibits U.S. companies from importing apparel wholly or in part produced in China’s Xinjiang region. UFLPA could significantly alter U.S. apparel import patterns as fashion companies have begun or anticipate adjusting their sourcing base to comply with the law and mitigate the forced labor risks in the supply chain.

This study quantitatively evaluated the impacts of the UFLPA on U.S. apparel imports nearly two years after the law’s implementation. Unlike existing studies primarily focusing on UFLPA’s political or legal aspects, this study’s findings would enhance our understanding of the economic and trade implications of the new law.

A panel regression model was adopted to evaluate the quantitative impact of UFLPA on U.S. apparel imports based on data collected from OTEXA (2024) and USITC (2024), the most authentic government data source. Four countries in three categories were included in the study: 1) China; 2) Vietnam and Bangladesh representing top Asian apparel exporting countries other than China; 3) member countries of the Central America Free Trade Agreement (CAFTA-DR) representing near-shoring sourcing destinations. The annual trade activities of these four countries from 2010 to 2023 (the latest available) were used for the analysis.

The panel regression model suggests several interesting findings*:

Firstly, the results showed that holding other factors constant, U.S. cotton apparel imports from China decreased significantly by approximately 350 million square meter equivalent (SME) annually following UFLPA’s implementation. In other words, the result confirmed that UFLPA had negatively affected U.S. cotton apparel imports from China. This result is far from surprising as Xinjiang accounted for nearly 90% of China’s cotton production, causing significant forced labor risks associated with importing cotton apparel from China.

Secondly, holding other factors constant, U.S. cotton apparel imports from Vietnam and Bangladesh and CAFTA-DR also respectively decreased by approximately 81 million SME, 51 million SME, and 20 million SME annually after UFLPA’s implementation in 2022. The results revealed U.S. fashion companies’ concerns about UFLPA compliance risks associated with sourcing from countries other than China, particularly Asia, due to their heavy reliance on cotton yarns and fabrics from China through a highly integrated regional supply chain.

Thirdly, the results revealed a more significant positive relationship between U.S. cotton exports to China, Vietnam, Bangladesh, and CAFTA-DR countries and U.S. cotton apparel imports from these countries after UFLPA’s implementation. Related, trade data also showed a declining ratio of U.S. cotton apparel imports from China, Vietnam, Bangladesh, and CAFTA-DR countries relative to these countries’ cotton imports from the U.S. This pattern implies a closer alignment in the trade flow of raw cotton from the U.S. to these countries and the return of finished cotton apparel to the U.S. It could be the case that leading apparel exporting countries increasingly used US cotton after UFLPA to mitigate the forced labor risks.

Additionally, there was a negative relationship between U.S. cotton apparel imports from China, Vietnam, Bangladesh, and CAFTA-DR members and U.S. MMF apparel imports from these countries. In other words, cotton apparel and MMF apparel appear to compete within the total U.S. apparel import market. However, UFLPA’s implementation has not significantly impacted the relationship. Nonetheless, MMF apparel has accounted for a growing share of China’s total apparel exports to the United States after UFLPA’s implementation (down from 46% in 2010 to only 19% in 2023).

The study’s findings revealed a broad trade impact of UFLPA’s implementation that goes far beyond China. Notably, cotton apparel exporters from other Asian countries and those in the Western Hemisphere also appeared to be negatively affected by the new law. Also, unlike theoretical prediction, no clear evidence shows that UFLPA has significantly expanded the near-shoring of U.S. cotton apparel imports from the Western Hemisphere, such as CAFTA-DR members.

Meanwhile, the results call for further investigation of the net impact of UFLPA on U.S. cotton exports. While UFLPA may help U.S. cotton gain more shares in the global marketplace, the reduced U.S. import demand for cotton apparel due to forced labor risk concerns may also unexpectedly “shrink the pie size.”

*:The fixed effects (FE) model was selected for the study based on the likelihood ratio test results (p<.01). The result of the F-test suggests the FE model is statistically significant at the 99% confidence level (p<.01). The value of R2 exceeds 0.90, indicating an overall high goodness-of-fit of the panel regression. All the independent variables were statistically significant at the 99% confidence level (p<.01).

By Sheng Lu and Emilie Delaye

Note: The study will be presented at the 2024 International Textile and Apparel Association (ITAA) annual conference in November 2024.

[This blog post is not open for comment]

FASH455 Discussion: How likely will US fashion companies increase apparel sourcing from Guatemala in 2025 compared to 2024?

Note: The video was taken during a Guatemala garment factory visit in May 2024. Credit: Sheng Lu

Discussion instructions:

The following two scenarios are generated by ChatGPT using input from FASH455 students’ proposed discussion questions*. Based on what we learned in class and additional information you collected online (not from ChatGPT or any AI tools), please critique the scenarios presented, including the strengths and weaknesses of the argument, any viewpoints you agree or disagree with, and any additional factors that could be considered. In your response, please share the link to any further resources you consulted.

Scenario 1: US apparel import from Guatemala would increase in 2025

In 2025, U.S. apparel imports from Guatemala are projected to experience a significant increase, driven by a confluence of favorable economic conditions, strategic supply chain shifts, and improvements in local manufacturing capabilities. The U.S. economy is expected to grow at a rate of 2.2%, which, coupled with rising consumer confidence, is likely to sustain robust demand for apparel. Guatemala’s geographic proximity to the U.S. presents a logistical advantage, allowing for shorter shipping times and reduced transportation costs compared to Asian suppliers. Moreover, U.S. apparel imports from Guatemala, which have historically averaged around $1.5 billion, could see a notable increase around 2-5%. This increase is further supported by Guatemala’s investments in modernizing its textile industry, including advancements in sustainable practices and technology adoption that align with growing consumer preferences for ethically sourced and environmentally friendly products.

Additionally, the Central America-Dominican Republic Free Trade Agreement (CAFTA-DR) has enabled duty-free access for certain apparel products, encouraging more U.S. brands to explore sourcing options in Guatemala. With a utilization rate of around 70% under CAFTA-DR, brands are beginning to leverage the agreement more effectively, which could lead to a higher volume of apparel imports as they seek to optimize their supply chains. In this context, the increasing trend toward sustainable fashion could further elevate Guatemala’s status as a preferred sourcing location, particularly for companies looking to enhance their corporate social responsibility profiles. As a result, the combination of economic growth, logistical advantages, and strategic shifts in sourcing could lead to a substantial increase in U.S. apparel imports from Guatemala in 2025.

Scenario 2: US apparel import from Guatemala would remain stagnant in 2025

U.S. apparel imports from Guatemala are poised to remain stagnant in 2025, continuing a troubling trend that has characterized the market for over a decade. Despite a projected U.S. GDP growth of 2.2%, the apparel market faces significant challenges that hinder any potential growth in trade volume. Historical data illustrates that U.S. imports from Guatemala have stagnated around $1.5 billion, primarily due to intense competition from Asian manufacturers who can offer lower prices and greater production capacity. With the global supply chain still recovering from disruptions and high inflation pressure, U.S. companies may prioritize sourcing from countries that can provide more cost-effective solutions, further sidelining Guatemala.

Moreover, Guatemala’s textile sector grapples with persistent capacity constraints and labor shortages, limiting its ability to scale operations effectively in response to market demands. The country’s utilization of CAFTA-DR benefits remains suboptimal, hovering around 70%, and many brands have yet to fully exploit the agreement to its potential. This underutilization could be a significant barrier to increasing trade volume, as companies may prefer sourcing from countries that can more efficiently navigate trade agreements and provide better pricing structures. Additionally, the growing trend toward fast fashion and quick turnaround times poses a challenge for Guatemalan manufacturers, who may struggle to compete with the rapid production cycles of Asian suppliers. Given these persistent issues, U.S. apparel imports from Guatemala are likely to remain stagnant at approximately $1.5 billion in 2025, as the country continues to face formidable obstacles in enhancing its role in the global apparel supply chain.

*Questions FASH455 students proposed to generate initial information. Read the ChatGPT responses here.

  • Compare the most likely scenario of Trump or Harris becoming the next U.S. president and its impact on US apparel sourcing from Guatemala.
  • Here is the latest US GDP growth and forecast: 2.9% in 2023, 2.8% in 2024 and 2.2% in 2025. Analyze the historical data you have access to and predict US apparel imports from Guatemala in 2025. Ideally, please provide numerical results
  • US apparel imports from Guatemala have stagnated over the past decade. What are the critical reasons for the lack of growth? Will any factors likely change in 2025, or will they remain mostly the same?
  • Does Guatemala have the capacity to handle increased US apparel sourcing demand in 2025 from 2024? Say 5% increase or 10% increase? Please use data to justify your viewpoint.
  • What factors would impact US fashion companies sourcing with Guatemala in the future? Will any factors change in 2025, and why?
  • What is the relationship between CAFTA-DR’s utilization and the value of US apparel imports from Guatemala? Based on historical data, will the utilization rate significantly affect the trade volume?
  • Will offering more flexibility in CAFTA-DR’s apparel rules of origin encourage more apparel imports from Guatemala, and why?
  • Will recycled textiles significantly boost US apparel sourcing in 2025 vs 2024? or instead, this is a niche product and won’t affect the sourcing volume much
  • Is Guatemala a preferred sourcing base among fashion companies for fast fashion items? Can Guantema compete with Asian countries for such orders in 2025?

2024 USFIA Fashion Industry Benchmarking Study Released

The full report is HERE

Key findings of this year’s report:

#1 Respondents reported growing sourcing risks of various kinds in 2024, from navigating an uncertain U.S. economy, managing forced labor risks, and responding to shipping and supply chain disruptions to facing rising geopolitical tensions and trade protectionism.

  • Over half of the respondents ranked “Inflation and economic outlook in the U.S.” and “Managing the forced labor risks in the supply chain” as their top business challenges in 2024.
  • The issues of “Shipping delays and supply chain disruptions” and “Managing geopolitics and other political instability related to sourcing” have newly emerged among respondents’ top five concerns in 2024.
  • About 45 percent of respondents rated “Protectionist trade policy agenda in the United States” as a top five business challenge this year, a jump from only 15 percent in 2023.

#2 U.S. fashion companies leverage sourcing diversification to respond to the growing sourcing risks and market uncertainty in 2024.

  • Nearly 70 percent of large-sized companies with 1,000+ employees reported sourcing from ten or more countries, significantly higher than the 45-55 percent range in the past few years. It also has become more common for medium to small-sized companies with fewer than 1,000 employees to source apparel from six or more countries in 2024 than in the past.
  • Nearly 80 percent of respondents plan to source from the same number of countries or even more countries through 2026, aiming to mitigate sourcing risks more effectively. However, their approaches differ at the firm level—some U.S. fashion companies plan to work with fewer vendors, while others intend to source from more.

#3 Managing the risk of forced labor in the supply chain continues to be a top priority for U.S. fashion companies in 2024.

  • U.S. fashion companies have adopted a comprehensive approach to comply with UFLPA and mitigate forced labor risks. On average, each surveyed company has implemented approximately six distinct practices across various aspects of their business operations this year, up from an average of five in 2023.
  • More than 90 percent of respondents say they are “Making more efforts to map and understand our supply chain, including the sources of fibers and yarns contained in finished products.” Notably, nearly 90 percent of respondents report mapping their entire apparel supply chains from Tier 1 to Tier 3 in 2024, a significant increase from about 40 percent in the past few years.
  • More than 80 percent of respondents say they “intentionally reduce sourcing from high-risk countries” in response to the UFLPA’s implementation. Another 75 percent of respondents explicitly state that their company has “banned the use of Chinese cotton in the apparel products” they carry.
  • About 45 percent of respondents have been actively “exploring sourcing destinations beyond Asia to mitigate forced labor risks.” However, this year, fewer respondents (i.e., under 10 percent) plan to cut apparel sourcing from Asian countries other than China directly, implying a more targeted and balanced approach to mitigating risks and meeting sourcing needs.
  • Based on field experience, respondents call for greater transparency in U.S. Customs and Border Protection (CBP)’s UFLPA enforcement, specifically in shipment detention and release decisions and in targeted entities and commodities information. Respondents also suggested that CBP reduce repeated detentions, focus on “bad actors” only, clarify enforcement on recycled cotton, and continue to partner with U.S. fashion companies on UFLPA enforcement.

#4 U.S. fashion companies remain deeply concerned about the deteriorating U.S.-China bilateral relationship and plan to further “reduce China exposure” to mitigate risks.

  • A record 43 percent of respondents sourced less than 10 percent of their apparel products from China this year, compared to only 18 percent in 2018. Likewise, nearly 60 percent of respondents no longer use China as their top apparel supplier in 2024, much higher than the 25-30 percent range before the pandemic.
  • Respondents rated China as economically competitive as an apparel sourcing base compared to many of its Asian competitors regarding vertical manufacturing capability, relatively low minimum order quantity (MOQ) requirements, flexibility and agility, sourcing costs, and speed to market. However, non-economic factors, particularly the perceived high risks of forced labor and geopolitical tensions, are driving U.S. fashion companies to move sourcing out of China. This trend applies to surveyed U.S. fashion companies selling products in China.
  • Nearly 80 percent of respondents plan to reduce their apparel sourcing from China further over the next two years through 2026. Consistent with last year’s results, large-size U.S. fashion companies with 1,000+ employees currently sourcing more than 10 percent of their apparel products from China are among the most eager to “de-risk.”

#5 U.S. fashion companies are actively exploring new sourcing opportunities, with a particular focus on emerging destinations in Asia and the Western Hemisphere.

  • This year, more respondents reported sourcing from India (89 percent utilization rate) than from Bangladesh (86 percent utilization rate) for the first time since we began the survey. Also, nearly 60 percent of respondents plan to expand apparel sourcing from India over the next two years, exceeding the planned expansion from any other Asian country.
  • For the second year in a row, three non-Asian countries made it to the top ten most utilized apparel sourcing destination list in 2024, including Guatemala (ranked 7th), Mexico (ranked 7th), and Egypt (ranked 10th). All three countries also witnessed an improved utilization rate in 2024 compared to last year’s survey results.
  • This year, a new record 52 percent of respondents plan to expand apparel sourcing from members of the Dominican Republic-Central American Free Trade Agreement (CAFTA-DR), over the next two years, up from 40 percent in 2023. However, most U.S. fashion companies consider expanding near-shoring from the Western Hemisphere as part of their overall sourcing diversification strategy. For example, nearly ALL companies that plan to increase sourcing from CAFTA-DR over the next two years also plan to increase sourcing from Asia.
  • 75 percent of respondents identified the “lack of sufficient access to textile raw materials” as the main bottleneck preventing them from sourcing more apparel from CAFTA-DR members. Respondents say the local manufacturing capability for yarns and fabrics using fiber types other than cotton and polyester, such as spandex, nylon, viscose, rayon, and wool, was modest or low in the CAFTA-DR region, even when including the United States.
  • The U.S.-Mexico-Canada Trade Agreement (USMCA) entered into force on July 1, 2020, replacing the North American Free Trade Agreement (NAFTA). Within the context of expanding nearing-shoring from the Western Hemisphere, in 2024, about 65 percent of respondents reported sourcing from Mexico and Canada (or USMCA members), a noticeable increase from about 40 percent in 2019-2020. About 36 percent of respondents say their companies “expanded apparel sourcing from USMCA members because of the agreement.

#6 Respondents underscore the importance of immediate renewal of AGOA before its expiration in September 2025 and extending the agreement for at least another ten years.

  • This year, respondents reported sourcing from seven AGOA members or countries in Sub-Saharan Africa (SSA), including Lesotho, Ethiopia (note: lost AGOA eligibility in 2022), Kenya, Madagascar, Mauritius, Tanzania, and Ghana, an increase from four countries in 2023, and six countries in 2022. Most respondents sourcing from AGOA in 2024 are typically large-scale U.S. fashion brands or retailers with 1,000+ employees. Generally, these companies treat AGOA as part of their extensive global sourcing network.
  • Over 86 percent of respondents support renewing AGOA for at least another ten years, and none object to the proposal. This reveals U.S. fashion companies’ strong support for the trade preference program and the non-controversial nature of continuing this agreement.
  • Over 70 percent of respondents say another 10-year renewal of AGOA is essential for their company to expand sourcing from the region.
  • About 30 percent of respondents reported that they had already held back sourcing from AGOA members due to the pending renewal of the agreement and associated policy uncertainty. This figure could increase to half of the respondents if AGOA is not renewed by the end of 2024.
  • Another 30 percent of respondents indicate that keeping the flexible rules of origin in AGOA, such as the “third country fabric provision” for least-developed members, is essential for their company to source from the region.

Other topics the report covered include:

  • 5-year outlook for the U.S. fashion industry, including companies’ hiring plan by key positions
  • The competitiveness of major apparel sourcing destinations in 2024 regarding sourcing cost, speed to market, flexibility & agility, minimum order quantity (MOQ), vertical integration and local textile manufacturing capability, social and environmental compliance risks and geopolitical risks (assessed by respondents)
  • Respondents’ detailed sourcing portfolio in 2024 for garments and textile materials (i.e., yarns, fabrics and accessories)
  • Respondents’ latest strategies to mitigate forced labor risks in the supply chain and fashion companies’ suggestions for CBP’s UFLPA enforcement based on field experience
  • U.S. fashion companies’ latest social responsibility and sustainability practices related to sourcing
  • U.S. fashion companies’ trade policy priorities in 2024

About the study

This year’s benchmarking study was based on a survey of executives from 30 leading U.S. fashion companies from April to June 2024. The study incorporated a balanced mix of respondents representing various businesses in the U.S. fashion industry. Approximately 80 percent of respondents were self-identified retailers, 60 percent were self-identified brands, 41 percent were importers/wholesalers, and 3 percent were manufacturers.

The survey respondents included large U.S. fashion corporations and medium-sized companies. Around 80 percent of respondents reported having over 1,000 employees; the rest (20 percent) represented medium-sized companies with 100-999 employees.

Current Event Discussion: U.S. Customs and Border Protection (CBP) and Textile Enforcement

#1: On April 5, 2024, the US Department of Homeland Security (DHS) released its new enhanced strategy to combat illicit trade and level the playing field for the American textile industry and the estimated over 500,000 US textile jobs*. *note: according to the Bureau of Labor Statistics, as of December 2023, the US textile and apparel manufacturing sector employed about 272,400 workers (seasonally adjusted), including 89.3K in NACIS313 textile mills, 95.6K in NAICS314 textile product mills and 87.5K in NAICS315 apparel manufacturing. As of December 2023, NAICS 4482 apparel retail stores employed about 850,000 workers (seasonally adjusted).

According to DHS, the new enforcement plan will focus on the following areas:

  • Cracking down on small package shipments to prohibit illicit goods from U.S. markets by improving screening of packages claiming the Section 321 de minimis exemption for textile, Uyghur Forced Labor Prevention Act (UFLPA), and other violations, including expanded targeting, laboratory and isotopic testing, and focused enforcement operations.
  • Conducting joint Customs and Border Protection (CBP)-Homeland Security Investigation (HIS) HSI trade special operations to ensure cargo compliance. This includes physical inspections; country-of-origin, isotopic, and composition testing; and in-depth reviews of documentation. CBP will issue civil penalties for violations of U.S. laws and coordinate with HSI to develop and conduct criminal investigations when warranted.
  • Better assessing risk by expanding customs audits and increasing foreign verifications. DHS personnel will conduct comprehensive audits and textile production verification team visits to high-risk foreign facilities to ensure that textiles qualify under the U.S.-Mexico-Canada Agreement (USMCA) or the Central America-Dominican Republic Free Trade Agreement (CAFTA-DR). (note: As CBP noted, most US free trade agreements and trade preference programs have complex textiles and apparel-specific rules of origin requirements. CBP is “responsible for ensuring that the trade community complies with all statutory, regulatory, policy, and procedural requirements that pertain to importations under free trade agreements and other trade preference programs.”)
  • Building stakeholder awareness by engaging in an education campaign to ensure that importers and suppliers in the CAFTA-DR and USMCA region understand compliance requirements and are aware of CBP’s enforcement efforts.
  • Leveraging U.S. and Central American industry partnerships to improve facilitation for legitimate trade. (note: The Biden Administration aims to leverage textile and apparel trade as part of the solution to address “root causes of migration in Central America. According to the White House Fact Sheet released in March 2024, the Office of the U.S. Trade Representative and Central American Trade Agencies and textiles and apparel industry stakeholders will work together to build a directory with detailed profiles of manufacturing and sourcing companies in the region, including information on business practices and production capabilities, to facilitate transparent sourcing, and bolster the region’s supply chain.)
  • Expanding the Uyghur Forced Labor Prevention Act (UFLPA) Entity List to identify malign suppliers for the trade community through review of additional entities in the high-priority textile sector for inclusion in the UFLPA Entity List. (note: Once an entity is on this list, in general, it is prohibited from exporting its goods to the United States. Importers are required to ensure the supply chains of their imported products are free from entities on the Entity List).

#2: Several US textile and apparel industry stakeholders have publicly responded to DHS’s new strategy.:

 The National Council of Textile Organizations (NCTO), representing the US textile manufacturing sector, made several points in its statement:

We strongly commend DHS for the release of a robust textile and apparel enforcement plan today. We also greatly appreciate Secretary Mayorkas’ personal engagement in this urgent effort and believe it’s a strong step forward to addressing pervasive customs fraud that is harming the U.S. textile industry.”

“The essential and vital domestic textile supply chain has lost 14 plants in recent months. The industry is facing severe economic harm due to a combination of factors, exacerbated by customs fraud and predatory trade practices by China and other countries, which has resulted in these devastating layoffs and plant closures. DHS immediately understood the economic harms facing the industry and deployed the development of a critical action plan.”

The industry requests include

  • Ramped up textile and apparel enforcement with regard to Western Hemisphere trade partner countries, including onsite visits and other targeted verification measures to enforce rules of origin as well as to address any backdoor Uyghur Forced Labor Prevention Act (UFLPA) violations.
  • Increased UFLPA enforcement to prevent textile and apparel goods made with forced labor from entering our market, including in the de minimis environment.
  • Immediate expansion of the UFLPA Entity List, isotopic testing, and other targeting tools. Intensified scrutiny of Section 321 de minimis imports and a review of all existing Executive Branch authorities under current law to institute basic reforms to this outdated tariff waiver mechanism. “

Joint Association Statement on New DHS Textile Trade Enforcement from the American Apparel & Footwear Association, the National Retail Federation, the Retail Industry Leaders Association, and the United States Fashion Industry Association:

We appreciate the Department of Homeland Security (DHS)’s announcement today outlining enhanced enforcement activities to prevent illicit trade in textiles. Our members support 55 million (more than one in four) American jobs and invest considerable time and resources in their customs compliance programs. Many of our members are Tier 3 participants in Customs-Trade Partnership Against Terrorism (C-TPAT). They are trusted traders and meet the high standards required to receive that designation by U.S. Customs and Border Protection and DHS. Our members are on the front lines for ensuring that they have safe and secure supply chains.

 “While DHS launches this enforcement plan, we urge it to partner with our associations and our associations’ members. A successful enforcement plan must include input from all stakeholders, clear communication with the trade, and coordinated activities with importers, especially if DHS finds illicit activity happening in the supply chain. The results of any illicit activities must be shared so that our members and other importers can act quickly to address the issue. As our members look to diversify their supply chains, especially back to the Western Hemisphere, we must make sure efforts are included to incentivize and not deter new investments.

#3 Comments: Overall, the new DHS textile enforcement plan suggests several key US textile and apparel trade policy directions: 1) revisit the current de minimis rules that are used by many e-commerce businesses; 2) further strengthen the UFLPA and forced labor enforcement; 3) expand the Western hemisphere textile and apparel supply chain and encourage more US apparel sourcing from CAFTA-DR members; 4) scrutinize US apparel imports from China and imports from other Asian countries that heavily use textile raw material from China.

Discussion questions for FASH455 (please answer them all):

  1. How do the perspectives of the US textile industry and US fashion brands and retailers diverge concerning CBP’s new strategy? What are the areas in which they share common ground?
  2. Building on the previous question, how can the difference between the US textile industry and US fashion brands and retailers be explained regarding their response to DHS’s new enforcement strategy?
  3. As a sourcing manager for a major US apparel brand with global operations, how do you plan to adjust your company’s sourcing practices in light of DHS’s new strategy? You can list 1-2 detailed action plans and provide your analysis.

Background

The U.S. Customs and Border Protection (CBP) is an agency within the Department of Homeland Security (DHS), responsible for “regulating and facilitating international trade, collecting import duties, enforcing U.S. trade laws, and protecting the nation’s borders.”  

Homeland Security Investigations (HSI) is also a division within the Department of Homeland Security (DHS), responsible for “investigating transnational crime and threats, specifically those criminal organizations that exploit the global infrastructure through which international trade, travel and finance move.”

Patterns of US Apparel Imports in 2023 and Critical Sourcing Trends to Watch in 2024

The latest data from the Office of Textiles and Apparel (OTEXA) and the United States International Trade Commission (USITC) suggested several key patterns of US apparel imports in 2023.

First, affected by the macro economy, US apparel import volume in 2023 suffered the most significant decline since the pandemic. Specifically, US apparel imports decreased by 22% in quantity and value in 2023 compared to 2022, with none of the top ten suppliers experiencing positive growth.

Nevertheless, after several months of straight decline, US apparel imports finally bounced back in December 2023. Thanks to the holiday season and a gradual improvement of the US economy, seasonally adjusted US apparel imports in December 2023 were about 4.5% higher in quantity and 4.2% higher in value than the previous month. Highly consistent with trends, the US Consumer Confidence Index (CCI) increased from 67.2 in November to 76.4 in December (January 2019=100), suggesting US households turned more confident about their financial outlook and willing to spend. That being said, the latest January 2024 International Monetary Fund (IMF) forecasts still predicted the US GDP growth would slow down from 2.5% in 2023 to 2.1% in 2024. Thus, whether the US apparel import volume could continue to maintain growth after the holiday season remains a big question mark.

Second, while the pace of sourcing cost increases has slowed, the costs and financial pressure facing US fashion companies are far from over. Specifically, as of December 2023, the price index of US apparel imports stood at 106 (January 2019=100), almost no change from January 2023. However, two emerging trends are worth watching. One is the declining US apparel retail price index since August 2023, which means US fashion companies may have to sacrifice their profits to attract consumers to the store. The second trend is the surging shipping costs as a result of the recent Red Sea shipping crisis, which were not reflected in the December price data. According to J.P. Morgan, during the week of January 25, 2024, the container shipping rates from China to the US West Coast and East Coast saw a significant spike of around 140% and 120% from November 2023, respectively. Even worse, there is no sign that the Red Sea crisis will soon be solved. Therefore, 2024 could pose another year of financial challenges for many US fashion companies.

Third, diversification remained a pivotal trend in US fashion companies’ sourcing strategy in 2023. For example, the Herfindahl–Hirschman index (HHI), a commonly used measurement of market concentration, went down from 0.105 in 2022 to 0.101 in 2022, suggesting that US apparel imports came from even more diverse sources.

Notably, measured in value, only 71.6% of US apparel imports came from Asia in 2023, the lowest in five years. Highly consistent with the US Fashion Industry Association’s Benchmarking Survey results, OTEXA’s data reflected companies’ intention to diversify their sourcing away from Asia due to increasing geopolitical concerns, particularly the rising US-China strategic competition.

However, it should be noted that Asia’s reduced market share did not benefit “near-shoring” from the Western hemisphere much. For example, in 2023, approximately 14.6% of US apparel imports originated from USMCA and CAFTA-DR members, nearly the same as the 14.3% recorded in 2022. Instead, US apparel imports outside Asia and the Western Hemisphere jumped to 11.4% in 2023 from 9.8% a year ago. Some emerging EU and African suppliers, such as Turkey, Romania, Morocco, and Tunisia, performed relatively well in the US market in 2023, although their market shares remained small. We could highly expect the sourcing diversification strategy to continue in 2024 as many companies regard the strategy as the most effective to mitigate various market uncertainties and sourcing risks.

Fourth, US fashion companies continued reducing their China exposure as much as possible, but China will remain a key player in the game. On the one hand, about 20.0% of US apparel imports in value and 25.9% in quantity came from China in 2023, both hit a new low in the past decade. Recent studies also show that it became increasingly common for China to no longer be the largest source of apparel imports for many US fashion companies.

However, China remains highly competitive in terms of the variety of products it offers. For example, the export product diversification index, calculated based on trade data at the 6-digit HTS code level (Chapters 61 and 62), shows that few other countries can match China’s product variety. Likewise, product level data collected from industry sources indicates that China offered far more clothing styles (measured in Stock Keeping Units, SKUs) than its competitors in 2023. According to the results, rather than identifying 1-2 specific “next China,” US fashion companies appeared to leverage “category killers”—for example, utilizing Vietnam as a sourcing base for outerwear, underwear, and swimwear; India for dresses, and Bangladesh for large-volume basic knitwear items.

Related to this, another recent study found that the top five largest Asian suppliers next to China, including Vietnam, Bangladesh, Indonesia, India, and Cambodia, collectively can offer diverse product categories almost comparable to those from China in the US market.

Fifth, trade data reveals early signs that US fashion companies are gradually reducing sourcing cotton apparel products from Asia because of the implementation of the Uyghur Forced Labor Prevention Act (UFLPA). Notably, when concerns about cotton made by Xinjiang forced labor initially emerged in 2018, US fashion companies quickly shifted sourcing orders for cotton apparel (OTEXA code 31) from China to other Asian countries. However, UFLPA’s enforcement increasingly targets imports from Asian countries other than China due to the highly integrated regional textile and apparel supply chain and Asian countries’ heavy reliance on textile inputs from China. Consequently, Asia (excluding China) accounted for a declining share in the total imports of US cotton apparel in 2023.

Meanwhile, affected by UFLPA’s enforcement, only 11.8% of US cotton apparel imports came from China in 2023, marking a further decline from 13% in 2022 and reaching a new low for the past decade. China also deliberately decreased the percentage of cotton apparel in its total apparel exports to the US market, dropping from nearly 40% in 2017 to only 25% in 2023. In comparison, cotton apparel consistently represented about 45% of total US apparel imports during the same period.

Additionally, while there was no substantial increase in the volume of US apparel imports from CAFTA-DR members, as a silver lining, the utilization of the trade agreement improved. In 2023, about 19.2% of US apparel imports claimed duty-free benefits under US free trade agreements and trade preference programs, a notable increase from 17.7% in 2022. Most such imports came under CAFTA-DR (45.4%) and USMCA (19.7%).

Meanwhile, in the first 12 months of 2023 (latest OTEXA data), about 70.2% of US apparel imports came from CAFTA-DR members claimed the duty-free benefit, up from 66.6% the same period a year ago. Particularly, 65.4% of US apparel imports under CAFTA-DR complied with the yarn-forward rules of origin in 2023, a notable increase from 61.3% in 2022. Another 2.6% of imports utilized the agreement’s short supply mechanism, which also went up from 2.3% in 2022. The results could reflect an ever more integrated regional textile and apparel supply chain among CAFTA-DR members due to increasing investments made in the region in recent years. However, there is still much that needs to be done to effectively increase the volume of US apparel imports from the region.

by Sheng Lu

Exploring the Production and Export Strategies of U.S. Textiles and Apparel Manufacturers

The full study is available HERE.

Textiles and apparel “Made in the USA” have gained growing attention in recent years amid the increasing supply chain disruptions during the pandemic, the rising geopolitical tensions worldwide, and consumers’ increasing interest in sustainable apparel and faster speed to market. Statistics from the U.S. Bureau of Economic Analysis showed that U.S. textile and apparel production totaled nearly $28 billion in 2022, a record high in the most recent five years. Meanwhile, unlike in the old days, a growing proportion of textiles and apparel “Made in the USA” are sold overseas today. For example, according to the Office of Textiles and Apparel (OTEXA) under the U.S. Department of Commerce, U.S. textiles and apparel exports exceeded $24.8 billion in 2022, up nearly 12% from ten years ago.

By leveraging U.S. Department of Commerce Office of Textiles and Apparel (OTEXA)’s “Made in U.S.A. Sourcing & Products Directory,” this study explored U.S. textiles and apparel manufacturers’ detailed production and export practices. Altogether, 432 manufacturers included in the directory as of October 1, 2023, were analyzed. These manufacturers explicitly mentioned making one of the following products: fiber, yarn, fabric, garment, home textiles, and technical textiles.

Key findings:

First, U.S. textile manufacturers exhibit a notable geographic concentration, whereas apparel manufacturers are dispersed throughout the country. Meanwhile, by the number of textile and apparel manufacturers, California and North Carolina are the only two states that rank in the top five across all product categories, showcasing the most comprehensive textile and apparel supply chain there.

Second, U.S. textile and apparel manufacturers have a high concentration of small and medium-sized enterprises (SMEs). Highly consistent with the macro statistics, few textile and apparel manufacturers in the OTEXA database reported having more than 500 employees. Particularly, over 74% of apparel and nearly 60% of home textile manufacturers are “micro-factories” with less than 50 employees.

Third, U.S. textile and apparel manufacturers have limited vertical manufacturing capability. A vertically integrated manufacturer generally makes products covering various production stages, from raw materials to finished products. Results show that only one-third of U.S. textile and apparel manufacturers in OTEXA’s database reported making more than one product type (e.g., yarn or fabric). Meanwhile, specific types of vertically integrated production models are relatively popular among U.S. textile and apparel manufacturers, such as:

  • Apparel + home textiles (5.8%)
  • Fabric + technical textiles (5.1%)
  • Yarn + fabric (3.9%)

However, the lack of fabric mills (N=38 out of 432) appears to be a critical bottleneck preventing the building of a more vertically integrated U.S. textile and apparel supply chain.

Fourth, it is not uncommon for U.S. textile and apparel manufacturers to use imported components. Specifically, among the manufacturers in the OTEXA database, nearly 20% of apparel and fabric mills explicitly say they utilized imported components. In comparison, given the product nature, fiber and yarn manufacturers had a lower percentage using imported components (11%). Furthermore, smaller U.S. textile and apparel manufacturers appear to be more likely to use imported components. For example, whereas 20% of manufacturers with less than 50 employees used imported input, only 10.2% of those with 50-499 employees and 7.7% with 500 or more employees did so. The results indicate the necessity of supporting SME U.S. textile and apparel manufacturers to access textile input through mechanisms such as the Miscellaneous Tariff Bill (MTB).

Fifth, many US textile and apparel manufacturers have already explored overseas markets. Specifically, factories making textile products reported a higher percentage of engagement in exports, including fiber and yarn manufacturers (68.4%), fabric mills (78.9%), and technical textiles producers (69.1%). In comparison, relatively fewer U.S. apparel and home textile producers reported selling overseas.

Sixth, U.S. textile and apparel manufacturers’ export markets are relatively concentrated. Specifically, as many as 72% of apparel mills and 57% of home textiles manufacturers in the OTEXA database reported selling their products in less than two markets. These manufacturers also have a high percentage of selling to the U.S. domestic market. Likewise, because of the reliance on the Western Hemisphere supply chain, more than half of U.S. fiber and yarn manufacturers reported only selling in two markets or less. In comparison, reflecting the global demand for their products, U.S. technical textile manufacturers had the most diverse markets, with nearly 40% exporting to more than ten countries.

Seventh, while the Western Hemisphere remains the top export market, many U.S. textile and apparel manufacturers also export to Asia, Europe, and the rest of the world. For example, nearly half of U.S. textile and apparel manufacturers in OTEXA’s database reported exporting to Asia, and over 60% of U.S. technical textile manufacturers sold their products to European customers.

Additionally, over half of U.S. textile and apparel mills engaged in exports leveraged U.S. free trade agreements (FTAs). U.S. textile mills, on average, reported a higher percentage of using FTAs than apparel and home textile manufacturers. As most U.S.-led FTAs adopt the yarn-forward rules of origin, the results suggest that while such a rule may favor the export of U.S. textile products, its effectiveness and relevance in supporting U.S. apparel exports could be revisited.

Moreover, in line with the macro trade statistics, U.S. textile and apparel manufacturers in the OTEXA database reported a relatively high usage of USMCA, given Mexico and Canada being the two most important export markets. In comparison, U.S. textile and apparel manufacturers’ use of CAFTA-DR was notably lower, even for fiber and yarn manufacturers (37%) and fabric mills (33.3%).

by Kendall Ludwig, Miranda Rack and Sheng Lu

Picture above: On December 13, 2023, Kendall Ludwig and Miranda Rack, FASH 4+1 graduate students and Dr. Sheng Lu, had the unique opportunity to present the study’s findings to senior U.S. trade officials from OTEXA and the Office of the U.S. Trade Representative (USTR) in Washington DC, including Jennifer Knight (Deputy Assistant Secretary for Textiles, Consumer Goods and Materials), Laurie-Ann Agama (Acting Assistant US Trade Representative for Textiles), Maria D’Andrea-Yothers (Director of OTEXA), Natalie Hanson (Deputy Assistant US Trade Representative for Textiles) and Richard Stetson (Deputy Director of OTEXA).

Check the Udaily article that features the research project and the presentation (February 2024).

FASH455 Exclusive Interview with Beth Hughes, Vice President of the American Apparel and Footwear Association (AAFA), about US apparel sourcing from Central America

About Beth Hughes

Beth Hughes serves as the Vice President of the American Apparel and Footwear Association (AAFA), responsible for supporting the association’s efforts on international trade and customs issues. Beth oversees AAFA’s Trade Policy Committee, as well as AAFA’s Customs Group. Beth is also the spokesperson of the Coalition for Economic Partnership in the Americas (CEPA), a group of prominent American companies, and manufacturers committed to advancing regional trade and employment opportunities in the Western Hemisphere.

Before joining AAFA, Beth served for six years as senior director of international affairs at the International Dairy Foods Association. Beth earned a Bachelor of Arts degree in political science at George Washington University and received a Master of Arts in international affairs from Florida State University.

The interview was conducted by Leah Marsh, a graduate student in the Department of Fashion and Apparel Studies at the University of Delaware. Leah’s research focused on​​ exploring EU retailers’ sourcing strategies for clothing made from recycled textile materials and fashion companies’ supply chain and sourcing strategies.

The interview is part of the 2023 Cotton in the Curriculum program, supported by Cotton Incorporated, to develop open educational resources (OER) for global apparel sourcing classes.

Patterns of US Apparel Imports (Updated September 2023)

First, while US apparel imports gradually recovered, the import demand remained weak overall. For example, US apparel imports in July 2023 increased by 0.9% in value and 2% in quantity from June (seasonally adjusted). However, the trade volume still experienced a decrease of approximately 17-18% compared to the previous year. Meanwhile, the US consumer confidence index fell again in August 2023, suggesting the economic uncertainties are far from over. Notably, so far in 2023 (January to July), US apparel imports decreased by 22.3% in value and 28% in quantity from the previous year, the worst performance since the pandemic.

As a silver lining, the price of US apparel imports has stabilized, although inflation remains an issue for the US economy.  

Secondly, because of the seasonal pattern, Asian countries were able to capture relatively higher market shares since June. For example, measured in value, China, ASEAN, and Bangladesh accounted for over 64% of total US apparel imports in July 2023, a notable increase from 61% in June and 58% in May 2023.

Nevertheless, US fashion companies continue diversifying their sourcing base to mitigate various supply chain risks and rising geopolitical tensions. For example, the HHI Index for US apparel imports dropped to 0.097 in the first seven months of 2023, which is lower than the 0.106 recorded in the same period the previous year (January to July 2022), indicating a greater diversity in the sources of imports.

Third, despite an apparent rebound in exports to the US, China continued to experience a further decline in its market share. For instance, in July 2023, China’s market share was more than 3 percentage points lower in value (27.2% in July 2022 vs. 24.1% in July 2023) and 2.5 percentage points lower in quantity (43.1% in July 2022 vs. 40.6% in July 2023). This marked the worst performance since April 2023. In other words, consistent with recent industry surveys, US fashion companies continue to reduce their China exposure given the adverse business environment.

Fourth, the latest data suggests that US apparel imports from CAFTA-DR members remain stagnant, and some critical problems, such as the underutilization of the agreement, even worsened. For example, about 9.5% of US apparel imports in value and 8.5% in quantity came from CAFTA-DR members in July 2023, lower than 10.2% and 9.0% in the previous year (i.e., July 2022). In absolute terms, US apparel imports from CAFTA-DR in 2023 were about 20% lower than in 2022.

Additionally, CAFTA-DR’s utilization rate (i.e., the value of imports claiming the duty-free benefits under CAFTA-DR divided by the total value of imports from CAFTA-DR) fell from 70.2% in 2022 (Jan to July) to a new low of 69.2% in 2023 (Jan to July). Likewise, the value of imports utilizing CAFTA-DR’s short supply decreased by more than 20%. Thus, how to leverage CAFTA-DR to meaningfully encourage more US apparel imports from the region, particularly in light of US fashion companies’ eagerness to reduce their exposure to China, calls for sustained efforts and probably new strategies.

by Sheng Lu

2023 USFIA Fashion Industry Benchmarking Study Released

The full report is available HERE

USFIA webinar (Aug 2023)

Key findings of this year’s report:

#1 U.S. fashion companies are deeply concerned about the deteriorating U.S.-China bilateral relationship and plan to accelerate “reducing China exposure” to mitigate the risks.

  • Respondents identified “Finding a new sourcing base other than China” as a more prominent challenge in 2023 than the previous year (i.e., 4th in 2023 vs. 11th in 2022).
  • This year, over 40 percent of respondents reported sourcing less than 10 percent of their apparel products from China, up from 30 percent of respondents a year ago and a notable surge from only 20 percent in 2019. Similarly, a new record high of 61 percent of respondents no longer use China as their top supplier in 2023, up from 50 percent of respondents in 2022 and much higher than only 25-30 percent before the pandemic.
  • Nearly 80 percent of respondents plan to reduce apparel sourcing from China over the next two years, with a record high of 15 percent planning to “strongly decrease” sourcing from the country. This strong sentiment was not present in past studies. Notably, large-size U.S. fashion companies (with 1,000+ employees) that currently source more than 10 percent of their apparel products from China are among the most eager to de-risk.

#2 Tackling forced labor risks in the supply chain remains a significant challenge confronting U.S. fashion companies in 2023.

  • Managing the forced labor risks in the supply chain” ranks as the 2nd top business challenge in 2023, with 64 percent of respondents rating the issue as one of their top five concerns.
  • Most surveyed U.S. fashion companies have taken a comprehensive approach to mitigating forced labor risks in the supply chain. Three practices, including “asking vendors to provide more detailed social compliance information,” attending workshops and other educational events to understand related regulations better,” and “intentionally reducing sourcing from high-risk countries,” are the most commonly adopted by respondents (over 80 percent) in response to forced labor risks and the UFLPA’s implementation.
  • Since January 1, 2023, U.S. Customs and Border Protection (CBP)’s UFLPA enforcement has affected respondents’ importation of “Cotton apparel products from China,” “Cotton apparel products from Asian countries other than China,” and “Home textiles from China.”
  • U.S. fashion companies are actively seeking to diversify their sourcing beyond Asia to mitigate the forced labor risks, particularly regarding cotton products.

#3 There is robust excitement about increasing apparel sourcing from members of the Dominican Republic-Central America Free Trade Agreement (CAFTA-DR).

  • CAFTA-DR members play a more significant role as an apparel sourcing base this year. Over 80 percent of respondents report sourcing from CAFTA-DR members in 2023, a notable increase from 60 percent in the past few years. Also, nearly 30 percent of respondents placed more than 10 percent of their sourcing orders with CAFTA-DR members this year, a substantial increase from only 19 percent of respondents in 2022 and 10 percent in 2021.
  • About 40 percent of respondents plan to increase apparel sourcing from CAFTA-DR members over the next two years. Most respondents consider expanding sourcing from CAFTA-DR as part of their overall sourcing diversification strategy.
  • With U.S. fashion companies actively seeking immediate alternatives to sourcing from China and Asia, respondents emphasize theincreased urgencyof improving textile raw material access to promote further U.S. apparel sourcing from CAFTA-DR members. “Allowing more flexibility in sourcing fabrics and yarns from outside CAFTA-DR” was regarded as the top improvement needed.

#4 US fashion companies demonstrate a solid dedication to expanding their sourcing of clothing made from recycled or other sustainable textile fibers:

  • Nearly 60 percent of respondents say at least 10 percent of their sourced apparel products already use recycled or other sustainable textile fibers. Another 60 percent of surveyed companies plan to “substantially increase sourcing apparel made from sustainable or recycled textile materials over the next five years.”
  • Addressing the higher sourcing costs and the low-profit margins are regarded as the top challenge for sourcing clothing using recycled or other sustainable fiber.
  • About 60 percent of respondents also call for policy support for sourcing clothing using recycled or other sustainable textile materials, such as preferential tariff rates and guidance on sustainability and recycling standards.

#5 Respondents strongly support and emphasize the importance of the early renewal of the African Growth and Opportunity Act (AGOA) and extending the program for at least another ten years.

  • Respondents sourcing from AGOA members are typically large-scale U.S. fashion brands or retailers (with 1,000+ employees). Generally, these companies treat AGOA as part of their extensive global sourcing network and typically source less than 10 percent of the total sourcing value or volume from the region.
  • About 40 percent of respondents view AGOA as “essential for my company to source from AGOA members.
  • About 60 percent of respondents say the temporary nature of AGOA “has discouraged them from making long-term investments and sourcing commitments in the region.” Many respondents expect to cut sourcing from AGOA members should the agreement is not renewed by June 2024.
  • About one-third of respondents currently sourcing from AGOA explicitly indicate, “Ethiopia’s loss of AGOA eligibility negatively affects my company’s interest in sourcing from the entire AGOA region.” In comparison, only about 17 percent of respondents say they “have moved sourcing orders from Ethiopia to other AGOA members.

Other topics covered by the report include:

  • 5-year outlook for the U.S. fashion industry, including companies’ hiring plan by key positions
  • The competitiveness of major apparel sourcing destinations in 2023 regarding sourcing cost, speed to market, flexibility & agility, and compliance risks (assessed by respondents)
  • Respondents’ qualitative comments on the prospect of sourcing from China and “re-risk”
  • U.S. fashion companies’ latest social responsibility and sustainability practices related to sourcing
  • U.S. fashion companies’ trade policy priorities in 2023

Background

This year’s benchmarking study was based on a survey of executives from 30 leading U.S. fashion companies from April to June 2023. The study incorporated a balanced mix of respondents representing various businesses in the U.S. fashion industry. Approximately 73 percent of respondents were self-identified retailers, 60 percent self-identified brands, and 65 percent self-identified importers/wholesalers.

The respondents to the survey included both large U.S. fashion corporations and medium to small companies. Around 77 percent of respondents reported having more than 1,000 employees. And the rest (23 percent) represented medium to small-sized companies with 100-999 employees.

Patterns of US Apparel Imports (Updated June 2023)

Please also see the updated analysis: Patterns of US apparel imports in 2023 (Updated February 2024)

The latest OTEXA trade data suggests several US apparel import patterns:

First, US apparel imports indicated a slow improvement in April 2023 but remained weak this year. For example, measured in quantity, US apparel imports fell by 33.9% in April 2023 from a year ago, but it was less significant than in March (i.e., down 40.2% YoY*). Likewise, measured in value, US apparel imports fell by 29.3% YoY in April 2023, which improved from a 32.7% YoY decline in March 2023. (*YoY: Year-over-year)

Overall, the shrinking US apparel import volume reflected the headwinds in the US economy and consumers’ hesitancy to purchase clothing amid financial uncertainties and high inflation. Recent economic indicators also present a mixed picture of the US economy’s growth trajectory. For example, while the US consumer confidence index slightly went up from 68.0 in March to 69.6 in April 2023 (January 2019=100), the advanced clothing store sales index in April fell to 115.6 (Jan 2019=100), the lowest so far in 2023 (e.g., was 120.6 in January 2023). However, since summer is traditionally a peak season for clothing sales, followed by events like back-to-school shopping, there remains hope that US apparel imports may experience a slight recovery at some point in the second half of the year.

Second, trade data suggested that US apparel imports came from more diverse sources. For example, the Herfindahl–Hirschman index (HHI) fell below 0.1 in the first four months of 2023. Likewise, the market shares of the five largest suppliers (CS5) fell below 60% for the first time since 2018. The result suggested that leveraging sourcing diversification is a prevalent strategy among US fashion companies to mitigate supply chain risks and address market uncertainties.

Third, US fashion companies are serious and eager to further reduce their “China exposure.” Although China remained the top apparel supplier to the US, its market share fell to a new low of 17.9% in value and 30.6% in quantity in the first four months of 2023. Notably, for the first time in decades, less than 10% of US cotton apparel imports came from China in March/April 2023, revealing the significant impact of the Uyghur Forced Labor Prevention Act (UFLPA) on US fashion companies’ China sourcing strategies.

Related, US fashion companies appear to be increasingly cautious about sourcing apparel from Vietnam as its supply chain is too exposed to China, raising concerns about forced labor risks. In value, Vietnam accounted for 17.3% of US apparel imports in the first four months of 2023, down from 18.6% a year ago. Notably, almost the same amount of Vietnam’s textile and apparel products were subject to the CBP’s UFLPA investigation as China in FY2023.

CBP UFLPA enforcement statistics—FY2023—Apparel, Footwear and Textiles—All investigated (denied+ pending+released) see https://www.cbp.gov/newsroom/stats/trade/uyghur-forced-labor-prevention-act-statistics

Fourth, large-scale Asian countries benefited the most as US fashion companies looking for China’s alternatives. Specifically, measured in value, about 70.6% of US apparel imports came from Asia in the first four months of 2023, down from 74.9% in 2022. However, the five largest apparel exporting countries in Asia other than China (i.e., Vietnam, Bangladesh, Indonesia, India, and Cambodia) accounted for 44.7% of US apparel imports in the first four months of 2023, a new high since 2018 (i.e., was 35.3%). These countries are among the most popular “alternatives to China” because of their balanced performance regarding production capacity, cost, flexibility, and compliance risks.

Fifth, US fashion companies are also actively exploring new near-shoring opportunities from the Western Hemisphere. For example, about 17.3% of US apparel imports came from Western Hemisphere countries in the first four months of 2023, up from 15.6% in 2023. That being said, measured in quantity, US apparel imports from Mexico and CAFTA-DR members fell by 13.0% and 21.2% in the first four months of 2023 from a year ago due to the struggling US economy. It will be interesting to see whether CAFTA-DR and Mexico can keep or enhance their market shares when the US import demand recovers.

By Sheng Lu

New Study: Impact of Textile Raw Material Access on CAFTA-DR Members’ Apparel Exports to the United States

The full paper is HERE. Below are the key findings:

Over the past decade, U.S. fashion brands and retailers have seen Central America as a critical emerging apparel-sourcing destination. Especially since implementing the Dominican-Republic Central America Free Trade Agreement (CAFTA-DR) in 2006, a trade deal among the United States, El Salvador, Guatemala, Honduras, Nicaragua, the Dominican Republic (joined in 2007), and Costa Rica (joined in 2009), apparel sourcing from the region gained consistent interest among U.S. companies.

Nevertheless, U.S. apparel sourcing from CAFTA-DR members is NOT without significant challenges. For example, CAFTA-DR countries’ market shares in the U.S. apparel import market fell from 11.8% in 2005 before the trade agreement entered into force to only 10.6% in 2022, measured by value. Trade data also indicated that U.S. apparel sourcing from CAFTA-DR members concentrated on simple and low-value items, such as T-shirts, and lacked product diversification with no improvement over the years.

Given the high stakes of improving the status quo, this study quantitatively evaluated the impact of textile raw material access on CAFTA-DR’s apparel exports to the United States. Specifically, this study assumed that CAFTA-DR members cut their textile import tariff rates to improve garment producers’ textile raw material access (i.e., to reduce the cost of sourcing textiles from anywhere in the world and beyond the U.S. supply). The computable general equilibrium (CGE) model estimation based on the GTAP9 database shows mixed results:

On the one hand, cutting CAFTA-DR members’ textile import tariffs to improve their garment producers’ textile raw material access would significantly improve CAFTA-DR members’ price competitiveness of their apparel exports to the United States and increase the export volume.

However, cutting CAFTA-DR members’ textile import tariffs to improve their garment producers’ textile raw material access would significantly expand their textile imports from non-U.S. sources. This means that CAFTA-DR members’ dependence on the U.S. textile raw material supply may decline further.

Overall, the study’s findings remind us that the debate on expanding U.S. apparel sourcing from CAFTA-DR members should go beyond CAFTA-DR members’ garment production. Instead, more efforts could be made to enhance CAFTA-DR garment producers’ textile raw material access as an effective way to expand the region’s apparel exports to the United States.

Meanwhile, several leading CAFTA-DR apparel exporting countries, including Honduras and Nicaragua, have been engaged in negotiations for free trade agreements with China, Taiwan, and other Asian economies. As the study’s findings indicate, these new trade deals could incentivize CAFTA-DR apparel manufacturers to increase their textile sourcing from Asia. In other words, inaction on the U.S. side and maintaining the status quo still could have significant implications for the future stability of the Western Hemisphere textile and apparel supply chain.

by Sheng Lu

US Apparel Import and Sourcing Trends: Asia vs. Near-shoring from the Western Hemisphere (Updated February 2023)

Trend 1: US fashion companies continue to diversify their sourcing base in 2022

Numerous studies suggest that US fashion companies leverage sourcing diversification and sourcing from countries with large-scale production capacity in response to the shifting business environment. For example, according to the 2022 fashion industry benchmarking study from the US Fashion Industry Association (USFIA), more than half of surveyed US fashion brands and retailers (53%) reported sourcing apparel from over ten countries in 2022, compared with only 37% in 2021. Nearly 40% of respondents plan to source from even more countries and work with more suppliers over the next two years, up from only 17% in 2021.

Trade data confirms the trend. For example, the Herfindahl–Hirschman index (HHI), a commonly-used measurement of market concentration, went down from 0.110 in 2021 to 0.105 in 2022, suggesting that US apparel imports came from even more diverse sources.

Trend 2: Asia as a whole will remain the dominant source of imports

Measured in value, about 73.5% of US apparel imports came from Asia in 2022, up from 72.8% in 2021. Likewise, the CR5 index, measuring the total market shares of the top five suppliers—all Asia-based, i.e., China, Vietnam, Bangladesh, Indonesia, and India, went up from 60.6% in 2021 to 61.1% in 2022. Notably, the CR5 index without China (i.e., the total market shares of Vietnam, Bangladesh, Indonesia, India, and Cambodia) enjoyed even faster growth, from 40.7% in 2021 to 43.7% in 2022.

Additionally, facing growing market uncertainties and weakened consumer demand amid high inflation pressure, US fashion companies may continue to prioritize costs and flexibility in their vendor selection. Studies consistently show that Asia countries still enjoy notable advantages in both areas thanks to their highly integrated regional supply chain, production scale, and efficiency. Thus, US fashion companies are unlikely to reduce their exposure to Asia in the short to medium term despite some worries about the rising geopolitical risks.

Trend 3: US fashion companies’ China sourcing strategy continues to evolve

Several factors affected US apparel sourcing from China negatively in 2022:

  • One was China’s stringent zero-COVID policy, which led to severe supply chain disruptions, particularly during the fall. As a result, China’s market shares from September to November 2022 declined by 7-9 percentage points compared to the previous year over the same period.
  • The second factor was the implementation of the Uyghur Forced Labor Prevention Act (UFLPA) in June 2022, which discouraged US fashion companies from sourcing cotton products from China. For example, only about 10% of US cotton apparel came from China in the fourth quarter of 2022, down from 17% at the beginning of the year and much lower than nearly 27% back in 2018.
  • The third contributing factor was the US-China trade tensions, including the continuation of Section 301 punitive tariffs. Industry sources indicate that US fashion companies increasingly source from China for relatively higher-value-added items targeting the premium or luxury market segments to offset the additional sourcing costs.

Further, three trends are worth watching regarding China’s future as an apparel sourcing base for US fashion companies:

  • One is the emergence of the “Made in China for China” strategy, particularly for those companies that view China as a lucrative sales market. Recent studies show that many US fashion companies aim to tailor their product offerings further to meet Chinese consumers’ needs and preferences.
  • Second is Chinese textile and apparel companies’ growing efforts to invest and build factories overseas. As a result, more and more clothing labeled “Made in Bangladesh” and “Made in Vietnam” could be produced by factories owned by Chinese investors.
  • Third, China could accelerate its transition from exporting apparel to providing more textile raw materials to other apparel-exporting countries in Asia. Notably, over the past decade, most Asian apparel-exporting countries have become increasingly dependent on China’s textile raw material supply, from yarns and fabrics to various accessories. Moreover, recent regional trade agreements, particularly the Regional Comprehensive Economic Partnership (RCEP), provide new opportunities for supply chain integration in Asia.

Trend 4: US fashion companies demonstrate a new interest in expanding sourcing from the Western Hemisphere, but key bottlenecks need to be solved

Trade data suggests a mixed picture of near-shoring in 2022. For example, members of the Dominican Republic-Central America Free Trade Agreement (CAFTA-DR) and US-Mexico-Canada Trade Agreement (USMCA) accounted for a declining share of US apparel imports in 2022, measured in quantity and value. While CAFTA-DR and USMCA members showed an increase in their market share of US apparel imports in the fourth quarter of 2022, reaching 10.7% and 3.1%, respectively, this growth was not accompanied by an increase in trade volume. Instead, US apparel imports from these countries decreased by 11% and 15%, respectively, compared to the previous year. CAFTA-DR and USMCA members’ gain in market share was mainly due to a sharper decline in US apparel imports from the rest of the world (i.e., decreased by over 25% in the fourth quarter of 2022).

Trade data also suggests two other bottlenecks preventing more US apparel sourcing from CAFTA-DR and USMCA members. One is the lack of product diversity. For example, the product diversification index consistently shows that US apparel imports from CAFTA-DR members and Mexico concentrated on only a limited category of products, and the problem worsened in 2022. The result explained why US fashion companies often couldn’t move souring orders from Asia to CAFTA-DR and USMCA members.

Another problem is the underutilization of the trade agreement. For example, CAFTA-DR’s utilization rate for US apparel imports consistently went down from its peak of 87% in 2011 to only 74% in 2021. The utilization rate fell to 66.6% in 2022, the lowest since CAFTA-DR fully came into force in 2007. This means that as much as one-third of US apparel imports from CAFTA-DR did NOT claim the agreement’s preferential duty benefits. Thus, regarding how to practically grow US fashion companies’ near-shoring, we could expect more public discussions and debates in the new year.

by Sheng Lu

Further reading: Lu, Sheng (2023). Key trends to watch as US apparel imports hit record high in 2022 but slow in 2023. Just-Style.

Patterns of US Apparel Imports in the First Half of 2022 and Key Sourcing Trends

First, US apparel imports enjoyed a decent growth but started to face softening demand.

  • Thanks to consumers’ spending, in the first half of 2022, US apparel imports went up 40% in value and 24% in quantity from a year ago.
  • However, due to US consumers’ weakening demand amid the economic downturn, the speed of import expansion is slowing down quickly. As an alert, the US consumer confidence index (CCI) fell to 54.8 in June 2022 (January 2019=100), the lowest since the pandemic. This result suggests that US consumers were increasingly worried about their household’s financial outlook and would hold back their discretionary clothing spending.
  • The month-over-month growth of US apparel imports dropped to only 2.6% in value and nearly zero in quantity in June 2022 from over 10% at the beginning of the year.
  • As the trajectory of the US economy remains highly uncertain in the medium term, we could expect many US fashion companies to turn more conservative about placing new sourcing orders in the second half of 2022 to control inventory and avoid overstock.

Second, fashion companies struggled with hiking apparel sourcing costs driven by multiple factors.

  • The price index of US apparel imports reached 103.9 in June 2022 (January 2019=100), a 3.1% increase from a year ago and the highest since 2019. USITC data further shows that, of the over 200 types of apparel items (HS Chapters 61 and 62) at the six-digit code level, nearly 70% had a price increase in the first half of 2022 from a year ago, including almost 40% experiencing a price increase exceeding 10 percent.
  • According to the 2022 Fashion Industry Benchmarking Study recently released by the US Fashion Industry Association (USFIA), 100 percent of respondents expect their sourcing costs to increase in 2022, including nearly 40 percent expecting a substantial cost increase from a year ago. Further, respondents say that almost everything has become more expensive this year, from textile raw materials, shipping, and labor to the costs associated with compliance with trade regulations.
  • To make the situation even worse, the more expensive “cost of goods” resulted in heavier burdens of ad valorem import duties for US fashion companies. USITC data shows that in the first five months of 2022, US companies paid $6,117 million in tariffs for apparel imports (HS Chapters 61 and 62), a significant increase of 42.9% from a year ago. Of these import duties paid by US companies, about 30% (or $1,804 million) resulted from the controversial US Section 301 action against Chinese imports. Because of the Section 301 tariff action, the average applied US tariff rate for apparel imports also increased from 17.2% in 2018 to 18.7% in the first half of 2022.
  • Even though the US retail price index for clothing reached 102.7 in June 2022 (January 2019=100), the price increase was behind the import cost surge over the same period. In other words, given the intense market competition and weaker demand, US fashion companies couldn’t pass the sourcing cost increase to consumers entirely.

Third, US fashion companies continued to diversify their sourcing base in 2022, which benefited large-scale suppliers in Asia.

  • The Herfindahl–Hirschman index (HHI), a commonly-used measurement of market concentration, went down from 0.11 in 2021 to 0.10 in the first half of 2022, suggesting that US apparel imports came from even more diverse sources. Similarly, the CS3 index, measuring the total market shares of the top three suppliers (i.e., China, Vietnam, and Bangladesh), fell below 50% in the first half of 2022, the lowest since 2018.
  • The Asia region remains the dominant source of apparel for US fashion companies: about 74.4% of US apparel imports came from Asian countries in the first half of 2022 (by value), which has stayed stable for over a decade.
  • One critical factor behind the apparent “contradictory” phenomenon is US fashion companies’ intention to reduce their “China exposure” further. Notably, considering all primary sourcing factors, from cost, speed to market, production flexibility, agility, and compliance risks, relatively large-scale Asian suppliers are the most likely alternatives to “Made in China.” Thus, the CR5 index excluding China (i.e., the market shares of Vietnam, Bangladesh, Indonesia, India, and Cambodia) increased from 40.7% in 2021 to 45.5% in the first half of 2022.

Fourth, US fashion companies’ evolving China sourcing strategy is far more subtle and complicated than simply “moving out of China.”

  • US fashion companies doubled their efforts to reduce sourcing from China in 2022, particularly in response to the newly implemented Uyghur Forced Labor Prevention Act (UFLPA) and the growing geopolitical risks. For example, measured in value, only 13.2% of US cotton apparel imports (OTEXA code 31) came from China in the first half of 2022, which fell from 14.4% a year ago and much lower than nearly 30% back in 2017.
  • Industry sources indicate that US fashion companies are “upgrading” what they source from China, possibly to offset the Section 301 punitive tariffs. The structural change includes importing less basic apparel items (e.g., tops and bottoms) and more sophisticated and higher-valued categories (e.g., dresses). Also, US fashion companies increasingly source from China for apparel items sold in the high-end market. For example, measured by the number of Stock Keeping Units (SKU), about 94% of apparel labeled “Made in China” sold in the US retail market targeted the value segment in 2018. However, of those apparel “Made in China” newly launched to the US retail market between January and July 2022, less than 2% were in the value segment. Instead, items targeting the higher-priced premium and mass market segments surged from 5% to 64%. Another 33% of “Made in China” were luxury apparel items. In other words, US fashion companies no longer see China as a sourcing base for cheap low-end products. Their sourcing decisions regarding China would give more consideration to non-price factors.
  • Further, some US fashion companies still see China as a promising sales market with growth potential. Localizing the supply chain (i.e., made in China for China) could be an increasingly popular practice for these companies. Thus, fashion companies’ vision for China could increasingly differ between those that only import products from China and those that see China as an emerging sales market.

Fifth, US apparel imports from the free trade agreements and trade preference programs partners stayed relatively stable in 2022 but lacked growth.

  • Despite the growing enthusiasm among US fashion companies for expanding near sourcing from the Western Hemisphere, the trade volume stayed stagnant. For example, in the first half of 2022, members of the Dominican Republic-Central America Free Trade Agreement (CAFTA-DR) accounted for 8.8% of US apparel imports in quantity and 9.9% in value, lower than a year ago (i.e., 9.9% in quantity and 11.1% in value). Likewise, Mexico also reported lower market shares in the US apparel import market in 2022. The results remind us that encouraging more US apparel sourcing from free trade agreements and preference program partners should go beyond offering preferential duty treatment.
  • Product diversification is a critical area that needs improvement, particularly regarding Western Hemisphere sourcing. For example, results show that US apparel sourcing from CAFTA-DR and Mexico generally concentrated on basic items such as tops and bottoms. In comparison, Asian countries, such as China, Vietnam, and Bangladesh, could offer much more diverse categories of products. This explains why US fashion companies treat large-scale Asian countries as their preferred alternatives to “Made in China” rather than moving sourcing orders to CAFTA-DR or Mexico.
  • Even though the ultimate goal is to expand US apparel sourcing from the Western Hemisphere, we need to make more efforts to practically and creatively solve the bottleneck of textile raw material supply facing garment producers in the region.

by Sheng Lu

Suggested citation: Lu, S. (2022). Patterns of US Apparel Imports in the First Half of 2022 and Key Sourcing Trends. FASH455 global apparel and textile trade and sourcing. https://shenglufashion.com/2022/08/08/patterns-of-us-apparel-imports-in-the-first-half-of-2022-and-key-sourcing-trends/

New Study: Expand U.S. Apparel Sourcing from CAFTA-DR Members and Solve the Root Causes of Migration: Perspectives from U.S. Apparel Companies

The full study is available HERE.

Executive Summary:

This study offers valuable input and practical policy recommendations from U.S. apparel companies’ perspectives regarding expanding U.S. apparel sourcing from CAFTA-DR members. For the study, we consulted executives at 27 leading U.S.-based apparel companies (note: 85% report having annual revenues exceeding $500 million; over 95% have been sourcing apparel from the CAFTA-DR region for more than ten years).

The results confirm that expanding U.S. apparel sourcing from CAFTA-DR could be the best chance to effectively create more jobs in Central America and solve the root causes of migration there. To achieve this goal, we need to focus on four areas:

First, improve CAFTA-DR’s apparel production capacity and diversify its product offers.

  • As many as 92 percent of respondents report currently sourcing apparel from CAFTA-DR members.
  • Highly consistent with the macro trade statistics, the vast majority of respondents (i.e., 60 percent) place less than 10 percent of their company’s total sourcing orders with CAFTA-DR members.
  • Whereas respondents rate CAFTA-DR members overall competitive in terms of “speed to market,” they express concerns about CAFTA-DR countries’ limited production capacity in making various products. As a result, U.S. companies primarily source basic fashion items like T-shirts and sweaters from the region. These products also face growing price competition with many alternative sourcing destinations.
  • Improving CAFTA-DR’s production capacity and diversifying product offers would encourage U.S. apparel companies to move more sourcing orders from Asia to the region permanently.

Second, practically solve the bottleneck of limited textile raw material supply within CAFTA-DR and do NOT worsen the problem.

  • The limited textile raw material supply within CAFTA-DR is a primary contributing factor behind the region’s stagnated apparel export volume and a lack of product diversification.
  • Notably, respondents say for their apparel imports from CAFTA-DR members, only 42.9% of fabrics, 40.0% of sewing threads, and 23.8% of accessories (such as trims and labels) can be sourced from within the CAFTA-DR area (including the United States). CAFTA-DR’s textile raw material supply problem could worsen as the U.S. textile industry switches to making more technical textiles and less so for apparel-related fabrics and textile accessories.
  • Maintaining the status quo or simply calling for making the CAFTA-DR apparel supply chain more “vertical” will NOT automatically increase the sourcing volume. Instead, allowing CAFTA-DR garment producers to access needed textile raw materials at a competitive price will be essential to encourage more U.S. apparel sourcing from the region.

Third, encourage more utilization of CAFTA-DR for apparel sourcing.

  • CAFTA-DR plays a critical role in promoting U.S. apparel sourcing from the region. Nearly 90 percent of respondents say the duty-free benefits provided by CAFTA-DR encourage their apparel sourcing from the region.
  • The limited textile supply within CAFTA-DR, especially fabrics and textile accessories, often makes it impossible for U.S. companies to source apparel from the region while fully complying with the strict “yarn-forward” rules of origin. As a result, consistent with the official trade statistics, around 31 percent of respondents say they sometimes have to forgo the CAFTA-DR duty-free benefits when sourcing from the region.
  • Respondents say the exceptions to the “yarn-forward” rules of origin, including “short supply,” “cumulation,” and “cut and assemble” rules, provide necessary flexibilities supporting respondents’ apparel sourcing from CAFTA-DR members. Around one-third of respondents utilize at least one of these three exceptions when sourcing from CAFTA-DR members when the products are short of meeting the strict “yarn-forward” rules of origin. It is misleading to call these exceptions “loopholes.”

Fourth, leverage expanded apparel sourcing to incentivize more investments in the CAFTA-DR region’s production and infrastructure.

  • U.S. apparel companies are interested in investing in CAFTA-DR to strengthen the region’s sourcing and production capacity. Nearly half of respondents explicitly say they will make investments, including “building factories or expanding sourcing or manufacturing capacities” in the CAFTA-DR region through 2026.
  • CAFTA-DR will be better positioned to attract long-term investments in its textile and apparel industry with a sound and expanded apparel sourcing volume.

Additional resources:

USTR Webinar Series on CAFTA-DR Textiles and Apparel Provisions (2022)

In February and March of 2022, the Office of the United States Trade Representative (USTR) organized and hosted a series of four webinars on CAFTA-DR trade in textiles and apparel. The objective was to enhance stakeholder understanding of the textile and apparel provisions of CAFTA-DR and identify opportunities for increasing and diversifying two-way trade between the United States and CAFTA-DR partner countries.

Webinar 1: Trends and Opportunities in CAFTA-DR Textile and Apparel Trade

Webinar 2: Making Use of CAFTA-DR’s Rules of Origin for Apparel

Webinar 3: The CAFTA-DR Short Supply Mechanism: What It Is and How To Use It

Webinar 4: Understanding Customs Claims and Customs Verifications in CAFTA-DR

Note: According to the 2022 USFIA Fashion Industry Benchmarking Study, US fashion companies demonstrate new excitement about increasing apparel sourcing from members of the Dominican Republic-Central America Free Trade Agreement (CAFTA-DR). More than 60 percent of respondents plan to increase apparel sourcing from CAFTA-DR members as part of their sourcing diversification strategy.

Respondents also say the exceptions to the “yarn-forward” rules of origin, such as the “short supply” and “cumulation” mechanisms, provide essential flexibility that encourages more apparel sourcing from CAFTA-DR members.

However, U.S. apparel sourcing from CAFTA-DR has yet to achieve its full potential. For example, measured in value, only 10.2% of US apparel imports came from CAFTA-DR members in May 2022 (and 9.7% year to date), almost no change from 10.6% in 2021. Meanwhile, the CAFTA-DR utilization rate for apparel imports was stagnant at about 75%-80% since 2015, meaning 20-26 percent of U.S. apparel imports from CAFTA-DR members did NOT claim preferential duty benefits every year.

Other recent studies show that the limited textile raw material supply within CAFTA-DR is a significant bottleneck preventing more U.S. apparel sourcing from the region. CAFTA-DR’s textile raw material supply problem could become even worse as the U.S. textile industry switches to making more technical textiles and less so for apparel-related fabrics and textile accessories. Many surveyed US fashion brands and retailers say that providing more meaningful flexibility in rules of origin will encourage MORE apparel sourcing from CAFTA-DR.

2022 USFIA Fashion Industry Benchmarking Study Released

[The 2023 USFIA Benchmarking Study is now available]

Report release webinar (July 18, 2022)

The full report is available HERE

Key findings of this year’s report:

U.S. fashion companies report significant challenges coming from the macro-economy in 2022, particularly inflation and rising cost pressures. However, most respondents still feel optimistic about the next five years.

  • Respondents rated “increasing production or sourcing costs” and “inflation and outlook of the U.S. economy” as their 1st and 3rd top business challenges in 2022.
  • As a new record, 100 percent of respondents expect their sourcing costs to increase in 2022, including nearly 40 percent expecting a substantial cost increase from a year ago. Further, almost everything has become more expensive this year, from textile raw materials, shipping, and labor to the costs associated with compliance with trade regulations.
  • Over 90 percent of respondents expect their sourcing value or volume to grow in 2022, but more modest than last year.
  • Despite the short-term challenges, most respondents (77 percent) feel optimistic or somewhat optimistic about the next five years. Reflecting companies’ confidence in their businesses, nearly ALL respondents (97 percent) plan to increase hiring over the next five years.

U.S. fashion companies adopt a more diverse sourcing base in response to supply chain disruptions and the need to mitigate growing sourcing risks.

  • Asia remains the dominant sourcing base for U.S. fashion companies—eight of the top ten most utilized sourcing destinations are Asia-based, led by China, Vietnam, Bangladesh, and India.
  • More than half of respondents (53 percent) report sourcing apparel from over ten countries in 2022, compared with only 37 percent in 2021.
  • Reducing “China exposure” is one crucial driver of U.S. fashion companies’ sourcing diversification strategy. One-third of respondents report sourcing less than 10% of their apparel products from China this year. In addition, a new record of 50 percent of respondents sources MORE from Vietnam than China in 2022.
  • Nearly 40 percent of respondents plan to “source from more countries and work with more suppliers” over the next two years, up from only 17 percent last year.

Managing the risk of forced labor in the supply chain is a top priority for U.S. fashion companies in 2022, especially with the new implementation of the Uyghur Forced Labor Prevention Act (UFLPA).

  • Over 95 percent of respondents expect UFLPA’s implementation to affect their company’s sourcing. Notably, more than 85 percent of respondents plan to cut their cotton-apparel imports from China, and another 45 percent to further reduce non-cotton apparel imports from the country.
  • Most respondents (over 92 percent) do NOT plan to reduce apparel sourcing from Asian countries other than China. However, nearly 60 percent of respondents also would “explore new sourcing destinations outside Asia” in response to UFLPA.
  • Mapping and understanding the supply chain is a critical strategy adopted by U.S. fashion companies to address the forced labor risks in the supply chain. Almost all respondents currently track Tier 1 and 2 suppliers. With the help of new traceability technologies, 53 percent of respondents have started tracking Tier 3 suppliers this year (i.e., those manufacturing yarn, threads, and trimmings), a substantial increase from 25-36 percent in the past.

There is considerable new excitement about increasing apparel sourcing from members of the Dominican Republic-Central America Free Trade Agreement (CAFTA-DR). Respondents also call for more textile raw sourcing flexibility to encourage apparel sourcing from the CAFTA-DR region.

  • CAFTA-DR plays a more significant role as a sourcing base. About 20 percent of respondents place more than 10% of their sourcing orders from the region, doubling from 2021. 
  • Over the next two years, more than 60 percent of respondents plan to increase apparel sourcing from CAFTA-DR members as part of their sourcing diversification strategy.
  • CAFTA-DR is critical in promoting U.S. apparel sourcing from the region. Around 80 percent of respondents took advantage of the agreement’s duty-free benefits when sourcing apparel from the region this year, up from 50—60 percent in the past.
  • Respondents say the exceptions to the “yarn-forward” rules of origin, such as the “short supply” and “cumulation” mechanisms, provide essential flexibility that encourages more apparel sourcing from CAFTA-DR members.
  • Respondents say improving textile raw material supply is critical to encouraging more U.S. apparel sourcing from CAFTA-DR members. Particularly, “allowing more flexibility in souring fabrics from outside CAFTA-DR” and “improving yarn production capacity and variety within CAFTA-DR” are the top two priorities.

U.S. fashion companies strongly support another ten-year renewal of the African Growth and Opportunity Act (AGOA). Meanwhile, Ethiopia’s loss of AGOA eligibility discourages U.S. apparel sourcing from the ENTIRE AGOA region.

  • As much as 75 percent of respondents say another ten-year AGOA renewal will encourage more apparel sourcing from the region and making investment commitments.
  • However, despite the tariff benefits and the liberal rules of origin, respondents express explicit concerns about the region’s lack of competitiveness in speed to market, political instability, and having an integrated regional supply chain.
  • Ethiopia’s loss of AGOA benefits had a notable negative impact on sourcing from the country AND the entire AGOA region. Notably, no respondent plans to move sourcing orders from Ethiopia to other AGOA beneficiaries.

USTR Fiscal Year 2023 Goals and Objectives—Textile and Apparel

In April 2022, the Office of the United States Trade Representative (USTR) released its 2023 Fiscal Year Budget report, outlining five goals and objectives for 2023. Notably, textile and apparel is a key sector USTR plans to focus on in the coming year:  

 Goal 1: Open Foreign Markets and Combat Unfair Trade

  • Provide policy guidance and support for international negotiations or initiatives affecting the textile and apparel sector to ensure that the interests of U.S. industry and workers are taken into account and, where possible, to provide new or enhanced export opportunities for U.S. industry.
  • Conduct reviews of commercial availability petitions regarding textile and apparel products and negotiate corresponding FTA rules of origin changes, where appropriate, in a manner that takes into account market conditions while preserving export opportunities for U.S. producers and employment opportunities for U.S. workers.
  • Engage relevant trade partners to address regulatory issues potentially affecting the U.S. textile and apparel industry’s market access opportunities.
  • Continue to engage under CAFTA-DR working groups and committees to optimize inclusive economic opportunities; strengthen the agreement and address non-tariff trade impediments; provide capacity building in textile and apparel trade-related regulation and practice on customs, border and market access issues, including agriculture and sanitary and phytosanitary regulation, to avoid barriers to trade.
  • Continue to engage CAFTA-DR partners and stakeholders to identify and develop means to increase two-way trade in textiles and apparel and strengthen the North American supply chain to enhance formal job creation.

Goal 2: Fully Enforce U.S. Trade Laws, Monitor Compliance with Agreements, and Use All Available Tools to Hold Other Countries Accountable

  • Closely collaborate with industry and other offices and Departments to monitor trade actions taken by partner countries on textiles and apparel to ensure that such actions are consistent with trade agreement obligations and do not impede U.S. export opportunities.
  • Research and monitor policy support measures for the textile sector, in particular in China, India, and other large textile producing and exporting countries, to ensure compliance with international agreements.
  • Continue to work with the U.S. textile and apparel industry to promote exports and other opportunities under our free trade agreements and preference programs, by actively engaging with stakeholders and industry associations and participating, as appropriate, in industry trade shows.

Goal 4: Develop Equitable Trade Policy Through Inclusive Processes

Take the lead in providing policy advice and assistance in support of any Congressional initiatives to reform or re-examine preference programs that have an impact on the textile and apparel sector.

[This blog post is not open for comment]

Sourcing Apparel from the CAFTA-DR Region—The Modern Cotton Story Podcast

Discussion questions:

  • What are the advantages and disadvantages of CAFTA-DR as an apparel-sourcing base for US fashion companies?
  • What are the key bottlenecks that prevent more apparel sourcing from CAFTA-DR members?
  • Do you support liberalizing the rules of origin or keeping the strict “yarn-forward” rules of origin in CAFTA-DR, and why?

CAFTA-DR Utilization Rate Fell to a Record Low for Apparel Sourcing in 2021, But Why?

As US fashion companies diversify their sourcing from Asia, near-sourcing from the Western Hemisphere, particularly members of the Dominican Republic-Central America Free Trade Agreement (CAFTA-DR) seems to benefit. According to the latest trade data from the Office of Textiles and Apparel (OTEXA), US apparel companies placed relatively more sourcing orders with suppliers in the Western Hemisphere in 2021. For example, CAFTA-DR members’ market shares increased by 0.31 percentage points in quantity and nearly one percentage point in value compared with a year ago.

However, it is concerning to see the utilization rate of CAFTA-DR for apparel sourcing fall to a new record low of only 73.7% in 2021. This means that as much as 26.3% of US apparel imports from CAFTA-DR members did NOT claim the duty-free benefits.

The lower free trade agreement (FTA) utilization rate became a problem, particularly among CAFTA-DR members with fast export growth to the US market in 2021. For example, whereas US apparel imports from Honduras enjoyed an impressive 45.6% growth in 2021, only 72.6% of these imports claimed the CAFTA-DR duty benefits, down from 82.3% a year ago. We can observe a similar pattern in El Salvador, Nicaragua, and the Dominican Republic.

The phenomenon is far from surprising, however. For years, US fashion companies have expressed concerns about the limited textile supply within CAFTA-DR, especially fabrics and textile accessories. The lack of textile supply plus the restrictive “yarn-forward” rules of origin in the agreement often creates a dilemma for US fashion companies: either source from Asia entirely or source from CAFTA-DR but forgo the duty-saving benefits.

Likewise, because of a lack of sufficient textile supply within the region, US apparel imports from CAFTA-DR members become increasingly concentrated on basic fashion items, typically facing intense competition with many alternative sourcing destinations. For example, measured in value, over 80% of US apparel imports from CAFTA-DR members in 2021 were shirts, trousers, and underwear. However, US companies import the vast majority (70%-88%) from non-CAFTA-DR sources for these product categories.

Understandably, it will be unlikely to substantially expand US apparel sourcing from CAFTA-DR members without solving the textile supply shortage problem facing the region.

More reading:

COVID-19 and US Apparel Imports: Key Trends (Updated: January 2022)

First, US apparel imports continue to rebound in November 2021 as companies build the inventory for the holiday season. Thanks to US consumers’ strong demand and the upcoming holidays, the value of US apparel imports went up by 15.7% in November 2021 from a month ago (seasonally adjusted) and increased by as much as 39.7% from 2020. However, before the pandemic, the value of US apparel imports always peaked in October and then gradually slipped in November and December. The unusual surge of imports in November 2021 could be the combined effects of price inflation and the late arrival of goods due to the shipping crisis.

Meanwhile, US apparel imports so far in 2021 have been far more volatile than in the past few years because of uncertainties and disruptions caused by COVID-19 and the shipping crisis. For example, the year-over-year (YoY) growth rate ranged from 131% in May to 17.6% in July, causing fashion companies additional inventory planning and supply chain management challenges. Unfortunately, the new omicron variant could worsen the market uncertainty and volatility.

Second, Asian countries remain the dominant sourcing base for US fashion companies as the production capacity elsewhere is limited. Asian countries’ market shares fell from 74.2% in 2020 to 71.3% in July 2021, primarily because of the COVID lockdowns in Vietnam and Bangladesh. US apparel imports came from Asian countries rebounded to 74.8% and 72.5% in October and November 2021, respectively. This result suggests a lack of alternative sourcing destinations outside Asia, especially for large volume items. Meanwhile, the worsening shipping crisis affecting the route from Asia to North America could explain why Asian suppliers’ market shares in November were somewhat lower than a month ago.

Third, US companies continue to treat China as one of their essential sourcing bases in the current business environment. However, companies are NOT reversing their long-term strategy of reducing “China exposure.”  China stays the largest supplier for the US market in November 2021, accounting for 41.5% of total US apparel imports in quantity and 25.8% in value. Due to the seasonal factor, China’s market shares typically peak from June to September and then drop from October until March-April.

Both industry sources and the export product diversification index also consistently show that China supplied the most variety of products to the US market with no near competitors. In comparison, US apparel imports from Bangladesh, Mexico, and CAFTA-DR members concentrate more on specific product categories.

Nevertheless, the HHI index and market concentration ratios (CR3 and CR5) calculated based on the latest data suggest that US fashion companies continue to move their apparel sourcing orders from China to other Asian countries overall. For example, only around 15% of US cotton apparel comes from China, compared with about 27% in 2018. My latest studies also indicate that it has become ever more common to see a fashion company places only around 10% of its total sourcing value or volume from China compared to over 30% in the past. Furthermore, with the growing tensions of the US-China relations and the newly enacted Uyghur Forced Labor Prevention Act, fashion companies could take another look at their China sourcing strategy to avoid potential high-impact disruptions.

Fourth, near sourcing from the Western Hemisphere, especially CAFTA-DR members, continue to gain popularity. Specifically, 17.3% of US apparel imports came from the Western Hemisphere year-to-date (YTD) in 2021 (January-November), higher than 16.1% in 2020. Notably, CAFTA-DR members’ market shares increased to 10.6% in 2021 (January to November) from 9.6% in 2020. The value of US apparel imports from CAFTA-DR also enjoyed a 41.7% growth in 2021 (January—November) from a year ago, one of the highest among all sourcing destinations. The imports from El Salvador (up 42.6%), Honduras (up 47.1%), and Guatemala (36.6%) had grown particularly fast so far in 2021. However, the political instability in some Central American countries could make fashion companies feel hesitant to permanently switch their sourcing orders to the region or make long-term investments.

Additionally, the latest trade data suggests a notable increase in the price of US apparel imports. Notably, the unit price of US apparel imports from almost all leading sources went up by more than 10% from January 2021 to November 2021. As worldwide inflation continues, the rising sourcing cost pressure won’t ease anytime soon.

by Sheng Lu

[The comment is closed]

US Apparel Sourcing from USMCA and CAFTA-DR: How Much Import Duties Were Saved and For Which Products?

The following findings were based on an analysis of trade volume and tariff data at the 6-digit HTS code level.

#1 Amid COVID-19, shipping crisis, and US-China tariff war, US fashion brands and retailers demonstrate a new round of interest in expanding “near-sourcing” from member countries of the US-Mexico-Canada Trade Agreement (USMCA, previously NAFTA) and Dominican Republic-Central America Free Trade Agreement (CAFTA-DR).

Data shows that 15.2% of US apparel imports came from USMCA and CAFTA-DR members YTD in 2021 (January-August), higher than 13.7% in 2020 and about 14.7% before the pandemic (2018-2019). Notably, CAFTA-DR members’ market shares increased to 11% in 2021 (January to Aug) from 9.6% in 2020. The value of US apparel imports from CAFTA-DR also enjoyed a 54% growth in 2021 (January—Aug) from a year ago, faster than 25% of the world’s average.

#2 Sourcing apparel from USCMA and CAFTA-DR members helps US fashion brands and retailers save around $1.6-1.7 billion tariff duties annually. (note: the estimation considers the value of US apparel imports from USMCA and CAFTA-DR members at the 6-digit HTS code level and the applied MFN tariff rates for these products; we didn’t consider the additional Section 301 tariffs US companies paid for imports from China). Official trade statistics also show that measured by value, about 73% of US apparel imports under free trade agreements came through USMCA (25%) and CAFTA-DR (48%) from 2019 to 2020.

#3 US apparel imports from USMCA and CAFTA-DR members do NOT necessarily focus on items subject to a high tariff rate. Measured at the 6-digit HS code level, apparel items subject to a high tariff rate (i.e., applied MFN tariff rate >17%) only accounted for about 8-9% of US apparel imports from USMCA members and 7-8% imports from CAFTA-DR members. In comparison, even having to pay a significant amount of import duties, around 17% of US apparel imports from Vietnam and 10% of imports from China were subject to a high tariff rate (see table below).

The phenomenon suggests that USCMA and CAFTA-DR members still have limited production capacity for many man-made fibers (MMF) clothing categories (such as jackets, swimwear, dresses, and suits), typically facing a higher tariff rate. This result also implies that expanding production capacity and diversifying the export product structure could make USMCA and CAFTA-DR more attractive sourcing destinations.

#4 US apparel imports from USMCA and CAFTA-DR members tend to focus on large-volume items subject to a medium tariff rate. Specifically, from 2017 to 2021 (Jan-Aug), ten products (at the 6-digit HTS code level) typically contributed around half of the US tariff revenues collected from apparel items (HS chapters 61-62). However, the average applied MFN tariff rates for these items were only about 13%. Meanwhile, these top tariff-revenue-contributing apparel items accounted for about 50% of US apparel imports from USMCA members and nearly 64%-69% of imports from CAFTA-DR members.

Likewise, the top ten products (at the 6-digit HTS code level) typically accounted for 65%-68% of US apparel imports from USMCA members and nearly 73-75% of US apparel imports from CAFTA-DR members. These products also had a medium average applied MFN rate at 11-12% for USMCA and 12-13% in the case of CAFTA-DR.

Given the duty-saving incentives, expanding “near-sourcing” from USMCA and CAFTA-DR members could prioritize these large-volume apparel items with a medium tariff rate in short to medium terms. However, in the long run, a shortcoming of this strategy is that many such items are basic fashion clothing that primarily competes on price (such as T-shirts and trousers) and cannot leverage the unique competitive edge of near-sourcing (such as speed to market). When the US reaches new free trade agreements, particularly those involving leading apparel-producing countries in Asia, it could offset the tariff advantages enjoyed by USMCA and CAFTA-DR members and quickly result in trade diversion.

by Sheng Lu

More reading:

COVID-19 and US Apparel Imports: Key Trends (Updated: September 2021)

First, the shipping crisis and new wave of COVID cases start to affect US apparel imports negatively. While US consumers’ demand for clothing overall remains strong, for the second month in a row, the value of US apparel imports (seasonally adjusted) in July 2021 decreased by 5.5% from a month ago and down 9.7% from May to June. The absolute value of US apparel imports year to date (YTD) in 2021 (January—July) was 25.3% higher than in 2020 and around 87% of the pre-COVID level (benchmark: January-July, 2019). However, the year-over-year growth in July 2021 was only 15.4%, compared with 60.0% in May 2021 and 29.1% in June 2021. Overall, the results remind us that the market environment is far from stable yet as the COVID situation in the US and other parts of the world continues to evolve.

Second, Asian countries lost market shares as some leading apparel supplying countries, including Vietnam and Bangladesh, struggled with new COVID lockdowns. While Asia as a whole remains the single largest apparel sourcing base for US companies, Asian countries’ market shares fell from 74.2% in 2020 to 71.3% in July 2021, the lowest since 2010.  The new COVID lockdowns in Vietnam and Bangladesh, the No. 2 and No. 3 top suppliers for the US market, post significant challenges to US fashion companies trying to build inventory for the upcoming holiday season. Notably, US companies source many high-volume products from these two countries, and there is a lack of alternative sourcing destinations in the short run.

Third, US companies continue to treat China as an essential sourcing base during the current challenging time. However, there is no clear sign that companies are reversing their long-term strategy of reducing “China exposure.”  China stays the largest supplier for the US market in July 2021, accounting for 41.3% of total US apparel imports in quantity and 26.0% in value. The export product diversification index also suggests that China supplied the most variety of products to the US market. US apparel imports from Bangladesh, Mexico, and CAFTA-DR members are more concentrated on specific product categories. In other words, should China were under lockdowns, the negative impacts on US companies’ inventory management could be even worse.

Nevertheless, the HHI index and market concentration ratios (CR3 and CR5) calculated based on the latest data suggest that US fashion companies continue to move their apparel sourcing orders from China to other Asian countries overall.  For example, only 14.7% of US cotton apparel imports came from China in 2021 (January—July), a new record low in the past ten years. Further, as US apparel imports from China typically peak from June to September because of seasonal factors, China’s market shares are likely to drop in the next few months. Additionally, the fundamental concerns about sourcing from China are NOT gone. On the contrary, new US actions against alleged forced labor in Xinjiang are likely in the coming months and affect imports from China beyond cotton products.

Fourth, US apparel sourcing from the Western Hemisphere, especially CAFTA-DR members, gains new momentum. Specifically, 18.1% of US apparel imports came from the Western Hemisphere YTD in 2021 (January-July), higher than 16.1% in 2020 and 17.1% before the pandemic. Notably, CAFTA-DR members’ market shares increased to 11.2% in 2021 (January to July) from 9.6% in 2020. The value of US apparel imports from CAFTA-DR also enjoyed a 58.4% growth in 2021 (January—July) from a year ago, one of the highest among all sourcing destinations. The imports from El Salvador (up 75.2%), Honduras (up 74.6%), Dominican Republic (45.1%), and Guatemala (40.6%) had grown particularly fast so far in 2021.

Meanwhile, US apparel imports from USMCA members stayed stable (i.e., no significant change in market shares). CAFTA-DR and USMCA members currently account for around 60% and 25% of US apparel imports from the Western Hemisphere. They are also the single largest export market for US textile products (about 70%).

Fifth, US apparel imports start to see a notable price increase. While an across-the-board price increase was not a big concern at the beginning of 2021, the increase has become more noticeable since June 2021. For example, of the top 20 US apparel imports (HS chapters 61-62) at the 6-digit HS code level based on import value, the price of thirteen products increased from May to June 2021. The price increase at the country level is even more significant. From May to July 2021, the average unit price of US apparel imports from leading sources all went up substantially, including China (7%), Vietnam (13%), Bangladesh (13.9%), and India (15.6%).

As almost everything is becoming more expensive, from raw material, shipping to labor, the August and September trade data (to be released in October and November) could suggest an even more significant price increase.

by Sheng Lu

2021 USFIA Fashion Industry Benchmarking Study Released

The 2022 USFIA Fashion Industry Benchmarking Study is now available

The full report is available HERE

Key findings of this year’s report:

#1 COVID-19 continues to substantially affect U.S. fashion companies’ sourcing and business operations in 2021

  • Recovery is happening: Most respondents expect their business to grow in 2021. Around 76 percent foresee their sourcing value or volume to increase from 2020. Around 60 percent of respondents expect a full recovery of their sourcing value or volume to the pre-COVID level by 2022.
  • Uncertainties remain: Still, 27 percent find it hard to tell when a full recovery will happen. About 20 percent of respondents still expect 2021 to be a very challenging year financially.
  • U.S. fashion companies’ worries about COVID still concentrate on the supply side, including driving up production and sourcing costs and causing shipping delays and supply chain disruptions. U.S. fashion companies’ COVID response strategies include strengthening relationships with key vendors, emphasizing sourcing agility and flexibility, and leveraging digital technologies. In comparison, few respondents canceled sourcing orders this year.

#2 The surging sourcing costs are a significant concern to U.S. fashion companies in 2021.

  • As many as 97 percent of respondents anticipate the sourcing cost to increase further this year, including 37 percent expect a “substantial increase” from 2020.
  • Respondents say almost EVERYTHING becomes more expensive in 2021. Notably, more than 70 percent of respondents expect the “shipping and logistics cost,” “cost of textile raw material (e.g., yarns and fabrics),” “cost of sourcing as a result of currency value and exchange rate changes,” and “labor cost” to go up.

#3 U.S. fashion companies’ sourcing strategies continue to envovle in response to the shifting business environment.

  • Asia’s position as the dominant apparel sourcing base for U.S. fashion companies remains unshakeable.
  • China plus Vietnam plus Many” remains the most popular sourcing model among respondents. However, the two countries combined now typically account for 20-40 percent of a U.S. fashion company’s total sourcing value or volume, down from 40-60 percent in the past few years.
  • Asia is U.S. fashion companies’ dominant sourcing base for textile intermediaries. “China plus at least 1-2 additional Asian countries” is the most popular textile raw material sourcing practice among respondents.
  • As U.S. fashion companies prioritize strengthening their relationship with key vendors during the pandemic, respondents report an overall less diversified sourcing base than in the past few years.

#4 U.S. fashion companies continue to reduce their China exposure. However, the debate on China’s future as a textile and apparel sourcing base heats up.

  • Most U.S. fashion companies still plan to source from China in short to medium terms. While 63 percent of respondents plan to decrease sourcing from China further over the next two years, it is a notable decrease from 70 percent in 2020 and 83 percent in 2019.
  • Most respondents still see China as a competitive and balanced sourcing base from a business perspective. Few other sourcing countries can match China’s flexibility and agility, production capacity, speed to market, and sourcing cost. As China’s role in the textile and apparel supply chain goes far beyond garment production and continues to expand, it becomes ever more challenging to find China’s alternatives.
  • Non-economic factors, particularly the allegations of forced labor in China’s Xinjiang Uygur Autonomous Region (XUAR), significantly hurt China’s long-term prospect as a preferred sourcing base by U.S. fashion companies. China also suffered the most significant drop in its labor and compliance rating this year.

#5 With an improved industry look and the continued interest in reducing “China exposure,” U.S. fashion companies actively explore new sourcing opportunities.

  • Vietnam remains a hot sourcing destination. However, respondents turn more conservative this year about Vietnam’s growth potential due to rising cost concerns and trade uncertainties caused by the Section 301 investigation.
  • U.S. fashion companies are interested in sourcing more from Bangladesh over the next two years. Respondents say apparel “Made in Bangladesh” enjoys a prominent price advantage over many other Asian suppliers. However, the competition among Bangladeshi suppliers could intensify as U.S. fashion companies plan to “work with fewer vendors in the country.”
  • Respondents are also interested in sourcing more from Sub-Saharan Africa by leveraging the African Growth and Opportunity Act (AGOA). Respondents also demonstrate a growing interest in investing more in AGOA members directly. “Replace AGOA with a permanent free trade agreement that requires reciprocal tariff cuts and continues to allow the “third-country fabric provision” is respondents’ most preferred policy option after AGOA expires in 2025.

#6 Sourcing from the Western Hemisphere is gaining new momentum

  • Overall, U.S. fashion companies’ growing interest in the Western Hemisphere is more about diversifying sourcing away from China and Asia than moving the production back to the region (i.e., reshoring or near-shoring).
  • Respondents say CAFTA-DR’s “short supply” and “cumulation” mechanisms provide critical flexibility that allow U.S. fashion companies to continue to source from its members. However, despite the “yarn-forward” rules of origin, only 15 percent of respondents sourcing apparel from CAFTA-DR members say they “purposefully use U.S.-made fabrics” to enjoy the agreement’s duty-free benefits.
  • Respondents suggest that encouraging more apparel sourcing from the Western Hemisphere requires three significant improvements: 1) make the products more price competitive; 2) strengthen the region’s fabric and textile raw material production capacity; 3) make rules of origin less restrictive in relevant U.S. trade agreements.

This year’s benchmarking study was based on a survey of executives at 31 leading U.S. fashion companies from April to June 2021. The study incorporates a balanced mix of respondents representing various types of businesses in the U.S. fashion industry. Approximately 54 percent of respondents are self-identified retailers, 46 percent self-identified brands, 69 percent self-identified importers/wholesalers. Around 65 percent of respondents report having more than 1,000 employees. Another 27 percent of respondents represent medium-sized companies with 101-999 employees.

USITC Reports the Economic Impacts of U.S. Free Trade Agreements

In June 2021, the U.S. International Trade Commission (USITC) released the 2021 Economic Impact of Trade Agreements Implemented under Trade Authorities Procedures report. By using both qualitative and quantitative methods, USITC assessed the impact of trade agreements on U.S. industries, including workers, since 2016. Below are the key findings related to the textile and apparel sector:

First, free trade agreements enacted in the U.S. have had a small but positive effect on the U.S. economy and trade. As of January 1, 2021, the United States has 14 free trade agreements (FTAs) with 20 countries in force. In the year 2017 (the base year), they led to an estimated increase in U.S. real Gross Domestic Product (GDP) of $88.8 billion (0.5 percent), and in aggregate U.S. employment of 485,000 full-time equivalent (FTE) jobs (0.3 percent). Real wages increased by 0.3 percent. Further, U.S. exports increased by $37.4 billion (1.6 percent), and imports increased by $95.2 billion (3.4 percent) because of these FTAs.

Second, USITC estimates that U.S.-free trade agreements have expanded the U.S. textile industry but hurt U.S. domestic apparel production. Thanks to the North American Free Trade Agreement (NAFTA, now the U.S.-Mexico-Canada Trade Agreement, USMCA) and the Dominican Republic-Central America Free Trade Agreement (CAFTA-DR), the Western Hemisphere has become the single largest export market for U.S. textile producers. However, U.S. apparel manufacturers have to face intensified import competition.

Third, the textile and apparel-specific rules in U.S. free trade agreements are complicated and often hinder the usage of the trade agreements. As noted by USITC, the U.S. duty on imported textile and, especially, apparel goods are among the highest of all product categories. Despite the duty-saving incentives, only 12.1% of U.S. textile and apparel imports came in under FTAs in 2020, even lower than 16.7% in 2007 when fewer FTAs were in force.

The complexity of the textile and apparel-specific rules of origins (ROOs) is a significant cause of the low FTA utilization rate. As USITC noted, “No two FTAs using the tariff shift model contain the same ROOs for apparel goodsfor some importers, the strict preference rules of origins (ROOs), along with the record-keeping and documentation requirements the rules entail, make the cost of compliance too great to take full advantage of the duty-free opportunities.” According to the annual USFIA fashion industry benchmarking study, the surveyed U.S. fashion companies consistently expressed the same concerns about the too restrictive ROOs in U.S. FTAs.

Related, the USITC report noted, “some U.S. domestic textile industry representatives state that the existing FTA rules follow a simple template designed to benefit upstream manufacturers in the textile and apparel supply chain.” Having to use more expensive domestic-made fibers and yarns reduces the price competitiveness of U.S. fabrics and home textiles in the export market.

Further, the USITC report explains the history of the “Short supply” and “Tariff-preference level, TPL” mechanisms in U.S. free trade agreements. However, the report does not provide an assessment of their trade impacts.

Trade statistics show that these exceptions to the restrictive “yarn-forward” rules of origin are critical for U.S. apparel sourcing from certain FTA partners. For example, more than 60% of U.S. apparel imports from Canada claimed duty-free benefits by using the TPL mechanism rather than complying with the USMCA/NAFTA “yarn-forward” rules in 2020.  Around 8% of U.S. apparel imports from Mexico did the same. Likewise, in 2020, approximately 4% of U.S. apparel imports from CAFTA-DR members used the “short supply” mechanism, and the other 4% used the “cumulation” mechanism.

COVID-19 and U.S. Apparel Imports: Key Trends (Updated: June 2021)

First, thanks to consumers’ resumed demand and a more optimistic outlook for the U.S. economy, U.S. apparel imports continue to rebound. However, uncertainties remain. On the one hand, mirroring retail sales patterns, the value of U.S. apparel imports in April 2021 went up by 66% from a year ago, a new record high since the pandemic. The absolute value of U.S. apparel imports so far in 2021 (January –April) also recovered to around 88% of the pre-Covid level (i.e., January to April 2019). However, the value of U.S. apparel imports in April 2021 was 11.2% lower than in March 2021 (seasonally adjusted), suggesting that the market environment is far from stable yet as the COVID situation in the U.S. and other parts of the world continue to evolve.

Second, data indicates that Asia as a whole remains the single largest sourcing base for U.S. fashion companies, stably accounting for around 72-75% of the import value. Studies show that two factors, in particular, contribute to Asia’s competitiveness as a preferred apparel sourcing base—price and flexibility & agility.  Asia’s highly integrated regional supply chains and its vast production capacity shape its competitiveness in these two aspects.

However, the recent surge of COVID cases in India and its neighboring Southeast Asian countries has raised new worries about the potential sourcing risks and supply chain disruptions for U.S. fashion companies currently sourcing from there.  

Third, as the direction of the US-China relations becomes ever more concerning, U.S. fashion companies seem to accelerate diversifying sourcing from China. Even China remains the top apparel supplier for the U.S. market, from January to April 2021, China’s market shares fell to 32.1% in quantity (was 36.6% in 2020) and 20.2% in value (was 23.7% in 2020).  Also, the HHI index and market concentration ratios (CR3 and CR5) suggest that US fashion companies are increasingly moving their apparel sourcing orders from China to other Asian countries. For example, according to a leading U.S. fashion corporation in its latest annual report, “in response to the recent tariffs imposed by the current US administration, the Company has reduced the amount of goods being produced in China.”

Further, the latest data suggests that the concerns about the alleged forced labor in Xinjiang hurt China’s prospect as an apparel sourcing destination, BOTH for cotton and non-cotton items. Measured by value, only 11.9% of U.S. cotton apparel came from China in April 2021, a new record low since implementing the CBP WROs, which impose a regional ban on any cotton and cotton apparel made in the Xinjiang region. The latest data also suggests that China is quickly losing market shares for non-cotton textile and apparel items.

Fourth, U.S. apparel sourcing from CAFTA-DR members gains new momentum, reflecting the strong interest in sourcing more from the region from the business community and policymakers. For example, 17.5% of U.S. apparel imports came from the Western Hemisphere in 2021 (Jan-Apr), higher than 16.1% in 2020 and 17.1% before the pandemic. Notably, CAFTA-DR members’ market shares increased to 10.8% in 2021 (Jan-Apr) from 9.6% in 2020. The value of U.S. apparel imports from CAFTA-DR also enjoyed a 25.8% growth in 2021 (Jan-Apr) from a year ago, one of the highest among all sourcing destinations. The imports from El Salvador (up 29.2%), Honduras (up 28.0%), and Guatemala (27.0%) had grown particularly fast in 2021.

Meanwhile, U.S. apparel imports from USMCA members stayed stable overall. CAFTA-DR and USMCA members currently account for around 60% and 25% of U.S. apparel imports from the Western Hemisphere. They are also the single largest export market for U.S. textile products (around 70%). The Biden administration has signaled its strong interest in strengthening the western hemisphere textile and apparel supply chain by leveraging CAFTA-DR along with other trade policy tools.

by Sheng Lu