In December 2023, Just-Style consulted a panel of industry experts and scholars in its Outlook 2024–what’s next for apparel sourcing briefing. Below is my contribution to the report. Welcome any comments and suggestions!
What’s next for apparel sourcing?
Apparel sourcing is never about abrupt changes. However, fashion companies’ sourcing practices, from their crucial sourcing factors and sourcing destinations to operational priorities, will gradually shift in 2024 in response to the evolving business environment.
First, besides conventional sourcing factors like costs, speed to market, and compliance, fashion companies will increasingly emphasize flexibility and agility in vendor selection. One driving factor is economic uncertainty. For example, according to leading international organizations such as the World Bank and the International Monetary Fund (IMF), the world economy will likely grow relatively slowly at around 2.6%-3% in 2024. However, it is not uncommon that the economy and consumers’ demand for clothing could perform much better than expected. This means companies need to be ready for all occasions. Likewise, geopolitical tensions, from the Russia-Ukraine war and the US-China decoupling to the military conflict in the Middle East, could cause severe supply chain disruptions anytime and anywhere. Thus, fashion companies need to rely on a more flexible and agile supply chain to address market uncertainties and mitigate unpredictable sourcing risks.
Secondly, it will be interesting to watch in 2024 to what extent fashion companies will further reduce their exposure to China. On the one hand, it is no surprise that fashion companies are reducing finished garments sourcing from China as much as possible. However, fashion brands and retailers also admit that it is difficult to find practical alternatives to China in the short to medium terms regarding raw textile materials and orders that require small runs and great variety. Meanwhile, investments from China are flowing into regions considered alternative sourcing destinations, such as the rest of Asia and Central America. These new investments could complicate the efforts to limit exposure to China and potentially strengthen, not weaken, China’s position in the apparel supply chains. And stakeholders’ viewpoints on “investments from China” appear even more subtle and complicated.
Third, regulations “behind the borders” could more significantly affect fashion companies’ sourcing practices in 2024, particularly in sustainability-related areas. While sustainability is already a buzzword, fashion companies must deal with increasingly complex legal requirements to achieve sustainability. Take textile recycling, for example. The enforcement of the Uyghur Forced Labor Prevention Act (UFLPA) on recycled cotton, the US Federal Trade Commission’s expanded Green Guides, the EU’s extended producer responsibility (EPR) program and its strategy for sustainable textiles, and many state-level legislations on textile waste (e.g., California Textile Recycling Legislation) may all affect companies’ production and sourcing practices for such products. Fashion companies’ sourcing, legal, and sustainability teams will need to work ever more closely to ensure “sustainable apparel” can be available to customers.
Apparel industry challenges and opportunities
In 2024, a slow-growing or stagnant world economy will persist as a significant challenge for fashion companies. Without sourcing orders from fashion brands and retailers, many small and medium-sized manufacturers in the developing world may struggle to survive, leaving garment workers in a precarious financial situation. China’s economic slowdown could worsen the situation as many developing countries increasingly treat China as an emerging export market. With shrinking domestic demand, more “Made in China” apparel could enter the international market and intensify the price competition.
Another challenge is the rising geopolitical tensions and political instability in major apparel-producing countries. For example, while a broad base supports the early renewal of the African Growth and Opportunity Act (AGOA), which will expire in 2025, the reported human rights violations in some essential apparel exporting countries in the region could complicate the renewal process in US Congress. Likewise, even though the Biden administration is keen to encourage fashion companies to expand sourcing from Central America, political instability there, from Nicaragua to Haiti, makes fashion companies hesitant to make long-term sourcing commitments and investments. Furthermore, 2024 is the election year for many countries, from the US to Taiwan. We cannot rule out the possibility that unexpected incidents could trigger additional instability or even new conflict.
On the positive side, it is encouraging to see fashion companies continue to invest in new technologies to improve their operational efficiency in apparel sourcing. Digital product passports, 3D product design, PLM, blockchain, Generative AI, and various supply chain traceability tools are among the many technologies fashion companies actively explore. Fashion companies hope to leverage these tools to improve their supply chain transparency, strengthen relationships with key vendors, reduce textile waste, accelerate product development, and achieve financial returns.
It is also a critical time to rethink and reform fashion education. In addition to traditional curricula like apparel design and merchandising, we need more partnerships between the apparel industry and educational institutions to expose students to the real world. More direct engagement with Gen Z will also benefit fashion companies tremendously, allowing them to understand their future core customers and prepare qualified next-generation talents.
The full article is here(Just-Style access required). Below are the key findings:
Based on a content analysis of the annual reports of about 30 largest US fashion brands and retailers from 2018 to 2023, this study aims to identify these companies’ most critical evolving sourcing practices, including their sourcing destination adjustment, primary sourcing factors, and emerging sourcing-related “hot topics.” The findings provide critical market intelligence, informing US fashion companies about their peers’ emerging sourcing trends and popular practices. The results show that:
First, maintaining a relatively diverse sourcing base remains common among US fashion companies. Results show that large-size companies today typically source from more than 20 countries. One critical factor behind fashion companies’ sourcing diversification strategies is that no single supplying country is “perfect,” given the increasingly complex sourcing factors. Sourcing diversification allows fashion companies to balance various sourcing factors. For example, according to company #19, “the (sourcing diversification) approach provides us with the greatest flexibility in identifying the appropriate manufacturers while considering quality, cost, timing of product delivery and other criteria.” On the other hand, sourcing diversification enables companies to adapt quickly to market uncertainties and enjoy supply chain flexibility and resilience.
Second, while US fashion companies are not necessarily leaving any particular countries they source from, many have substantially reduced the number of vendors they work with over the past few years. Specifically, out of the 30 fashion companies the study examined, over 60% explicitly mentioned they consolidated their sourcing base at the vendor level from 2017/2018 to 2022/2023, although the degree varied. For example:
Company #4, a leading sportswear brand, cut its contracted factories from 363 to 291 (or down 19.8%)
Company #6, which owns several jeans and sportswear brands, reduced its contracted factories from 1,000 to around 340 (or down 66%)
Company #9, a well-known specialty clothing store, cut its vendors from 800 to 250 (or down 68.8%)
Company #26, a specialty clothing store targeting the youth, cut its vendors from 150 to around 119 (or down 20.7%)
Company #28, a discount department store, cut its vendors from 3,100 to around 2,800 (or down 9.7%)
Associated with the trend of “country diversification and vendor consolidation,” US fashion companies are increasingly interested in working with “super vendors,” e.g., those with multiple country presence or vertical manufacturing capability. The use of “super vendor” can also be observed in fashion companies’ willingness to give more sourcing orders to their top suppliers. For example, Company #18, a casual and outdoor wear retailer, reduced its vendors from 200 in 2017/2018 to 110 in 2022/2023, but increased the cap of sourcing orders for its top 10 vendors from 40% to 47% over the same period.
Third, regarding the sourcing base, many US fashion companies have intentionally reduced their apparel sourcing from China, given the US-China tariff war, deteriorating bilateral relations, and the forced labor concerns with China’s Xinjiang region (XUAR). Specifically, more than one-third of the examined companies explicitly mentioned their strategy to reduce finished garments sourcing from China. Furthermore, several US fashion companies indicated their “reducing China exposure” strategy would continue, implying China’s market share in the US apparel import market could decrease further.
Nevertheless, even though fewer finished garments are coming from China, US fashion companies admit that China will continue to play a critical role as a textile raw material supplier as no immediate practical alternative is available. For example, Company #20, a specialty clothing chain focusing on trendy and fashionable items, says, “During fiscal 2022, we sourced most of our finished products with partners and suppliers outside the US and we continued to design and purchase fabrics globally, with most coming from China.”
Fourth, in line with trade statistics, US fashion companies consider other Asian suppliers, such as Vietnam, Bangladesh, Cambodia, and Indonesia, as their top choices as China’s alternatives.In comparison, few fashion companies explicitly mentioned moving their sourcing orders from China to Western Hemisphere countries or other regions.
Additionally, regarding emerging “hot topics” related to sourcing:
Geopolitics: the deteriorating US-China relations, escalated trade tensions expanded from tariffs to forced labor, and the potential trade disruptions have concerned US fashion companies significantly. Notably, US fashion companies regard sourcing from China as increasingly risky, with the implementation of the Uyghur Forced Labor Prevention Act (UFLPA) in June 2022. For example, according to Company 2, “The Uyghur Forced Labor Prevention Act and other similar legislation may lead to greater supply chain compliance costs and delays to us and to our vendors.”
Near-shoring: due to the decoupling and de-risking from the China movement, US fashion companies have begun actively exploring near-shoring sourcing opportunities in the Western Hemisphere, particularly from members of the Dominican Republic-Central America Free Trade Agreement (CAFTA-DR). For example, Company #1, the North American manufacturer, disclosed that “(our) Company relies on a number of preferential trade programs (…) including the Dominican Republic – Central America – United States Free Trade Agreement (CAFTA-DR (…) Collectively, these agreements strengthen US economic relations and expand trade with Central America, the Dominican Republic, and Haiti.”
Sustainability and social responsibility: It is noteworthy that aside from climate change and forced labor, which are typically addressed as risk factors, US fashion companies generally hold an optimistic and forward-looking perspective for sustainability, such as new technologies and endeavors toward more sustainable production and sourcing. Terms such as using preferred or recycled materials, supply chain transparency and traceability, and emerging sustainability technologies have been more frequently mentioned in companies’ annual or ESG reports. For example, Company #17 says, “Increase the usage of environmentally preferred materials to comprise 32.6% of the brand’s global materials footprint.”Company #2 adds, “Our goal is to use preferred materials in 100 percent of our products by 2030.” Company #9 states, “We collaborate with suppliers to increase the supply of preferred raw materials.”
Supply chain transparency: US fashion companies attach great importance to improving supply chain transparency and traceability. Compared to the past, fashion companies are more willing to invest in new technologies and digital tools, allowing them to map supply chains and achieve sustainability goals more effectively. Related to this, US fashion companies have actively engaged with industry associations and other industry communities outside the company to stay informed about sustainability trends and learn best practices.
Students in FASH455 have proposed the following discussion questions based on the videos about the state of textile and apparel in Asia. Everyone is welcome to join the online discussion. For FASH455 students, please address at least two questions and mention the question number (#) in your reply.
#1 We have seen all the improvements and “upgrading” Vietnam has made toward the fashion industry. What can the garment industry in other countries take away from Vietnam’s experiences?
#2 Is Asia’s highly integrated apparel supply chain unique to the region? Can the Western Hemisphere “copy” Asia’s model?
#3 How can Asia’s textile and apparel industry balance the growing demand for sustainability and the need to remain cost-competitive? What innovative strategies can be adopted to achieve this balance?
#4 As Asian textiles and apparel factories continue to improve their efficiency and expand product offers, will it be beneficial for the US to reach a trade agreement with Asian countries? Or do you believe such an agreement might contradict the goals we try to achieve from CAFTA-DR?
#5 Will Vietnam eventually become the next China, or could its labor shortages be a significant barrier preventing its textile and apparel industry from advancing to the next level?
#6 Should textile and garment factories in Asia make more efforts to appeal to the younger generation (e.g., Gen Z)? Or is automation the solution?
#7 To what extent do you think Asian apparel exporting countries (e.g., Bangladesh, Vietnam and Cambodia) will reduce their dependence on textile raw materials supply from China due to the Uyghur Forced Labor Prevention Act (UFLPA)? Or, instead, do you think Asian apparel-exporting countries other than China benefit from UFLPA?
#8 The video shows that Asian countries have begun to invest heavily in new production capacities for textile recycling. Do you believe the region will continue to dominate textile and apparel production in the era of fashion circularity? Or will the emergence of textile recycling shift the world textile and apparel trade patterns in the long run?
Beth Hughes serves as the Vice President of the American Apparel and Footwear Association (AAFA), responsible for supporting the association’s efforts on international trade and customs issues. Beth oversees AAFA’s Trade Policy Committee, as well as AAFA’s Customs Group. Beth is also the spokesperson of the Coalition for Economic Partnership in the Americas (CEPA), a group of prominent American companies, and manufacturers committed to advancing regional trade and employment opportunities in the Western Hemisphere.
Before joining AAFA, Beth served for six years as senior director of international affairs at the International Dairy Foods Association. Beth earned a Bachelor of Arts degree in political science at George Washington University and received a Master of Arts in international affairs from Florida State University.
The interview was conducted by Leah Marsh, a graduate student in the Department of Fashion and Apparel Studies at the University of Delaware. Leah’s research focused on exploring EU retailers’ sourcing strategies for clothing made from recycled textile materials and fashion companies’ supply chain and sourcing strategies.
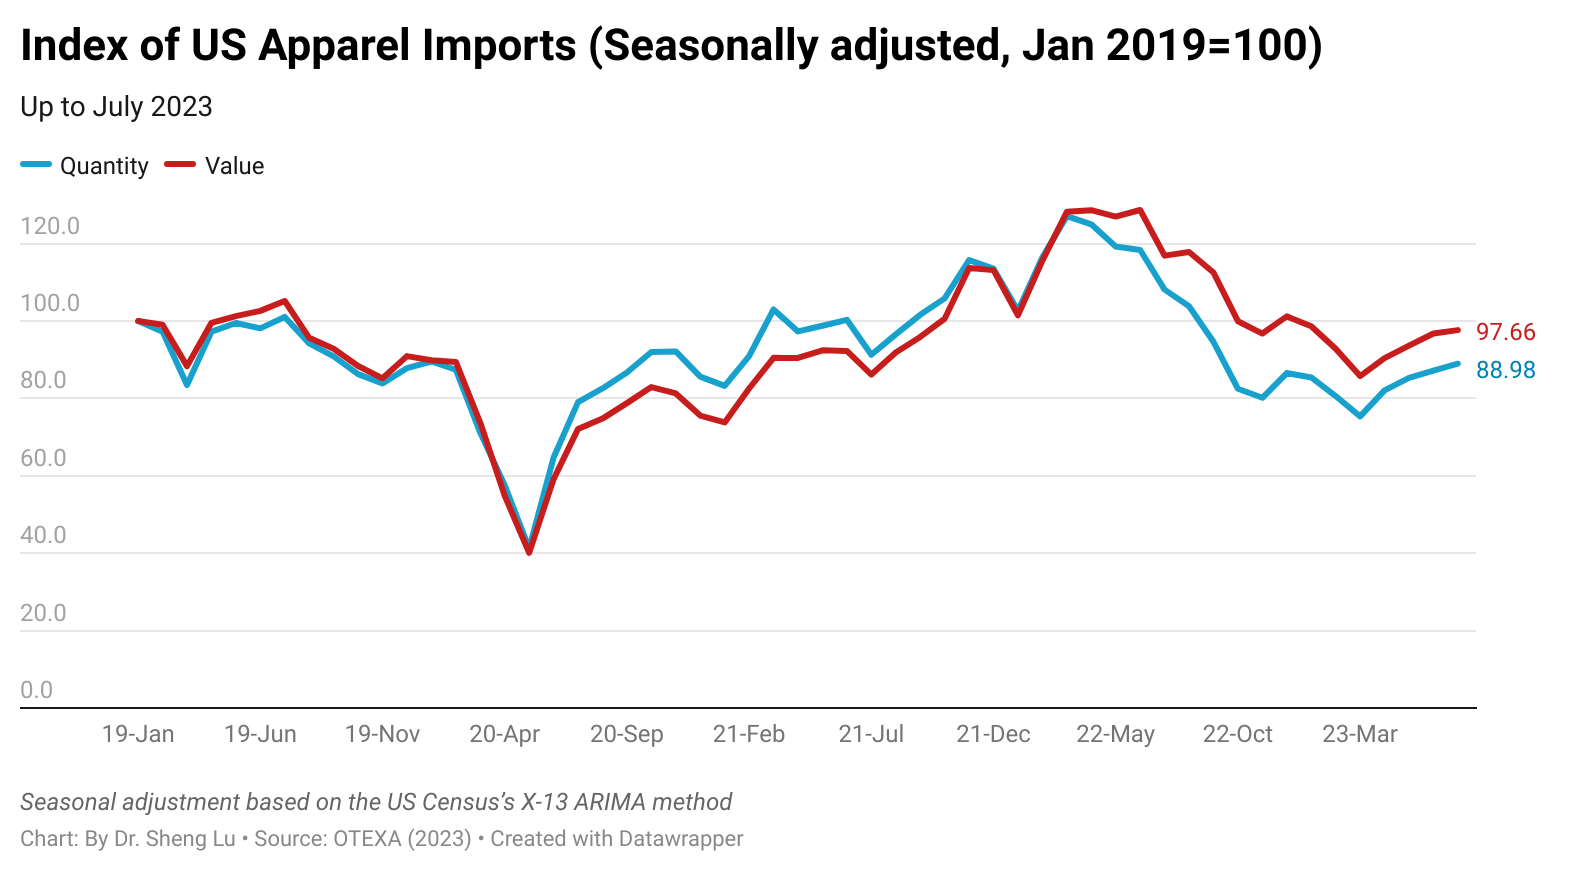
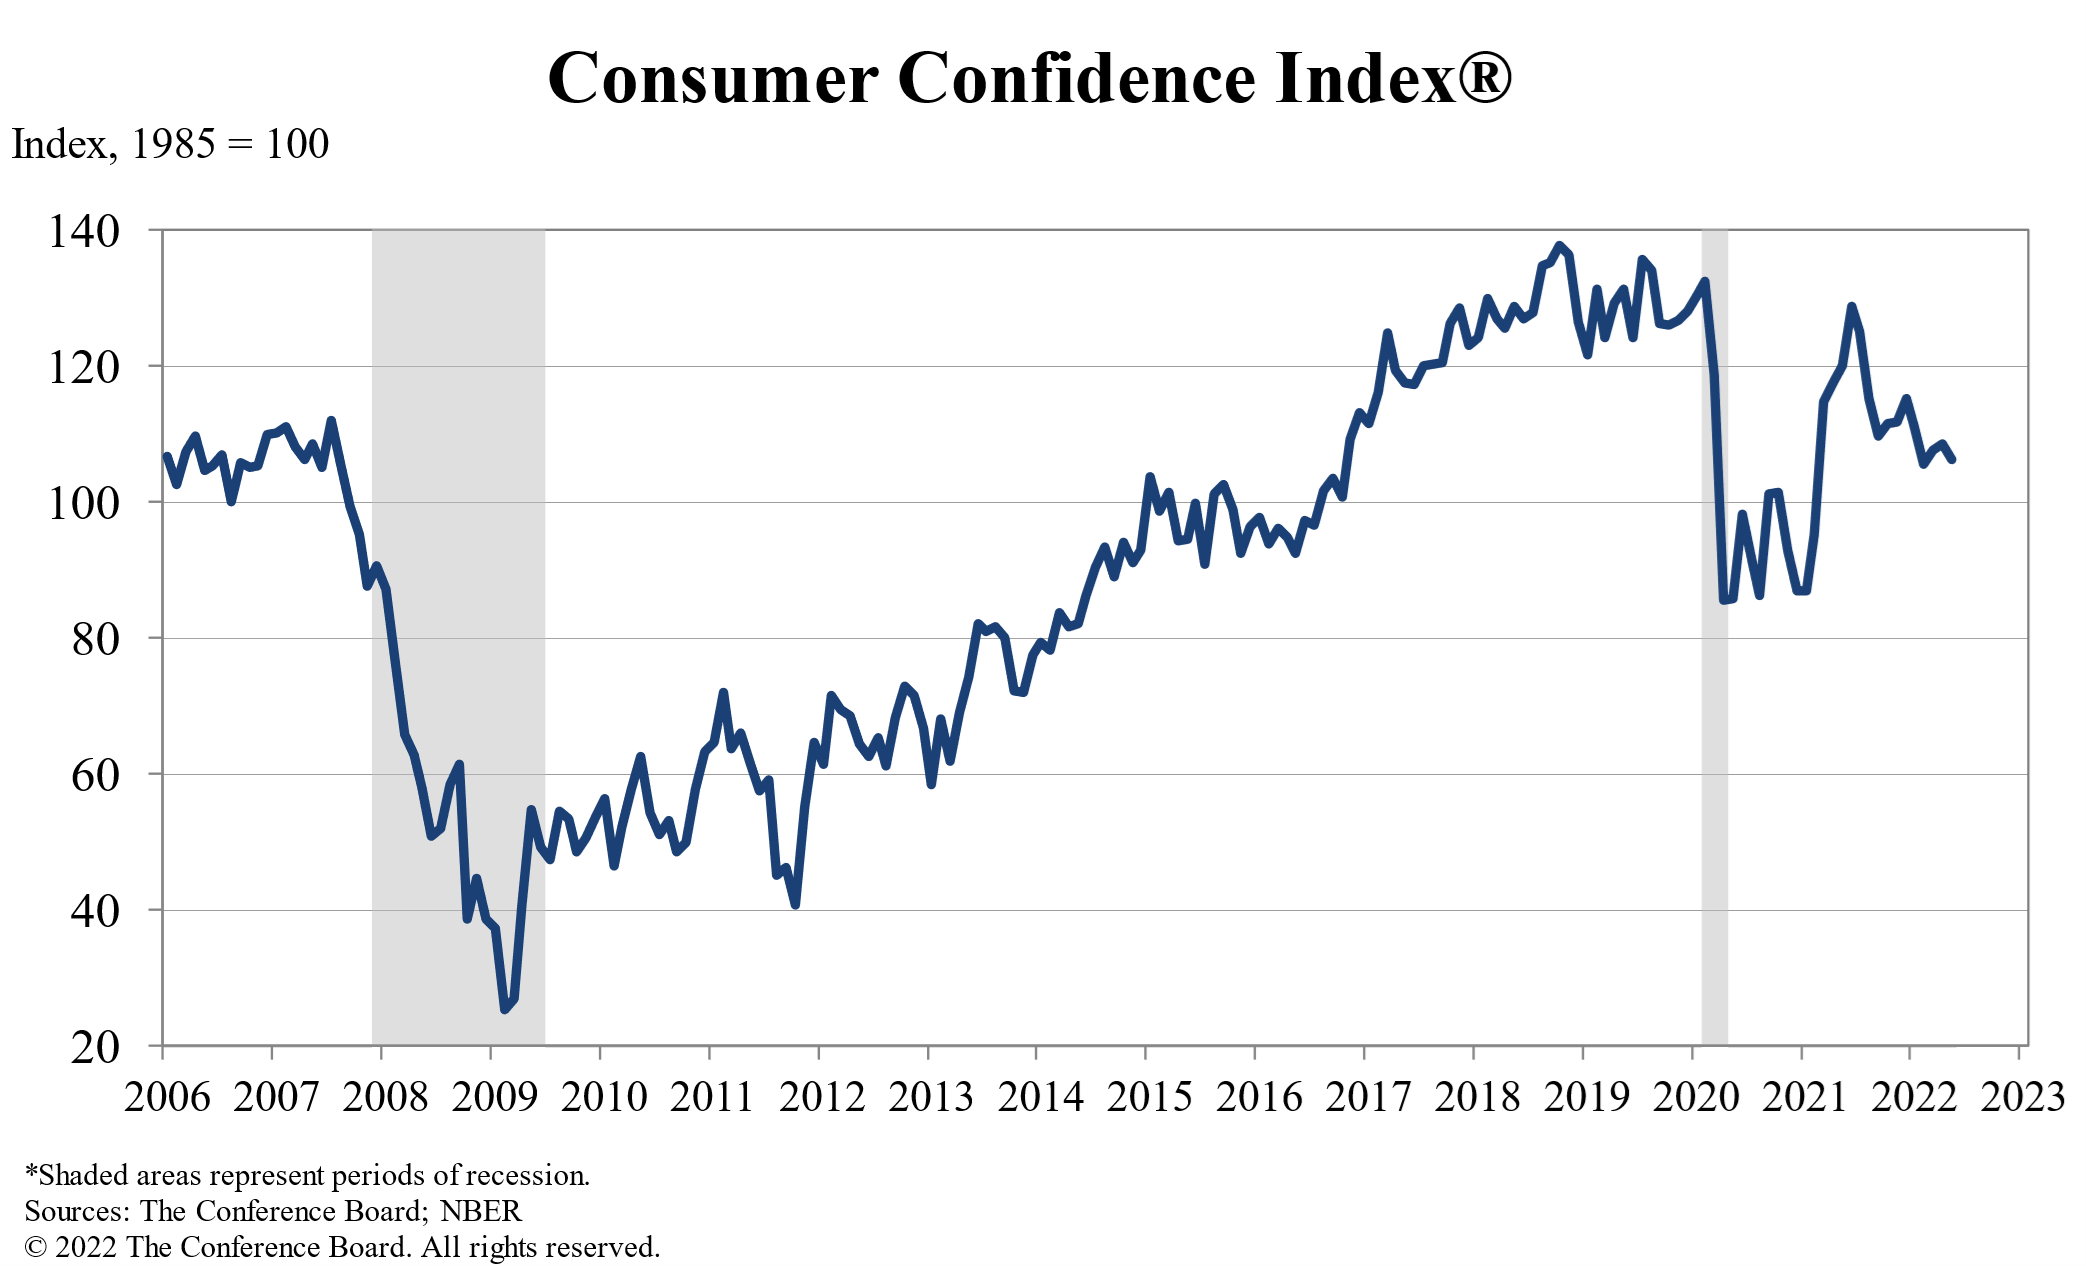
First, while US apparel imports gradually recovered, the import demand remained weak overall. For example, US apparel imports in July 2023 increased by 0.9% in value and 2% in quantity from June (seasonally adjusted). However, the trade volume still experienced a decrease of approximately 17-18% compared to the previous year. Meanwhile, the US consumer confidence index fell again in August 2023, suggesting the economic uncertainties are far from over. Notably, so far in 2023 (January to July), US apparel imports decreased by 22.3% in value and 28% in quantity from the previous year, the worst performance since the pandemic.
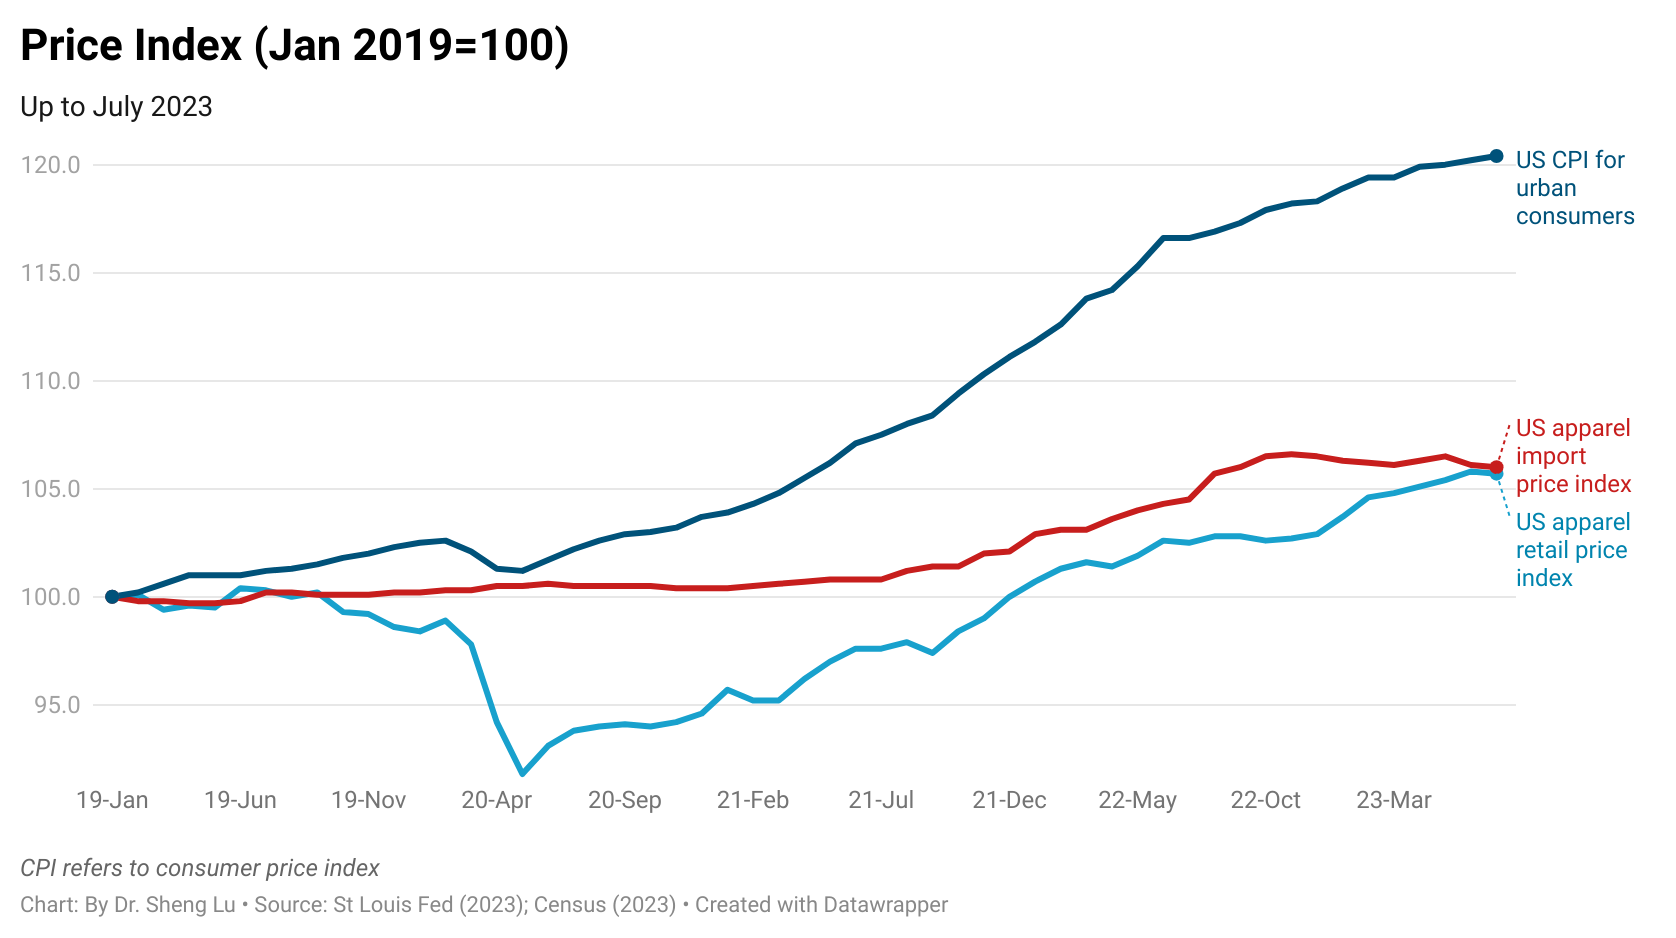
As a silver lining, the price of US apparel imports has stabilized, although inflation remains an issue for the US economy.
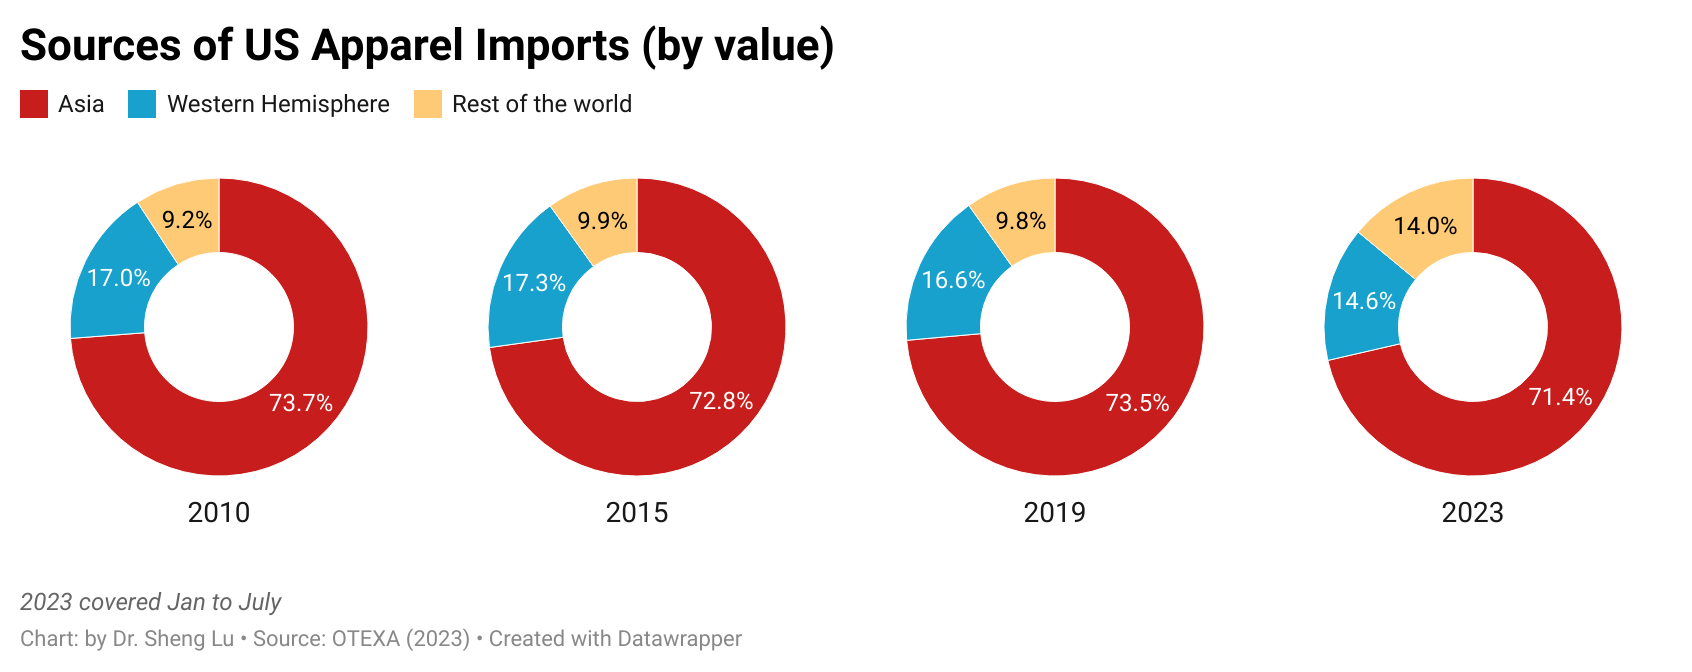
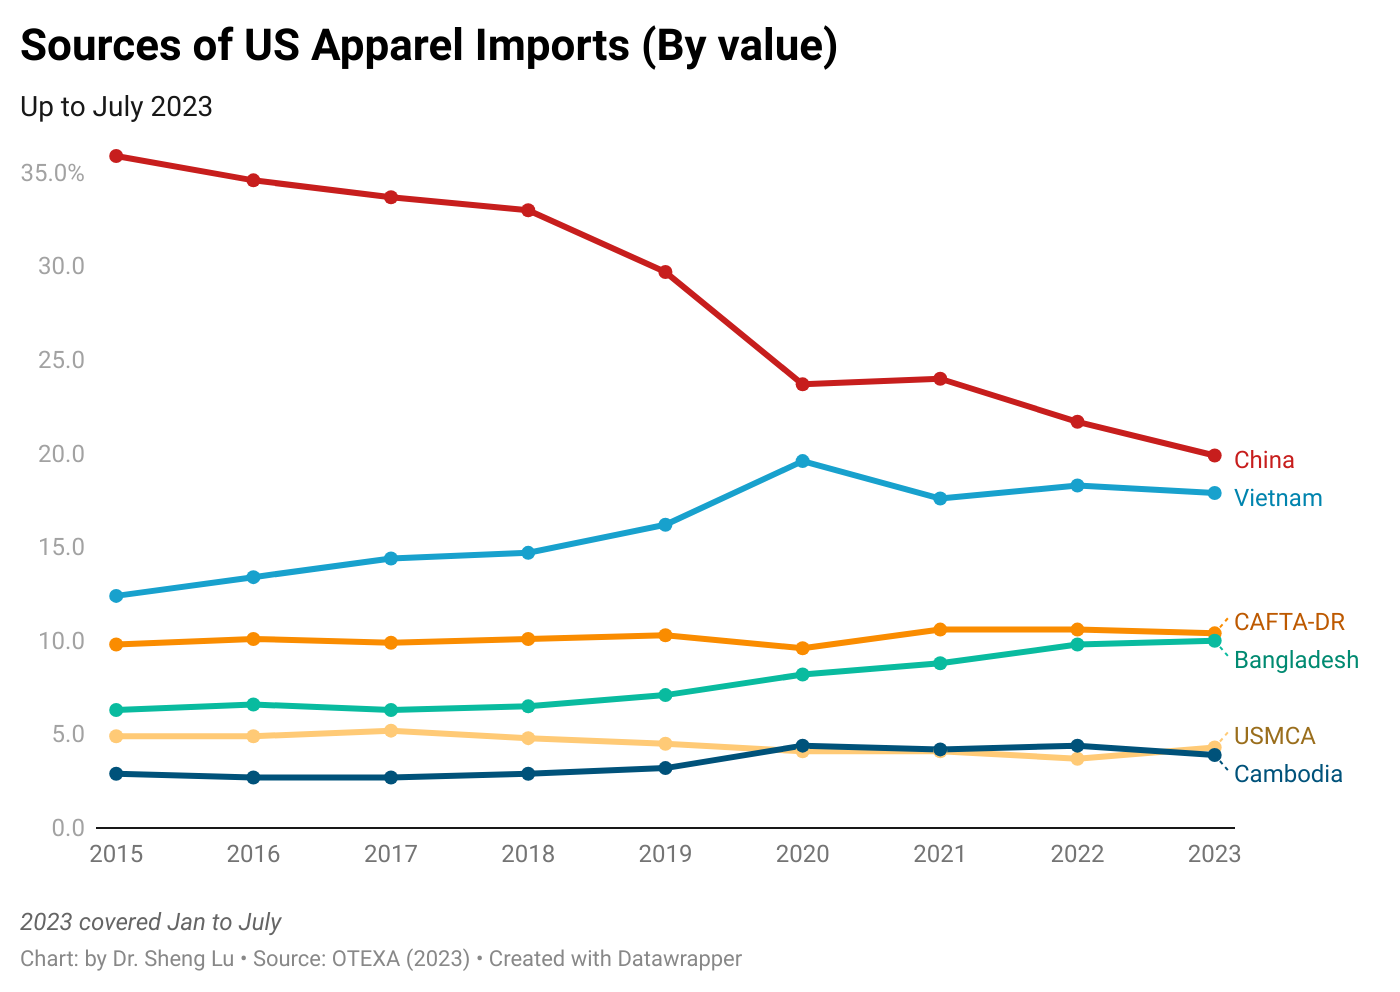
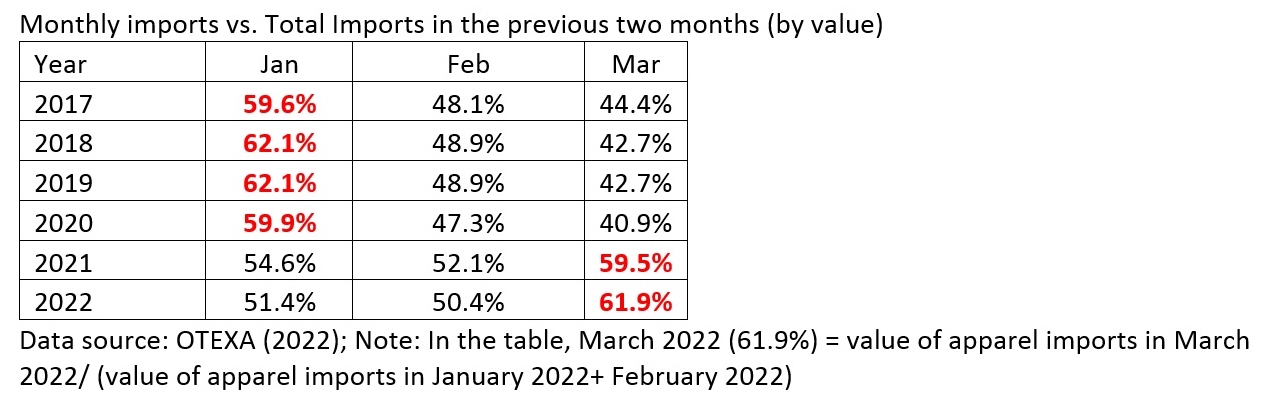
Secondly, because of the seasonal pattern, Asian countries were able to capture relatively higher market shares since June. For example, measured in value, China, ASEAN, and Bangladesh accounted for over 64% of total US apparel imports in July 2023, a notable increase from 61% in June and 58% in May 2023.
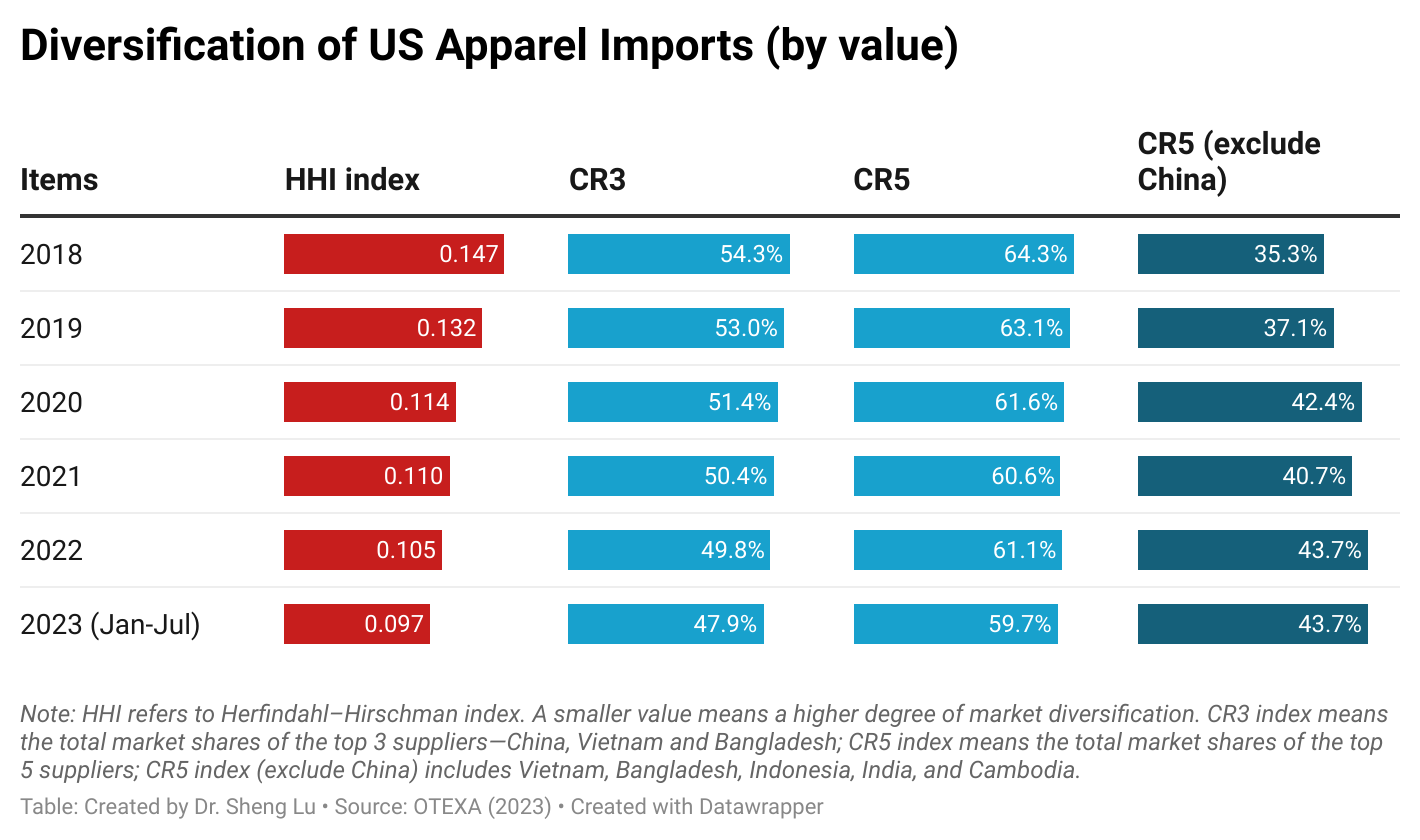
Nevertheless, US fashion companies continue diversifying their sourcing base to mitigate various supply chain risks and rising geopolitical tensions. For example, the HHI Index for US apparel imports dropped to 0.097 in the first seven months of 2023, which is lower than the 0.106 recorded in the same period the previous year (January to July 2022), indicating a greater diversity in the sources of imports.
Third, despite an apparent rebound in exports to the US, China continued to experience a further decline in its market share. For instance, in July 2023, China’s market share was more than 3 percentage points lower in value (27.2% in July 2022 vs. 24.1% in July 2023) and 2.5 percentage points lower in quantity (43.1% in July 2022 vs. 40.6% in July 2023). This marked the worst performance since April 2023. In other words, consistent with recent industry surveys, US fashion companies continue to reduce their China exposure given the adverse business environment.
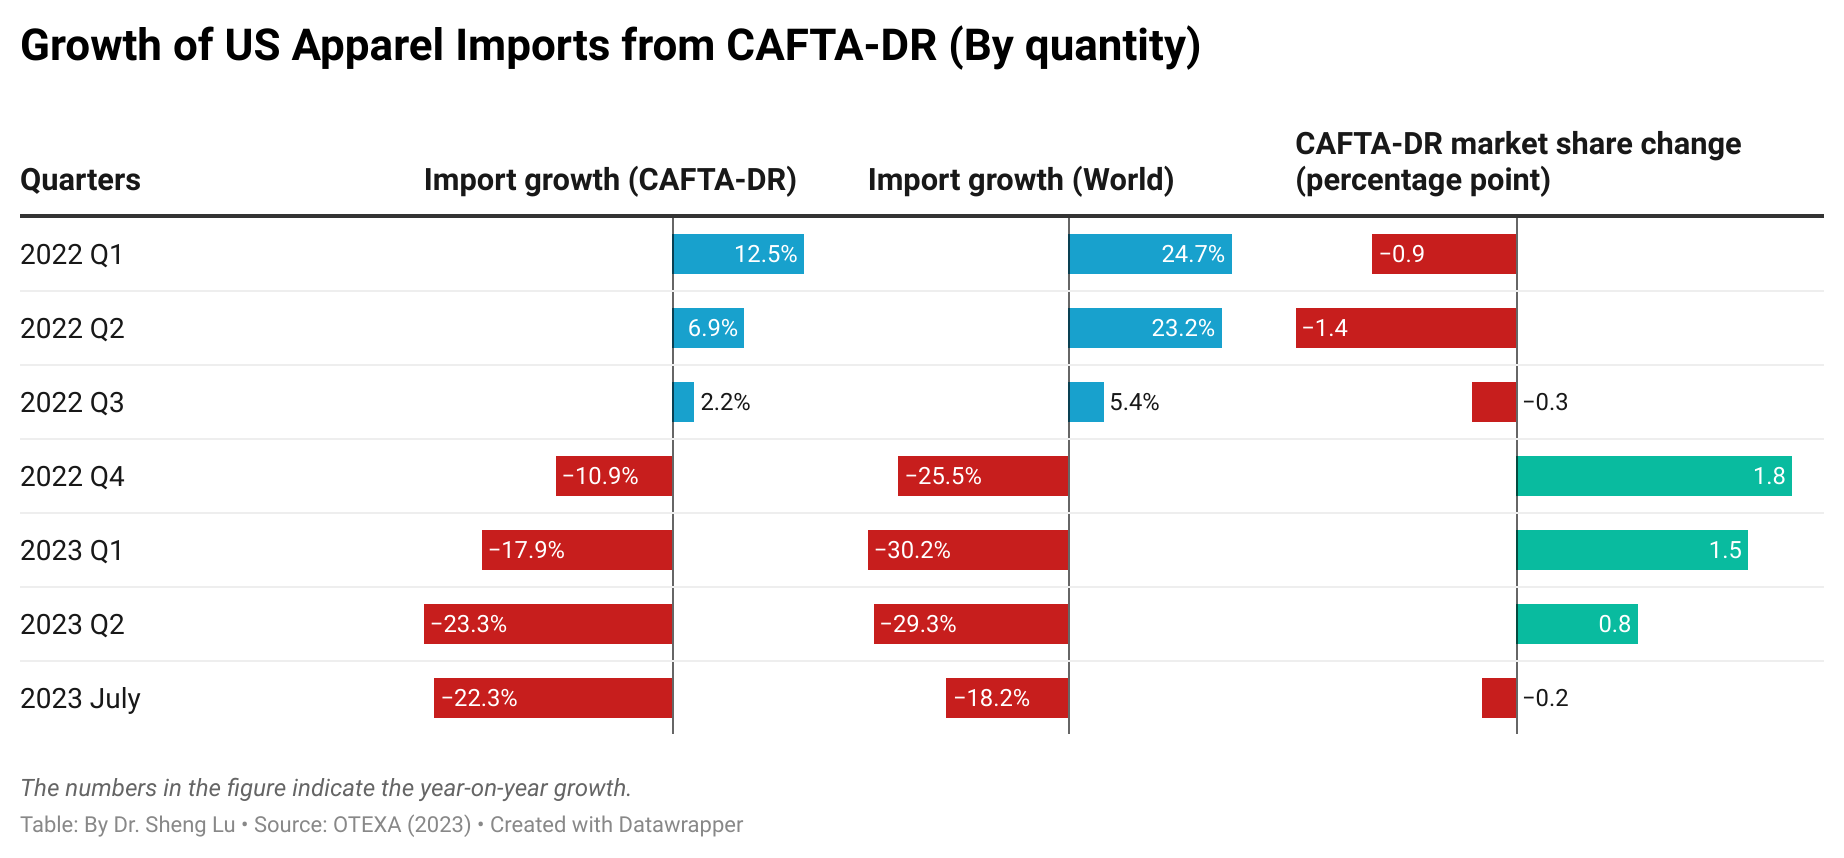
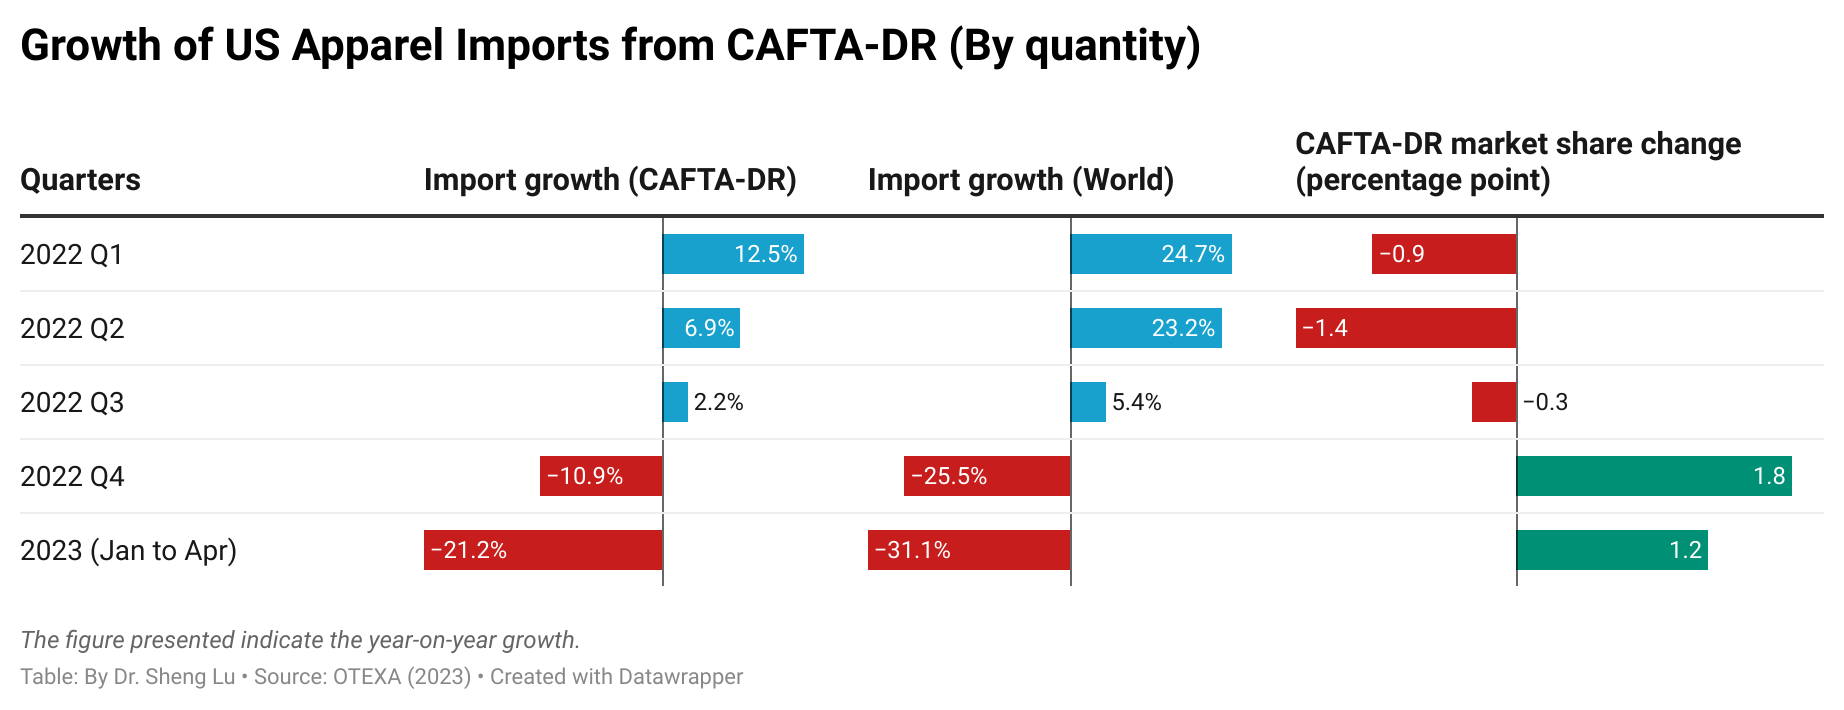
Fourth, the latest data suggests that US apparel imports from CAFTA-DR members remain stagnant, and some critical problems, such as the underutilization of the agreement, even worsened. For example, about 9.5% of US apparel imports in value and 8.5% in quantity came from CAFTA-DR members in July 2023, lower than 10.2% and 9.0% in the previous year (i.e., July 2022). In absolute terms, US apparel imports from CAFTA-DR in 2023 were about 20% lower than in 2022.
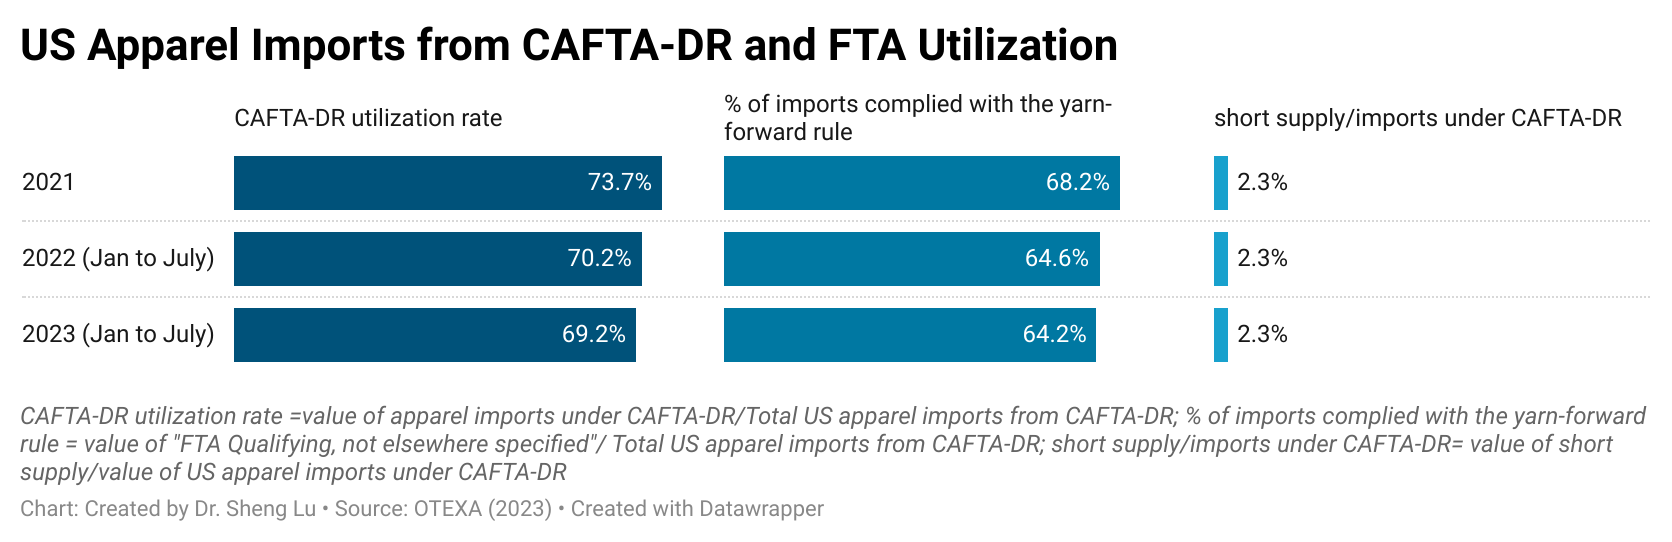
Additionally, CAFTA-DR’s utilization rate (i.e., the value of imports claiming the duty-free benefits under CAFTA-DR divided by the total value of imports from CAFTA-DR) fell from 70.2% in 2022 (Jan to July) to a new low of 69.2% in 2023 (Jan to July). Likewise, the value of imports utilizing CAFTA-DR’s short supply decreased by more than 20%. Thus, how to leverage CAFTA-DR to meaningfully encourage more US apparel imports from the region, particularly in light of US fashion companies’ eagerness to reduce their exposure to China, calls for sustained efforts and probably new strategies.
Discussion questions: What factors contribute to the complexity of eliminating banned Xinjiang cotton from the apparel supply chain? How can the current efforts be enhanced to better address the situation and by whom? Feel free to share any other reflections on the video and the graphs.
#1 What are the examples of globalization in the above two videos about Temu?
#2 Based on the videos, who are the winners and losers of globalization and why?
#3 What role does international trade play in Temu’s business model?
#4 Some suggest ending the “de minimis rule.” Based on the videos, what is your view and recommendation for US policymakers?
#5 Anything you find interesting/surprising/intriguing in the video and why?
(Note: Anyone is welcome to join the discussion. For students in FASH455, please address at least two questions. Please mention the question number in your response, but there is no need to repeat the question).
Note: About “de minimis rule.”: Under US customs law, specifically the Trade Facilitation and Trade Enforcement Act of 2015, import duties are generally waived for goods valued at $800 or less per person per day. Therefore, Temu’s shipping from China to US consumers is likely to be eligible for the benefits.
This article comprehensively reviewed the world textiles and clothing trade patterns in 2022 based on the newly released World Trade Organization Statistical Review 2023 and data from the United Nations (UNComtrade). Affected by the slowing world economy and fashion companies’ evolving sourcing strategies in response to the rising geopolitical tensions, mainly linked to China, the world’s textiles and clothing trade in 2022 displayed several notable patterns different from the past.
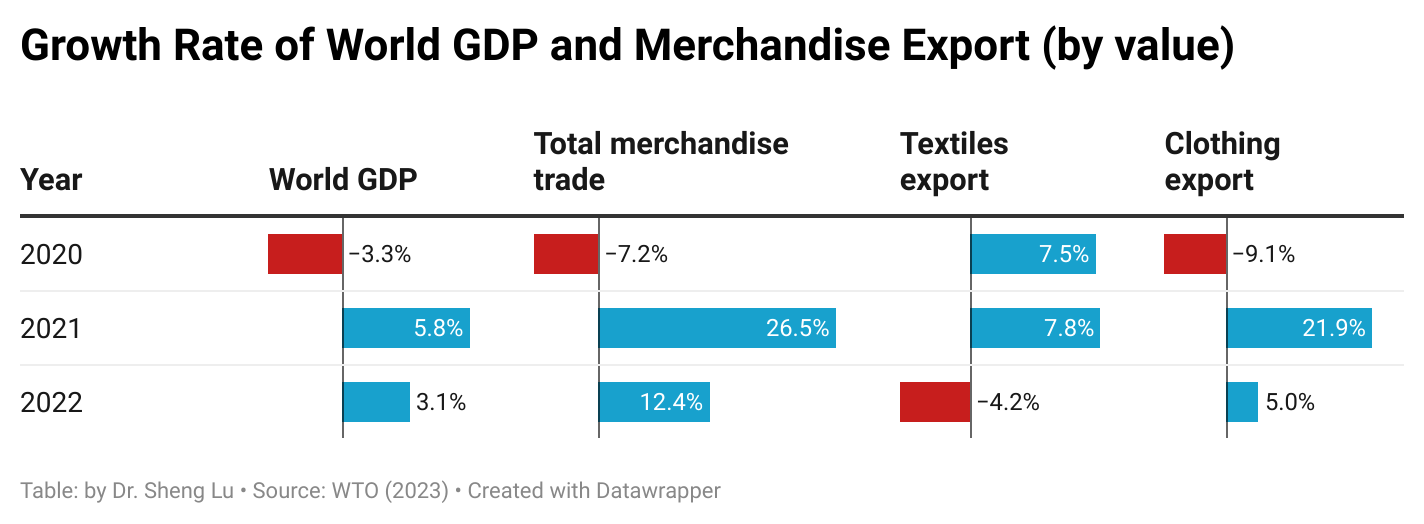
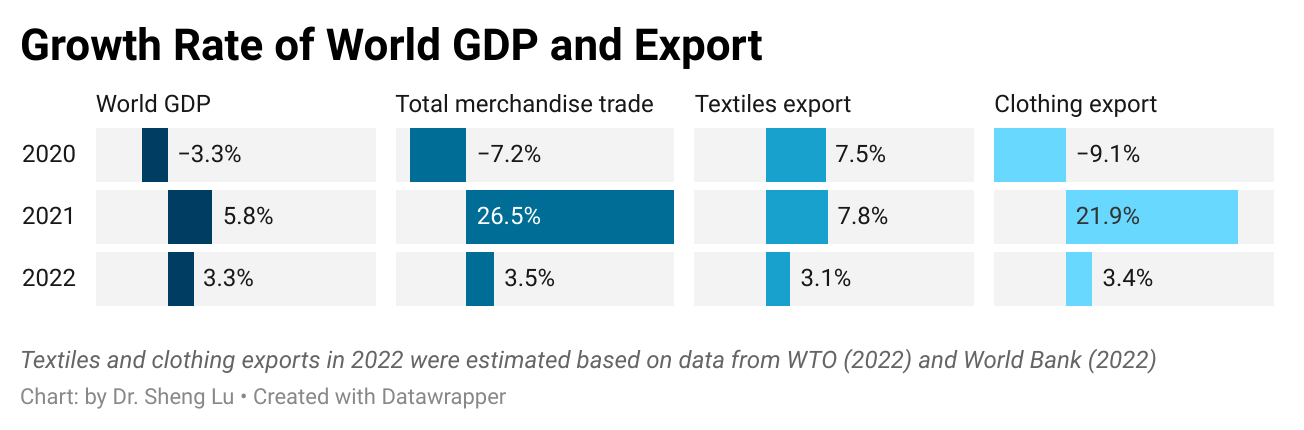
Pattern #1: The expansion of world clothing exports witnessed a notable deceleration in 2022, primarily attributed to the economic downturn. Meanwhile, the world’s textile exports decreased from the previous year, affected by the reduced demand for textile raw materials used to produce personal protective equipment (PPE) as the pandemic waned.
The world’sclothing exports totaled $576 billion in 2022, up 5 percent year over year, much slower than the remarkable 20 percent growth in 2021. The slowed economic growth plus the unprecedented high inflation in major apparel import markets, particularly the United States and Western European countries, adversely affected consumers’ available budget for discretionary expenditures, including clothing purchases.
The world’s textile exports fell by 4.2 percent in 2022, totaling $339 billion, lagging behind most industrial sectors. Such a pattern was understandable as the demand for PPE and related textile raw materials substantially decreased with the pandemic nearing its end.
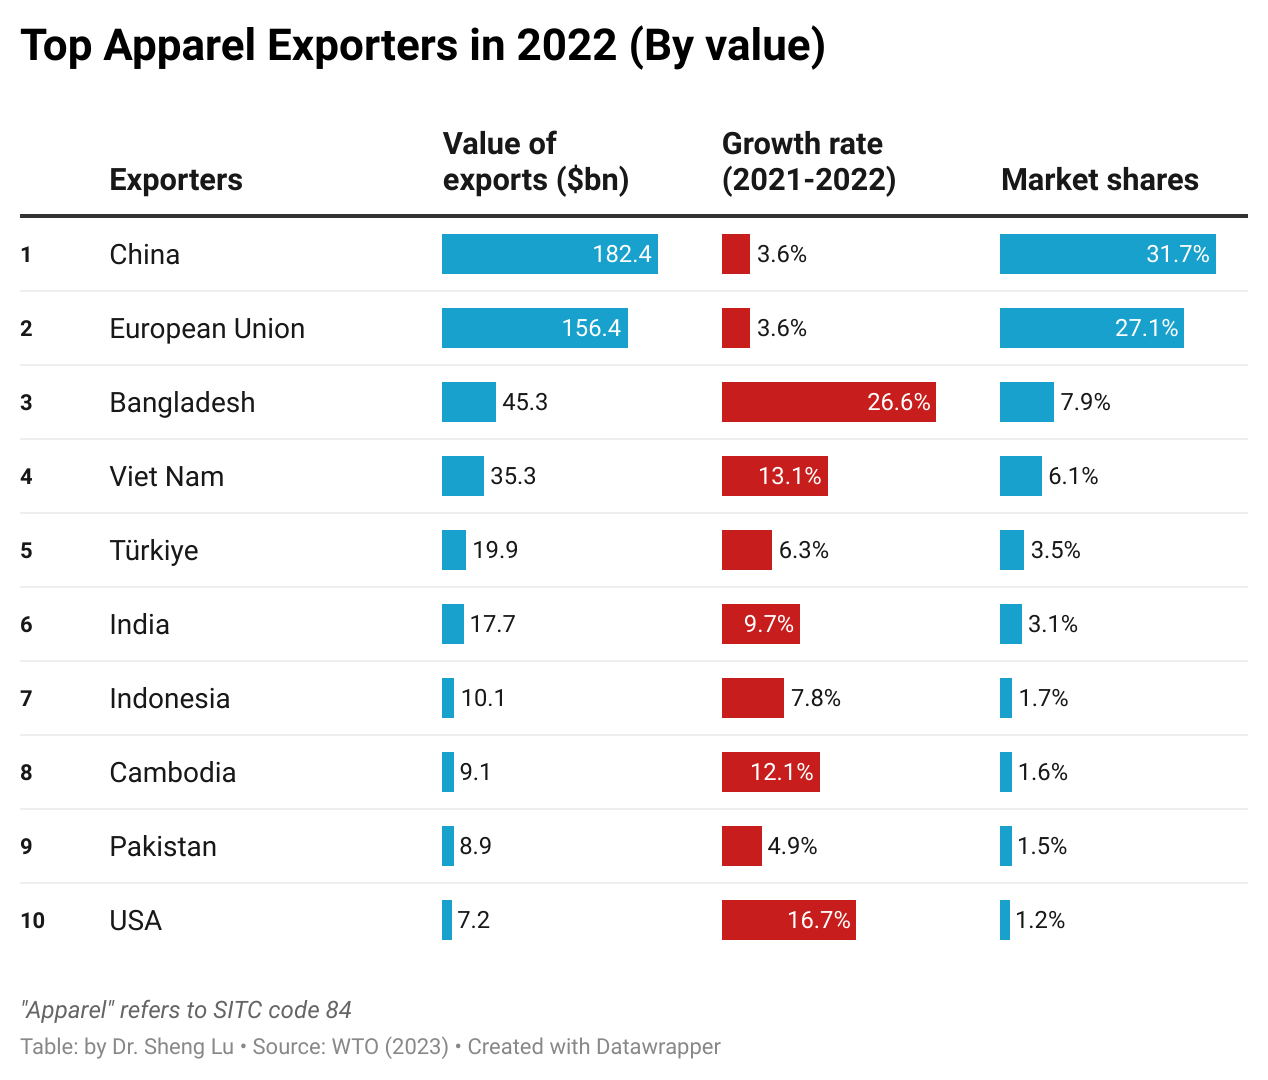
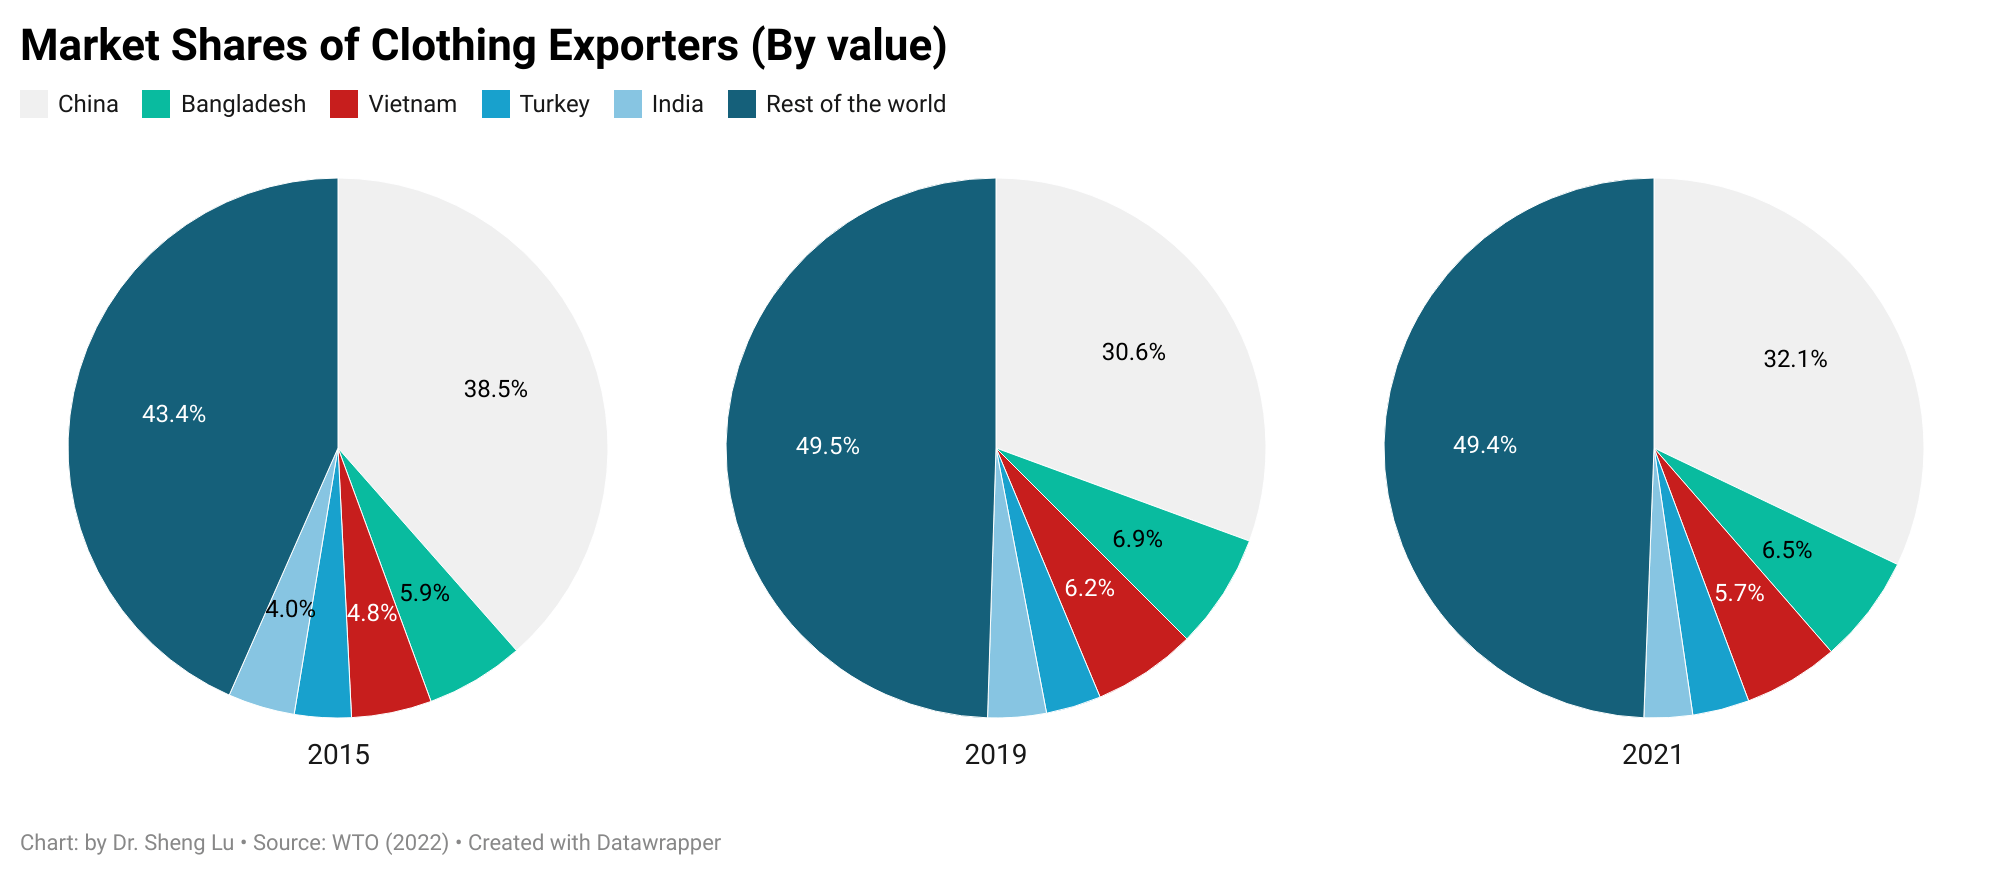
Pattern #2: China continued to lose market share in clothing exports, which benefited other leading apparel exporters in Asia. Notably, for the first time, Bangladesh surpassed Vietnam and ranked as the world’s second-largest apparel exporter in 2022.
In value, China remained the world’s largest apparel exporter in 2022. However, China’s clothing exports experienced a growth of 3.6 percent, below the global average of 5.0 percent, positioning China at the bottom of the top ten exporters.
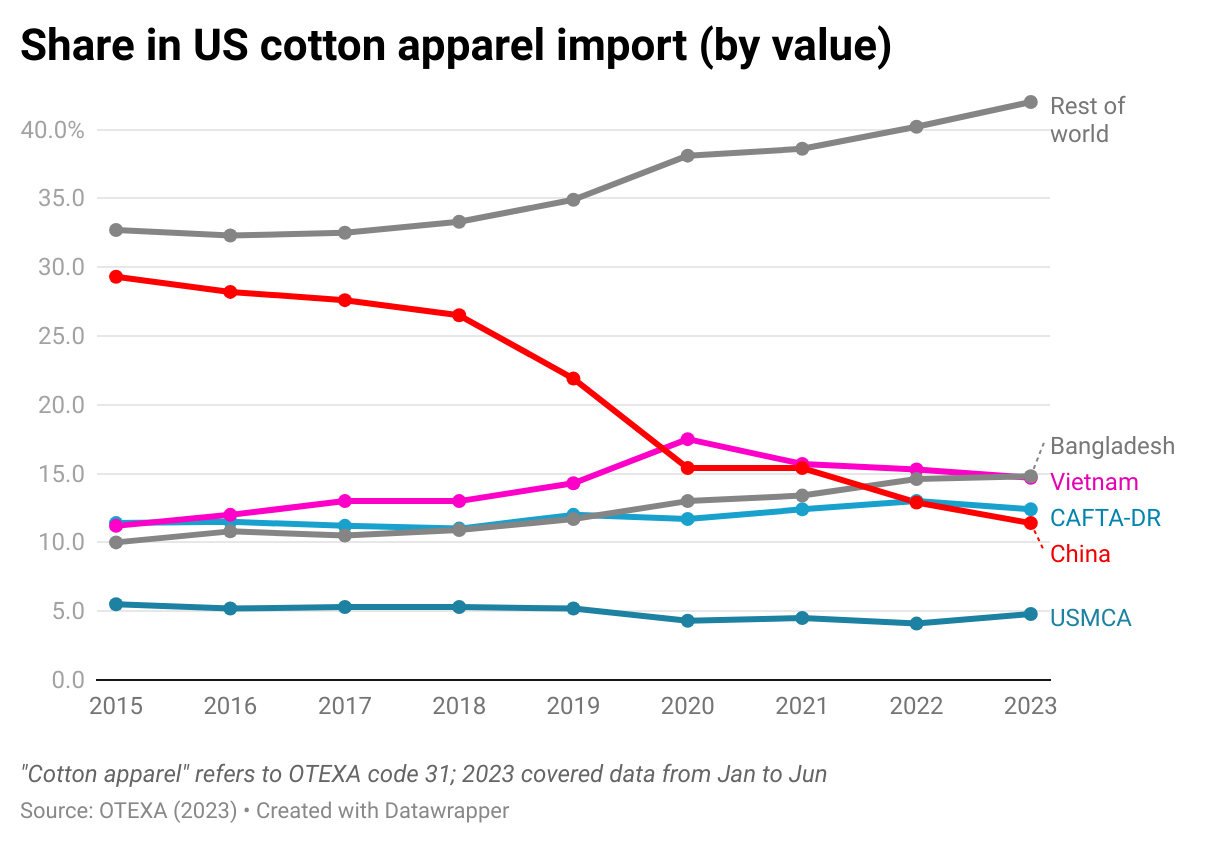
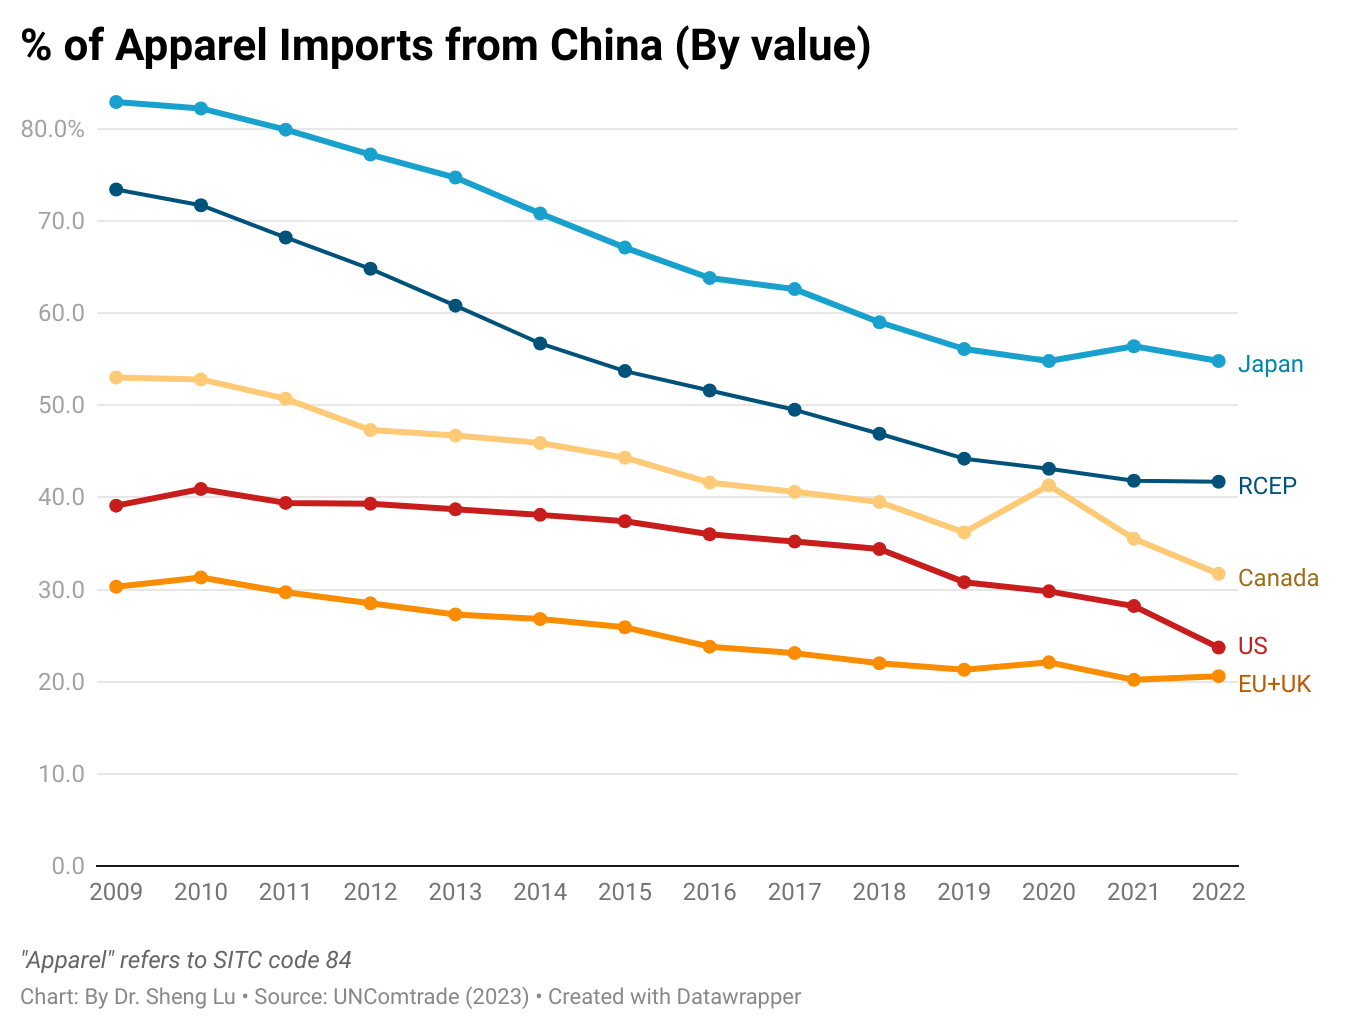
China’s global market share in clothing exports dropped to 31.7 percent in 2022, marking its lowest point since the pandemic and a significant decrease from the approximate 38 percent recorded from 2015 to 2018. In fact, China lost market share in almost all major clothing import markets, including the US, the EU, Canada, and Japan. The concerns about the risks of forced labor linked to sourcing from China and the deteriorating US-China relations were among the primary factors driving fashion companies’ eagerness to reduce their ‘China exposure” further.
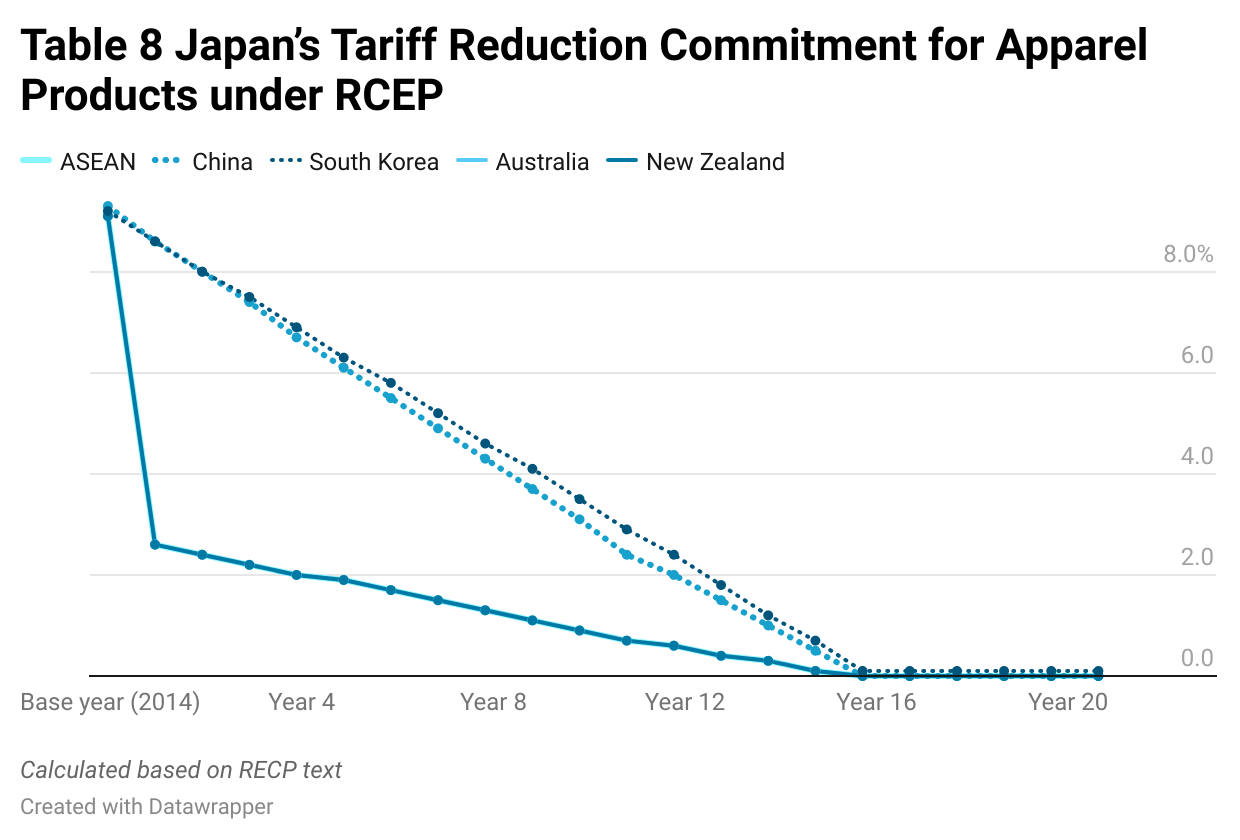
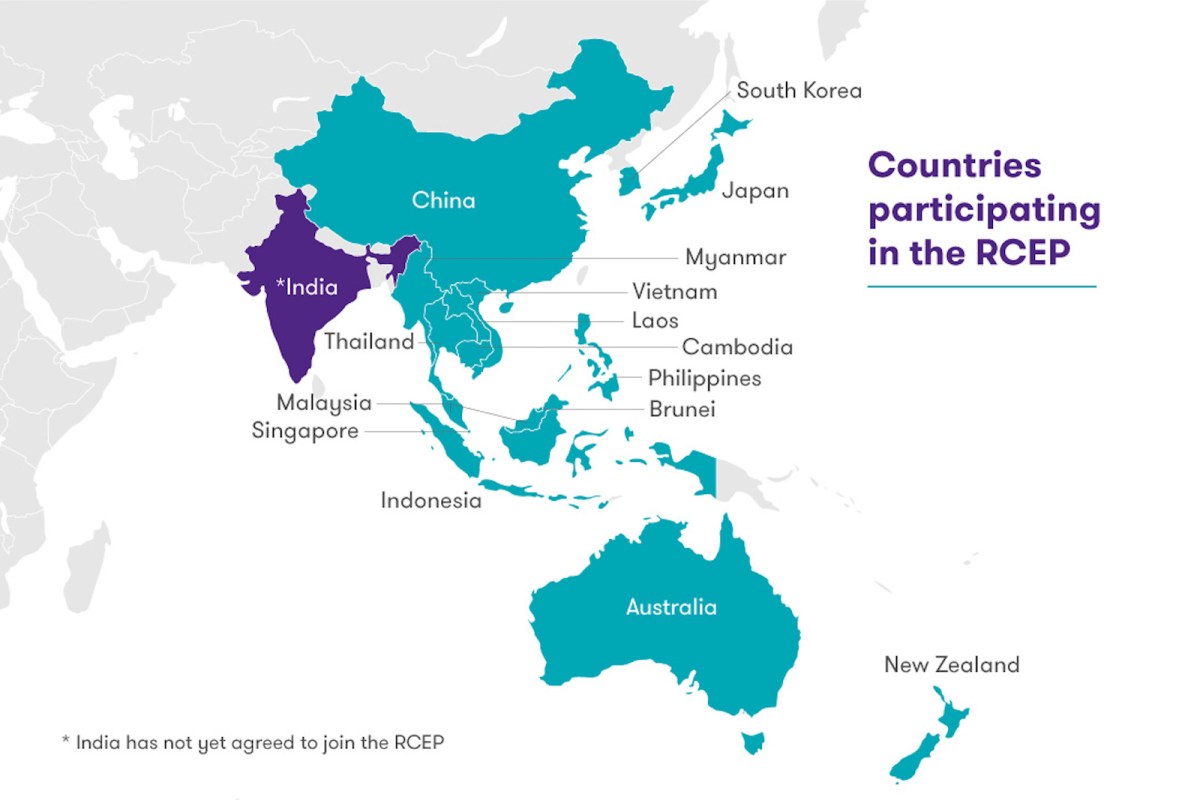
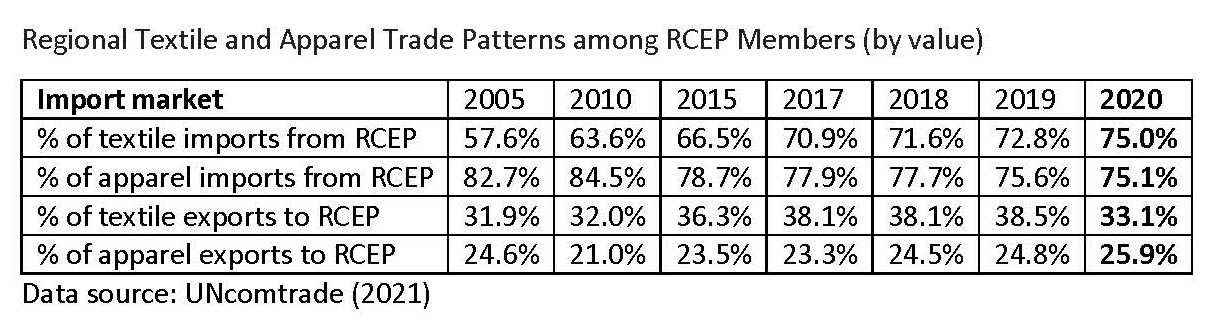
China has been diversifying its clothing exports beyond the traditional Western markets in response to the challenging business environment. For example, from 2021 to 2022, Asian countries, especially members of the Regional Comprehensive Economic Partnership (RCEP), became relatively more important clothing export markets for China. Nevertheless, since RCEP members primarily consist of developing economies with ambitions to enhance their own clothing production, the long-term growth prospects for their import demand of ‘Made in China’ clothing remain uncertain.
Bangladesh achieved a new record high in its market share of world clothing exports, reaching 7.9 percent in 2022, which exceeded Vietnam’s 6.1 percent. Many fashion companies regard Bangladesh as a promising clothing-sourcing destination with growth potential because of its capability to make cotton garments as China’s alternatives, competitive price, and reduced social compliance risks.
Fashion companies’ efforts to “de-risking from China” also resulted in the robust growth of clothing exports from other large-scale Asian clothing producers in 2022, including Vietnam (up 13 percent), Cambodia (up 12 percent), and India (up 10 percent). In other words, despite the concerns about China, fashion companies still treat Asia as their primary sourcing destination.
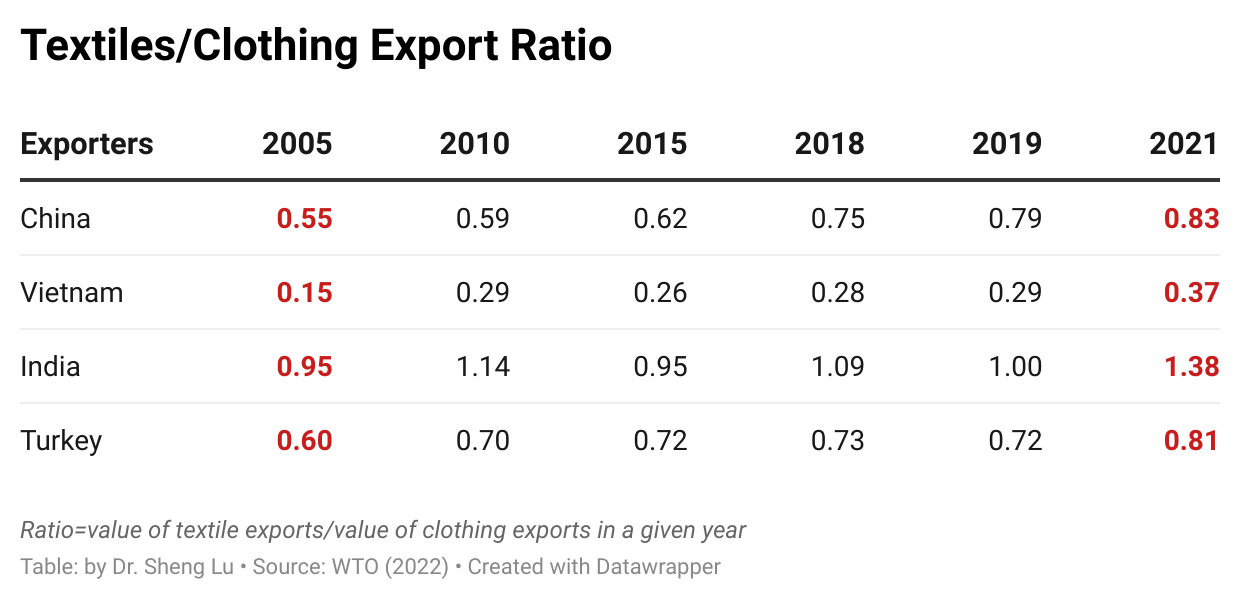
Pattern #3: Developed countries stay critical textile exporters, and middle-income developing countries gradually build new textile production and export capability.
The European Union members and the United States stayed critical textile exporters, accounting for 25.1 percent of the world’s textile exports in 2022, up from 24.5 percent in 2021 and 23.2 percent in 2020. Thanks to the increasing demand from apparel producers in the Western Hemisphere, U.S. textile exports increased by 5 percent in 2022, the highest among the world’s top ten.
As a persistent long-term trend, middle-income developing countries have consistently been strengthening their textile production and export capability. For example, China, Vietnam, Turkey, and India’s market shares in the world’s textile exports have steadily risen. They collectively accounted for 56.8 percent of the world’s clothing exports in 2022, a notable increase from only 40 percent in 2010. Also, over time, these middle-income developing countries have achieved a more balanced textiles-to-clothing export ratio.
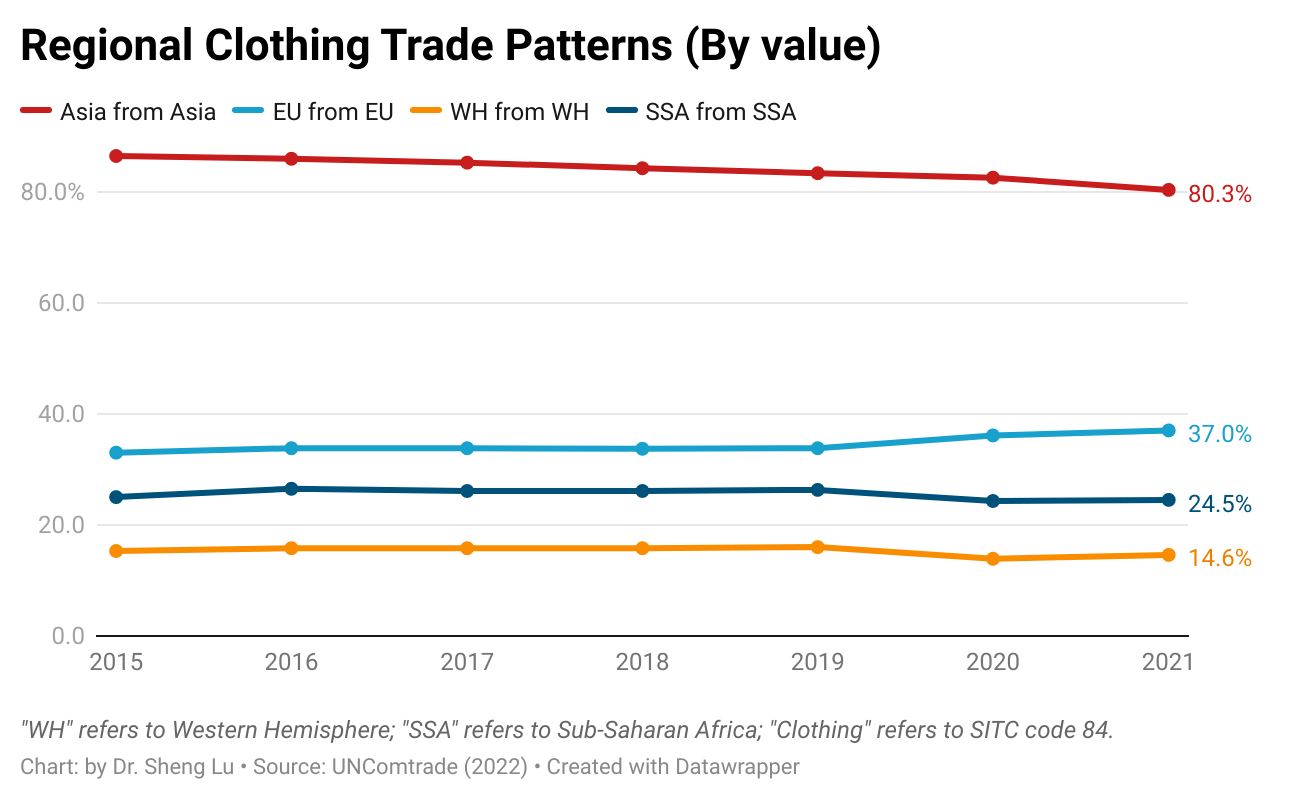
Pattern #4: Regional textile and apparel trade patterns strengthened further with the growing popularity of near-shoring, particularly in the Western Hemisphere. However, an early indication has emerged that Asian countries are diversifying their sources of textile raw materials away from China to mitigate growing risks.
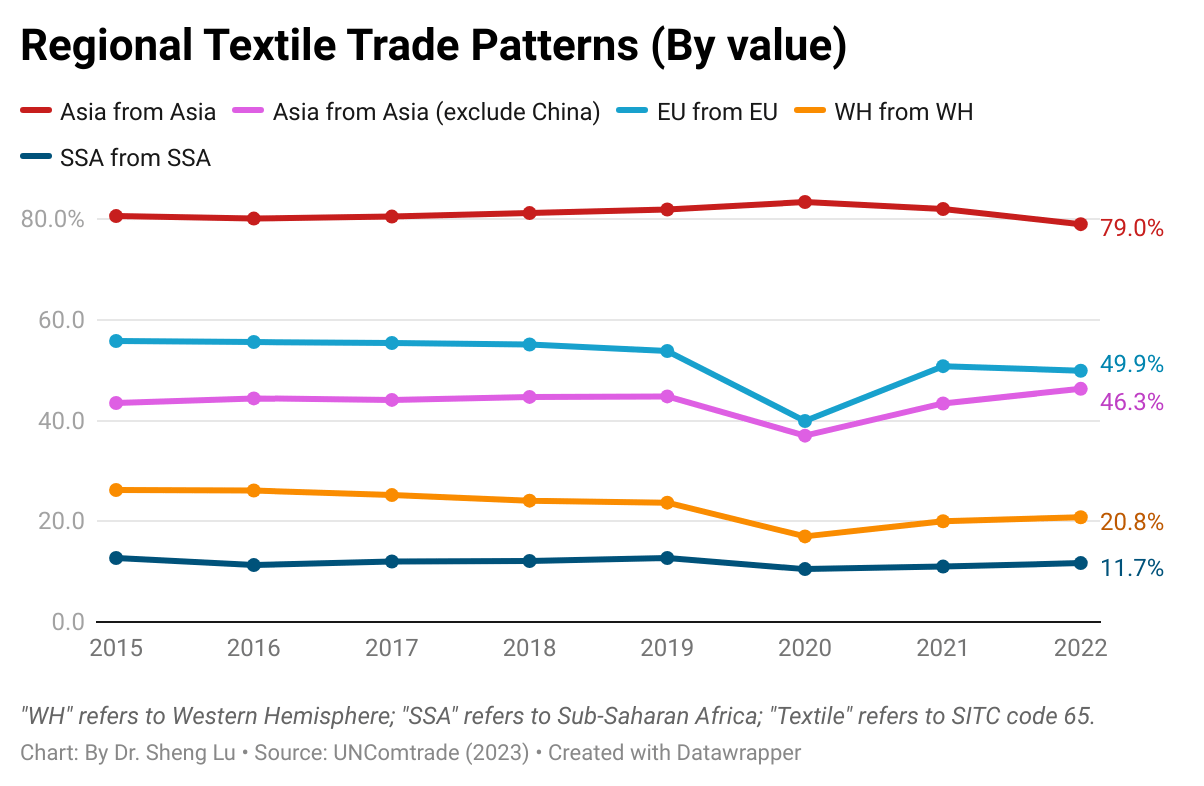
The regional textile and apparel supply chains were in good shape in Asia and Europe. For example, nearly 80 percent of Asian countries’ textile input and apparel imports came from within the region in 2022. Likewise, approximately half of EU countries’ textile imports were intra-region trade in 2022, and one-third were for apparel.
The Western Hemisphere (WH) textile and apparel supply chain became more integrated in 2022 thanks to the booming near-shoring trends. For example, 20.8 percent of WH countries’ textile imports came from within the region in 2022, up from 20.1 percent in the previous year. Likewise, about 15.1 percent of WH countries’ apparel imports came from within the region in 2022, higher than 14.7 percent in 2021 and 13.9 percent in 2022.
Compared with Asia and the EU, SSA clothing producers used much fewer locally-made textiles (i.e., stagnant at around 11% from 2011 to 2022), reflecting the region’s lack of textile manufacturing capability. A more comprehensive examination of strategies for bolstering the textile manufacturing sector in Sub-Saharan Africa, particularly in light of the recently enacted African Continental Free Trade Area (AfCFTA) agreement, might be warranted.
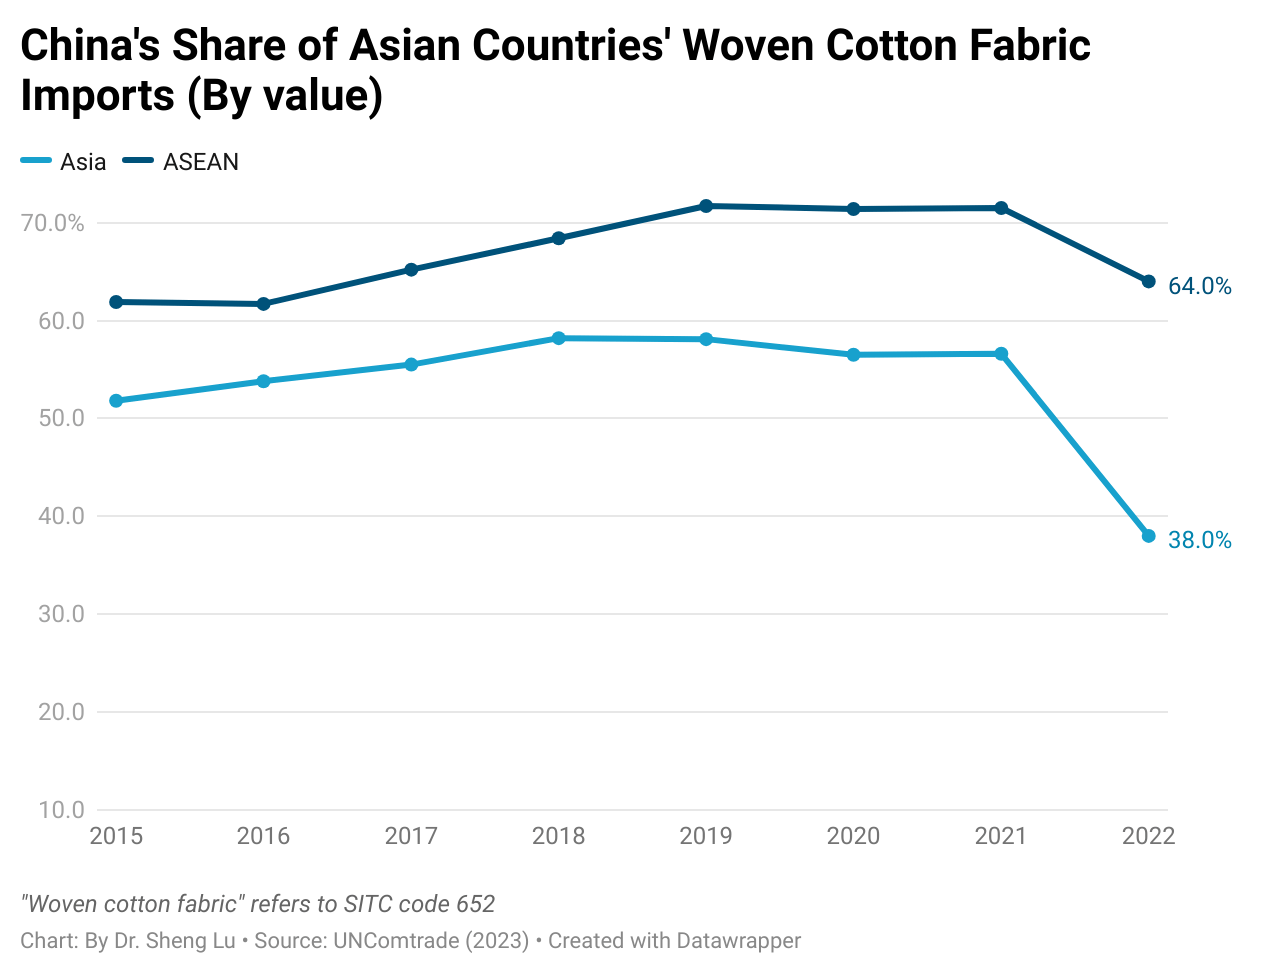
Additionally, data suggests that Asian countries began diversifying their textile imports away from China to mitigate supply chain risks. For example, with the official implementation of anti-forced labor legislation in the US and other primary apparel import markets directly targeting cotton made in China’s Xinjiang region, Asian countries significantly reduced their cotton fabric imports (SITC code 652) from China in 2022. Instead, Asian countries other than China accounted for 46.3 percent of the region’s textile supply in 2022, up from around 42-43 percent between 2019 and 2021.
It is critical to watch how willing, to what extent, and how quickly Asian countries can effectively reduce their dependency on textile supplies from China. The result is also an important reminder that Western fashion companies’ de-risking from China could exert significant and broad impacts across the entire supply chain beyond finished goods.
#1U.S. fashion companies are deeply concerned about the deteriorating U.S.-China bilateral relationship and plan to accelerate “reducing China exposure” to mitigate the risks.
Respondents identified “Finding a new sourcing base other than China” as a more prominent challenge in 2023 than the previous year (i.e., 4th in 2023 vs. 11th in 2022).
This year, over 40 percent of respondents reported sourcing less than 10 percent of their apparel products from China, up from 30 percent of respondents a year ago and a notable surge from only 20 percent in 2019. Similarly, a new record high of 61 percent of respondents no longer use China as their top supplier in 2023, up from 50 percent of respondents in 2022 and much higher than only 25-30 percent before the pandemic.
Nearly 80 percentof respondents plan to reduce apparel sourcing from China over the next two years, with a record high of 15 percent planning to “strongly decrease” sourcing from the country. This strong sentiment was not present in past studies. Notably, large-size U.S. fashion companies (with 1,000+ employees) that currently source more than 10 percent of their apparel products from China are among the most eager to de-risk.
#2 Tackling forced labor risks in the supply chain remains a significant challenge confronting U.S. fashion companies in 2023.
“Managing the forced labor risks in the supply chain” ranks as the 2nd top business challenge in 2023, with 64 percent of respondents rating the issue as one of their top five concerns.
Most surveyed U.S. fashion companies have taken a comprehensive approach to mitigating forced labor risks in the supply chain. Three practices, including “asking vendors to provide more detailed social compliance information,” “attending workshops and other educational events to understand related regulations better,” and “intentionally reducing sourcing from high-risk countries,” are the most commonly adopted by respondents (over 80 percent) in response to forced labor risks and the UFLPA’s implementation.
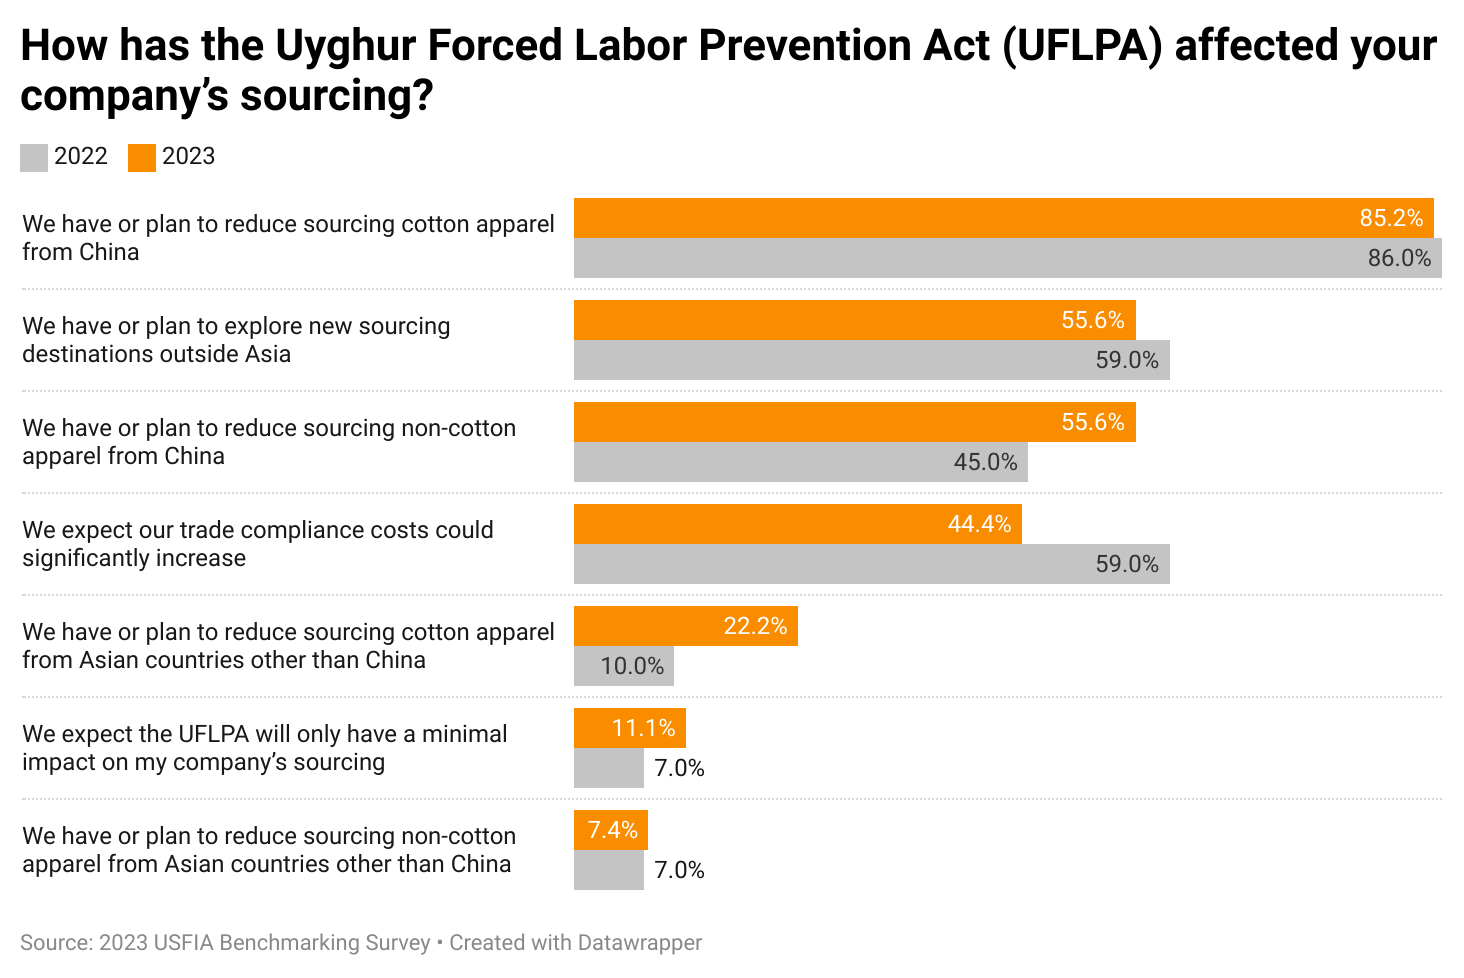
Since January 1, 2023, U.S. Customs and Border Protection (CBP)’s UFLPA enforcement has affected respondents’ importation of “Cotton apparel products from China,” “Cotton apparel products from Asian countries other than China,” and “Home textiles from China.”
U.S. fashion companies are actively seeking to diversify their sourcing beyond Asia to mitigate the forced labor risks, particularly regarding cotton products.
#3 There is robust excitement about increasing apparel sourcing from members of the Dominican Republic-Central America Free Trade Agreement (CAFTA-DR).
CAFTA-DR members play a more significant role as an apparel sourcing base this year. Over 80 percent of respondents report sourcing from CAFTA-DR members in 2023, a notable increase from 60 percent in the past few years. Also, nearly 30 percent of respondents placed more than 10 percent of their sourcing orders with CAFTA-DR members this year, a substantial increase from only 19 percent of respondents in 2022 and 10 percent in 2021.
About 40 percent of respondents plan to increase apparel sourcing from CAFTA-DR members over the next two years. Most respondents consider expanding sourcing from CAFTA-DR as part of their overall sourcing diversification strategy.
With U.S. fashion companies actively seeking immediate alternatives to sourcing from China and Asia, respondents emphasize theincreased urgencyof improving textile raw material access to promote further U.S. apparel sourcing from CAFTA-DR members. “Allowing more flexibility in sourcing fabrics and yarns from outside CAFTA-DR” was regarded as the top improvement needed.
#4 US fashion companies demonstrate a solid dedication to expanding their sourcing of clothing made from recycled or other sustainable textile fibers:
Nearly 60 percent of respondents say at least 10 percent of their sourced apparel products already use recycled or other sustainable textile fibers. Another 60 percent of surveyed companies plan to “substantially increase sourcing apparel made from sustainable or recycled textile materials over the next five years.”
Addressing the higher sourcing costs and the low-profit margins are regarded as the top challenge for sourcing clothing using recycled or other sustainable fiber.
About 60 percent of respondents also call for policy support for sourcing clothing using recycled or other sustainable textile materials, such as preferential tariff rates and guidance on sustainability and recycling standards.
#5 Respondents strongly support and emphasize the importance of the early renewal of the African Growth and Opportunity Act (AGOA) and extending the program for at least another ten years.
Respondents sourcing from AGOA members are typically large-scale U.S. fashion brands or retailers (with 1,000+ employees). Generally, these companies treat AGOA as part of their extensive global sourcing network and typically source less than 10 percent of the total sourcing value or volume from the region.
About 40 percent of respondents view AGOA as “essential for my company to source from AGOA members.”
About 60 percent of respondents say the temporary nature of AGOA “has discouraged them from making long-term investments and sourcing commitments in the region.” Many respondents expect to cut sourcing from AGOA members should the agreement is not renewed by June 2024.
About one-third of respondents currently sourcing from AGOA explicitly indicate, “Ethiopia’s loss of AGOA eligibility negatively affects my company’s interest in sourcing from the entire AGOA region.” In comparison, only about 17 percent of respondents say they “have moved sourcing orders from Ethiopia to other AGOA members.
Other topics covered by the report include:
5-year outlook for the U.S. fashion industry, including companies’ hiring plan by key positions
The competitiveness of major apparel sourcing destinations in 2023 regarding sourcing cost, speed to market, flexibility & agility, and compliance risks (assessed by respondents)
Respondents’ qualitative comments on the prospect of sourcing from China and “re-risk”
U.S. fashion companies’ latest social responsibility and sustainability practices related to sourcing
U.S. fashion companies’ trade policy priorities in 2023
Background
This year’s benchmarking study was based on a survey of executives from 30 leading U.S. fashion companies from April to June 2023. The study incorporated a balanced mix of respondents representing various businesses in the U.S. fashion industry. Approximately 73 percent of respondents were self-identified retailers, 60 percent self-identified brands, and 65 percent self-identified importers/wholesalers.
The respondents to the survey included both large U.S. fashion corporations and medium to small companies. Around 77 percent of respondents reported having more than 1,000 employees. And the rest (23 percent) represented medium to small-sized companies with 100-999 employees.
A new study released by the Hinrich Foundation in July 2023 evaluated the impact of the implementation of the Uyghur Forced Labor Prevention Act (UFLPA) on Vietnam’s textile and apparel industry.
The study’s findings were based on interviews with “senior leaders and owners of Vietnam’s garment and textile small and medium-sized enterprises (SMEs).” (Note: However, the study didn’t specify when and how many interviews were conducted.) Below are the summarized key findings:
#1: Vietnam’s textile and apparel industry heavily uses cotton imported from China. As noted in the study, in 2021, China accounted for nearly 30% of Vietnam’s cotton imports (ranked #1, $1.48 billion out of total $4.99 billion imports), surpassing the US ($1.05 billion).
#2: Vietnam’s garment exports may contain Xinjiang cotton. According to the study, “Once the cotton arrives in Vietnam, international intermediary manufacturers create finished garments from semi-finished products to export globally, often using the same materials from banned Chinese suppliers. This results in the ‘laundering’ of Xinjiang cotton.”
#3: Vietnam textile and apparel SMEs report challenges in proving the origin of cotton in fabrics. For example, one respondent says, “Differentiating between cotton products coming from different sources is challenging as they might have been blended while being transported by sea. Suppliers from China, Vietnam, Bangladesh, India, and Pakistan may engage in this practice to falsely label Xinjiang cotton as coming from other locations to circumvent this act.”
#4: Vietnam’s textile and apparel SMEs say the UFLPA implementation has negatively affected their exports to the United States.
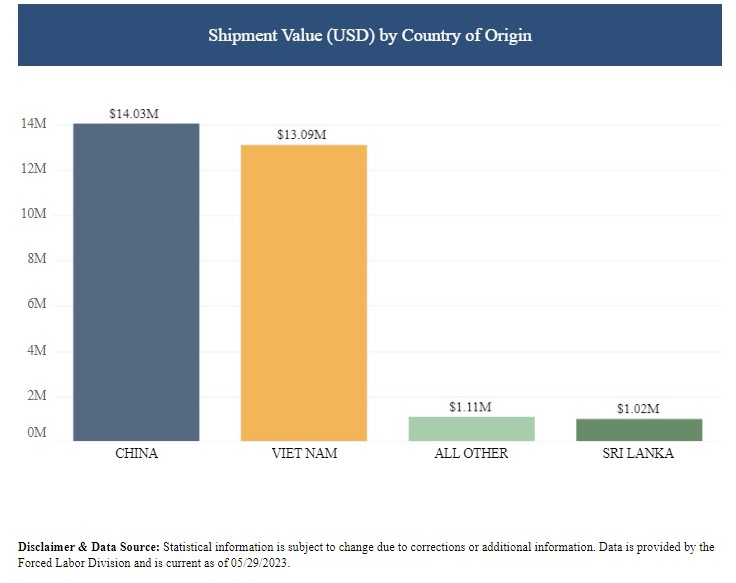
CBP’s statistics show that (current as of July 1, 2023), since UFLPA’s implementation in June 2022, a more significant amount of Vietnam’s textiles, apparel, and footwear were affected by law enforcement than those from China (e.g., $20 million vs.$16.2 million investigated and $3.53 million vs.$1.04 million denied access).
US fashion companies are sourcing LESS from Vietnam due to forced labor concerns. According to one respondent, “My company is producing apparel products for several US-based fashion brands and uses materials from China and exports to the US. Since UFLPA was in place in June 2022, they have ordered less from us. It seems that our partners feel pressure from the regulators, so they are looking for alternative risk-free suppliers.”
The surveyed SMEs also expect MORE of Vietnam’s textile and apparel exports to be investigated under the UFLPA enforcement down the road. Some SMEs commented that “it would be hard for US firms to rapidly find alternative suppliers in a short time, therefore more checks on Vietnamese cargoes are to be expected.”
The study acknowledges that “In the worst-case scenario, Vietnamese SMEs may lose market access if their American importers are unable to verify that the supply chain is free from inputs produced via forced labor.”
#5: UFLPA also increased the trade compliance costs of “Made in Vietnam,” a significant challenge to many SMEs. One respondent commented, “Compliance with the UFLPA may pose a challenge for SMEs due to the higher costs associated with providing the necessary documentation of their supply chains. This could be due to the need to conduct additional audits, hire external consultants, or implement new tracking systems.”
Additionally, the report called for Vietnam’s textile and apparel SMEs to 1) diversify the supply chain, especially using more cotton imports from the US, India, Australia, and Brazil. 2) enhance supply chain traceability (note: how to make it happen remains a big question mark); 3) engage in dialogue with US authorities.
The latest OTEXA trade data suggests several US apparel import patterns:
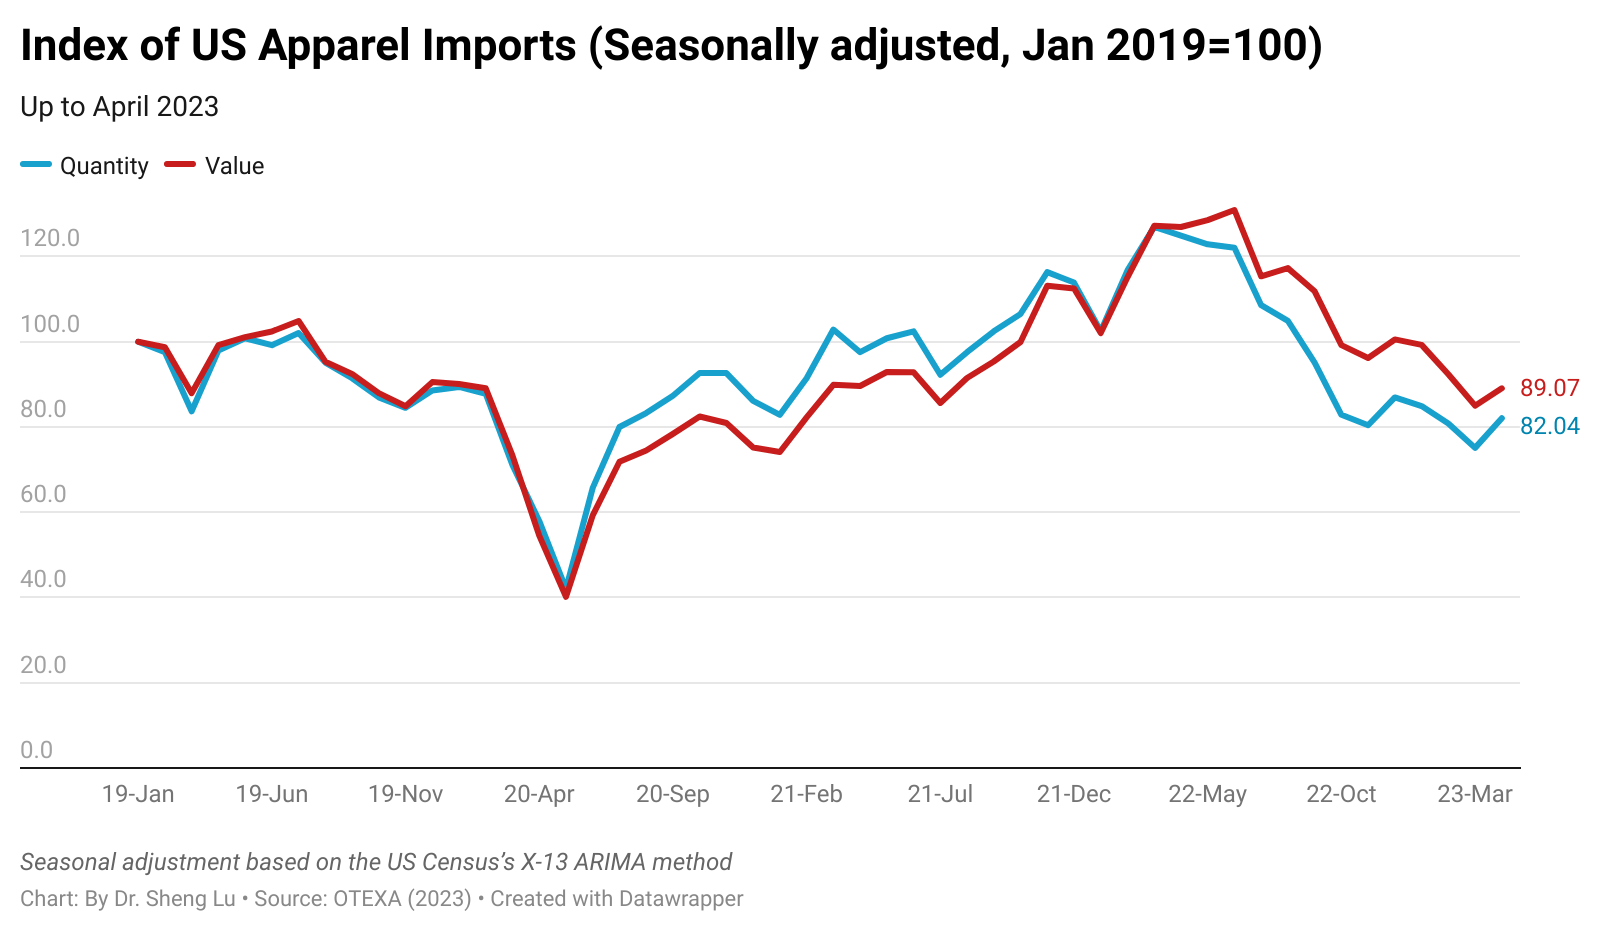
First, US apparel imports indicated a slow improvement in April 2023 but remained weak this year. For example, measured in quantity, US apparel imports fell by 33.9% in April 2023 from a year ago, but it was less significant than in March (i.e., down 40.2% YoY*). Likewise, measured in value, US apparel imports fell by 29.3% YoY in April 2023, which improved from a 32.7% YoY decline in March 2023. (*YoY: Year-over-year)
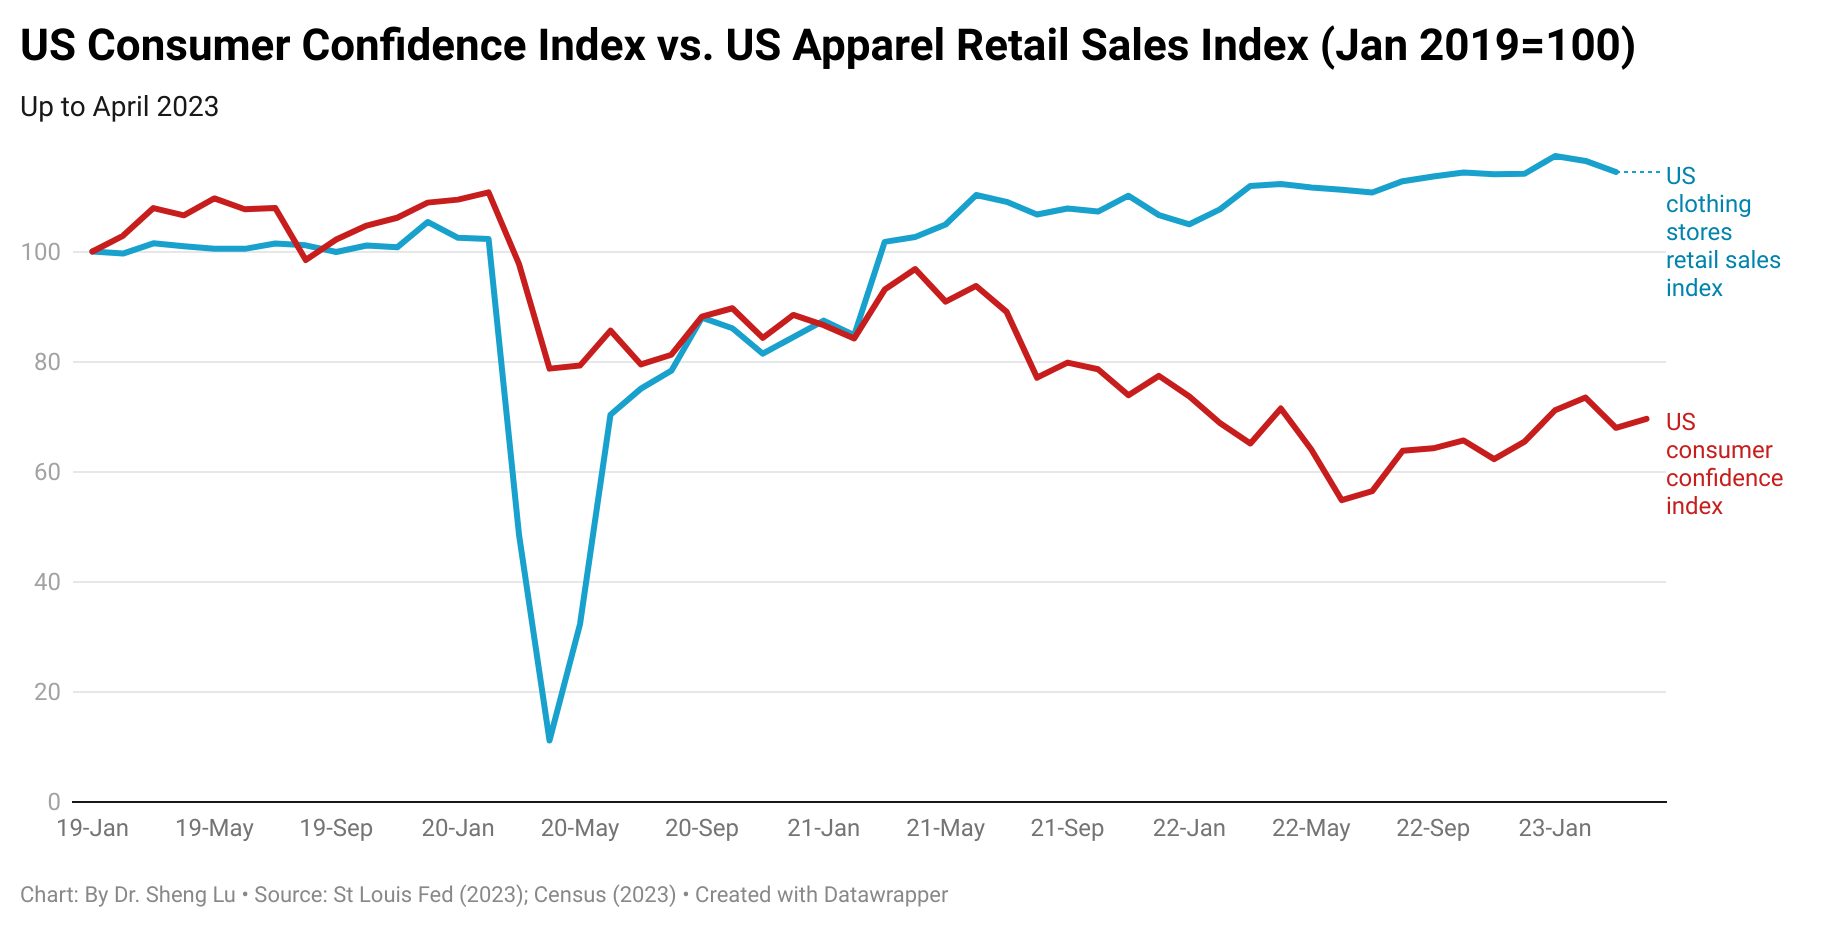
Overall, the shrinking US apparel import volume reflected the headwinds in the US economy and consumers’ hesitancy to purchase clothing amid financial uncertainties and high inflation. Recent economic indicators also present a mixed picture of the US economy’s growth trajectory. For example, while the US consumer confidence index slightly went up from 68.0 in March to 69.6 in April 2023 (January 2019=100), the advanced clothing store sales index in April fell to 115.6 (Jan 2019=100), the lowest so far in 2023 (e.g., was 120.6 in January 2023). However, since summer is traditionally a peak season for clothing sales, followed by events like back-to-school shopping, there remains hope that US apparel imports may experience a slight recovery at some point in the second half of the year.
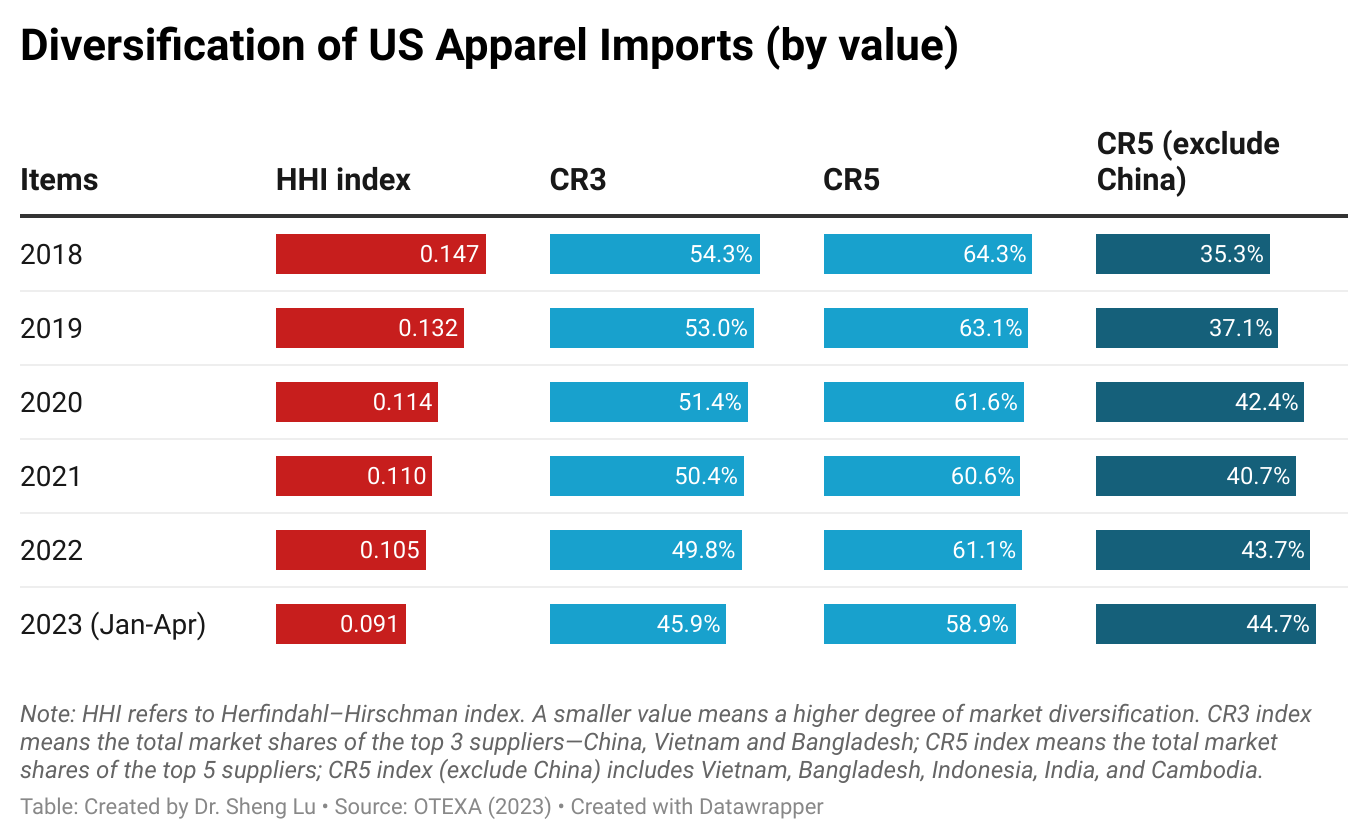
Second, trade data suggested that US apparel imports came from more diverse sources. For example, the Herfindahl–Hirschman index (HHI) fell below 0.1 in the first four months of 2023. Likewise, the market shares of the five largest suppliers (CS5) fell below 60% for the first time since 2018. The result suggested that leveraging sourcing diversification is a prevalent strategy among US fashion companies to mitigate supply chain risks and address market uncertainties.
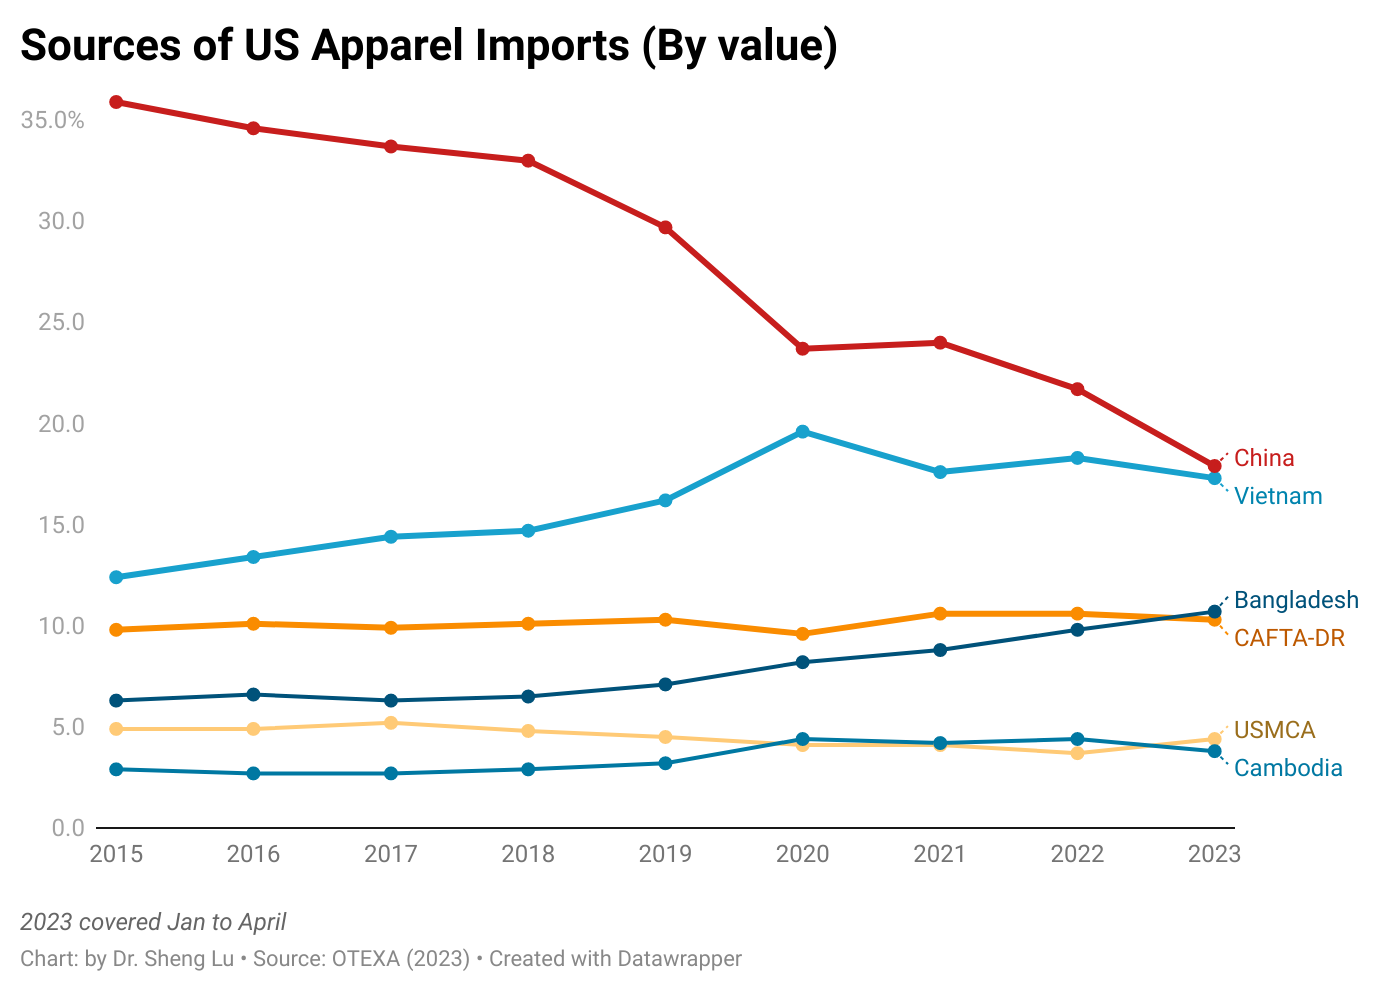
Third, US fashion companies are serious and eager to further reduce their “China exposure.” Although China remained the top apparel supplier to the US, its market share fell to a new low of 17.9% in value and 30.6% in quantity in the first four months of 2023. Notably, for the first time in decades, less than 10% of US cotton apparel imports came from China in March/April 2023, revealing the significant impact of the Uyghur Forced Labor Prevention Act (UFLPA) on US fashion companies’ China sourcing strategies.
Related, US fashion companies appear to be increasingly cautious about sourcing apparel from Vietnam as its supply chain is too exposed to China, raising concerns about forced labor risks. In value, Vietnam accounted for 17.3% of US apparel imports in the first four months of 2023, down from 18.6% a year ago. Notably, almost the same amount of Vietnam’s textile and apparel products were subject to the CBP’s UFLPA investigation as China in FY2023.
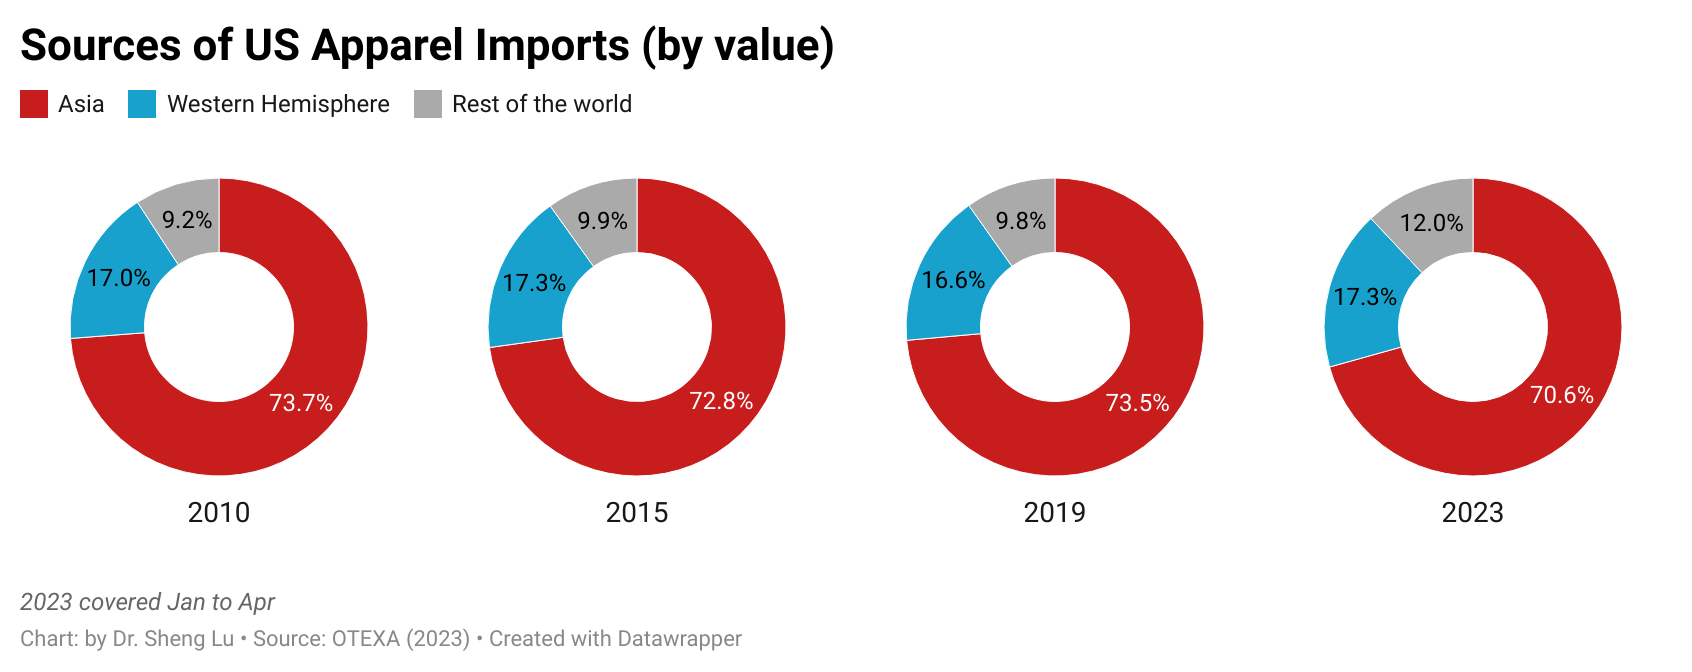
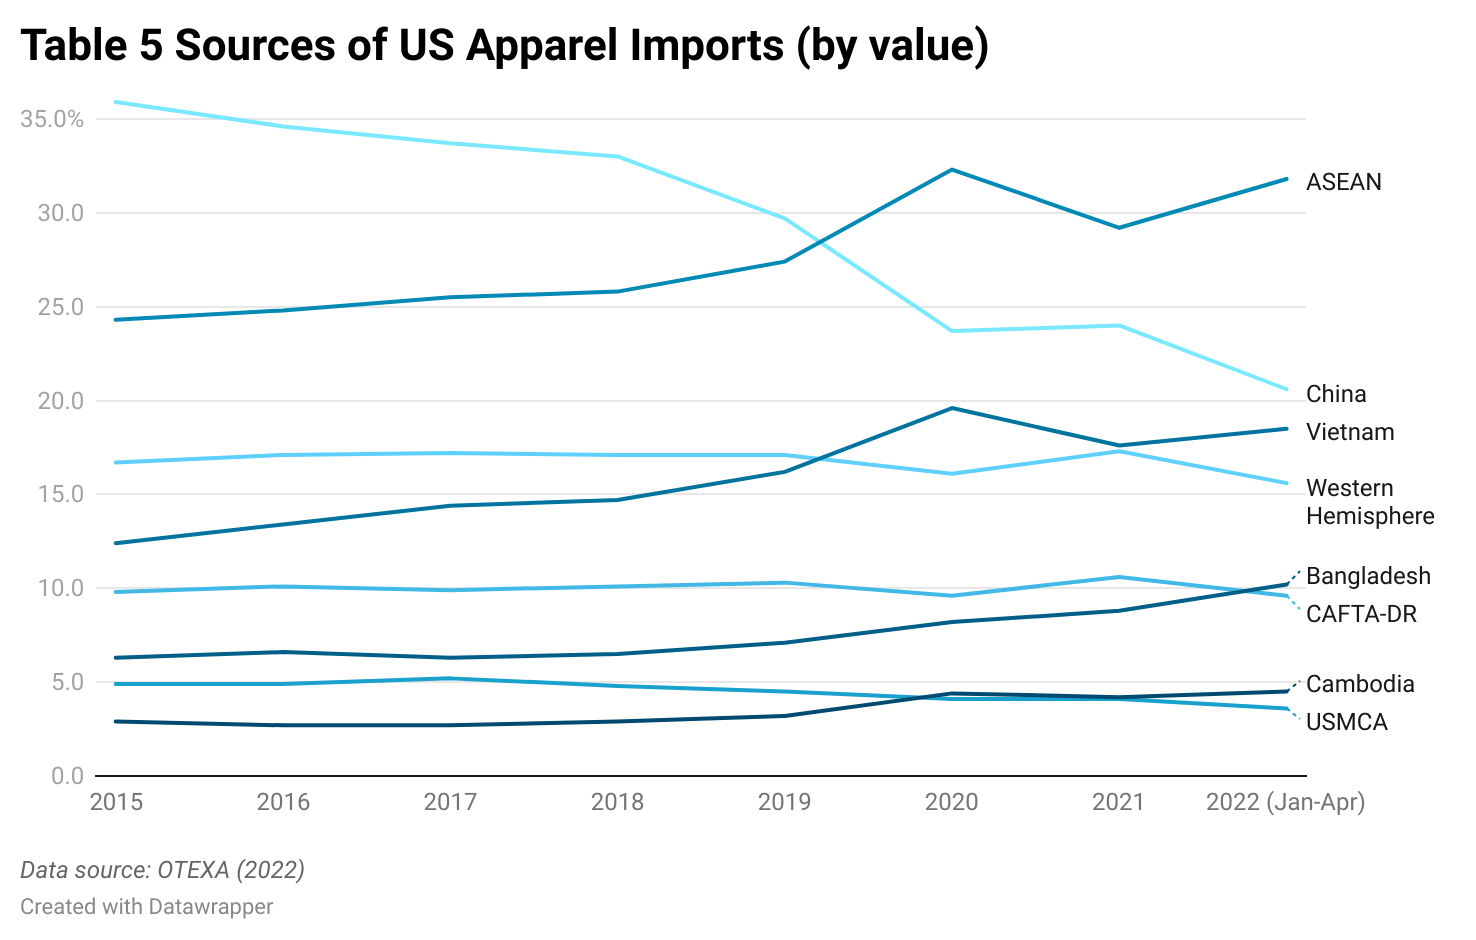
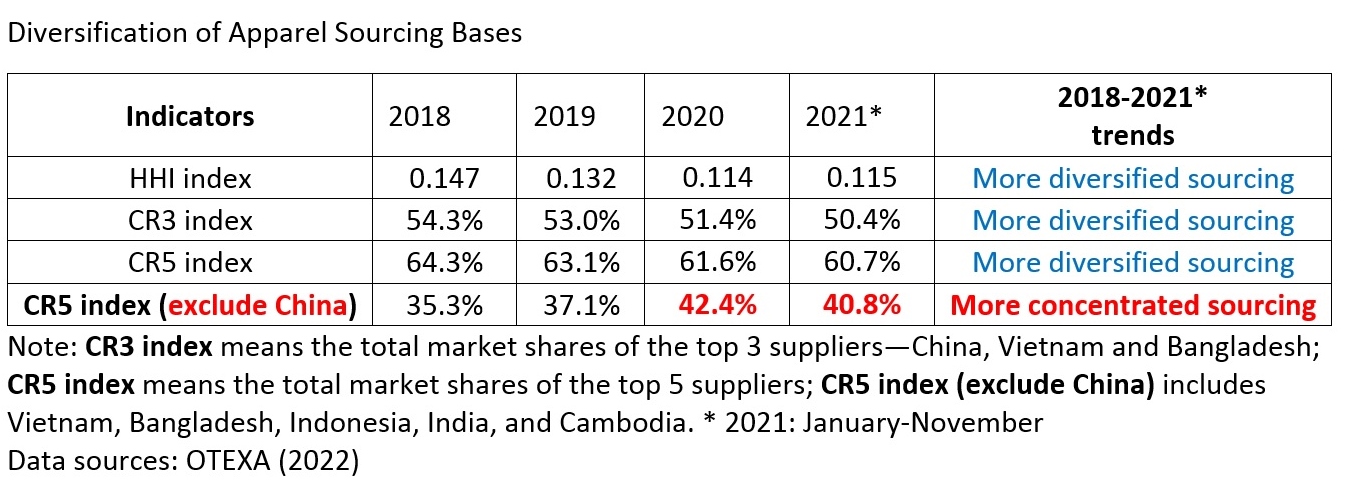
Fourth, large-scale Asian countries benefited the most as US fashion companies looking for China’s alternatives. Specifically, measured in value, about 70.6% of US apparel imports came from Asia in the first four months of 2023, down from 74.9% in 2022. However, the five largest apparel exporting countries in Asia other than China (i.e., Vietnam, Bangladesh, Indonesia, India, and Cambodia) accounted for 44.7% of US apparel imports in the first four months of 2023, a new high since 2018 (i.e., was 35.3%). These countries are among the most popular “alternatives to China” because of their balanced performance regarding production capacity, cost, flexibility, and compliance risks.
Fifth, US fashion companies are also actively exploring new near-shoring opportunities from the Western Hemisphere. For example, about 17.3% of US apparel imports came from Western Hemisphere countries in the first four months of 2023, up from 15.6% in 2023. That being said, measured in quantity, US apparel imports from Mexico and CAFTA-DR members fell by 13.0% and 21.2% in the first four months of 2023 from a year ago due to the struggling US economy. It will be interesting to see whether CAFTA-DR and Mexico can keep or enhance their market shares when the US import demand recovers.
Background: What sets Shein and Temu’s sourcing strategies apart from other US fashion brands?
Leading US fashion companies have increasingly turned to sourcing diversification to reduce supply chain risks and market uncertainties. For example, industry surveys and firm-level analyses consistently found that prominent US fashion brands and retailers typically source from more than 10-20 countries. Notably, “reducing China exposure” is a growing trend among US fashion companies, given the concerns about the rising US-China trade tensions and geopolitics.
Instead, Temu and Shein are notable for their reliance on Chinese suppliers, with Temu primarily shipping products directly from China rather than US-based distribution centers. This business model may be explained by two factors.
One is to leverage China’s strengths in making apparel products with greater varieties and smaller quantities. In other words, while countries like Bangladesh and Cambodia may be better suited for sourcing large orders, “Made in China” can remain overall price competitive for a wide range of products requiring a smaller minimum order quantity. In this way, China can offer greater flexibility to Temu, which intends to manufacture various products while controlling costs.
Another possible reason is to take advantage of the “de minimis rule.” Under US customs law, specifically the Trade Facilitation and Trade Enforcement Act of 2015, import duties are generally waived for goods with a value of $800 or less per person per day. Therefore, Temu’s shipping from China to US consumers is likely to be eligible for the benefits.
Discussion question: What shall we do about Shein?
USITC adopted two methods to estimate Section 301 tariffs’ economic impacts:
Econometric model estimates using monthly trade data (10-digit HS code) from January 2017 to December 2021.
A set of partial equilibrium models that linked section 301 tariffs to domestic prices and production at the four-digit NAICS code level. USITC used data from 2018 to 2021 as the base year.
USITC only considered Section 301 tariffs’ direct impacts, i.e., “how tariffs impacted prices, production, and trade for products subject to section 301 tariffs and domestic sectors that compete directly with those imports.”
Regarding the overall impact of Section 301 actions, USITC found that the tariffs imposed on Chinese goods resulted in a price rise paid by US importers, but the exporter prices received by Chinese firms were mostly unchanged. As a result, “imports from China decreased in quantity, leading to a substantial decline in their import value. These changes, in turn, caused an increase in production and prices in US domestic industries that were competing with Chinese imports.”
USITC also evaluated the specific impacts of Section 301 tariffs on the Cut and Sew apparel (NAICS 3152) sector. According to USITC:
“nontariff-inclusive value” refers to the change in the value of imports from China excluding the value of the section 301 duties themselves, which provide an indication of the change in import quantities because export prices are mostly unchanged.
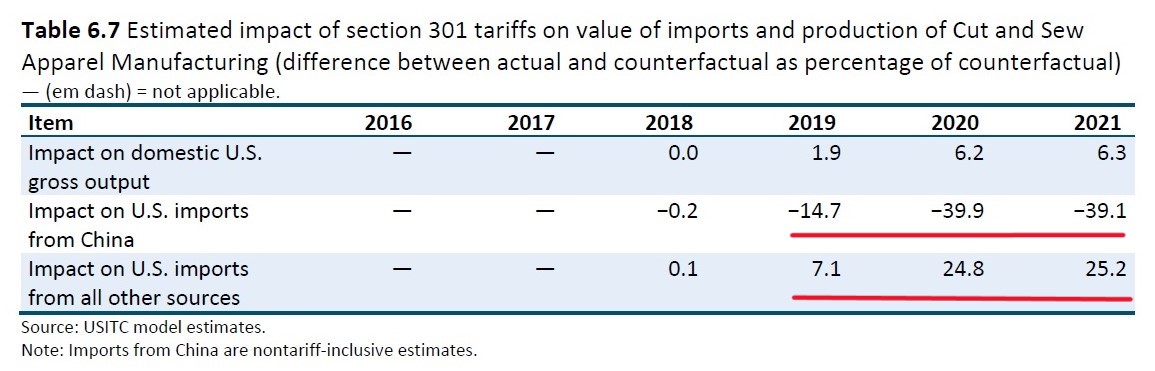
First, Section 301 tariffs hurt US apparel imports from China. USITC estimated that US woven apparel (NAICS 3152) imports from China decreased by 14.7% in 2019 but fell nearly 40% in 2020 and 2021 due to Section 301 tariffs. However, USITC didn’t explain why imports from China suddenly worsened, nor if other factors, such as the Uyghur Forced Labor Prevention Act (UFLPA), played a role.
Second, Section 301 tariffs mostly replaced US woven apparel (NAICS3152) imports from China with other sources. However, the direct benefits of Section 301 tariffs to US domestic cut and sew manufacturing seemed limited. Specifically, USITC estimated that US woven apparel imports from sources other than China increased by 7.1% in 2019, 24.8% in 2020, and 25.2% in 2021 due to Section 301 tariffs. In comparison, Section 301 tariffs resulted in modest growth of US domestic woven apparel (NAICS3152) production (up to 6.3%) over the same period.
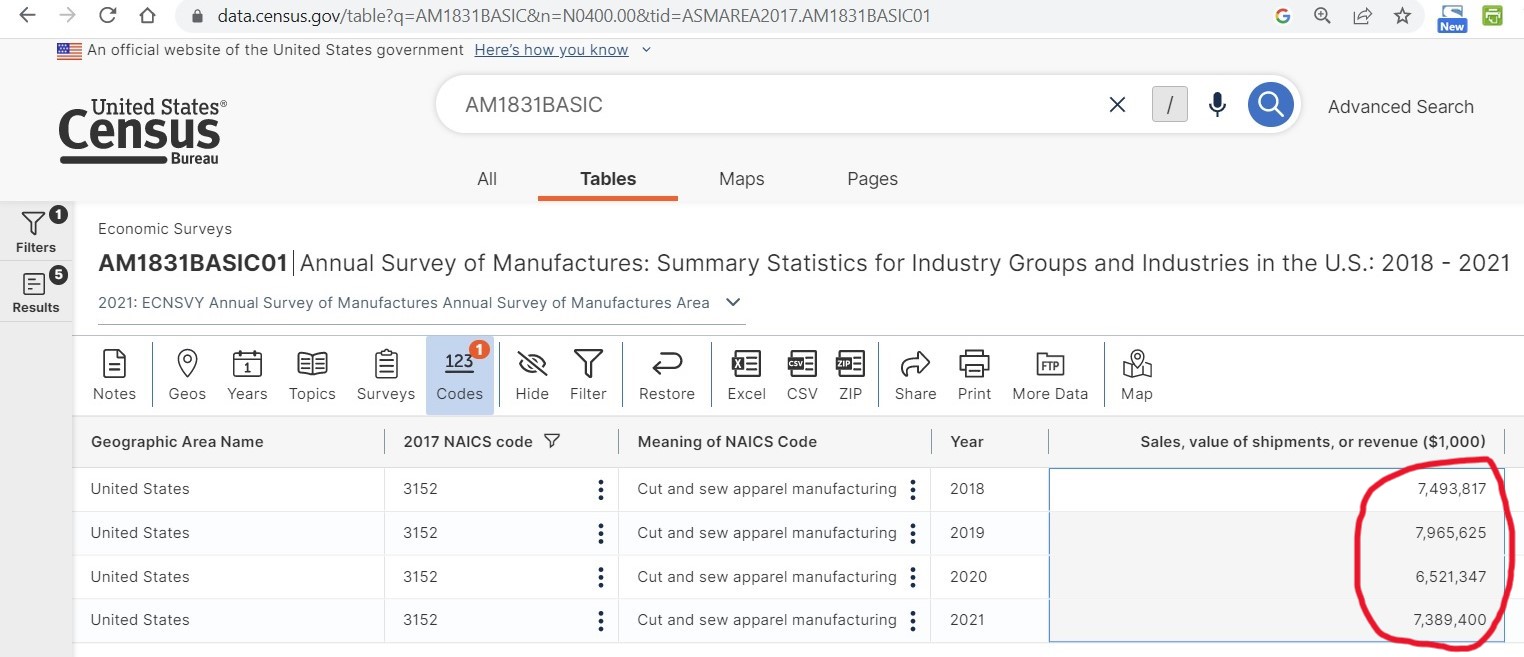
Actual trade and production data further showed that US woven apparel (NAICS 3152) imports from sources other than China increased from $55.3 billion in 2018 to $61.2 billion in 2021 (or up 10.7%). Over the same period, US domestic woven apparel (NAICS 3152) sales & value of shipments declined from $7.49 billion to $7.38 billion (or down 1.4%) (Data source: Census). In other words, no clear evidence suggests that Section 301 tariffs boosted US domestic woven apparel production.
Third, Section 301 tariffs made US woven apparel (NAICS 3152) imports from EVERYWHERE more expensive. On the one hand, USITC found that the price of US woven apparel (NAICS 3152) imports from China increased by 4.4% in 2019, 14.7% in 2020, and 14.5% in 2021 due to the Section 301 tariffs. However, similar to the case of trade volume, USITC didn’t explain why Section 301 tariffs’ price impact suddenly became more significant in 2020 and 2021. (Note: In fact, the Tranche 4A tariffs were 15% since September 1, 2019, but were reduced to 7.5% effective February 14, 2020, because of the US-China Phase One deal.)
Meanwhile, due to limited production capacity outside of China, the Section 301 tariffs caused an increase in the cost of US woven apparel imports from all other countries. Specifically, USITC found that the price of US woven apparel (NACIS 3152) imports from sources other than China increased by 3.2% from 2018 to 2021. (Note: given the hiking sourcing costs in 2022, the price increase could be more significant should USITC include updated 2022 trade data in the estimation.)
Additionally, USITC acknowledged that its estimation may “likely captures the most significant impacts of these tariffs in the short run.” However, some effects of section 301 tariffs would likely be delayed. For example, USITC said, “if importers and domestic producers anticipated the tariffs remaining in place long enough,” they may consider more costly changes, such as adjusting their supply chains and investing in domestic production.
Discussion questions:
Based on USITC’s assessment, should President Biden keep or remove the Section 301 tariffs on imports from China? Why or why not?
Regarding the impact of Section 301, any questions remain unanswered or can be studied further?
Any findings in the USITC report surprised you and why?
In March 2023, the Office of the United States Trade Representative (USTR) released its 2024 Fiscal Year Budget report, outlining six major goals and objectives for FY2024. USTR’s FY2024 goals and objectives for textile and apparel are similar to FY2023, but keywords such as “near-shoring” are newly emphasized.
Goal 1: Open Foreign Markets and Combat Unfair Trade
Provide policy guidance and support for international negotiations or initiatives affecting the textile and apparel sector to ensure that the interests of U.S. industry and workers are taken into account and, where possible, to provide new or enhanced export opportunities for U.S. industry. (Note: no change from FY2023)
Conduct reviews of commercial availability petitions regarding textile and apparel products and negotiate corresponding FTA rules of origin changes, where appropriate, in a manner that takes into account market conditions while preserving export opportunities for U.S. producers and employment opportunities for U.S. workers. (Note: no change from FY2023)
Engage relevant trade partners to address regulatory issues potentially affecting the U.S. textile and apparel industry’s market access opportunities. (Note: no change from FY2023)
Continue to engage with CAFTA-DR partner countries to address trade-related issues to optimize inclusive economic opportunities; strengthen trade rules and transparency and address non-tariff trade impediments; provide capacity building in areas such as textile and apparel trade-related regulation and practice on customs, border and market access issues, including agricultural and sanitary and phytosanitary regulations, to avoid barriers to trade. (note: newly mentioned “transparency”)
Continue to engage CAFTA-DR partners and stakeholders to identify and develop means to increase two-way trade in textiles and apparel and strengthen the North American supply chain and near-shoring to enhance formal job creation. (note: newly emphasized “Near-shoring”)
Provide policy guidance and support for international negotiations or initiatives affecting the textile and apparel sector to ensure that the interests of U.S. industry and workers are taken into account and, where possible, to provide new or enhanced export opportunities for U.S. industry. (Note: no change from FY2023)
Conduct reviews of commercial availability petitions regarding textile and apparel products and negotiate corresponding FTA rules of origin changes, where appropriate, in a manner that takes into account market conditions while preserving export opportunities for U.S. producers and employment opportunities for U.S. workers (note: no change from FY2023)
Engage relevant trade partners to address regulatory issues potentially affecting the U.S. textile and apparel industry’s market access opportunities. (note: no change from FY2023)
Goal 2: Fully Enforce U.S. Trade Laws, Monitor Compliance with Agreements, and Use All Available Tools to Hold Other Countries Accountable
Closely collaborate with industry and other offices and Departments to monitor trade actions taken by partner countries on textiles and apparel to ensure that such actions are consistent with trade agreement obligations and do not impede U.S. export opportunities. (note: no change from FY2023)
Research and monitor policy support measures for the textile sector, in particular in the PRC, India, and other large textile producing and exporting countries, to ensure compliance with international agreements. (note: no change from FY2023)
Continue to work with the U.S. textile and apparel industry to promote exports and other opportunities under our free trade agreements and preference programs, by actively engaging with stakeholders and industry associations and participating, as appropriate, in industry trade shows. (note: no change from FY2023)
Goal 4: Develop Equitable Trade Policy Through Inclusive Processes
Take the lead in providing policy advice and assistance in support of any Congressional initiatives to reform or re-examine preference programs that have an impact on the textile and apparel sector. (note: no change from FY2023)
Other Priorities for USTR in FY2024:
#1 “Advancing a Worker-Centered Trade Policy.” For example, given “communities of color and lower socio-economic backgrounds were more negatively affected by free trade policies that have reduced tariffs and distributed supply chains across the globe,” USTR will develop “a new strategic approach to trade relationships that is not built on traditional free trade agreements…USTR is embarking on trade engagements with allies and like-minded economies, like Taiwan and Kenya and [through] multinational economic frameworks that focus on clean energy and supply chains rather than tariffs.”
#2 Address forced labor. For example, USTR developed the first-ever focused trade strategy to combat forced labor. Paired with the implementation of the Uyghur Forced Labor Prevention Act, and the Memorandum of Cooperation (MOC) launching of a Task Force on the Promotion of Human Rights and International Labor Standards in Supply Chains under the U.S.-Japan Partnership on Trade. And USTR will “use every tool available to block the importation of goods made partially or entirely with forced labor.”
#3 Re-Aligning the U.S. – Beijing Trade Relationship. “USTR continues to keep the door open to conversations with the PRC, including on its Phase One commitments. However, USTR acknowledges the Agreement’s limitations. USTR’s strategy is expand beyond only pressing Beijing for change and includes vigorously defending our values and economic interests from the negative impacts of the PRC’s unfair economic policies and practices.”
#4 Strengthen enforcement of US trade policy. For example, USTR sees enforcement “a key component of our worker-centered trade policy.” USTR is “upholding the eligibility requirements in preference programs,” such as the African Growth and Opportunity Act (AGOA). As many enforcement tools were “were crafted decades ago,” USTR will be “reviewing our existing trade tools and working with Congress to develop new tools as needed.”
Trend 1: US fashion companies continue to diversify their sourcing base in 2022
Numerous studies suggest that US fashion companies leverage sourcing diversification and sourcing from countries with large-scale production capacity in response to the shifting business environment. For example, according to the 2022 fashion industry benchmarking study from the US Fashion Industry Association (USFIA), more than half of surveyed US fashion brands and retailers (53%) reported sourcing apparel from over ten countries in 2022, compared with only 37% in 2021. Nearly 40% of respondents plan to source from even more countries and work with more suppliers over the next two years, up from only 17% in 2021.
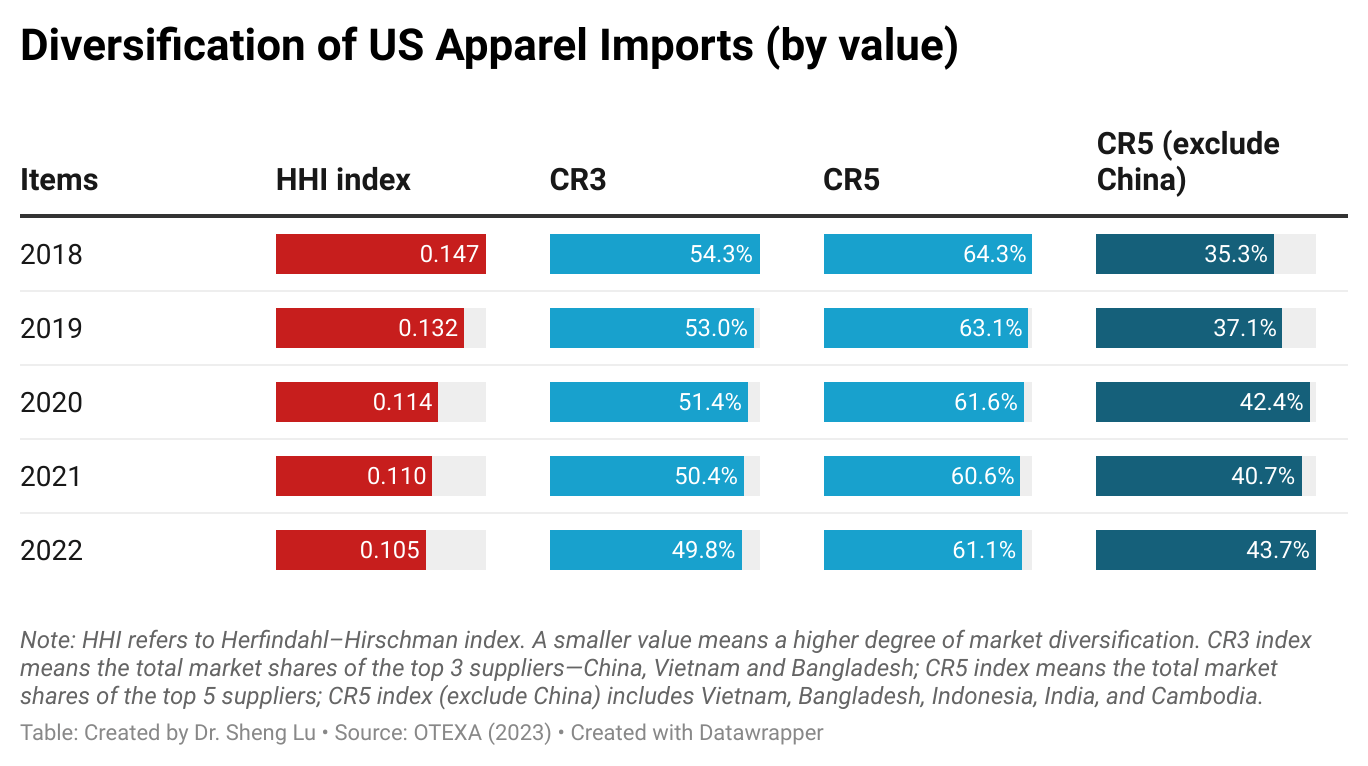
Trade data confirms the trend. For example, the Herfindahl–Hirschman index (HHI), a commonly-used measurement of market concentration, went down from 0.110 in 2021 to 0.105 in 2022, suggesting that US apparel imports came from even more diverse sources.
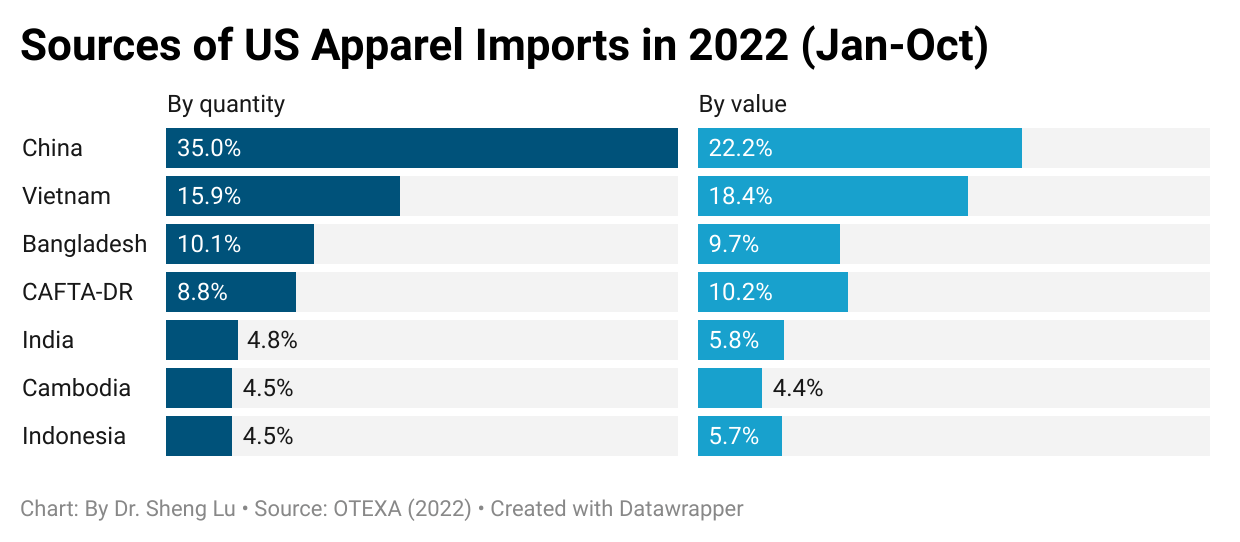
Trend 2: Asia as a whole will remain the dominant source of imports
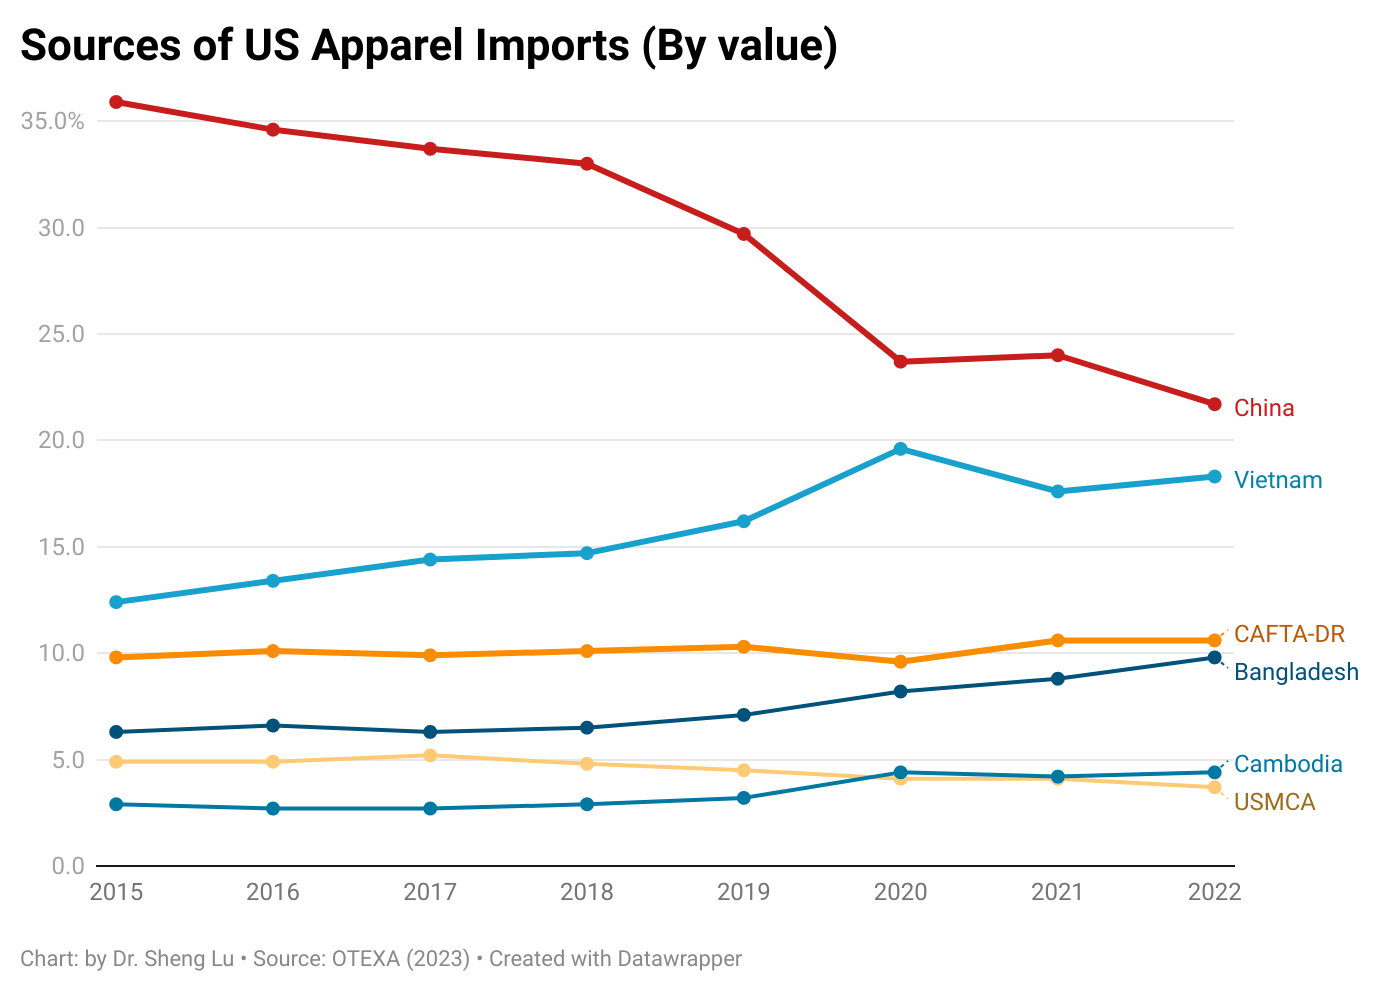
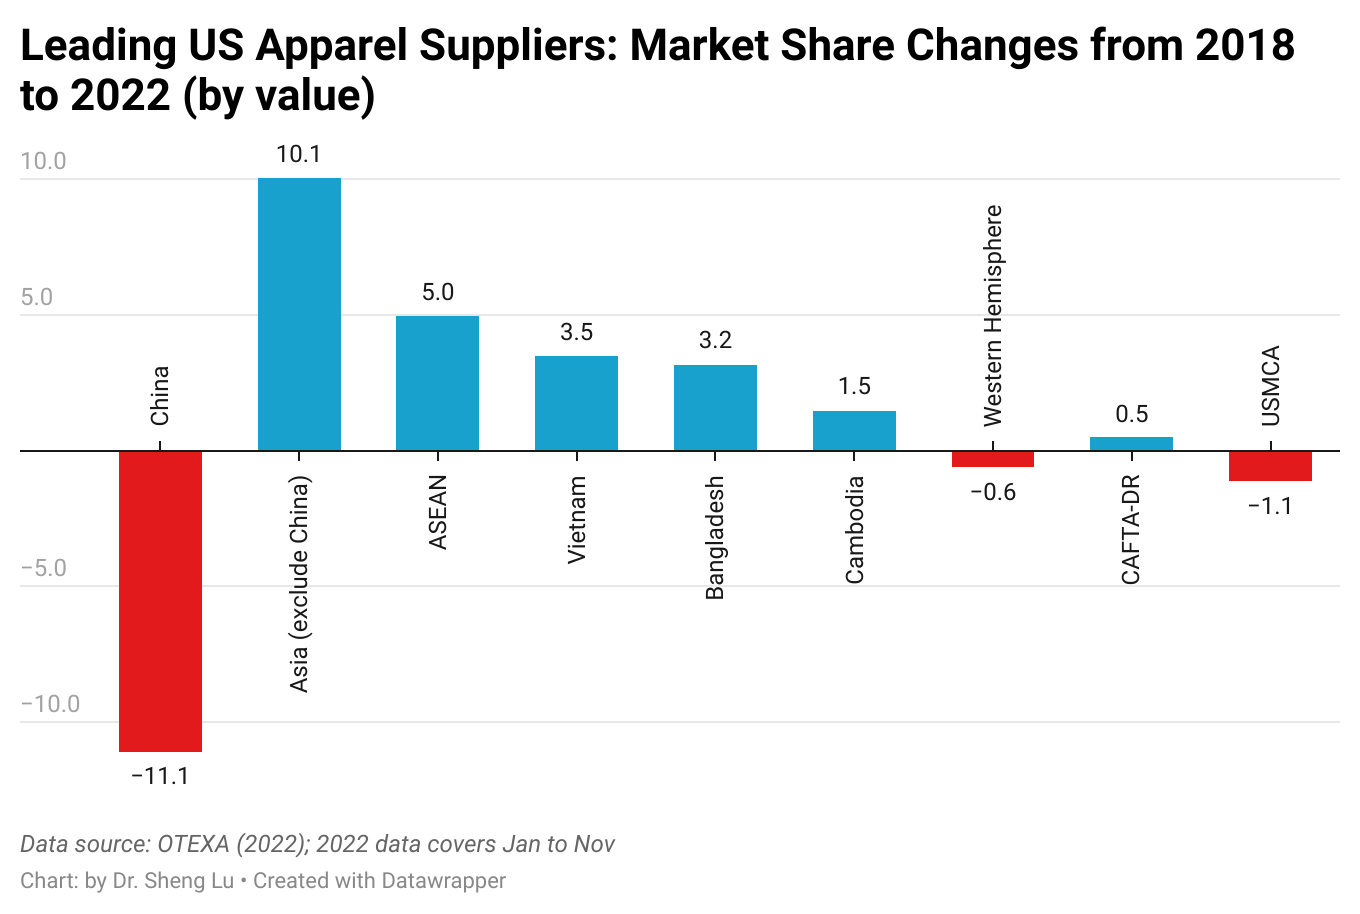
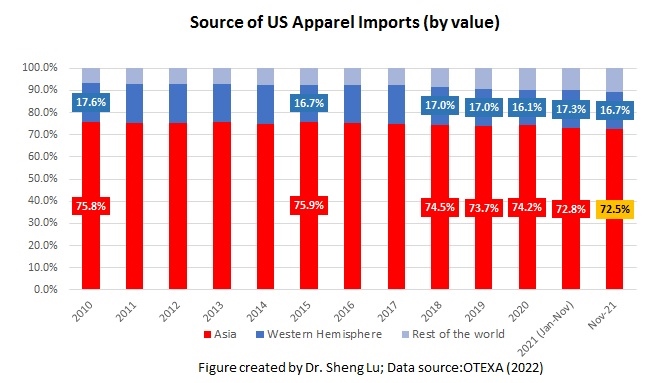
Measured in value, about 73.5% of US apparel imports came from Asia in 2022, up from 72.8% in 2021. Likewise, the CR5 index, measuring the total market shares of the top five suppliers—all Asia-based, i.e., China, Vietnam, Bangladesh, Indonesia, and India, went up from 60.6% in 2021 to 61.1% in 2022. Notably, the CR5 index without China (i.e., the total market shares of Vietnam, Bangladesh, Indonesia, India, and Cambodia) enjoyed even faster growth, from 40.7% in 2021 to 43.7% in 2022.
Additionally, facing growing market uncertainties and weakened consumer demand amid high inflation pressure, US fashion companies may continue to prioritize costs and flexibility in their vendor selection. Studies consistently show that Asia countries still enjoy notable advantages in both areas thanks to their highly integrated regional supply chain, production scale, and efficiency. Thus, US fashion companies are unlikely to reduce their exposure to Asia in the short to medium term despite some worries about the rising geopolitical risks.
Trend 3: US fashion companies’ China sourcing strategy continues to evolve
Several factors affected US apparel sourcing from China negatively in 2022:
One was China’s stringent zero-COVID policy, which led to severe supply chain disruptions, particularly during the fall. As a result, China’s market shares from September to November 2022 declined by 7-9 percentage points compared to the previous year over the same period.
The second factor was the implementation of the Uyghur Forced Labor Prevention Act (UFLPA) in June 2022, which discouraged US fashion companies from sourcing cotton products from China. For example, only about 10% of US cotton apparel came from China in the fourth quarter of 2022, down from 17% at the beginning of the year and much lower than nearly 27% back in 2018.
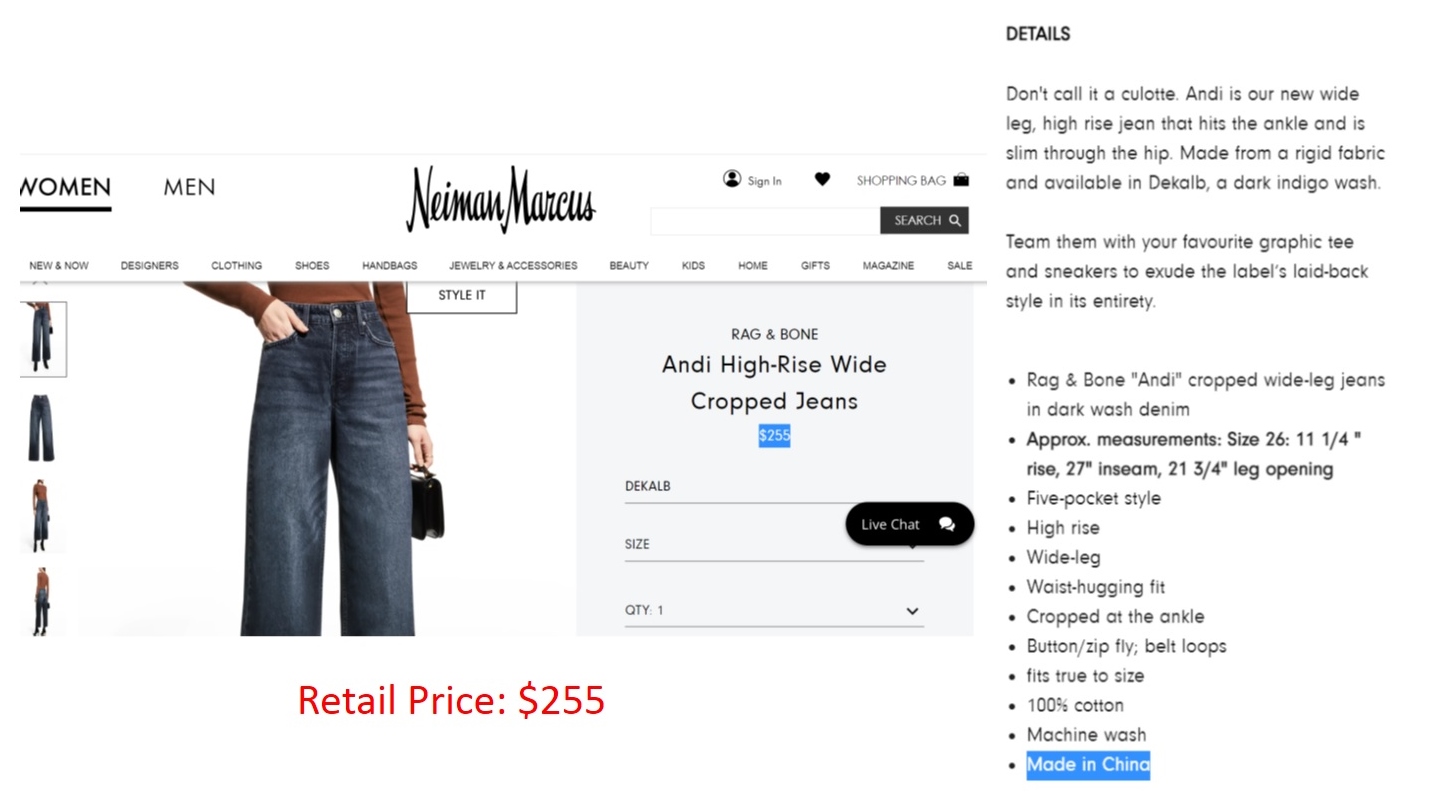
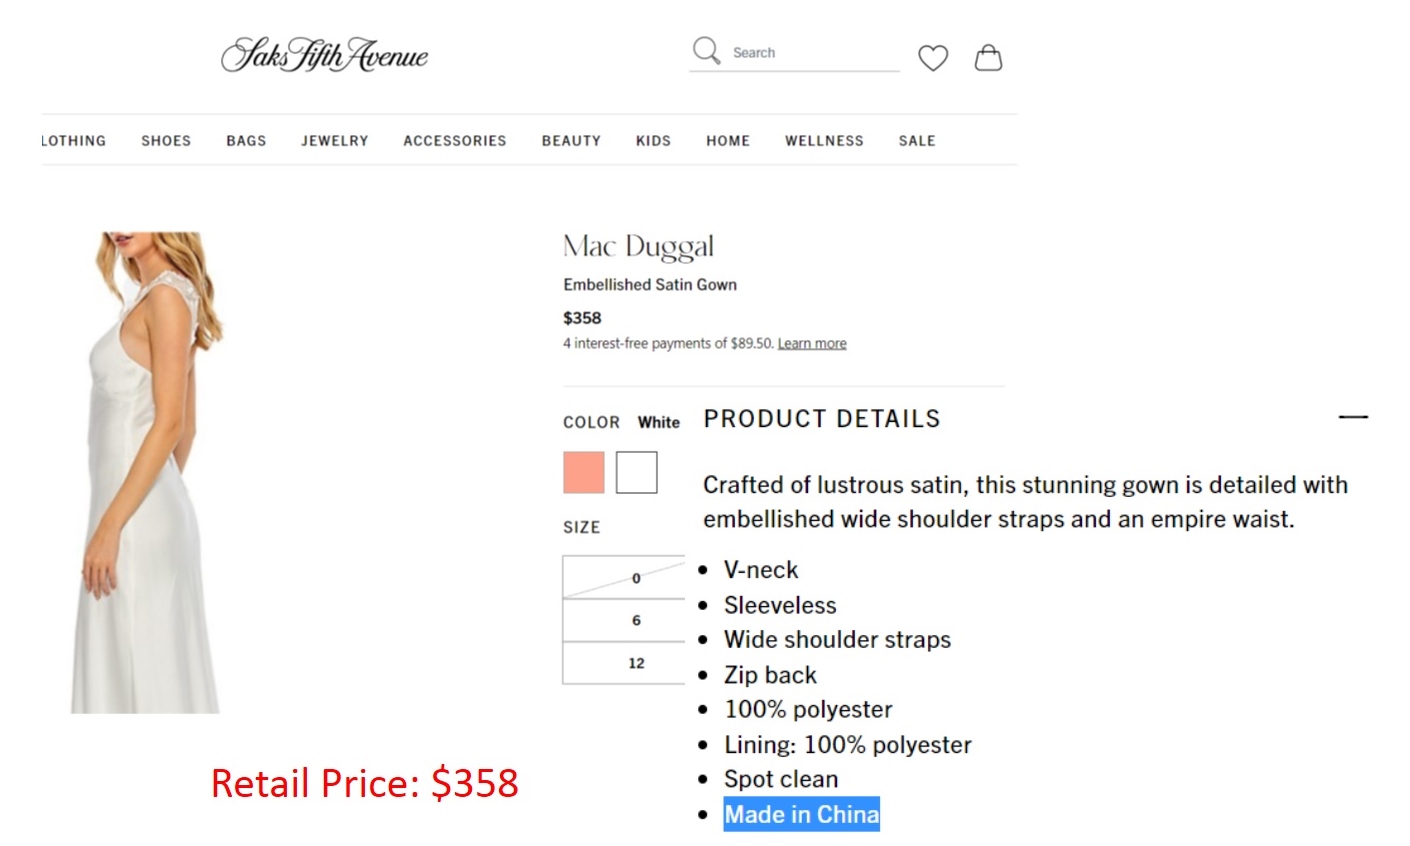
The third contributing factor was the US-China trade tensions, including the continuation of Section 301 punitive tariffs. Industry sources indicate that US fashion companies increasingly source from China for relatively higher-value-added items targeting the premium or luxury market segments to offset the additional sourcing costs.
Further, three trends are worth watching regarding China’s future as an apparel sourcing base for US fashion companies:
One is the emergence of the “Made in China for China” strategy, particularly for those companies that view China as a lucrative sales market. Recent studies show that many US fashion companies aim to tailor their product offerings further to meet Chinese consumers’ needs and preferences.
Second is Chinese textile and apparel companies’ growing efforts to invest and build factories overseas. As a result, more and more clothing labeled “Made in Bangladesh” and “Made in Vietnam” could be produced by factories owned by Chinese investors.
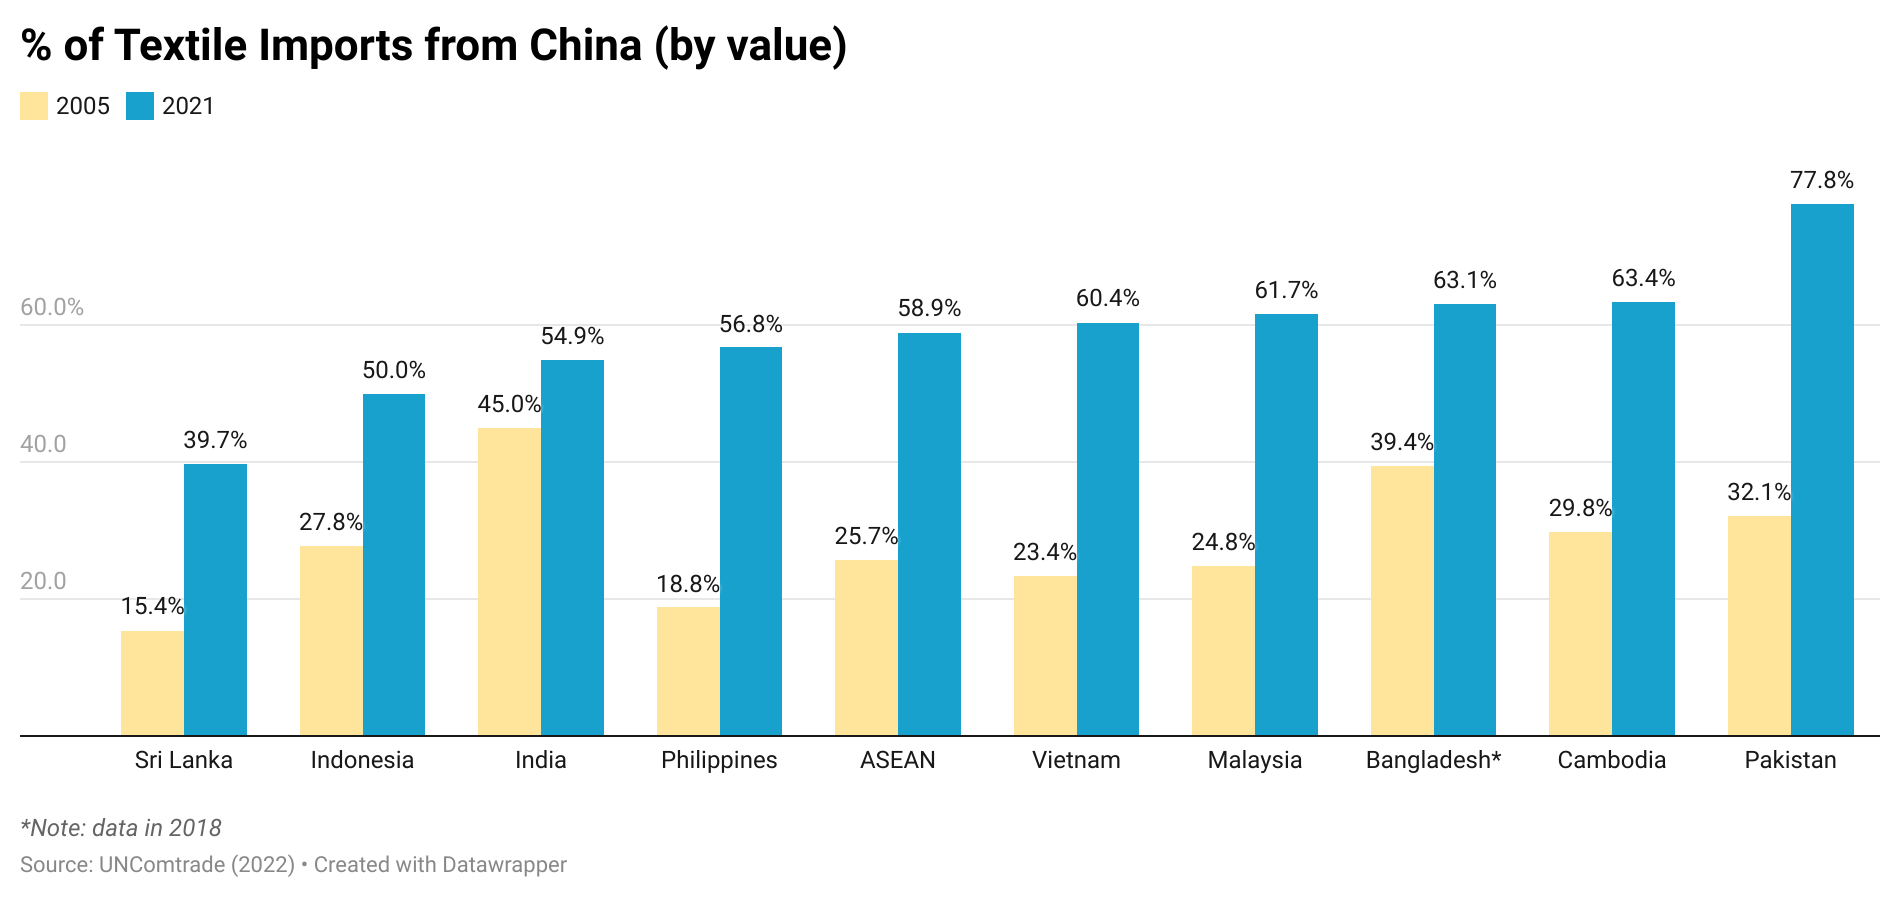
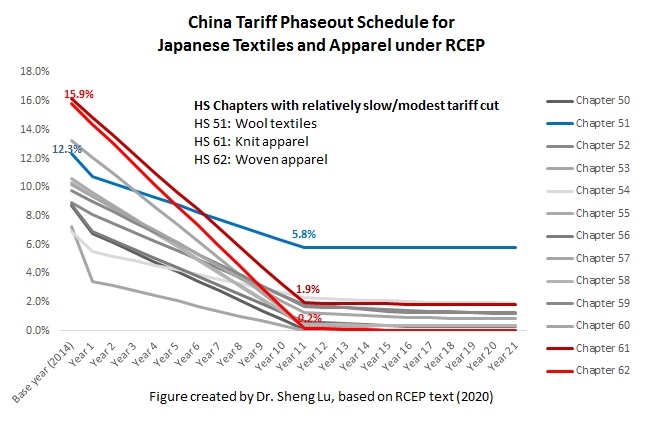
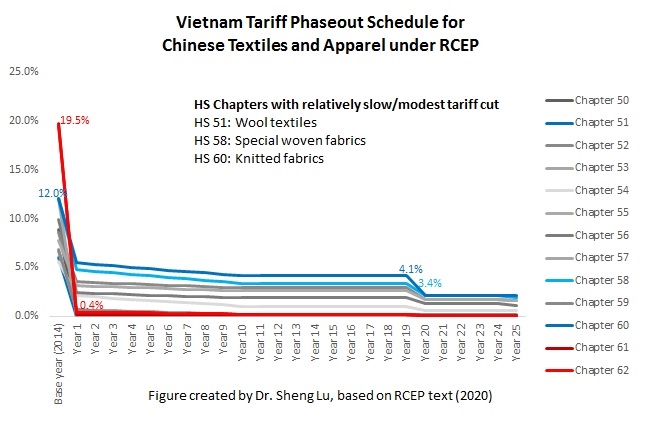
Third, China could accelerate its transition from exporting apparel to providing more textile raw materials to other apparel-exporting countries in Asia. Notably, over the past decade, most Asian apparel-exporting countries have become increasingly dependent on China’s textile raw material supply, from yarns and fabrics to various accessories. Moreover, recent regional trade agreements, particularly the Regional Comprehensive Economic Partnership (RCEP), provide new opportunities for supply chain integration in Asia.
Trend 4: US fashion companies demonstrate a new interest in expanding sourcing from the Western Hemisphere, but key bottlenecks need to be solved
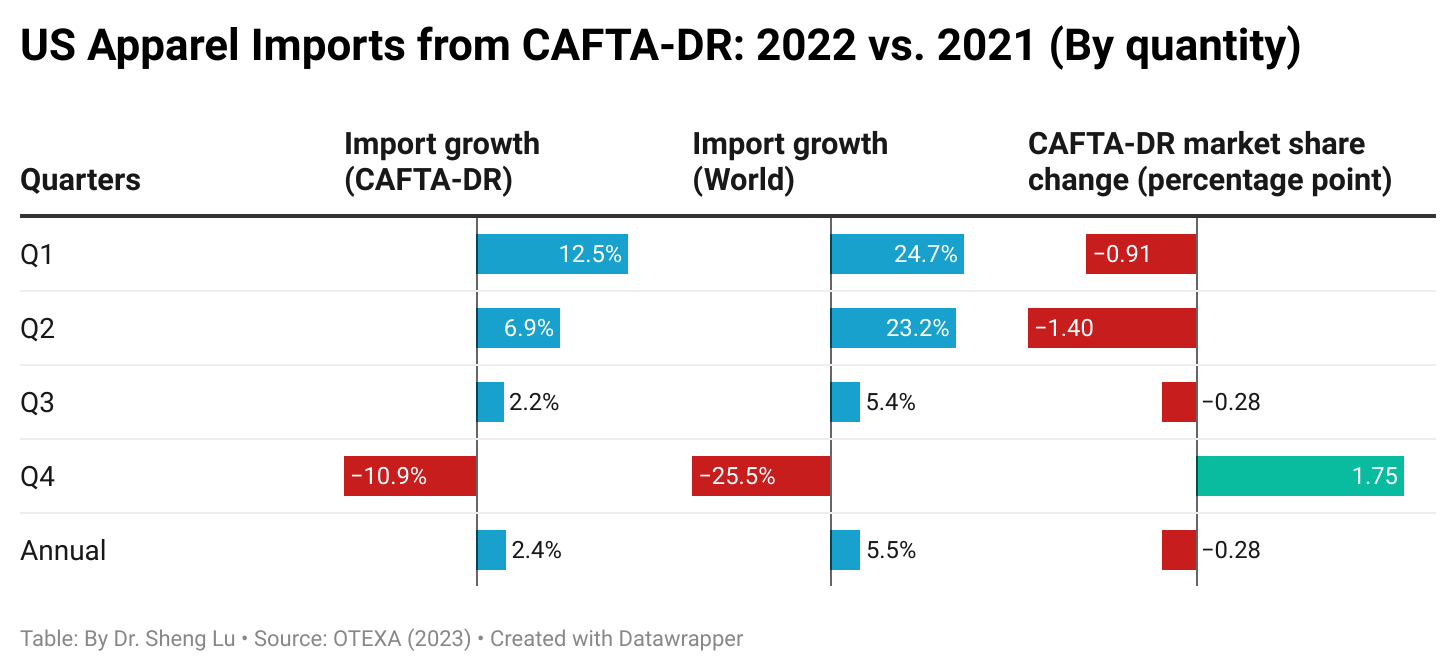
Trade data suggests a mixed picture of near-shoring in 2022. For example, members of the Dominican Republic-Central America Free Trade Agreement (CAFTA-DR) and US-Mexico-Canada Trade Agreement (USMCA) accounted for a declining share of US apparel imports in 2022, measured in quantity and value. While CAFTA-DR and USMCA members showed an increase in their market share of US apparel imports in the fourth quarter of 2022, reaching 10.7% and 3.1%, respectively, this growth was not accompanied by an increase in trade volume. Instead, US apparel imports from these countries decreased by 11% and 15%, respectively, compared to the previous year. CAFTA-DR and USMCA members’ gain in market share was mainly due to a sharper decline in US apparel imports from the rest of the world (i.e., decreased by over 25% in the fourth quarter of 2022).
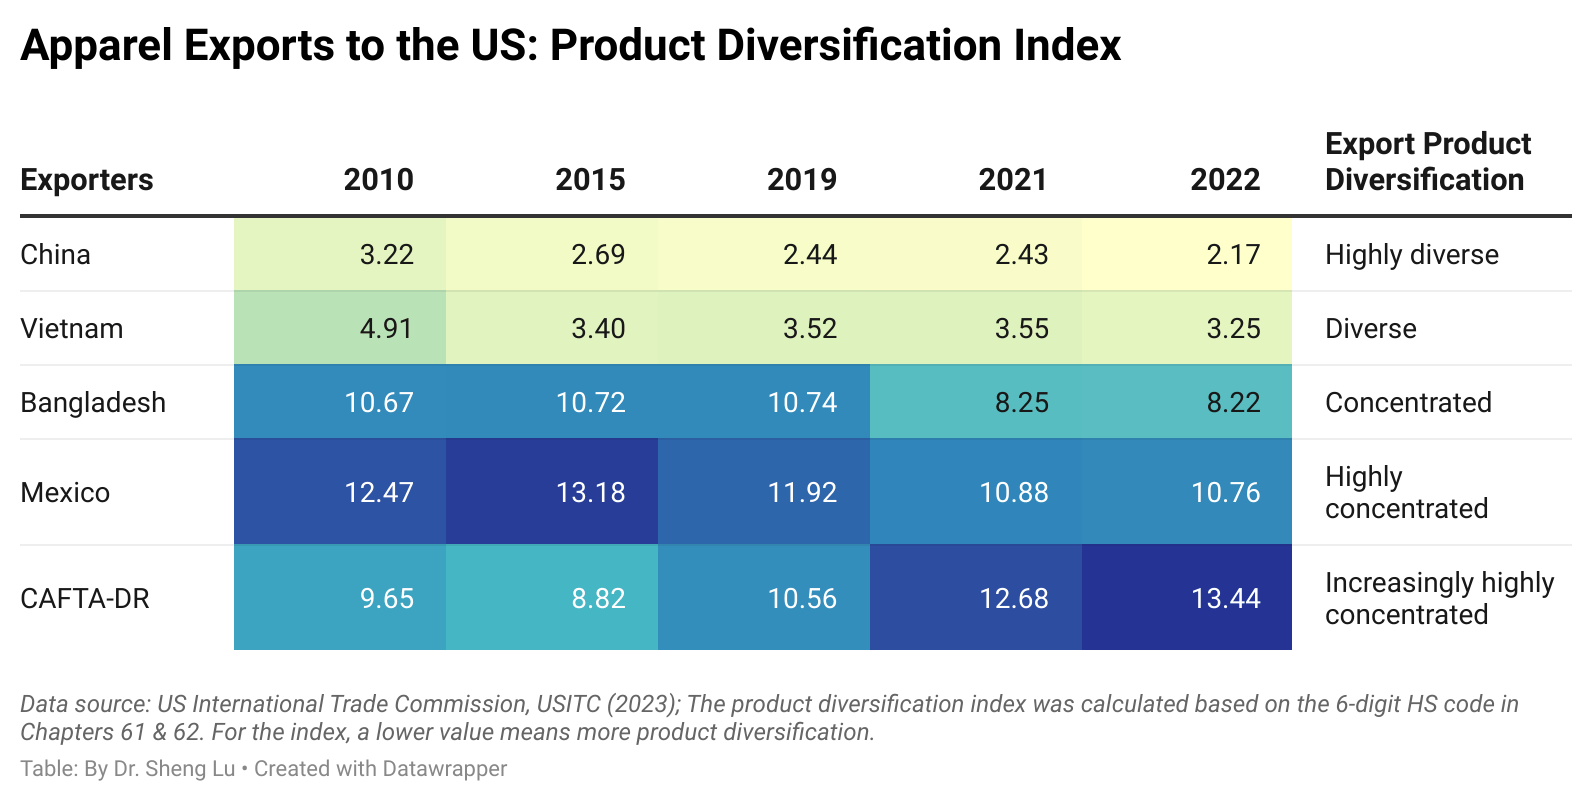
Trade data also suggests two other bottlenecks preventing more US apparel sourcing from CAFTA-DR and USMCA members. One is the lack of product diversity. For example, the product diversification index consistently shows that US apparel imports from CAFTA-DR members and Mexico concentrated on only a limited category of products, and the problem worsened in 2022. The result explained why US fashion companies often couldn’t move souring orders from Asia to CAFTA-DR and USMCA members.
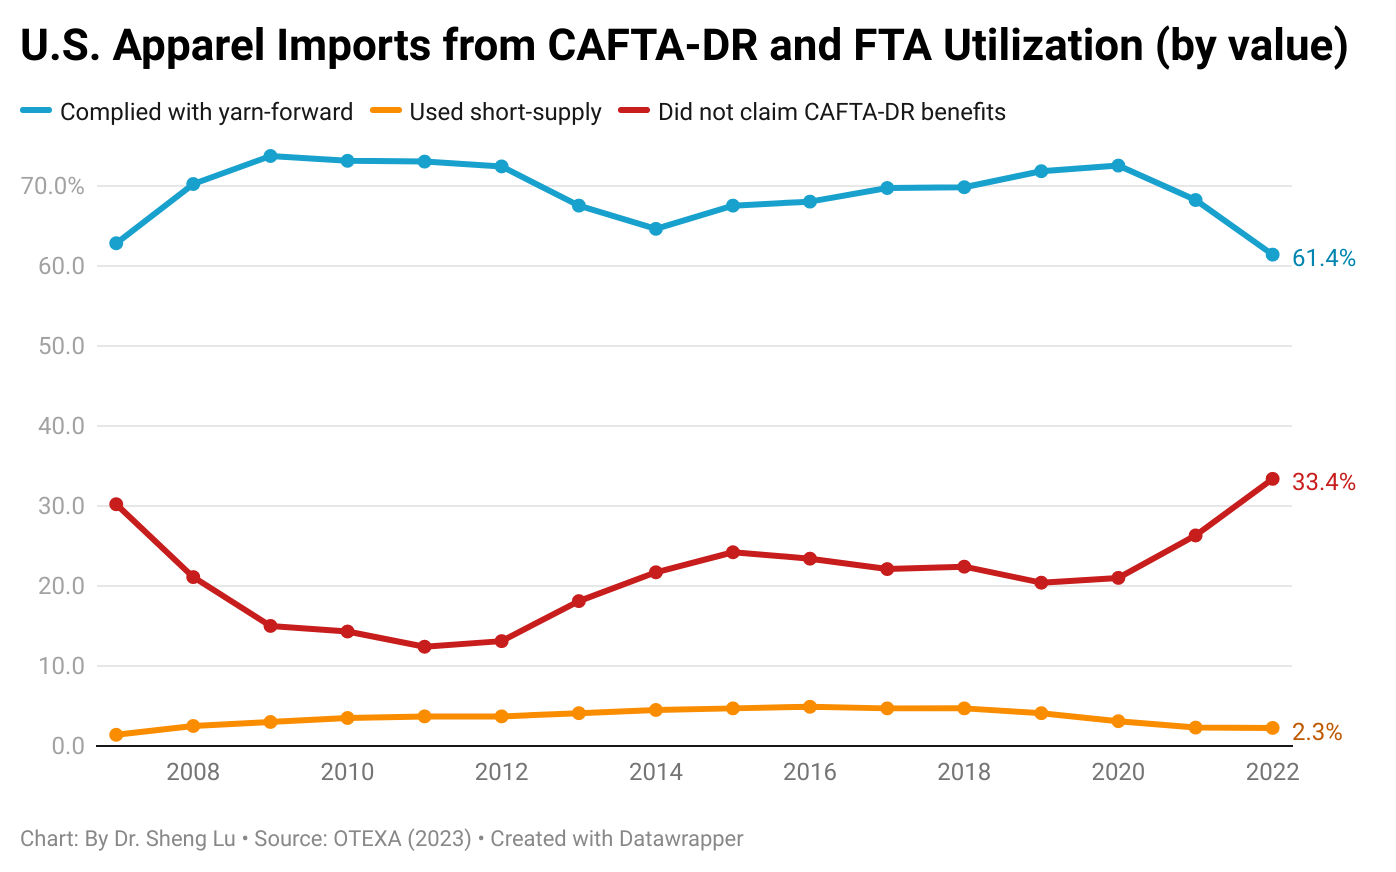
Another problem is the underutilization of the trade agreement. For example, CAFTA-DR’s utilization rate for US apparel imports consistently went down from its peak of 87% in 2011 to only 74% in 2021. The utilization rate fell to 66.6% in 2022, the lowest since CAFTA-DR fully came into force in 2007. This means that as much as one-third of US apparel imports from CAFTA-DR did NOT claim the agreement’s preferential duty benefits. Thus, regarding how to practically grow US fashion companies’ near-shoring, we could expect more public discussions and debates in the new year.
This study aims to understand western fashion brands and retailers’ latest China apparel sourcing strategies against the evolving business environment. We conducted a content analysis of about 30 leading fashion companies’ public corporate filings (i.e., annual or quarterly financial reports and earnings call transcripts) submitted from June 1, 2022 to December 31, 2022.
The results suggest several themes:
First, China remains one of the most frequently used apparel sourcing destinations. For example:
Express says, “The top five countries from which we sourced our merchandise in 2021 were Vietnam, China, Indonesia, Bangladesh and the Philippines, based on total cost of merchandise purchased.”
According to TJX, “a significant amount of merchandise we offer for sale is made in China.”
Children’s Place says, “We source from a diversified network of vendors, purchasing primarily from Vietnam, Cambodia, Indonesia, Ethiopia, Bangladesh, and China.“
Ralph Lauren adds, “In Fiscal 2022, approximately 97% of our products (by dollar value) were produced outside of the US, primarily in Asia, Europe, and Latin America, with approximately 19% of our products sourced from China and another 19% from Vietnam.
However, many fashion companies have significantly cut their apparel sourcing volume from China. More often, China is no longer the No.1 apparel sourcing destination, overtaken by China’s competitors in Asia, such as Vietnam.
According to Lululemon, “During 2021, approximately 40% of our products were manufactured in Vietnam, 17% in Cambodia, 11% in Sri Lanka, 7% in China (PRC), including 2% in Taiwan, and the remainder in other regions… From a sourcing perspective, when looking at finished goods for the upcoming 2022 fall season, Mainland China represents only 4% to 6% of our total unit volume.”
Levi’s says, “The good thing about our supply chain is we’ve got truly a global footprint. We don’t manufacture a whole lot in China anymore. We’ve been slowly divesting manufacturing out of China, if you will, and kind of playing our chips elsewhere on the global map… Less than 1% of what we’re bringing into this country, into the US, less than 1% of it is coming from China.”
Adidas says, “In 2021, we sourced 91% of the total apparel volume from Asia (2020: 93%). Cambodia is the largest sourcing country, representing 21% of the produced volume (2020: 22%), followed by China with 20% (2020: 20%) and Vietnam with 15% (2020: 21%).”
Victoria’s Secret says, “On China, China is a single-digit percentage of our total inflow of merchandise. We’re not particularly dependent on China at all.”
Nike: “As of May 31, 2022, we were supplied by 279 finished goods apparel contract factories located in 33 countries. For fiscal 2022, contract factories in Vietnam, China and Cambodia manufactured approximately 26%, 20% and 16% of total NIKE Brand apparel, respectively“
Meanwhile, fashion companies still heavily use China as a sourcing base for textile raw materials (such as fabrics). For example:
Columbia Sportswear says it sources most of its finished products from Vietnam, but “a large portion of the raw materials used in our products is sourced by our contract manufacturers in China.”
Likewise, Puma says, “90% of our recycled polyester comes from Vietnam, China, Taiwan (China) and Korea.”
Guess says, “During fiscal 2022, we sourced most of our finished products with partners and suppliers outside the U.S. and we continued to design and purchase fabrics globally, with most coming from China.”
Lulumemon says, “Approximately 48% of the fabric used in our products originated from Taiwan, 19% from China Mainland, 11% from Sri Lanka, and the remainder from other regions.”
Second, Western fashion companies unanimously ranked the COVID situation as one of their top concerns for China. Many companies reported significant sales revenue and profits loss due to China’s draconian “zero-COVID” policy and lockdown measures. For example,
Tapestry says, “For Greater China, sales declined 11% due to lockdowns and business disruption… as a result, we have tempered our fiscal year 2023 outlook based on the expectation for a delayed recovery in China.”
Adidas says, “With Great China… we continue to see several market-specific challenges that are affecting our entire industry. The strict zero COVID-19 policy with nationwide restrictions remains in place amid more than 2000 daily new COVID-19 cases in November. As a consequence, offline traffic is subdued due to the imminent risk of new lockdowns.
Under Armour says, “Ongoing impacts of the COVID-19 pandemic and related preventative and protective actions in China…have negatively impacted consumer traffic and demand and may continue to negatively impact our financial results.”
VF Corporation says, “The performance in Greater China…continues to be impacted by widespread rolling COVID lockdowns and restrictions as well as lower consumer spending.”
Puma says, “COVID-19-related restrictions are still impacting business in Greater China, and higher freight rates and raw material prices continue to put pressure on margins.”
Notably, despite China’s most recent COVID policy U-turn, most fashion companies expect market uncertainties to stay in China, at least in the short run, given the surging COVID cases and policy unpredictability. For example:
PVH says, “While we remain optimistic about our business in China, it continues to be a challenging environment as restrictions have once again intensified in the fourth quarter of 2022.”
Nike says, “So we’ve taken a very cautious approach in our guidance to China, given the short-term uncertainties that are there.”
Abercrombie & Fitch also listed China’s COVID situation as one of their top risk factors, “risks and uncertainty related to the ongoing COVID-19 pandemic, including lockdowns in China, and any other adverse public health developments.”
Third, fashion companies report the negative impacts of US-China trade tensions on their businesses. Also, as the US-China relationship sours, fashion bands and retailers have been actively watching the potential effect of geopolitics. For example,
Express says, “recent geopolitical conditions, including impacts from the ongoing conflict between Russia and Ukraine and increased tensions between China and Taiwan, have all contributed to disruptions and rising costs to global supply chains.”
When assessing the market risk factors, Chico’s FAS says, “our reliance on sourcing from foreign suppliers and significant adverse economic, labor, political or other shifts (including adverse changes in tariffs, taxes or other import regulations, particularly with respect to China, or legislation prohibiting certain imports from China)”
Adidas holds the same view, “In addition, the challenging market environment in China had an adverse impact on the company’s business activities… Additional challenges included the geopolitical situation in China and extended lockdown measures.”
Macy’s adds, “At this time, it is unknown how long US tariffs on Chinese goods will remain in effect or whether additional tariffs will be imposed. Depending upon their duration and implementation, as well as our ability to mitigate their impact, these changes in foreign trade policy and any recently enacted, proposed and future tariffs on products imported by us from China could negatively impact our business, results of operations and liquidity if they seriously disrupt the movement of products through our supply chain or increase their cost.”
Gap Inc. says, “Trade matters may disrupt our supply chain. For example, the current political landscape, including with respect to U.S.-China relations, and recent tariffs and bans imposed by the United States and other countries (such as the Uyghur Forced Labor Prevention Act) has introduced greater uncertainty with respect to future tax and trade regulations.”
QVC says, “The imposition of any new US tariffs or other restrictions on Chinese imports or the taking of other actions against China in the future, and any responses by China, could impair our ability to meet customer demand and could result in lost sales or an increase in our cost of merchandise, which would have a material adverse impact on our business and results of operations.”
Additionally,NO evidence shows that fashion companies are decoupling with China. Instead, Western fashion companies, especially those with a global presence, still hold an optimistic view of China as a long-term business opportunity. For example:
Inditex, which owns Zara, says, “we remain absolutely confident about our opportunities there (in China) in the medium to long term. Fashion demand continues to be strong in China. For sure it will remain a core market for us for Inditex.”
Ralph Lauren says, “China provides not only the successful blueprint for our elevated ecosystem strategy globally, it also represents one of several geographic long-term opportunities for our brand…We continue to see near and long term brand opportunities in China.”
Lululemon says, “On China, we remain very excited…we remain very, very excited about the potential and the role that will play in quadrupling our international business with Mainland China.”
Nike says, “We have remained committed to investing in Greater China for the long term.”
Adidas says, “On China, clearly, we believe in as a midterm opportunity in China… And then when the market opens up (from COVID), we believe, the western brand is well-positioned in China again, and we can start growing significant in China again.”
Meanwhile, Western fashion companies plan to make more efforts to localize their product offer and cater to the specific needs of Chinese consumers, especially the young generation. The “Made in China for China” strategy could become more popular among Western fashion companies. For example,
PVH says, “So, I think in general, our production in China is heavily oriented to China for China production. I think for us generally speaking, the biggest impact of the shutdowns that we’ve seen across Shanghai and Beijing has really been focused on the impact to our China market.”
Likewise, Levi’s says, “We’re manufacturing somewhere in the neighborhood of 5% of our global production is in China, and most of it staying in China.“
Hanesbrands says, “we’re committed to opening new stores, and that’s continues to go well, despite, the challenges that are there. Looking specifically at Champion, we continued our expansion in China adding new stores in the quarter through our partners.”
H&M says, “we still see China as an important market for us.”
According to Hugo Boss, “Thanks to overall robust local demand, revenues in China in 2021 grew 24% as compared to 2019.”
VF Corporation adds, “China is a significant opportunity…(We are) really pushing decision-making into the regions and providing more and more latitude for local-for-local decision-makings around product, around storytelling, certainly staying within the confines or the framework of the brand strategy, but really giving more freedom and more empowerment to the regions.”
In December 2022, Just-Style consulted a panel of industry experts and scholars in its Outlook 2023–what’s next for apparel sourcing briefing. Below is my contribution to the report. All comments and suggestions are more than welcome!
2023 is likely another year full of challenges and opportunities for the global apparel industry.
First, the apparel industry may face a slowed world economy and weakened consumer demand in 2023. Apparel is a buyer-driven industry, meaning the sector’s volume of trade and production is highly sensitive to the macroeconomic environment. Amid hiking inflation, high energy costs, and retrenchment of global supply chains, leading international economic agencies, from the World Bank to the International Monetary Fund (IMF), unanimously predict a slowing economy worldwide in the new year. Likewise, the World Trade Organization (WTO) forecasts that the world merchandise trade will grow at around 1% in 2023, much lower than 3.5% in 2022. As estimated, the world apparel trade may marginally increase between 0.8% and 1.5% in the new year, the lowest since 2021. On the other hand, the falling demand may somewhat help reduce the rising sourcing cost pressure facing fashion companies in the new year.
Second, fashion brands and retailers will likely continue leveraging sourcing diversification and strengthening relationships with key vendors in response to the turbulent market environment. According to the 2022 fashion industry benchmarking study I conducted in collaboration with the US Fashion Industry Association (USFIA), nearly 40 percent of surveyed US fashion companies plan to “source from more countries and work with more suppliers” through 2024. Notably, “improving flexibility and reducing resourcing risks,” “reducing sourcing from China,” and “exploring near-sourcing opportunities” were among the top driving forces of fashion companies’ sourcing diversification strategies. Meanwhile, it is not common to see fashion companies optimize their supplier base and work with “fewer vendors.” For example, fashion companies increasingly prefer working with the so-called “super-vendors,” i.e., those suppliers with multiple-country manufacturing capability or can make textiles and apparel vertically, to achieve sourcing flexibility and agility. Hopefully, we could also see a more balanced supplier-importer relationship in the new year as more fashion companies recognize the value of “putting suppliers at the core.”
Third, improving sourcing sustainability and sourcing apparel products using sustainable textile materials will gain momentum in the new year. On the one hand, with growing expectations from stakeholders and pushed by new regulations, fashion companies will make additional efforts to develop a more sustainable, socially responsible, and transparent apparel supply chain. For example, more and more fashion brands and retailers have voluntarily begun releasing their supplier information to the public, such as factory names, locations, production functions, and compliance records. Also, new traceability technologies and closer collaboration with vendors enable fashion companies to understand their raw material suppliers much better than in the past. Notably, the rich supplier data will be new opportunities for fashion companies to optimize their existing supply chains and improve operational efficiency.
On the other hand, with consumers’ increasing interest in fashion sustainability and reducing the environmental impact of textile waste, fashion companies increasingly carry clothing made from recycled textile materials. My latest studies show that sourcing clothing made from recycled textile materials may help fashion companies achieve business benefits beyond the positive environmental impacts. For example, given the unique supply chain composition and production requirements, China appeared to play a less dominant role as a supplier of clothing made from recycled textile materials. Instead, in the US retail market, a substantial portion of such products was “Made in the USA” or came from emerging sourcing destinations in America (e.g., El Salvador, Nicaragua) and Africa (e.g., Tunisia and Morocco). In other words, sourcing clothing made from recycled textile materials could help fashion companies with several goals they have been trying to achieve, such as reducing dependence on sourcing from China, expanding near sourcing, and diversifying their sourcing base. Related, we are likely to see more public dialogue regarding how trade policy tools, such as preferential tariffs, may support fashion companies’ efforts to source more clothing using recycled or other eco-friendly textile materials.
Additionally, the debates on fashion companies’ China sourcing strategy and how to meaningfully expand near-sourcing could intensify in 2023. Regarding China, fashion companies’ top concerns and related public policy debates next year may include:
What to do with Section 301 tariff actions against imports from China, including the tariff exclusion process?
How to reduce “China exposure” further in sourcing, especially regarding textile raw materials?
How should fashion companies respond and mitigate the business impacts of China’s shifting COVID policy and a new wave of COVID surge?
What contingency plan will be should the geopolitical tensions in the Asia-Pacific region directly affect shipping from the region?
Meanwhile, driven by various economic and non-economic factors, fashion companies will likely further explore ways to “bring the supply chain closer to home” in 2023. However, the near-shoring discussion will become ever more technical and detailed. For example, to expand near-shoring from the Western Hemisphere, more attention will be given to the impact of existing free trade agreements and their specific mechanisms (e.g., short supply in CAFTA-DR) on fashion companies’ sourcing practices. Even though we may not see many conventional free trade agreements newly launched, 2023 will be another busy year for textile and apparel trade policy deliberation, especially behind the scene and on exciting new topics.
By Sheng Lu
Discussion question: As we approach the middle of the year, why do you agree or disagree with any predictions in the outlook? Please share your thoughts.
On September 2, 2022, the Office of the US Trade Representative (USTR) announced it would continue the billions of dollars of Section 301 punitive tariffs against Chinese products. USTR said it made the decision based on requests from domestic businesses benefiting from the tariff action. As a legal requirement, USTR will launch a full review of Section 301 tariff action in the coming months.
In her remarks at the Carnegie Endowment for International Peace on Sep 7, 2022, US Trade Representative Katharine Tai further said that the Section 301 punitive tariffs on Chinese imports “will not come down until Beijing adopts more market-oriented trade and economic principles.” In other words, the US-China tariff war, which broke out four years ago, is not ending anytime soon.
A Brief History of the US Section 301 tariff action against China
The US-China tariff war broke out as both unexpected and not too surprising. For decades, the US government had been criticizing China for its unfair trade practices, such as providing controversial subsidies to state-owned enterprises (SMEs), insufficient protection of intellectual property rights, and forcing foreign companies to transfer critical technologies to their Chinese competitors. The US side had also tried various ways to address the problems, from holding bilateral trade negotiations with China and imposing import restrictions on specific Chinese goods to suing China at the World Trade Organization (WTO). However, despite these efforts, most US concerns about China’s “unfair” trade practices remain unsolved.
When former US President Donald Trump took office, he was particularly upset about the massive and growing US trade deficits with China, which hit a record high of $383 billion in 2017. In alignment with the mercantilism view on trade, President Trump believed that the vast trade deficit with China hurt the US economy and undermined his political base, particularly with the working class.
On August 14, 2017, President Trump directed the Office of the US Trade Representative (USTR) to probe into China’s trade practices and see if they warranted retaliatory actions under the US trade law. While the investigation was ongoing, the Trump administration also held several trade negotiations with China, pushing the Chinese side to purchase more US goods and reduce the bilateral trade imbalances. However, the talks resulted in little progress.
President Trump lost his patience with China in the summer of 2018. In the following months, citing the USTR Section 301 investigation findings, the Trump administration announced imposing a series of punitive tariffs on nearly half of US imports from China, or approximately $250 billion in total. As a result, for more than 1,000 types of products, US companies importing them from China would have to pay the regular import duties plus a 10%-25% additional import tax. However, the Trump administration’s trade team purposefully excluded consumer products such as clothing and shoes from the tariff actions. The last thing President Trump wanted was US consumers, especially his political base, complaining about the rising price tag when shopping for necessities. The timing was also a sensitive factor—the 2018 congressional mid-term election was only a few months away.
President Trump hoped his unprecedented large-scale punitive tariffs would change China’s behaviors on trade. It partially worked. As the trade frictions threatened economic growth, the Chinese government returned to the negotiation table. Specifically, the US side wanted China to purchase more US goods, reduce the bilateral trade imbalances and alter its “unfair” trade practices. In contrast, the Chinese asked the US to hold the Section 301 tariff action immediately.
However, the trade talks didn’t progress as fast as Trump had hoped. Even worse, having to please domestic forces that demanded a more assertive stance toward the US, the Chinese government decided to impose retaliatory tariffs against approximately $250 billion US products. President Trump felt he had to do something in response to China’s new action. In August 2019, he suddenly announced imposing Section 301 tariffs on a new batch of Chinese products, totaling nearly $300 billion. As almost everything from China was targeted, apparel products were no longer immune to the tariff war.With the new tariff announcement coming at short notice, US fashion brands and retailers were unprepared for the abrupt escalation since they typically placed their sourcing orders 3-6 months before the selling season.
Nevertheless, Trump’s new Section 301 actions somehow accelerated the trade negotiation. The two sides finally reached a so-called“phase one” trade agreementin about two months. As part of the deal, China agreed to increase its purchase of US goods and services by at least $200 billion over two years, or almost double the 2017 baseline levels. Also, China promised to address US concerns about intellectual property rights protection, illegal subsidies, and forced technology transfers. Meanwhile, the US side somewhat agreed to trim the Section 301 tariff action but rejected removing them. For example, the punitive Section 301 tariffs on apparel products were cut from 15% to 7.5% since implementing the “phase one” trade deal.
Trump lost the 2020 presidential election, and Joe Biden was sworn in as the new US president on January 20, 2021. However, the Section 301 tariff actions and the US-China “phase one” trade deal stayed in force.
Debate on the impact of the US-China tariff war
Like many other trade policies, the US Section 301 tariff actions against China raised heated debate among stakeholders with competing interests. This was the case even among different US textile and apparel industry segments.
On the one hand, US fashion brands and retailers strongly oppose the punitive tariffs against Chinese products for several reasons:
First, despite the Section 301 tariff action, China remained a critical apparel sourcing base for many US fashion companies with no practical alternative. Trade statistics show that four years into the tariff war, China still accounted for nearly 40 percent of US apparel imports in quantity and about one-third in value as of 2021. According to the latest data, in the first ten months of 2022, China remained the top apparel supplier, accounting for 35% of US apparel imports in quantity and 22.2% in value. Studies also consistently find that US fashion companies rely on China to fulfill orders requiring a small minimum order quantity, flexibility, and a great variety of product assortment.
Second, having to import from China, fashion companies argued that the Section 301 punitive tariffs increased their sourcing costs and cut profit margins. For example, for a clothing item with an original wholesale price of around $7, imposing a 7.5% Section 301 punitive tariff would increase the sourcing cost by about 5.8%. Should fashion companies not pass the cost increase to consumers, their retail gross margin would be cut by 1.5 percentage points. Notably, according to the US Fashion Industry Association’s 2021 benchmarking survey, nearly 90 percent of respondents explicitly say the tariff war directly increased their company’s sourcing costs. Another 74 percent say the tariff war hurt their company’s financials.
Third, as companies began to move their sourcing orders from China to other Asian countries like Vietnam, Bangladesh, and Cambodia to avoid paying punitive tariffs, these countries’ production costs all went up because of the limited production capacity. In other words, sourcing from everywhere became more expensive because of the Section 301 action against China.
Further, it is important to recognize that fashion companies supported the US government’s efforts to address China’s “unfair” trade practices, such as subsidies, intellectual property rights violations, and forced technology transfers. Many US fashion companies were the victims of such practices. However, fashion companies did not think the punitive tariff was the right tool to address these problems effectively. Instead, fashion brands and retailers were concerned that the tariff war unnecessarily created an uncertain and volatile market environment harmful to their business operations.
“While NCTO members support the inclusion of finished products in Section 301, we are seriously concerned that…adding tariffs on imports of manufacturing inputs that are not made in the US such as certain chemicals, dyes, machinery, and rayon staple fiber in effect raises the cost for American companies and makes them less competitive with China.”
Mitigate the impact of the tariff war: Fashion Companies’ Strategies
The first approach was to switch to China’s alternatives. Trade statistics suggest that Asian countries such as Vietnam and Bangladesh picked up most of China’s lost market shares in the US apparel import market. For example, in 2022 (Jan-Nov), Asian countries excluding China accounted for 51.2% of US apparel imports, a substantial increase from 41.2% in 2018 before the tariff war. In comparison, about 16.4% of U.S. apparel imports came from the Western Hemisphere in 2021 (Jan-Nov), lower than 17.0% in 2018. In other words, no evidence shows that Section 301 tariffs have expanded U.S. apparel sourcing from the Western Hemisphere.
The second approach was to adjust what to source from China by leveraging the country’s production capacity and flexibility. For example, market data from industry sources showed that since the Section 301 tariff action, US fashion companies had imported more “Made in China” apparel in the luxury and premium segments and less for the value and mass markets. Such a practice made sense as consumers shopping for premium-priced apparel items typically were less price-sensitive, allowing fashion companies to raise the selling price more easily to mitigate the increasing sourcing costs. Studies also found that US companies sourced fewer lower value-added basic fashion items (such as tops and underwear), but more sophisticated and higher value-added apparel categories (such as dresses and outerwear) from China since the tariff war.
China is no longer treated as a sourcing base for low-end cheap product
More apparel sourced from China target the premium and luxuary market segments
Related, US fashion companies such as Columbia Sportswear leveraged the so-called “tariff engineering” in response to the tariff war. Tariff engineering refers to designing clothing to be classified at a lower tariff rate. For example, “women’s or girls’ blouses, shirts, and shirt-blouses of man-made fibers” imported from China can tax as high as 26.9%. However, the same blouse added a pocket or two below the waist would instead be classified as a different product and subject to only a 16.0% tariff rate. Nevertheless, using tariff engineering requires substantial financial and human resources, which often were beyond the affordability of small and medium-sized fashion companies.
Third, recognizing the negative impacts of Section 301 on US businesses and consumers, the Office of the US Trade Representative (USTR) created a so-called “Section 301 exclusion process.” Under this mechanism, companies could request that a particular product be excluded from the Section 301 tariffs, subject to specific criteria determined at the discretion of USTR. The petition for the product exclusion required substantial paperwork, however. Even companies with an in-house legal team typically hire a DC-based law firm experienced with international trade litigation to assist the petition, given the professional knowledge and a strong government relation needed. Also of concern to fashion companies was the low success rate of the petition. The record showed that nearly 90 percent of petitions were denied for failure to demonstrate “severe economic harm.” Eventually, since the launch of the exclusion process, fewer than 1% of apparel items subject to the Section 301 punitive tariff were exempted. Understandably, the extra financial burden and the long shot discouraged fashion companies, especially small and medium-sized, from taking advantage of the exclusion process.
In conclusion, with USTR’s latest announcement, the debate on Section 301 and the outlook of China as a textile and apparel sourcing base will continue. Notably, while economic factors matter, we shall not ignore the impact of non-economic factors on the fate of the Section 301 tariff action against China. For example, with the implementation of the Uyghur Forced Labor Prevention Act (UFLPA), only about 10% of US cotton apparel imports came from China in the first ten months of 2022 (latest data available), the lowest in a decade. As the overall US-China bilateral trade relationship significantly deteriorated in recent years and the friction between the two countries expanded into highly politically sensitive areas, the Biden administration could “willfully” choose to keep the Section 301 tariff as negotiation leverage. Domestically, President Biden also didn’t want to look “weak” on his China policy, given the bipartisan support for taking on China’s rise.
This article provided a comprehensive review of the world textiles and clothing trade patterns in 2021 based on the newly released data from the World Trade Statistical Review 2022 and the United Nations (UNComtrade). Affected by the ongoing pandemic and companies’ evolving production and sourcing strategies in response to the shifting business environment, the world textiles and clothing trade patterns in 2021 included both continuities and new trends. Specifically:
Pattern #1: As the world economy recovered from COVID, the world clothing export boomed in 2021, while the world textile exports grew much slower due to a high trade volume the year before. Specifically, thanks to consumers’ strong demand, world clothing exports in 2021 fully bounced back to the pre-COVID level and exceeded $548.8bn, a substantial increase of 21.9% from 2020. The apparel sector is not alone. With economic activities mostly resumed, the world merchandise trade in 2021 also jumped 26.5% from a year ago, the fastest growth in decades.
In comparison, the value of world textiles exports grew slower at 7.8% in 2021 (i.e., reached $354.2bn), lagging behind most sectors. However, such a pattern was understandable as the textile trade maintained a high level in 2020, driven by high demand for personal protective equipment (PPE) during the pandemic.
Nevertheless, the world textiles and clothing trade could face strong headwinds down the road due to a slowing world economy and consumers’ weakened demand. Notably, amid hiking inflation, high energy costs, and retrenchment of global supply chains, leading international economic agencies, from the World Bank to the International Monetary Fund (IMF), unanimously predict a slowing economy worldwide. Likewise, the World Trade Organization (WTO) forecasts that the growth of world merchandise trade will be cut to 3.5% in 2022 and down further to only 1% in 2023. As a result, the world textiles and clothing trade will likely struggle with stagnant growth or a modest decline over the next two years.
Pattern #2: COVID did NOT fundamentally shift the competitive landscape of textile exports but affected the export product structure. Meanwhile, some long-term structural changes in world textile exports continued in 2021.
Specifically, China, the European Union (EU), and India remained the world’s three largest textile exporters in 2021, a pattern that has stayed stable for over a decade. Together, these top three accounted for 68% of the world’s textile exports in 2021, similar to 66.9% before the pandemic (2018-2019). Other textile exporters that made it to the top ten list in 2021 were also the same as a year ago and before the pandemic (2018-2019).
Meanwhile, the growth rate of the top ten textile exporters varied significantly in 2021, ranging from -5.5% (China) to 47.8% (India). The demand shift from PPE to apparel-related yarns and fabrics was a critical contributing factor behind the phenomenon. For example, China’s PPE-related textile exports decreased by more than $33bn (or down 43%) in 2021. In contrast, the world knit fabric exports (SITC code 655) surged by more than 30% in 2021, led by India (up 74%) and Pakistan (up 72%). Nevertheless, as consumers’ lifestyles almost reached a “new normal,” we could expect the textile export product structure to stabilize soon.
On the other hand, as a trend already emerged before the pandemic, middle-income developing countries continued to play a more significant role in textile exports, whereas developed countries lost market shares. For example, the United States, Germany, and Italy led the world’s textile exports in the 2000s, accounting for more than 20% of the market shares. However, these three countries’ shares fell to 12.8% in 2019 and hit a new low of 11.3% in 2021. In comparison, middle-income developing countries like China, Vietnam, Turkey, and India have entered the development stage of expanding textile manufacturing. As a result, their market share in the world’s textile exports rose steadily. These countries also achieved a more balanced textiles/clothing export ratio over the years, meaning more textile raw materials like yarns and fabrics can be locally produced instead of relying on imports. For example, Vietnam, known for its competitive clothing products, achieved a new high of $11.5bn in textile exports in 2021 and ranked sixth globally. Vietnam’s textiles/clothing ratio also doubled from 0.15 in 2005 to 0.37 in 2021. It is not unlikely that Vietnam’s textile exports may surpass the United States over the next few years.
Pattern #3: Countries with large-scale production capacity stood out in world clothing exports in 2021. Meanwhile, clothing exporters compete to become China’s alternatives, but there seems to be no clear winner yet.
Consumers’ surging demand and COVID-related supply chain disruptions significantly impacted the world’s clothing export patterns in 2021. As fashion brands and retailers were eager to find sourcing capacity, countries with large-scale production capacity and relatively stable supply enjoyed the fastest growth in clothing exports. For example, except for Vietnam, which suffered several months of COVID lockdowns, all other top five clothing exporters enjoyed a more than 20% growth of their exports in 2021, such as China (up 24%), Bangladesh (up 30%), Turkey (up 22%), and India (up 24%).
As another critical trend, many international fashion brands and retailers have been trying to reduce their apparel sourcing from China, driven by various economic and non-economic factors, from cost considerations and trade tensions to geopolitics. Notably, despite its strong performance in 2021, China accounted for only 23.1% of US apparel imports in 2022 (January to September), much lower than 36.2% in 2015. Likewise, China’s market shares in the EU, Japanese, and Canadian clothing import markets also fell over the same period, suggesting this was a worldwide phenomenon.
With reduced apparel sourcing from China, fashion companies have actively sought alternative sourcing destinations, but the latest trade data suggests no clear winner yet. For example, Vietnam and Bangladesh, the two most popular candidates for “Next China,” accounted for 6.5% and 5.7% shares in the world’s clothing export in 2021, still far behind China (32.1%). Interestingly, from 2015 to 2021, the world’s top four largest clothing exporters next to China (i.e., Bangladesh, Vietnam, Turkey, and India) did not substantially gain new market shares. Instead, China’s lost market was filled by “the rest of the world.”
Additionally, recent studies show that many fashion companies have switched back to the sourcing diversification strategy in 2022 as managing risks and improving sourcing flexibility become more urgent priorities. In other words, the world’s clothing export market could turn more “crowded” and competitive in the coming years.
Pattern #4: Regional supply chains remain critical features of the world textiles and clothing trade. Several factors support and shape the regional textiles and clothing trade patterns. First, as clothing production often needs to be close to where textile materials are available, many developing clothing-producing countries rely heavily on imported textile materials, primarily from more advanced economies in the same region. Second, through lowered trade barriers, regional free trade agreements also financially encouraged garment producers, particularly in Asia, the EU, and Western Hemisphere (WH), to use locally or regionally made textile materials. Further, fashion companies’ interest in “near-shoring” supported the regional supply chain, and related textiles and clothing trade flows between neighboring countries.
The latest trade data indicated that Asia’s regional textiles and clothing trade patterns strengthened further despite supply chain chaos during the pandemic. Specifically, in 2021, as many as 82% of Asian countries’ textile imports came from within Asia, up from 80% in 2015. China, in particular, has played a more prominent role as a leading textile supplier for other Asian clothing-exporting countries. For example, more than 60% of Vietnam’s textile imports came from China in 2021, a substantial increase from 23% in 2005. The same pattern applied to Pakistan, Cambodia, Bangladesh, and the Association of Southeast Asian Nations (ASEAN) members.
In January 2022, the Regional Comprehensive Economic Partnership (RCEP), a mega free trade agreement involving all major economies in Asia, entered into force. The tariff cut and very liberal rules of origin of the agreement will hopefully drive Asia’s booming regional textiles and clothing trade and further deepen its regional economic integration.
Besides Asia, the regional textiles and clothing trade pattern in the EU (or the so-called Intra-EU trade) was also in good shape. In 2021, 50.8% of EU countries’ textile imports and 37% of clothing imports came from other EU members. This pattern has changed little over the past decade, thanks to many EU countries’ commitment to maintaining local textiles and clothing production rather than outsourcing.
In comparison, the Western Hemisphere (WH) textile and apparel supply chain (e.g., clothing made in Mexico or Central America using US or regionally made textiles) seemed to struggle in recent years. As of 2021, only 20% of WH countries’ textile imports came from within WH, down from 26% in 2015. Likewise, WH countries (mainly the US and Canada) just imported 14.6% of clothing from WH in 2021, down from 15.3% in 2015 and much lower than their EU counterparts (37% in 2021). It will be interesting to see whether US and Canadian fashion companies’ expressed interest in expanding near-shoring may reverse the course.
Furthermore, the regional textiles and clothing trade patterns in Sub-Saharan Africa (SSA) are also worth watching. Compared with Asia and the EU, SSA clothing producers used much fewer locally-made textiles (i.e., stagnant at around 11% only from 2011 to 2021), reflecting the region’s lack of textile manufacturing capability. Most trade programs with SSA countries, such as the US-led African Growth and Opportunity Act (AGOA) and EU’s Everything But Arms (EBA) program, adopt liberal rules of origin for clothing products, allowing third-party textile input to be used. It can be studied whether such liberal rules of origin somehow disincentivize building SSA’s own textile manufacturing sector or are still essential given the reality of SSA’s limited textile production capacity.
Video 3: Vietnam’s textile and apparel industry amid the pandemic
Video 4: How H&M’s Recycling Machines Make New Clothes From Used Apparel in Hong Kong
Discussion questions:
How are textiles and apparel “Made in Asia” changing their face? What are the driving forces of these changes?
Based on the video, why or why not do you think the “flying geese model” is still valid today?
How to understand COVID-19’s impact on Asia’s textile and apparel industry? What strategies have been adopted by garment factories in Asia to survive the pandemic? What challenges do they still face?
What is your evaluation of Asia’s competitiveness as a textile and apparel production and sourcing hub over the next five years? Why? What factors could be relevant?
Anything else you find interesting/intriguing/thought-provoking/debatable in the video? Why?
Note: Everyone is welcome to join our online discussion. For students in FASH455, please address at least two questions. Please mention the question number # (no need to repeat the question) in your comment.
The full interview, conducted by Modaes’ Editor-in-Chief, Iria P. Gestal, is available HERE (in Spanish). Below is an abridged translation.
Question: Fashion brands have reduced their exposure to China markedly in recent years. What has been the turning point?
Sheng: We could interpret fashion companies’ decisions in the context of their overall sourcing diversification strategy. Many companies want to diversify their sourcing base because of the ever-uncertain business environment, ranging from the continuation of the supply chain disruptions, and the Russia-Ukraine war, to the rising geopolitical tensions. As China is one of the largest sourcing bases for many fashion companies, reducing “China exposure” is unavoidable.
Question: Isn’t there a specific concern about sourcing from China?
Sheng: Definitely! The Uyghur Forced Labor Prevention Act (UFLPA), officially implemented in the summer of 2022, is a big deal. For example, back in 2017, around 30% of US cotton apparel came from China. However, because of the new law and concerns about the risk of forced labor, China’s market shares fell to only 10% as of August 2022. One well-known US brand selling jean products cut their sourcing from China to just 1% of the total.
Question: Is it possible that the apparel sector as a whole reaches that point?
Sheng: Whether we like it or not, it is still unlikely to get rid of China from the supply chain entirely in the short to medium terms. Notably, China continues to play a significant role as a supplier of raw textile materials, particularly for leading apparel-exporting countries in Asia like Vietnam, Bangladesh, and Cambodia. Diversifying textile raw materials sourcing will be a longer and more complicated process.
Question: Is the “China Plus One” strategy no longer enough?
Sheng: The “China Plus One” strategy does not necessarily mean companies only source from “two” countries. Instead, the phrase refers to companies’ sourcing diversification strategy, trying to avoid “putting all eggs in one basket.” However, neither is the case that fashion companies blindly source from more countries today. Notably, many companies attempt to leverage a stronger relationship with key vendors to mitigate sourcing risks and achieve more sourcing flexibility and agility. For example, fashion companies increasingly tend to work with the so-called “super vendors,” i.e., those with multiple country presence and vertical manufacturing capabilities.
Question: Some politicians have said that the war in Russia has been the “geopolitical awakening” of Europe. Has the same thing happened in fashion?
Sheng: Indeed! We say fashion is a “global sector” because companies “produce anywhere in the world and SELL anywhere in the world.” However, many fashion brands and retailers have had to leave Russia due to the war and geopolitics. The same could apply to China—for example, China’s zero-COVID policy has posed a dilemma for western fashion companies operating there—whether to stay or leave the country, which used to be regarded as one of the fastest-growing emerging consumer markets. Likewise, more and more fashion companies have chosen to develop “dual supply chains” in response to the geopolitical tensions between China and the West—“made in China for China” and “made elsewhere for the rest of the world/Western market.” However, we must admit that this is not an ideal way to optimize the global supply chain.
Question: Has the apparel sector been “naïve” until now, ignoring these risks?
Sheng: I do not think so. In fact, most fashion companies and their leaders closely watch world affairs. As I recall, some visionary companies started evaluating geopolitics’ supply chain implications last year. Indeed, a peaceful world with few trade barriers is an ideal business environment for fashion companies. Unfortunately, there are too many “black swans” to worry about these days. As another example, “friend-shoring,” meaning only trading with allies or “like-minded” countries, becomes increasingly popular today. This phenomenon is also the result of geopolitics. With the looming of a new cold war (or the winter is already here), fashion companies may need to use imagination and prepare for the “worst scenarios” to come.
Question: Is a textile and apparel supply without China a more expensive one?
Sheng: It depends on how to look at it. The most challenging part of “reducing China exposure” is the textile raw materials. But we could think outside the box. For example, my recent studies show that China is NOT the top supplier of clothing made from recycled textile materials. Instead, fashion companies are more likely to source such products locally from the US or EU, or Africa—like Jordan, Tunisia, and Morocco, because of the unique supply chain composition. In other words, sourcing more clothing made from recycled textile materials may help fashion companies achieve several long-awaited goals, such as diversifying sourcing base, expanding nearshoring, and reducing sourcing costs.
U.S. fashion companies report significant challenges coming from the macro-economy in 2022, particularly inflation and rising cost pressures. However, most respondents still feel optimistic about the next five years.
Respondents rated “increasing production or sourcing costs” and “inflation and outlook of the U.S. economy” as their 1st and 3rd top business challenges in 2022.
As a new record, 100 percent of respondents expect their sourcing costs to increase in 2022, including nearly 40 percent expecting a substantial cost increase from a year ago. Further, almost everything has become more expensive this year, from textile raw materials, shipping, and labor to the costs associated with compliance with trade regulations.
Over 90 percent of respondents expect their sourcing value or volume to grow in 2022, but more modest than last year.
Despite the short-term challenges, most respondents (77 percent) feel optimistic or somewhat optimistic about the next five years. Reflecting companies’ confidence in their businesses, nearly ALL respondents (97 percent) plan to increase hiring over the next five years.
U.S. fashion companies adopt a more diverse sourcing base in response to supply chain disruptions and the need to mitigate growing sourcing risks.
Asia remains the dominant sourcing base for U.S. fashion companies—eight of the top ten most utilized sourcing destinations are Asia-based, led by China, Vietnam, Bangladesh, and India.
More than half of respondents (53 percent) report sourcing apparel from over ten countries in 2022, compared with only 37 percent in 2021.
Reducing “China exposure” is one crucial driver of U.S. fashion companies’ sourcing diversification strategy. One-third of respondents report sourcing less than 10% of their apparel products from China this year. In addition, a new record of 50 percent of respondents sources MORE from Vietnam than China in 2022.
Nearly 40 percent of respondents plan to “source from more countries and work with more suppliers” over the next two years, up from only 17 percent last year.
Managing the risk of forced labor in the supply chain is a top priority for U.S. fashion companies in 2022, especially with the new implementation of the Uyghur Forced Labor Prevention Act (UFLPA).
Over 95 percent of respondents expect UFLPA’s implementation to affect their company’s sourcing. Notably, more than 85 percent of respondents plan to cut their cotton-apparel imports from China, and another 45 percent to further reduce non-cotton apparel imports from the country.
Most respondents (over 92 percent) do NOT plan to reduce apparel sourcing from Asian countries other than China. However, nearly 60 percent of respondents also would “explore new sourcing destinations outside Asia” in response to UFLPA.
Mapping and understanding the supply chain is a critical strategy adopted by U.S. fashion companies to address the forced labor risks in the supply chain. Almost all respondents currently track Tier 1 and 2 suppliers. With the help of new traceability technologies, 53 percent of respondents have started tracking Tier 3 suppliers this year (i.e., those manufacturing yarn, threads, and trimmings), a substantial increase from 25-36 percent in the past.
There is considerable new excitement about increasing apparel sourcing from members of the Dominican Republic-Central America Free Trade Agreement (CAFTA-DR). Respondents also call for more textile raw sourcing flexibility to encourage apparel sourcing from the CAFTA-DR region.
CAFTA-DR plays a more significant role as a sourcing base. About 20 percent of respondents place more than 10% of their sourcing orders from the region, doubling from 2021.
Over the next two years, more than 60 percent of respondents plan to increase apparel sourcing from CAFTA-DR members as part of their sourcing diversification strategy.
CAFTA-DR is critical in promoting U.S. apparel sourcing from the region. Around 80 percent of respondents took advantage of the agreement’s duty-free benefits when sourcing apparel from the region this year, up from 50—60 percent in the past.
Respondents say the exceptions to the “yarn-forward” rules of origin, such as the “short supply” and “cumulation” mechanisms, provide essential flexibility that encourages more apparel sourcing from CAFTA-DR members.
Respondents say improving textile raw material supply is critical to encouraging more U.S. apparel sourcing from CAFTA-DR members. Particularly, “allowing more flexibility in souring fabrics from outside CAFTA-DR” and “improving yarn production capacity and variety within CAFTA-DR” are the top two priorities.
U.S. fashion companies strongly support another ten-year renewal of the African Growth and Opportunity Act (AGOA). Meanwhile, Ethiopia’s loss of AGOA eligibility discourages U.S. apparel sourcing from the ENTIRE AGOA region.
As much as 75 percent of respondents say another ten-year AGOA renewal will encourage more apparel sourcing from the region and making investment commitments.
However, despite the tariff benefits and the liberal rules of origin, respondents express explicit concerns about the region’s lack of competitiveness in speed to market, political instability, and having an integrated regional supply chain.
Ethiopia’s loss of AGOA benefits had a notable negative impact on sourcing from the country AND the entire AGOA region. Notably, no respondent plans to move sourcing orders from Ethiopia to other AGOA beneficiaries.
The latest trade data shows that in the first four months of 2022, US apparel imports increased by 40.6% in value and 25.9% in quantity from a year ago. However, the seemingly robust import expansion is shadowed by the rising market uncertainties.
Uncertainty 1: US economy. As the US economic growth slows down, consumers have turned more cautious about discretionary spending on clothing to prioritize other necessities. Notably, in the first quarter of 2022, clothing accounted for only 3.9% of US consumers’ total expenditure, down from 4.3% in 2019 before the pandemic. Likewise, according to the Conference Board, US consumers’ confidence index (CCI) dropped to 106.4 (1985=100) in May 2022 from 113.8 in January 2022, confirming consumers’ increasing anxiety about their household’s financial outlook.
Removing the seasonal factor, US apparel imports in April 2022 went up 2.8% in quantity and 3.0% in value from March 2022, much lower than 9.3% and 11.9% a month ago (i.e., March 2022 vs. February 2022). The notable slowed import growth reflects the negative impact of inflation on US consumers’ clothing spending. According to the Census, the value of US clothing store sales marginally went up by 0.8% in April 2022 from a month ago, also the lowest so far in 2022.
Apparel import price index
Uncertainty 2: Worldwide inflation. Data from the Bureau of Economic Analysis shows that the price index of US apparel imports reached 103.1 in May 2022 (May 2020=100), up from 100.3 one year ago (i.e., a 2.8% price increase). At the product level (i.e., 6-digit HS Code, HS Chapters 61-62), over 60% of US apparel imports from leading sources such as China, Vietnam, Bangladesh, and CAFTA-DR experienced a price increase in the first quarter of 2022 compared with a year ago. The price surge of nearly 40% of products exceeded 10 percent. As almost everything, from shipping, textile raw materials, and labor to energy, continues to soar, the rising sourcing costs facing US fashion companies are not likely to ease anytime soon.
The deteriorating inflation also heats up the debate on whether to continue the US Section 301 tariff action against imports from China. Since implementing the punitive tariffs, US fashion companies have to pay around $1 billion in extra import duties every year, resulting in the average applied import tariff rate for dutiable apparel items reaching almost 19%. Although some e-commerce businesses took advantage of the so-called “de minimis” rule (i.e., imports valued at $800 or less by one person on a day are not required to pay tariffs), over 99.8% of dutiable US apparel imports still pay duties.
Uncertainty 3: “Made in China.” US apparel imports from China in April 2022 significantly dropped by 26.7% in quantity and 24.6% in value from March 2022 (seasonally adjusted). China’s market shares also fell to a new record low of 26.3% in quantity and 16.8% in value in April 2022. The zero-COVID policy and new lockdown undoubtedly was a critical factor contributing to the decline. Fashion companies’ concerns about the trajectory of the US-China relations and the upcoming implementation of the new Uyghur Forced Labor Prevention Act (UFLPA) are also relevant factors. For example, only 10.5% of US cotton apparel imports came from China in April 2022, a further decline from about 15% at the beginning of the year. Given the expected challenges of meeting the rebuttable presumption requirements in UFLPA and the high compliance costs, it is not unlikely that US fashion companies may continue to reduce their China exposure.
As US fashion companies source less from China, they primarily move their sourcing orders to China’s competitors in Asia. Measured in value, about 74.8% of US apparel imports came from Asia so far in 2022 (January-April), up from 72.8% a year ago. In comparison, there is no clear sign that more sourcing orders have been permanently moved to the Western Hemisphere. For example, in April 2022, CAFTA-DR members accounted for 9.3% of US apparel imports in quantity (was 10.8% in April 2021) and 10.2% in value (was 11.4% in April 2021).
Uncertainty 4: Shipping delays. Data suggests we are not out of the woods yet for shipping delays and supply chain disruptions. For example, as Table 2 shows, the seasonable pattern of US apparel imports in March 2022 is similar to January before the pandemic (2017-2020). In other words, many US fashion companies still face about 1.5-2 months of shipping delays. Additionally, several of China’s major ports were under strict COVID lockdowns starting in late March, including Shanghai, the world’s largest. Thus, the worsened supply chain disruptions could negatively affect the US apparel import volumes in the coming months.
Congress might assess the U.S. experience with the Phase One process as it debates the merits of the deal and how to leverage it, the effects of the tariffs, and options to advance U.S. economic interests and counter China’s persistent statist economic practices. Specifically:
In light of how difficult it was to secure China’s acknowledgment of its practices of concern and limited commitments in these areas, to what extent may the U.S. reasonably expect talks with Beijing to achieve outcomes that further U.S. policy objectives, when measured against the U.S. resources and efforts required? Does focusing on talks with China take U.S. focus and resources away from efforts to deploy or develop U.S. trade tools and joint approaches with other countries that might be required to protect and advance U.S. economic interests?
Is the executive branch fully using its authorities to address its concerns about China? Are other approaches and measures needed in addition to or separate from tariffs, and if so, what are they? Should the USTR use Section 301 to address other concerns, such as subsidies? What approaches could be pursued, such as prior efforts with Europe and Japan to address non-market economic distortions and subsidies?
Should Congress require the USTR to enforce the Phase One provisions and actively use the Phase One dispute process? Should the USTR challenge China’s industrial policies that appear to violate commitments not to require technology transfer, and its efforts to set global technology licensing and pricing terms, such as through its courts?
How might Congress weigh the tariffs’ effects on U.S. firms and consumers against issues of economic competitiveness? To what extent are tariffs inflationary compared to drivers such as food, energy, housing, labor and supply chain shortages, and monetary policy?
Could tariffs help diversify China-based supply chains and counter China’s subsidies by raising costs vis-à-vis U.S. and third-market products? Could tariffs on goods tied to China’s industrial policies help level the playing field, or would this violate U.S. trade commitments and encourage others to follow suit? USTR proposed but never enacted tariffs on consumer electronics. Could these tariffs counter China’s efforts to deepen technology supply chains in China?
Congress could engage with the Administration to develop and implement guidelines for when and how to grant and extend exclusions. This could potentially promote transparency, consistency, and proper application of standards in reviewing requests, thereby helping to ensure that the USTR carries out Section 301 objectives as prescribed by Congress
What role should Congress play in the negotiation and consideration of an IPEF and other regional trade initiatives? What regional and other multilateral trade commitments would best serve U.S. economic and strategic interests in the region?
What types of enforcement mechanisms would an IPEF include and how would its commitments and enforceability compare to CPTPP and U.S. free trade agreements? What are the tradeoffs of these approaches and should they be pursued in tandem?
How does the expiration of U.S. Trade Promotion Authority (TPA) affect the Administration’s approach to scoping, negotiating, and enacting an IPEF and trade agreements?
AGOA reauthorization. AGOA is authorized through September 2025. US Trade Representative Katherine Tai has urged consideration of improvements to encourage investment, and help small and women-owned businesses and more countries make use of the program. Congress may consider whether and when to reauthorize AGOA and if reforms are needed.
Free trade agreement (FTA) negotiations. An FTA with an AGOA-eligible country would have implications for AGOA and U.S. trade relations in the region. As the Administration, in consultation with Congress, determines whether to pursue trade negotiations in the region, including with Kenya, key considerations include: (1) what flexibilities from typical U.S. FTA commitments are appropriate; (2) potential effects on broader AGOA utilization; and (3) potential effects on regional initiatives like the African Continental Free Trade Area(AfCFTA).
Increased U.S. tariffs. The Trump administration imposed tariff increases (Section 232) on steel and aluminum imports. Congress may examine the tariffs’ effects on AGOA participants.
Third-party agreements. Reciprocal agreements between AGOA beneficiaries and third parties (e.g., EU-South Africa) may disadvantage U.S. exporters. Congress may examine possible U.S. responses.
Congress may consider and advise the Administration on how to prioritize free trade agreement (FTA) talks with Kenya among other U.S. trade policy objectives; whether and in what form to seek renewal of the Trade Promotion Authority (TPA); the scope and extent of potential U.S.-Kenya FTA commitments to pursue; how to ensure an FTA with Kenya and its rules of origin support regional integration efforts and U.S. economic interests; and the potential types of support (e.g., trade capacity building funds) and flexibilities (e.g., phasing in of commitments) to include as appropriate to Kenya’s level of development)
Congress may continue to monitor U.S. trade and economic interests at stake in the UK-EU Trade and Cooperation Agreement (TCA)’s implementation. It may consider whether to press the Administration to continue to prioritize resolving specific trade issues and/or renew broader U.S-UK free trade agreement negotiations. In doing so, Congress may examine the potential benefits and costs of further U.S.-UK trade liberalization (or its absence) for the firms and workers in their districts and states.
Many in Congress and in the U.S. industry support a U.S.-UK FTA. Many Members tie their support to ensuring that Brexit outcomes do not undermine the Northern Ireland peace process. A potential TPA renewal debate could heighten these issues. If FTA talks proceed, Congress may monitor and shape them, and consider implementing legislation for a final agreement. Additionally, Members may examine other ways to engage further on bilateral and global trade issues of shared concern, e.g., sectoral regulatory cooperation or dialogues.
The GSP program expired on December 31, 2020. Congress is considering several bills to reauthorize and introduce new eligibility criteria to the program. Some of the proposed eligibility criteria include provisions on human rights, environmental laws, and good governance. Supporters of the proposed eligibility criteria consider it a modernization of the GSP program to address modern-day issues. Others raise concerns that adding new criteria may make the costs of complying with the program outweigh the benefits and discourage beneficiary developing countries’ participation. They may also undermine the core objectives of the program, which is to promote economic development through trade.
Other possible options for GSP include:
Support reciprocal tariff and market access benefit through free trade agreements (FTAs). Some U.S. policymakers have suggested that developing countries might benefit more through WTO multilateral negotiations, FTAs, or some form of agreement that could also provide reciprocal trade benefits and improved market access for the United States.
Authorize GSP only for Least-Developed Countries (LDCs). Narrowing the scope of eligibility could benefit the LDC that remains in the program by reducing competition in the U.S. market from more advanced developing countries. Assuming that many LDCs would continue to receive the GSP preference under AGOA, other LDCs that might benefit from an LDC-only GSP program are Afghanistan, Bhutan, Burma, Burundi, Cambodia, Congo (Kinshasa), Haiti, Kiribati, Mauritania, Nepal, Samoa, Somalia, South Sudan, the Solomon Islands, Timor-Leste,Tuvalu, and Vanuat.
Expand the application of GSP. For example, allow some import-sensitive products to receive preferential access (such as apparel). Increase the flexibility of rules of origin (ROO) requirements. For example, allow more GSP beneficiaries to cumulate inputs with other beneficiaries to meet the 35% domestic content requirement or lower the domestic content requirement. Eliminate competitive need limitations or raise the thresholds. Reauthorize GSP for longer terms or make the program permanent.
Restrict Application of Preferences. For example: Consider mandatory graduation for “middle income.” Strengthen provision that allows graduation of individual industry sectors within beneficiary countries. Reform eligibility criteria to strengthen provisions on worker rights as well as introduce new criteria, such as good governance, gender equality, and environmental law and regulation.
Congress may examine and weigh in on the TTC’s structure, priorities and scope, and prospects for “success.”
TTC’s anticipated prioritization of more recent or urgent issues (such as joint responses to Russia’s aggression in Ukraine), compared to other bilateral trade and technology issues (such as digital inclusion) that were priorities at the time of the TTC launch. Congress may explore potential trade-offs in priorities and/or opportunities to expand the TTC, such as by creating additional working groups or structures to sustain intensified cooperation on major bilateral trade issues. This may include a review of whether to modify the scope of the TTC’s working groups to address bilateral tariffs and other market access issues. Congress also may explore opportunities through the TTC to intensify U.S.-EU cooperation to remove regulatory barriers.
Congress may examine the TTC’s prospects for success and its ability to produce concrete outcomes, and also seek to establish the metrics by which to gauge the TTC’s effectiveness.
Congress may examine whether to pursue potential market opening opportunities through the TTC for future formal US-EU FTA talks, or pursue such talks separately. On one hand, potential FTA negotiations that develop out of the TTC could benefit from the intensified cooperation and renewed trust that the TTC may foster. On the other hand, such talks may be limited if they do not address bilateral tariffs or other market access issues.
Japan has one of the world’s largest apparel consumption markets, with retail sales totaling USD$100bn in 2021, only after the United States (USD$476bn) and China (USD$411bn). Meanwhile, like many other developed economies, most apparel consumed in Japan are imported, making the country a considerable sourcing and market access opportunity for fashion companies and sourcing agents around the globe.
Japanese fashion companies primarily source apparel from Asia. Data shows that Japanese fashion brands and retailers consistently imported more than 90% of clothing from the Asia region, much higher than their peers in the US (about 75%), the EU (50%), and the UK (about 60%). This pattern reflects Japan’s deep involvement in the Asia-based textile and apparel supply chain.
Notably, Japan’s apparel imports from Asia often contain textile raw materials “made in Japan.” Data shows that in 2021, about 65% of Japan’s yarn exports, 75% of woven fabric exports, and 90% of knit fabric exports went to the Asia region, particularly China and ASEAN members. Understandably, in Japan’s apparel retail stores, it is not rare to find clothing labeled “made in China” or “Made in Vietnam” but include phrases like “high-quality luster unique to Japanese fabrics” and “with Japanese yarns” in the product description.
The Global value chain analysis further shows that of Japan’s $5.32 billion gross textile exports in 2017, around 34% (or $1.79 billion) contributed to export production in other economies, mainly China ($496 million), Vietnam ($288 million), South Korea ($98 million), and Taiwan ($92 million).
China remains Japan’s top apparel supplier at the country level. However, Japanese fashion brands and retailers have been diversifying their sourcing base. Since the elimination of the quota system in 2005, China, for a long time, was the single largest apparel supplier for Japan, with an unparalleled market share of more than 80% measured by value. However, as “Made in China” became more expensive, among other factors, China’s market share dropped to 56.4% in 2021. Japanese fashion brands and retailers actively seek China’s alternatives like their US and EU counterparts. Notably, Japan’s apparel imports from Vietnam, Bangladesh, and Indonesia have grown particularly fast, even though their production capacity and market shares are still far behind China’s.
As Japanese fashion companies source from more places, the total market shares of the top 5 apparel suppliers, not surprisingly, had dropped from over 94% back in 2010 to only 82.3% in 2021, measured by value. Similarly, the Herfindahl-Hirschman Index (HHI), commonly used to calculate market concentration, dropped from 0.64 in 2011 to 0.35 in 2021 for Japan’s apparel imports. In other words, Japanese fashion companies’ apparel sourcing bases became ever more diverse.
Fast Retailing Group’s apparel sourcing base (Data source: Open Apparel Registry)
We can observe the same pattern at the company level. For example, the Fast Retailing Group, the largest Japanese apparel retailer which owns Uniqlo, used to source nearly 100% of its products from China. However, as of 2021, the Fast Retailing Group sourced finished apparel from over 550 factories in more than 20 countries. While about half of these factories were in China, the Fast Retailing Group had strategically developed production capacity in Vietnam, Bangladesh, Indonesia, and India. On the other hand, in April 2021, the Fast Retailing Group opened a 3D-knit factory in Shinonome, allowing the company to re-shoring some production back to Japan.
Additionally, Japan is a member of the Regional Comprehensive Economic Partnership (RCEP), the world’s most economically influential free trade agreement. Notably, Japan commits to reducing its apparel import tariffs to zero for RCEP members following a 21-year phaseout schedule. However, as Table 8 shows, Japan’s tariff cut for apparel products is more generous toward ASEAN members and less for China and South Korea due to competition concerns. For example, by 2026, Japan’s average tariff rate will be reduced from 9.1% today to only 1.9% for apparel imports from ASEAN members but will remain above 6% for imports from China. Given the tariff difference, it can be highly expected that ASEAN members such as Vietnam could become more attractive sourcing destinations for Japanese fashion companies.
In April 2022, the Office of the United States Trade Representative (USTR) released its 2023 Fiscal Year Budget report, outlining five goals and objectives for 2023. Notably, textile and apparel is a key sector USTR plans to focus on in the coming year:
Goal 1: Open Foreign Markets and Combat Unfair Trade
Provide policy guidance and support for international negotiations or initiatives affecting the textile and apparel sector to ensure that the interests of U.S. industry and workers are taken into account and, where possible, to provide new or enhanced export opportunities for U.S. industry.
Conduct reviews of commercial availability petitions regarding textile and apparel products and negotiate corresponding FTA rules of origin changes, where appropriate, in a manner that takes into account market conditions while preserving export opportunities for U.S. producers and employment opportunities for U.S. workers.
Engage relevant trade partners to address regulatory issues potentially affecting the U.S. textile and apparel industry’s market access opportunities.
Continue to engage under CAFTA-DR working groups and committees to optimize inclusive economic opportunities; strengthen the agreement and address non-tariff trade impediments; provide capacity building in textile and apparel trade-related regulation and practice on customs, border and market access issues, including agriculture and sanitary and phytosanitary regulation, to avoid barriers to trade.
Continue to engage CAFTA-DR partners and stakeholders to identify and develop means to increase two-way trade in textiles and apparel and strengthen the North American supply chain to enhance formal job creation.
Goal 2: Fully Enforce U.S. Trade Laws, Monitor Compliance with Agreements, and Use All Available Tools to Hold Other Countries Accountable
Closely collaborate with industry and other offices and Departments to monitor trade actions taken by partner countries on textiles and apparel to ensure that such actions are consistent with trade agreement obligations and do not impede U.S. export opportunities.
Research and monitor policy support measures for the textile sector, in particular in China, India, and other large textile producing and exporting countries, to ensure compliance with international agreements.
Continue to work with the U.S. textile and apparel industry to promote exports and other opportunities under our free trade agreements and preference programs, by actively engaging with stakeholders and industry associations and participating, as appropriate, in industry trade shows.
Goal 4: Develop Equitable Trade Policy Through Inclusive Processes
Take the lead in providing policy advice and assistance in support of any Congressional initiatives to reform or re-examine preference programs that have an impact on the textile and apparel sector.
First, US apparel imports continue to rebound in November 2021 as companies build the inventory for the holiday season. Thanks to US consumers’ strong demand and the upcoming holidays, the value of US apparel imports went up by 15.7% in November 2021 from a month ago (seasonally adjusted) and increased by as much as 39.7% from 2020. However, before the pandemic, the value of US apparel imports always peaked in October and then gradually slipped in November and December. The unusual surge of imports in November 2021 could be the combined effects of price inflation and the late arrival of goods due to the shipping crisis.
Meanwhile, US apparel imports so far in 2021 have been far more volatile than in the past few years because of uncertainties and disruptions caused by COVID-19 and the shipping crisis. For example, the year-over-year (YoY) growth rate ranged from 131% in May to 17.6% in July, causing fashion companies additional inventory planning and supply chain management challenges. Unfortunately, the new omicron variant could worsen the market uncertainty and volatility.
Second, Asian countries remain the dominant sourcing base for US fashion companies as the production capacity elsewhere is limited. Asian countries’ market shares fell from 74.2% in 2020 to 71.3% in July 2021, primarily because of the COVID lockdowns in Vietnam and Bangladesh. US apparel imports came from Asian countries rebounded to 74.8% and 72.5% in October and November 2021, respectively. This result suggests a lack of alternative sourcing destinations outside Asia, especially for large volume items. Meanwhile, the worsening shipping crisis affecting the route from Asia to North America could explain why Asian suppliers’ market shares in November were somewhat lower than a month ago.
Third, US companies continue to treat China as one of their essential sourcing bases in the current business environment. However, companies are NOT reversing their long-term strategy of reducing “China exposure.” China stays the largest supplier for the US market in November 2021, accounting for 41.5% of total US apparel imports in quantity and 25.8% in value. Due to the seasonal factor, China’s market shares typically peak from June to September and then drop from October until March-April.
Both industry sources and the export product diversification index also consistently show that China supplied the most variety of products to the US market with no near competitors. In comparison, US apparel imports from Bangladesh, Mexico, and CAFTA-DR members concentrate more on specific product categories.
Nevertheless, the HHI index and market concentration ratios (CR3 and CR5) calculated based on the latest data suggest that US fashion companies continue to move their apparel sourcing orders from China to other Asian countries overall. For example, only around 15% of US cotton apparel comes from China, compared with about 27% in 2018. My latest studies also indicate that it has become ever more common to see a fashion company places only around 10% of its total sourcing value or volume from China compared to over 30% in the past. Furthermore, with the growing tensions of the US-China relations and the newly enacted Uyghur Forced Labor Prevention Act, fashion companies could take another look at their China sourcing strategy to avoid potential high-impact disruptions.
Fourth, near sourcing from the Western Hemisphere, especially CAFTA-DR members, continue to gain popularity. Specifically, 17.3% of US apparel imports came from the Western Hemisphere year-to-date (YTD) in 2021 (January-November), higher than 16.1% in 2020. Notably, CAFTA-DR members’ market shares increased to 10.6% in 2021 (January to November) from 9.6% in 2020. The value of US apparel imports from CAFTA-DR also enjoyed a 41.7% growth in 2021 (January—November) from a year ago, one of the highest among all sourcing destinations. The imports from El Salvador (up 42.6%), Honduras (up 47.1%), and Guatemala (36.6%) had grown particularly fast so far in 2021. However, the political instability in some Central American countries could make fashion companies feel hesitant to permanently switch their sourcing orders to the region or make long-term investments.
Additionally, the latest trade data suggests a notable increase in the price of US apparel imports. Notably, the unit price of US apparel imports from almost all leading sources went up by more than 10% from January 2021 to November 2021. As worldwide inflation continues, the rising sourcing cost pressure won’t ease anytime soon.
In December 2021, Just-Style consulted a panel of industry leaders and scholars in its Outlook 2022–what’s next for apparel sourcing briefing. Below is my contribution to the report. All comments and suggestions are more than welcome!
What next for apparel sourcing?
As “COVID sets the agenda” and the trajectory of several critical market and non-market forces hard to predict (for example, global inflation, and geopolitics), fashion companies may still have to deal with a highly volatile and uncertain market environment in 2022. That being said, it is still hopeful that fashion companies’ toughest sourcing challenges in 2021 will start to gradually ease at some point in the new year, including the hiking shipping costs, COVID-related lockdowns, and supply chain disruptions.
In response to the “new normal,” fashion companies may find several sourcing strategies essential:
One is to maintain a relatively diverse apparel sourcing base. The latest trade data suggests that US, EU, and Japan-based fashion companies have been steadily sourcing from a more diverse group of countries since 2018, and such a trend continues during the pandemic. Echoing the pattern, in the latest annual benchmarking study I conducted in collaboration with the United States Fashion Industry Association (USFIA), we find that “China plus Vietnam plus many” remains the most popular sourcing model among respondents. This strategy means China and Vietnam combined now typically account for 20-40 percent of a fashion company’s total sourcing value or volume, a notable down from 40-60 percent in the past few years. Fashion companies diversify their sourcing away from “China plus Vietnam” to avoid placing “all eggs in one basket” and mitigate various sourcing risks. In addition, more than 85 percent of surveyed fashion companies say they will actively explore new sourcing opportunities through 2023, particularly those that could serve as alternatives to sourcing from China.
The second strategy is to strengthen the relationship with key vendors further. As apparel is a buyer-driven industry, fashion brands and retailers fully understand the importance of catering to consumers’ needs. However, the supply chain disruptions caused by COVID-19 remind fashion companies that building a close and partner-based relationship with capable suppliers also matters. For example, working with vendors that have a presence in multiple countries (or known as “super-vendors”) offers fashion companies a critical competitive edge to achieve more flexibility and agility in sourcing. Sourcing from vendors with a vertical manufacturing capability also allows fashion companies to be more resilient toward supply chain disruptions like the shortage of textile raw materials, a significant problem during the pandemic.
Further, we could see fashion companies pay even closer attention to textile raw material sourcing in the year ahead. On the one hand, given the growing concerns about various social and environmental compliance issues like forced labor, fashion brands and retailers are making more significant efforts to better understand their entire supply chain. For example, in addition to tracking who made the clothing or the fabrics (i.e., tier 1 & 2 suppliers), more companies have begun to release information about the sources of their fibers, yarns, threads, and trimmings (i.e., tier 3 & tier 4 suppliers). On the other hand, many fashion brands and retailers intend to diversify their textile material sourcing from Asia, particularly China, against the current business environment. Compared with cutting and sewing garments, much fewer countries can make textiles locally, and it takes time to build textile production capacity. Thus, fashion companies interested in taking more control of their textile raw material sourcing need to take concrete actions such as shifting their sourcing model and making long-term investments intentionally.
Apparel industry challenges and opportunities
One key issue we need to watch closely is the US-China relations. China currently remains the single largest source of apparel globally, with no near alternative. China also plays an increasingly significant role as a textile supplier for many leading apparel exporting countries in Asia. However, as the US-China relations become more concerning and confrontational, we could anticipate new trade restrictions targeting Chinese products and products from any sources that contain components made in China. Notably, with strong bipartisan support, President Biden signed into law the Uyghur Forced Labor Prevention Act on December 23, 2021. The new law is a game-changer! Depending on the detailed implementation guideline to be developed by the Customs and Border Protection (CBP), US fashion companies may find it not operationally viable to source many textiles and apparel products from China. In response, China may retaliate against well-known western fashion brands, disrupting their sales expansion in the growing Chinese consumer market. Further, as China faces many daunting domestic economic and political challenges, a legitimate question for fashion companies to think about is what an unstable China means for their sourcing from the Asia-Pacific region and what the contingency plan will be.
Another critical issue to watch is the regional textile and apparel supply chains and related free trade agreements. While apparel is a global sector, apparel trade remains largely regional-based, i.e., countries import and export products with partners in the same region. Data shows that from 2019 to 2020, around 80% of Asian countries’ textile and apparel imports came from within Asia and about 50% for EU countries. Over the same period, over 87% of Western Hemisphere (WH) countries’ textile and apparel exports went to other WH countries and about 75% for EU countries.
Notably, the reaching and implementation of new free trade agreements will continue to alter and shape new regional textile and apparel supply chains in 2022 and beyond. For example, the world’s largest free trade agreement, the Regional Comprehensive Economic Partnership (RCEP), officially entered into force on January 1, 2022. The tariff reduction and the very liberal rules of origin in the agreement could strengthen Japan, South Korea, and China as the primary textile suppliers for the Asia-based regional supply chain and enlarge the role of ASEAN as the leading apparel producer. RCEP could also accelerate other trade agreements in the Asia-Pacific region, such as the China-South Korea-Japan Free Trade Agreement currently under negotiation.
As one of RCEP’s ripple effects, we can highly anticipate the Biden administration to announce its new Indo-pacific economic framework soon to counterbalance China’s influences in the region. The Biden administration also intends to leverage trade programs such as the Dominican Republic-Central America Free Trade Agreement (CAFTA-DR) to boost textile and apparel production, trade, and investment in the Western Hemisphere and address the root causes of migration. These trade initiatives will be highly relevant to fashion companies that could use the opportunity to expand near sourcing, take advantage of import duty-saving benefits and explore new supply chains.
Additionally, fashion companies need to be more vigilant toward political instability in their major sourcing destinations. We have already seen quite a turmoil recently, from Myanmar’s military coup, Ethiopia’s loss of the African Growth and Opportunity Act (AGOA) benefits, concerns about Haiti and Nicaragua’s human rights, and the alleged forced labor in China’s Xinjiang region. Whereas fashion brands and retailers have limited or no impact on changing a country’s broader human rights situation, the reputational risks could be very high. Having a dedicated trade compliance team monitoring the geopolitical situation routinely and ensuring full compliance with various government regulations will become mainstream among fashion companies.
And indeed, sustainability, due diligence, recycling, digitalization, and data analytics will remain buzzwords for the apparel industry in the year ahead.
Today, fashion companies consider a long list of factors when deciding where to source their apparel products, ranging from cost, speed to market, flexibility to the risk of social and environmental compliance. While existing studies have identified these major sourcing factors, whether they are treated equally in companies’ apparel sourcing decisions remains mostly unknown. Neither is it clear how fashion companies make a trade-off among these sourcing factors, given no sourcing destination is perfect.
This study aims to quantitatively evaluate the influence of primary sourcing factors on fashion companies’ determination of apparel sourcing destinations. For the study, we collected a detailed evaluation of the world’s 27 largest sourcing destinations in 2019 against 15 specific performance indicators from GlobalData, one of the most popular sourcing analytics tools. The evaluation uses a 5-point rating scale for each performance indicator.
Because some of these 15 performance indicators measure similar items, we first conducted an exploratory factor analysis, which reduced these indicators to five principal sourcing factors based on their correlation matrix scores. These five principal sourcing factors cover the following themes:
Capacity: It covers seven performance indicators that measure a sourcing destination’s capabilities (including flexibility and lead time) of providing apparel products and other value-added services.
Price & Tariff: It covers two performance indicators that measure the financial implications of sourcing from a particular destination, including eligibility for preferential import duties.
Stability: It covers two performance indicators that measure a sourcing destination’s macro-business environment, specifically sourcing-related political and economic climates.
Sustainability: It encompasses all social and environmental compliance issues related to apparel production and sourcing.
Quality: It covers two performance indicators that measure whether a sourcing destination obtains skilled workers and the overall quality of its products.
Next, we calculated the 27 apparel exporting countries’ average scores of these five principal sourcing factors. Based on the results, we further conducted a multiple regression analysis to evaluate the impact of the five principal sourcing factors on the value of these 27 countries’ apparel exports to the U.S., EU, and Asia in 2019, respectively. These three regions combined accounted for more than 80% of world apparel imports that year; however, fashion companies in each area are suggested to have unique sourcing preferences.
First, the result suggests that improving the performance in Stability and Quality can help a country enhance its attractiveness as an apparel sourcing base in the U.S. and Asia markets, but not so much in the EU market.
Second, a higher score for the factor Sustainability does not result in more sourcing orders at the country level in all three markets examined. It seems fashion companies’ current sourcing model does not provide substantial financial rewards encouraging better performance in sustainability. It is also likely that sustainability and compliance are treated more as pre-requisite criteria instead of determining the volume of the sourcing orders.
Third, the impact of Price & Tariff and Capacity on the value of apparel imports is not statistically significant in any of the three markets examined. This result does NOT necessarily mean price and production capacity is irrelevant. Instead, the result implies that fashion companies’ sourcing decision today is not merely about “chasing the lowest price.” Meanwhile, due to concerns about supply chain risks, even the most “economically competitive” sourcing destination won’t receive all the sourcing orders.
The findings of the study suggest that fashion companies’ sourcing decisions today appear to be more complicated and subtle than what is revealed by the existing literature and the public perception. Notably, the findings present different views from previous studies regarding how sourcing cost and sustainability affect fashion companies’ selection of sourcing destinations.
The findings also call our attention to the significant impact of non-economic factors on companies’ sourcing decisions, particularly the perceived political risks. This result explained why fashion companies had quickly reacted to the recent forced labor concerns in Xinjiang, China, and the military coup in Myanmar and halted sourcing from the regions.
The Regional Comprehensive Economic Partnership (RCEP)is a free trade agreement between ten member states of the Association of Southeast Asian Nations (ASEAN)* and five other large economies in the Asia-Pacific region (China, Japan, South Korea, New Zealand, and Australia). RCEP was reached on November 15, 2020, after nearly eight years of tough negotiation. (Note: ASEAN members include Brunei, Cambodia, Indonesia, Laos, Malaysia, Myanmar, the Philippines, Singapore, Thailand, and Vietnam. India was an original RCEP member but decided to quit in late 2019 due to concerns about competing with Chinese products, including textiles and apparel.)
So far, RCEP is the world’s largest trading bloc. As of 2019, RCEP members accounted for nearly 26.2% of world GDP, 29.5% of world merchandise exports, and 25.9% of world merchandise imports.
As of November 1, 2021, Lao, Burnei, Cambodia, Singapore and Thailand (ASEAN members), as well as China, Japan, New Zealand and Australia have ratified the agreement. This has met the minimum criteria for RCEP to enter into force (i.e., six members, including at least three ASEAN members and three non-ASEAN members).
Why RCEP matters to the textile and apparel industry?
RCEP matters significantly for the textile and apparel (T&A) sector. According to statistics from the United Nations, in 2019, the fifteen RCEP members altogether exported US$374 billion worth of T&A (or 50% of the world share) and imported US$139 billion (or 20% of the world share).
In particular, RCEP members serve as critical apparel-sourcing bases for many US and EU fashion brands. For example, in 2019, close to 60% of US apparel imports came from RCEP members, up from 45% in 2005. Likewise, in 2019, 32% of EU apparel imports also came from RCEP members, up from 28.1% in 2005.
Notably, RCEP members have been developing and forming a regional textile and apparel supply chain. More economically advanced RCEP members (such as Japan, South Korea, and China) supply textile raw materials to the less economically developed countries in the region within this regional supply chain. Based on relatively lower wages, the less developed countries typically undertake the most labor-intensive processes of apparel manufacturing and then export finished apparel to major consumption markets worldwide.
As a reflection of an ever more integrated regional supply chain, in 2019, as much as 72.8% of RCEP members’ textile imports came from other RCEP members, a substantial increase from only 57.6% in 2005. Nearly 40% of RCEP members’ textile exports also went to other RCEP members in 2019, up from 31.9% in 2005.
What are the key provisions in RCEP related to textiles and apparel?
First, RCEP members have committed to reducing the tariff rates to zero for most textile and apparel traded between RCEP members on day one after the agreement enters into force. That being said, the detailed tariff phaseout schedule for textile and apparel products under RCEP is very complicated. Each RCEP member sets their own tariff phaseout schedule, which can last more than 20 years (for example, 34 years for South Korea and 21 years for Japan.) Also, different from U.S. or EU-based free trade agreements, the RCEP phaseout schedule is country-specific. For example, South Korea sets different tariff phaseout schedules for textile and apparel products from ASEAN, China, Australia, Japan, and New Zealand. Japan’s tariff cut for apparel products is more generous toward ASEAN members and less so for China and South Korea (see the graph above). Companies interested in taking advantage of the duty-free benefits under RCEP need to study the “rules of the game” in detail.
Second, in general, RCEP adopts very liberal rules of origin for apparel products. It only requires that all non-originating materials used in the production of the good have undergone a tariff shift at the 2-digit HS code level (say a change from any chapters from chapters 50-60 to chapter 61). In other words, RCEP members are allowed to source yarns and fabrics from anywhere in the world, and the finished garments will still qualify for duty-free benefits. Most garment factories in RCEP member countries can immediately enjoy the RCEP benefits without adjusting their current supply chains.
What are the potential economic impacts of RCEP on the textile and apparel sector?
On the one hand, the implementation of RCEP is likely to further strengthen the regional textile and apparel supply chain among RCEP members. Particularly, RCEP will likely strengthen Japan, South Korea, and China as the primary textile suppliers for the regional T&A supply chain. Meanwhile, RCEP will also enlarge the role of ASEAN as the leading apparel producer in the region.
On the other hand, as a trading bloc, RCEP could make it even harder for non-RCEP members to get involved in the regional textile and apparel supply chain formed by RCEP members. Because an entire regional textile and apparel supply chain already exists among RCEP members, plus the factor of speed to market, few incentives are out there for RCEP members to partner with suppliers from outside the region in textile and apparel production. The tariff elimination under the RCEP will put textile and apparel producers that are not members of the agreement at a more significant disadvantage in the competition. Not surprisingly, according to a recent study, measured by value, only around 21.5% of RCEP members’ textile imports will come from outside the area after the implementation of the agreement, down from the base-year level of 29.9% in 2015.
Further, the reaching of RCEP could accelerate the negotiation of other trade agreements in the Asia-Pacific region, such as the China-South Korea-Japan Free Trade Agreement. We might also see growing pressures on the Biden administration to join the Comprehensive and Progressive Agreement of the Trans-Pacific Partnership (CPTPP) to strengthen the US economic ties with countries in the Asia-Pacific region. The economic competition between the United States and China in the area could also intensify as the combined effects of RCEP and CPTPP begin to shape new supply chains and test the impacts of the two countries on the regional trade patterns.