


First, affected by the surge of COVID cases and consumers’ slowed spending, the value of U.S. apparel imports decreased by 15.7% in December 2020, the worst performance since September 2020. Specifically, the value of U.S. apparel imports in December 2020 shrank by 6.4% from November 2020 (seasonally adjusted), compared with an 8.8% growth from Aug to September, a 4.6% growth from September to October (seasonally adjusted), and a slight 0.3% decline from October to November (seasonally adjusted).

The substantial drop of U.S. apparel imports in December 2020 also altered the recovery trajectory. Overall, the outlook of US apparel imports in 2021 is hopeful but remains far from uncertain.


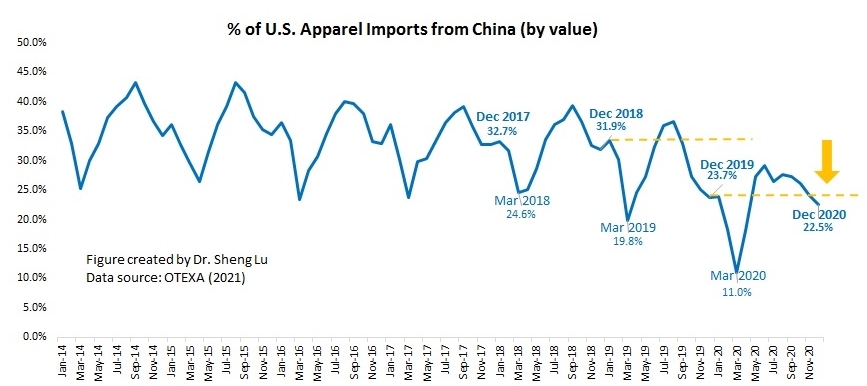
Second, supporting the findings of some recent studies, data suggests that U.S. fashion brands and retailers continue to reduce their “China exposure” in 2020. For example, both the HHI index and market concentration ratios (CR3 and CR5) suggest that apparel sourcing orders are gradually moving from China to other Asian countries. Measured by value, only 23.7% of U.S. apparel imports came from China in 2020, a new record low in the past ten years (was 29.7% in 2019 and 33% in 2018).

However, China’s apparel exports to the US lost more market shares from 2018-2019 than 2019-2020–it seems the impact of the trade war is more significant than the COVID.

The latest data confirms the concerns that some non-economic factors negatively affect China’s prospect as an apparel sourcing destination. For example, the reported forced labor issue related to Xinjiang, China, and a series of actions taken by the U.S. government (such as the CBP withhold release orders) have significantly affected U.S. cotton apparel imports from China. Measured by value, only 15.4% of U.S. cotton apparel came from China in 2020, compared with 22.2% in 2019 and 28% back in 2017. While China’s total textile and apparel exports to the US dropped by 30.7% in 2020, China’s cotton textiles and cotton apparel exports to the US went down more sharply by nearly 40%.
Third, despite Covid-19, Asia as a whole remains the single largest source of apparel for the U.S. market. Other than China, Vietnam (19.6% in 2020 vs. 16.2% in 2019), ASEAN (32.3% in 2020 and vs. 27.4% in 2019), Bangladesh (8.2% in 2020 vs.7.1% in 2019), and Cambodia (4.4% in 2020 vs. 3.2% in 2019) all gain additional market shares in 2020 from a year ago.

Fourth, due to seasonal factors, around 21% of U.S. apparel imports came from the Western Hemisphere in December 2020. Notably, to fulfill consumers’ last-minute holiday orders, which require faster speed to market, U.S. fashion companies typically do relatively more near-sourcing from September to December. In comparison, U.S. fashion companies place more sourcing orders with Asian suppliers from June to late September/early October.

However, no clear evidence suggests that U.S. fashion brands and retailers have been giving more apparel sourcing orders to suppliers from the Western Hemisphere because of COVID-19 and the U.S.-China tariff war. In 2020, 9.6% of U.S. apparel imports came from CAFTA-DR members (down from 10.3% in 2019) and 4.1% from USMCA members (down from 4.5% in 2019).
by Sheng Lu
