

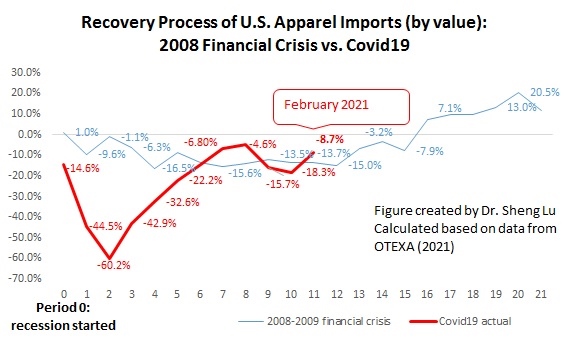
First, thanks to consumers’ resumed demand and a more optimistic outlook for the U.S. economy, US apparel imports went back to the robust recovery trajectory in February 2021. Specifically, the value of U.S. apparel imports in February 2021 went up by 4.5% from January 2021 (seasonally adjusted) after a straight three-month drop. Even though the absolute value of U.S. apparel imports in February 2021 was still 8.7% lower than last year, it was the best performance since December 2020.

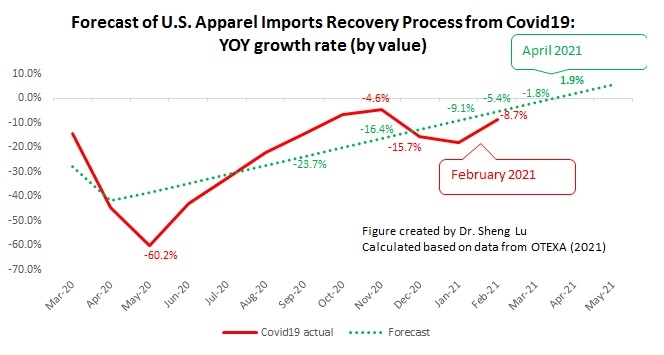
The Auto Regressive Integrated Moving Average (ARIMA) model forecasts that at the current speed of recovery, the value of U.S. apparel imports (seasonally adjusted) may start to enjoy a positive year over year (YoY) growth by April 2021. Euromonitor also forecasts that U.S. apparel retail sales in 2021 may enjoy a 3.6%-6.7% growth from 2020 (in value).

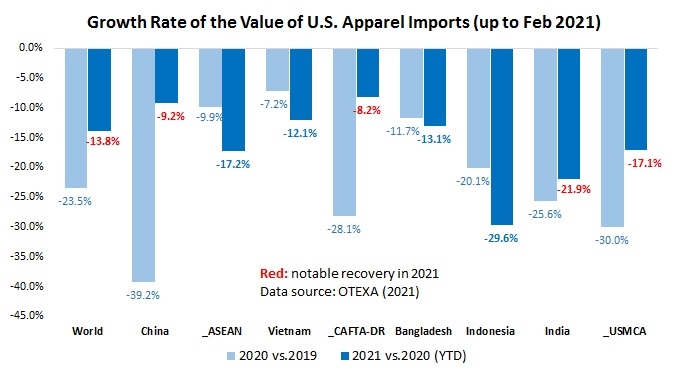
Second, data indicates that China remains the top apparel supplier for the U.S. market both in quantity (36%) and value (22.5%) in 2021 (Jan-Feb). Meanwhile, U.S. fashion brands and retailers continue to reduce their “China exposure” amid the pandemic. For example, both the HHI index and market concentration ratios (CR3 and CR5) suggest that apparel sourcing orders are gradually moving from China to other Asian countries.

The constant market share (CMS) model also shows that before the tariff war and COVID-19, the competitiveness of apparel “Made in China” has weakened in the U.S. market. While the increased U.S. import demand partially mitigated the impact of negative factors (such as the tariff war) on China’s apparel exports to the U.S. market from 2018 to 2019, the demand collapsed during the pandemic. On the other side, while China gained an additional $202 million in exports by adjusting its apparel export product structure during the pandemic, it continued to lose market shares in many regular product categories (especially cotton and wool products).


Further, the latest data confirms that some non-economic factors negatively affect China’s prospect as an apparel sourcing destination. For example, the alleged forced labor issue related to Xinjiang, China, and a series of actions taken by the U.S. government (such as the CBP withhold release orders) have significantly affected U.S. cotton apparel imports from China. Measured by value, only 15.4% of U.S. cotton apparel came from China in 2020 (and 15.6% in the most recent 12 months), a significant drop from 27% back in 2018. While China’s total textile and apparel exports to the US decreased by 26% in the most recent 12 months (i.e., March 2020-February 2021), China’s cotton textiles and cotton apparel exports to the US went down by over 40%.

Third, Asia as a whole remains the single largest source of apparel for the U.S. market amid the pandemic, stably accounting for around 75% of the import value. Other than China, Vietnam, ASEAN, Bangladesh, and Cambodia ALL gain additional market shares both from 2019 to 2020 and during the most recent 12 months (i.e., March 2020-February 2021 vs. March 2019-February 2020).

Fourth, while U.S. apparel imports from the Western Hemisphere stay stable overall, sourcing from CAFTA-DR members seems to gain new momentum. For example, 16.5% of U.S. apparel imports came from the Western Hemisphere in 2021 (Jan-Feb), slightly up from 15.9% in 2020 (Jan-Feb). Notably, CAFTA-DR members’ market shares increased to 10.1% in 2021 (Jan-Feb) from 9.5% in 2020 (Jan-Feb), compared with USMCA members’ loss of 0.2% market shares over the same period. CAFTA-DR and USMCA members currently account for around 60% and 25% of U.S. apparel imports from the Western Hemisphere. They are also the single largest export market for U.S. textile products (around 70% in value). Strengthening the western hemisphere textile and apparel production will remain a hot topic in the Biden administration.
by Sheng Lu
