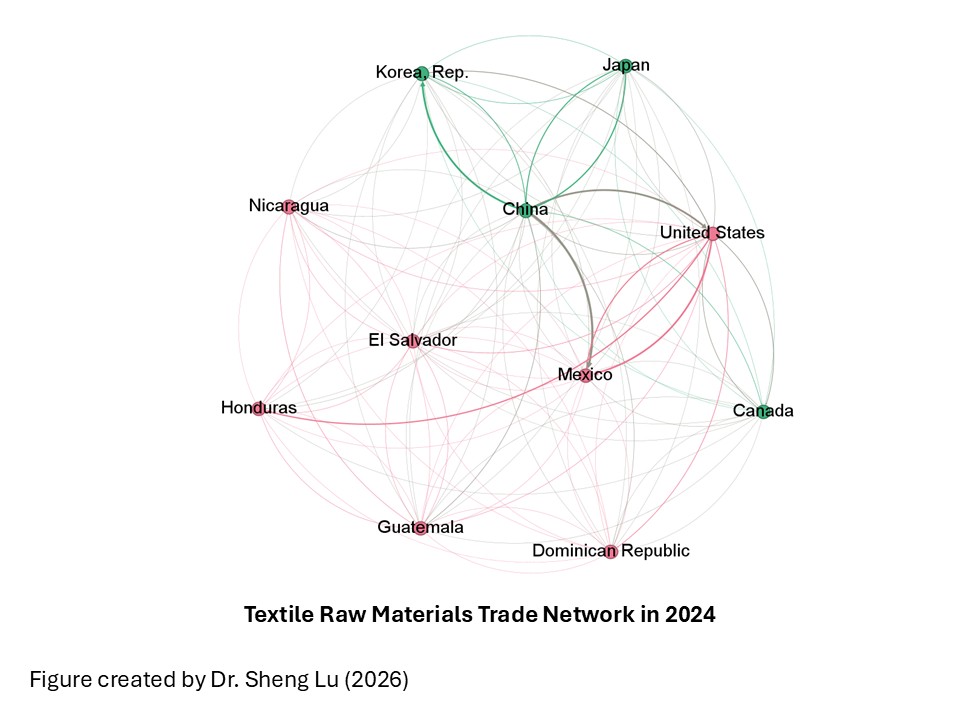
Interview with Modaes (Spain) about the Shifting Global Apparel Trade and Sourcing Patterns (November 2025)

Full interview in English HERE ; Spanish version HERE

Below is the interview summary

Q1. Since the pandemic, has the global fashion supply chain changed?

Key point: The pandemic taught fashion companies the importance of flexibility and agility in sourcing. Heavy reliance on China caused major disruptions during lockdowns, prompting companies to diversify their sourcing base and develop stronger supplier relationships to reduce various sourcing risks.

Q2. Is supply security now more important than price in sourcing decisions?

Key point: Security and sourcing are becoming more closely linked. Leading fashion companies understand that sourcing now requires balancing cost with other important factors such as flexibility, regulatory compliance, and risk management. New regulations related to sustainability demand increasingly detailed supply-chain documentation and transparency. Meanwhile, geopolitical tension between the U.S. and China further adds complexity to fashion companies’ sourcing decisions.

Q3. Are companies continuing to reduce the number of suppliers, and why?

Key point: Recent studies show that many fashion companies are diversifying sourcing beyond China, importing more from emerging supplying countries like Vietnam, Bangladesh, Indonesia, Cambodia, Pakistan, Egypt, and more. However, there are two divergent strategies: some brands expand their supplier base to spread risk and enhance capabilities in sustainable fibers, while others consolidate suppliers to strengthen partnerships with large vendors operating across multiple countries, many of which are still based in China.

Q4. Can the value chain function without China?

Key point: Not realistically. While China’s share of finished garment exports is declining, it still dominates in textiles raw materials. Even when apparel is made in other countries (like Vietnam and Cambodia), much of its fabric, investment, or ownership is Chinese. The newly released OECD data also show that about 30% of Southeast Asian apparel exports include Chinese content.

Q5. Which countries could take advantage of China’s declining role?

Key point: China’s dominance comes not only from its low costs but also from its capacity to produce almost any product category at large scale. To replicate this, companies need to use multiple sourcing locations — a “many-country model” instead of relying on just one. Therefore, diversification, rather than substitution, is the most practical approach. Firms seek to avoid over-dependence on any single country, especially given the volatility of tariffs and supply-chain disruptions.

Q6. Does “friendshoring” apply to fashion?

Key point: Politically appealing but impractical for apparel sourcing. The idea of friendshoring — trading only with “like-minded” nations — doesn’t fit with fashion’s global manufacturing system. Europe and the U.S. share values, but Europe lacks large-scale apparel production. Over 70% of U.S. apparel imports still come from Asia, where most countries are not formal U.S. allies. Therefore, political alignment cannot guide sourcing strategy in fashion; cost, capacity, and speed are more important.

Q7. Will geopolitics and the trade war reshape fashion sourcing in Europe or the U.S.?

Key point: Nearshoring remains a popular concept. European companies explore Eastern Europe and the Mediterranean; U.S. firms consider the Western Hemisphere and limited domestic production. Sustainability has emerged as the new opportunity for near-shoring. Fashion companies now aim to use more sustainable fibers in their clothing products. EU sustainability rules could also attract new investment to expand production in the EU. However, in general, small-sized firms need more resources and support to meet these high environmental standards, both to comply with the law and sustain their businesses.

Q8. Is de-globalizing production possible?

Key point: True de-globalization is unlikely. Instead, globalization is shifting toward greater transparency and accountability. Companies now need to track and report where products are made and how workers are treated, including the sourcing of raw materials. This encourages brands to work closely with their suppliers and promote stronger and strategic collaboration.

Q9. Are there enough incentives for production automation in fashion?

Key point: Yes — Automation provides a way to increase efficiency in high-wage countries like the U.S. With labor costs high and factories shrinking, machines and AI are being adopted to boost productivity and customization. Automation can also help cut down on overproduction — one of fashion’s major waste issues — by supporting made-to-order or small-batch manufacturing.

Q10. Why don’t we see full automation yet?

Key point: Cutting, sewing, and material handling today still require human labor, although factories increasingly use automated tools to boost productivity. Asian suppliers are upgrading equipment to handle smaller, faster orders. Automation is bringing back niche manufacturing (e.g., sock production in the U.S.) and supporting recycling efforts, such as sorting used garments. It helps lower minimum order quantities, matching production to uncertain consumer demand.

Q11. How can Europe maintain relevance amid the U.S.–China trade war?

Key point: Europe continues to be a key player in both textile and apparel manufacturing and consumption. Nearly half of the apparel in the EU is produced locally, often in high-wage countries like Italy, Germany, and France. Asian countries are looking for more market access to the EU because of higher tariffs imposed by the US (e.g., trade diversion). Europe also leads in sustainability and regulatory standards. Complying with EU rules often means meeting the highest global standards. Luxury branding (“Made in Italy/France”) remains highly influential, and the EU’s proactive trade agreements might even enable it to export textiles for processing in Asia, expanding supply chain integration.

Q12. Why hasn’t Africa become a viable textile hub yet?

Key point: Africa’s potential greatly relies on trade preferences like the African Growth and Opportunity Act (AGOA), which recently expired. Without duty-free U.S. access, U.S. companies are less likely to source there. However, the EU could help bridge the gap by forging partnerships for recycled textile materials and sustainable production. Regional collaboration could unlock Africa’s place in circular fashion supply chains.

For students in FASH455: Feel free to share your thoughts on any of the interview questions above. You may also challenge and debate any points raised in the interview and present your arguments.

FASH455 Video Discussion: Textiles, Trade & National Security: A Conversation with Parkdale Mills COO Davis Warlick

Discussion questions (for students in FASH455, please answer at least three questions from below)

  • #1 Use 1-2 examples from the video and explain how CAFTA-DR and USMCA help shape the Western Hemisphere textile and apparel supply chain.
  • #2 Based on the video, what do you see as the main opportunities for textile and apparel nearshoring or reshoring in the Western Hemisphere? Please also identify 1–2 key bottlenecks (e.g., cost, infrastructure, labor, sustainability, or trade policy) and explain your viewpoint.
  • #3 The speaker argues for a sectoral trade policy for textiles and apparel rather than broad “free trade.” What is your evaluation? Please make 1-2 specific points and use specific examples from the video to illustrate your viewpoint.
  • #4 How does the video help deepen your understanding of the complex economic and non-economic factors related to textile and apparel nearshoring and reshoring in the Western Hemisphere? Explain at least one insight that challenges your prior assumptions/views about sourcing and trade.

2025 August Sourcing at MAGIC Recap

The latest Sourcing at MAGIC, one of the largest and most influential fashion apparel trade shows in North America, was held from August 18 to 20, 2025 in Las Vegas. Drawing thousands of apparel manufacturers, textile raw material suppliers, brands, and retail buyers from over 30 countries around the globe, the event provides a unique opportunity to observe the latest U.S. apparel sourcing trends and market sentiment.

Aligned with the results of the 2025 Fashion Industry Benchmarking Study released by the United States Fashion Industry Association (USFIA), the hiking tariffs imposed by the Trump administration and ongoing policy uncertainty were among the top concerns for MAGIC attendees. One major tariff impact often heard at the MAGIC show was the growing inflationary pressure. It was a prevailing view among vendors, brands, and retailers that a price increase had begun and would become even more noticeable to U.S. consumers in the upcoming months. Some also argue that “tariff is no longer a sourcing problem,” but how brands and retailers should handle their “profit margin, product assortment, and pricing.”

Meanwhile, apparel suppliers care significantly about the additional reciprocal tariff” rates they face compared to their key competitors. For instance, a jeans supplier from Pakistan said they were relieved to see more order inquiries come in, as their Indian competitors faced significantly higher tariff rates threatened by the Trump administration.

Still, nearly 600 exhibitors from China attended MAGIC, making it the largest delegation from any country. Two interesting phenomena revealed how Chinese suppliers try to stay competitive in today’s challenging business environment. One is to offer various value-added sourcing services beyond physical products.  For example, there was a dedicated session at this year’s MAGIC show that featured Chinese manufacturers that provide services such as drop shipping (i.e., when a customer places an order, the retail store never physically handles the product. Instead, the manufacturer is responsible for inventory, packing, and shipping), director to consumer (DTC) e-commerce and warehousing. Meanwhile, some Chinese vendors accept small orders (i.e., 6 pieces or less) or low minimum orders (i.e., 300 pieces) and promise a short lead time of 45 days. In comparison, the minimum order quantity (MOQ) required by suppliers in other Asian and Western Hemisphere countries typically exceeds thousands of pieces.

On the other hand, it is not uncommon to see that vendors from Bangladesh, Vietnam, Cambodia, or even Egypt and Ghana were actually owned by Chinese investors. Several Chinese factories purposefully highlight that they own factories across the world, from China and Southeast Asia to Africa. According to the USFIA benchmarking study, some U.S. fashion companies also prefer vendors with production capabilities in multiple countries to reduce sourcing risks.

As U.S. fashion companies continue to diversify their sourcing beyond the traditional top three—China, Vietnam, and Bangladesh—emerging destinations are increasingly optimistic about their U.S. export prospects. For instance, a supplier from Jordan noted that recent U.S. tariff hikes have boosted Jordan’s competitiveness, given the zero most-favored-nation (MFN) tariff under the U.S.-Jordan Free Trade Agreement and a 15% reciprocal tariff rate, which was lower than many Asian suppliers face.Jordanian suppliers speak highly of the capacity-building support from international organizations such as the International Trade Centre (ITC), particularly in areas like skills training and market intelligence.

Similar to Jordan, Egypt’s apparel exports can benefit from a zero most-favored-nation (MFN) tariff, provided they meet the rules of origin under the Qualifying Industrial Zones (QIZ) initiative. However, unlike Jordan, suppliers from Egypt tend to specialize in cotton and other natural-fiber–intensive apparel, leveraging their advantages in producing locally made, high-quality natural textile fibers.

Clothing made from preferred sustainable fibers, particularly those incorporating recycled textiles, has grown increasingly popular. Nearly every country represented at MAGIC, including developing nations in Asia and Africa, showcased such products.

It should be noted, however, that producing clothing with sustainable textile fibers requires suppliers to obtain certifications such as GOTS (Global Organic Textile Standard), Global Recycled Standard (GRS), and Better Cotton Initiative (BCI). Although these certifications add costs, most vendors view sustainability as an opportunity to enhance export competitiveness rather than a threat in the long term. Some also mentioned that buyers were often willing to pay a premium for products made with sustainable materials, providing a significant financial incentive.

On the other hand, achieving sustainable sourcing and production is becoming increasingly comprehensive, requiring continuous innovation in both technology and business models. For example, at the show, some vendors showcased apparel products that integrated multiple sustainability concepts, ranging from material development and eco-design to social responsibility and post-consumption solutions.

by Sheng Lu

2025 USFIA Fashion Industry Benchmarking Study Released

The full report is HERE.

Key findings of this year’s report:

#1 This year, the top business challenges facing U.S. fashion companies center on the Trump Administration’s escalating tariff policy and its wide-ranging impacts on companies’ sourcing and business operations.

  • 100 percent of respondents rated “Protectionist U.S. trade policies and related policy uncertainty, including the impact of the Trump tariffs” as one of their top business challenges in 2025. This included as much as 95 percent of respondents who ranked the issue among their top two concerns.
  • Respondents also expressed significant concerns about the wide-ranging effects of Trump’s tariff policy, including “Inflation and economic outlook in the U.S. economy” (80 percent), “Increasing production or sourcing cost” (nearly 50 percent), and “Protectionist trade policies and policy uncertainty in foreign countries, including retaliatory measures against the U.S.” (52 percent).
  • Over 70 percent of surveyed companies reported that the higher tariffs increased sourcing costs, squeezed profit margins, and led to higher consumer prices. Approximately half of the respondents reported a decline in sales, and 22 percent stated that they had to lay off employees due to increased tariffs.

#2 Maintaining a geographically diverse sourcing base has been one of the most popular strategies adopted by U.S. fashion companies to mitigate the impact of rising tariffs and policy uncertainty. 

  • This year, respondents reported sourcing apparel products from 46 countries, similar to the 48 countries reported in 2024 and an increase from 44 countries in 2023. At the firm level, approximately 60 percent of large companies with 1,000+ employees reported sourcing from ten or more countries in 2025, a notable increase from the 45–55 percent range reported in 2022 and 2023 surveys.
    • Amid escalating tariffs and rising policy uncertainty, Asia has become an ever more dominant apparel sourcing base for U.S. fashion companies in 2025. Respondents reported increased use of several Asia-based sourcing destinations other than China in 2025 compared to the previous year, including Vietnam (up from 90 percent to 100 percent), Cambodia (up from 75 percent to 94 percent), Bangladesh (up from 86 percent to 88 percent), Indonesia (up from 75 percent to 77 percent), and Sri Lanka (up from 39 percent to 53 percent).As part of their sourcing diversification strategy, U.S. fashion companies are also gradually increasing sourcing from emerging destinations in the Western Hemisphere and beyond, such as Jordan, Peru, and Colombia.
    • Most respondents intend to build a more geographically diverse sourcing base and broaden their vendor network over the next two years. Nearly 60 percent of respondents plan to source apparel from more countries, and another 40 percent plan to source from more suppliers or vendors. Reducing sourcing risk, especially to minimize the impact of rising tariffs and tariff uncertainty, is a key driver of companies’ sourcing diversification strategies

#3 U.S. fashion companies remain deeply concerned about the future of the U.S.-China relationship during Trump’s second term and intend to further “reduce China exposure” to mitigate sourcing risks.

  • While 100 percent of respondents reported sourcing from China this year, a record-high 60 percent of respondents reported sourcing fewer than 10% of their apparel products from China, up from 40 percent in 2024. Approximately 70 percent of respondents no longer used China as their top apparel supplier in 2025, representing a further increase from 60 percent in 2024 and significantly higher than the 25-30 percent range prior to the pandemic.
  • Despite the announcement of the reaching of a U.S.-China “trade deal” in May 2025, more than 80 percent of respondents plan to further reduce their apparel sourcing from China over the next two years through 2027, hitting a new record high. Many large-scale U.S. fashion companies are already limiting or plan to limit their apparel sourcing from China to a “low single-digit” percentage by 2026 or earlier, mainly due to concerns about the increasing geopolitical and trade policy risks associated with sourcing from the country.
  • Still, respondents rated China as highly economically competitive as an apparel sourcing base compared to many of its Asian competitors regarding vertical manufacturing capability, low minimum order quantity (MOQ) requirements, flexibility and agility, sourcing costs, and speed to market. However, non-economic factors, particularly the perceived extremely high risks of facing U.S. import restrictions, geopolitical tensions with the U.S., and concerns about forced labor, are driving U.S. fashion companies to continue their de-risking efforts.

#4 No evidence indicates that the Trump Administration’s tariff policy has successfully encouraged U.S. fashion companies to increase domestic sourcing of “Made in the USA” textile and apparel products or to expand sourcing from the Western Hemisphere.

  • Only about 44 percent of respondents explicitly say that they would expand sourcing from the Western Hemisphere, and even fewer respondents (17 percent) plan to source more textiles and apparel “Made in the USA” amid the tariff increase.
  • This year, fewer respondents reported sourcing apparel from Mexico and Canada (down from 60 percent in 2024 to 50 percent in 2025) and members of the Dominican Republic-Central America Free Trade Agreement, CAFTA-DR (down from 75 percent in 2024 to 64 percent in 2025).
  • About half of the respondents plan to expand apparel sourcing from Mexico and CAFTA-DR members over the next two years. Notably, nearly all of these companies also intend to increase sourcing from Asia, indicating that U.S. fashion companies view near-shoring from the Western Hemisphere as a complement, not a replacement, to their broader sourcing diversification strategy.
  • Respondents consider the most urgent capacity-building needs within CAFTA-DR lie in the production of textile raw materials (e.g., spandex) and accessories (e.g., zippers, threads, and buttons). Meanwhile, USMCA members are considered to have relatively stronger capacities in yarn and fabric production but face more pressing shortages in accessories.

#5 Respondents overall remain highly committed to sustainability, social responsibility, and compliance issues in the sourcing process.

  • This year, the top sustainability and compliance areas where respondents plan to allocate more resources include “Investing in technology to enhance supply chain traceability or isotopic testing” (53 percent), “Providing sustainability and social compliance training for internal employees” (50 percent) and “Providing sustainability and social compliance training for suppliers” (50 percent). 
  • As part of U.S. fashion companies’ sustainability efforts, all respondents (100 percent) report sourcing clothing made with “sustainable textile fibers” in 2025. Having 11–50% of apparel products containing various “sustainable textile fibers” is the most common (40 percent of respondents), followed by having 1–10% of the total sourcing value or volume(30 percent of respondents).
  • Moreover, most respondents (over 70 percent) plan to increase their use of various “sustainable fibers” in clothing over the next three years. This trend is especially strong for recycled materials, with 80 percent of respondents indicating they intend to increase their use.
  • The top three positions with the highest demand among respondents from 2025 through 2030 are “Environmental sustainability-related specialists or managers,” “Trade compliance specialists,” and “Data scientists”—more than 40 percent of respondents plan to increase hiring. There is also strong demand for “Textile raw material specialists” and “Sourcing specialists.”

#6 With the upcoming expiration of the trade preference program this September, respondents again underscore the importance of immediate renewal of the African Growth and Opportunity Act (AGOA) and extending the agreement for at least another ten years.

  • Due to the upcoming expiration of AGOA and uncertainty about its future, this year, respondents sourced from only six SSA and AGOA members (i.e., Kenya, Ethiopia, Ghana, Madagascar, Mauritius, and Tanzania), fewer than the seven countries in 2024.  And none of these countries were used by more than 20 percent of respondents.
  • Nearly 80 percent of respondents support “renewing AGOA for at least another ten years,” and no one opposes. This shows a consistent and wide base of support for AGOA among U.S. fashion companies.
  • More than 70 percent of respondents say that securing a long-term renewal of AGOA for at least ten years is essential for expanding apparel sourcing from the region. Similarly, another 60 percent of respondents believe that a long-term renewal of AGOA is necessary for U.S. fashion companies and their supply chain partners to commit to new investments in the region. 
  • Respondents warned that AGOA’s pending renewal has already begun to harm the region’s prospects as an apparel sourcing base. Approximately 30 percent of respondents explicitly stated that they had already reduced sourcing from AGOA members due to the uncertainty surrounding the agreement’s renewal.

About the study

Authored by Dr. Sheng Lu in collaboration with the United States Fashion Industry Association (USFIA), this year’s benchmarking study was based on a survey of executives from 25 leading U.S. fashion companies from April to June 2025. The study incorporated a balanced mix of respondents representing various businesses in the U.S. fashion industry. Approximately 85 percent of respondents were self-identified retailers, 60 percent were self-identified brands, and about 50 percent were importers/wholesalers.

The survey respondents included large U.S. fashion corporations and medium-sized companies. Around 90 percent of respondents reported having over 1,000 employees; the rest (10 percent) represented medium-sized companies with 100-999 employees.

State of U.S. Textile and Apparel Manufacturing, Employment and Trade (updated April 2025)

Textile and apparel manufacturing in the U.S. has significantly decreased over the past decades due to factors such as automation, import competition, and the changing U.S. comparative advantages for related products. However, thanks to companies’ ongoing restructuring strategies and their strategic use of globalization, the U.S. textile and apparel manufacturing sector has stayed relatively stable in recent years. For example, the value of U.S. yarns and fabrics manufacturing (NAICS 313) totaled $24 billion in 2023 (the latest data available), up from $23.3 billion in 2018 (or up 2.8%). Over the same period, U.S. made-up textiles (NAICS 314) and apparel production (NAICS 315) moderately declined by only 1.8% and 1.6%.

More importantly, the U.S. textile and apparel manufacturing sector is evolving. Several important trends are worth watching:

First, “Made in the USA” increasingly focuses on textile products, particularly high-tech industrial textiles that are not intended for apparel manufacturing purposes.  Specifically, textile products (NAICS 313+314) accounted for over 83% of the total output of the U.S. textile and apparel industry as of 2023, much higher than only 56% in 1998 (U.S. Census, 2025). Textiles and apparel “Made in the USA” are growing particularly fast in some product categories that are high-tech driven, such as medical textiles, protective clothing, specialty and industrial fabrics, and non-woven. These products are also becoming the new growth engine of U.S. textile exports. Notably, between 2019 and 2022, the value of U.S. “nonwoven fabric” (NAICS 31323) production increased by 12.32%, much higher than the 1.15% average growth of the textile industry (NAICS 313). Similarly, while U.S. textile exports decreased by 13.75% between 2019 and 2024, “nonwoven fabric” exports surged by 10.48%--including nearly 40% that went to market outside the Western Hemisphere (U.S. International Trade Commission, 2025).

Second, U.S. apparel manufacturers today are primarily micro-factories, and they supplement but are not in a position to replace imports. As of 2021 (the latest data available), over 76% of U.S.-based apparel mills (NAICS 315) had fewer than 10 employees, while only 0.7% had more than 500 employees. In comparison, contracted garment factories of U.S. fashion companies in Asia, particularly in developing countries like Bangladesh, typically employ over 1,000 or even 5,000 workers.

Instead of making garments in large volumes, most U.S.-based apparel factories are used to produce samples or prototypes for brands and retailers.  In other words, replacing global sourcing with domestic production is not a realistic option for U.S. fashion brands and retailers in the 21st-century global economy. Nor are U.S. fashion companies showing interest in shifting their business strategies from focusing on “designing + managing supply chain+ marketing” back to manufacturing.

Meanwhile, due to mergers and acquisitions (M&A) and to leverage economies of scale, approximately 5% of U.S. textile mills (NAICS313) had more than 500 employees as of 2021–this is a significant number, considering that textile manufacturing is a highly capital-intensive process.

Third, employment in the U.S. textile and apparel manufacturing sector continued to decline, with improved productivity and technology being critical drivers.  As of 2024, employment in the U.S. textile and apparel manufacturing sector (NAICS 313, 314, and 315) totaled 270,700, a decrease of 18.4% from 33,190 in 2019. Notably, U.S. textile and apparel workers had become more productive overall—the labor productivity index of U.S. textile mills (NAICS 313) increased from 89.7 in 2019 to 94.4 in 2023, and the index of U.S. apparel mills (NAICS 315) increased from 105.8 to 110.78 over the same period.

On the other hand, clothing retailers (NAICS 4481) accounted for over 75.7% of employment in the U.S. textile and apparel sector in 2024.

Fourth, international trade, BOTH import and export, supports textiles and apparel “Made in the USA.” On the one hand, U.S. textile and apparel exports exceeded $12.5 billion in 2024, accounting for more than 30% of domestic production as of 2023 (NAICS 313, 314 and 315). Thanks to regional free trade agreements, particularly the U.S.-Mexico-Canada Agreement (USMCA) and the Dominican Republic-Central America Free Trade Agreement (CAFTA-DR), the Western Hemisphere stably accounted for over 70% of U.S. textile and apparel exports over the past decades. However, for specific products such as industrial textiles, markets in the rest of the world, especially Asia and Europe, also become increasingly important. Thus, lowering trade barriers for U.S. products in strategically significant export markets serves the interest of the U.S. textile and apparel industry.

On the other hand, imports support textiles and apparel “Made in the USA” as well. A 2023 study found that among the manufacturers in the “Made in the USA” database managed by the U.S. Department of Commerce Office of Textile and Apparel, nearly 20% of apparel and fabric mills explicitly say they utilized imported components. Partially, smaller U.S. textile and apparel manufacturers appear to be more likely to use imported components–whereas 20% of manufacturers with less than 50 employees used imported input, only 10.2% of those with 50-499 employees and 7.7% with 500 or more employees did so. The results indicate the necessity of supporting small and medium-sized (SME) U.S. textile and apparel manufacturers to more easily access their needed textile materials by lowering trade barriers like tariffs.

By Sheng Lu

New Study: Exploring India as an Apparel Sourcing Base for U.S. Fashion Companies

The full article is published in Just-Style and below is the summary:

India’s Textiles and Apparel Production

Data from the United Nations Industrial Development Organization (UNIDO) shows that India produced around $76.5 billion in textiles and $26.64 billion in wearing apparel in 2022. Although still smaller than China’s, this production scale has already surpassed that of most other Asian countries, including Vietnam. Behind these numbers were India’s over 4,000 ginning factories, 3,500 textile mills, and around 45 million workers directly employed by the textile and apparel sector.

India is one of the world’s largest textile fiber producers, including regular cotton, organic cotton, silk, polyester, and viscose. India also has more advanced local textile manufacturing capabilities than most other developing apparel-exporting Asian countries, allowing it to benefit from a vertically integrated local textile and apparel supply chain. A recent U.S. International Trade Commission (USITC) study noted that more than 90 percent of India’s textile raw materials needed for its apparel production can be sourced domestically. In comparison, as the World Trade Organization (WTO) global value chain analysis estimated, more than 64 percent of Vietnam’s apparel exports in 2022 contained foreign-made content (i.e., imported yarns and fabrics), 57 percent for Cambodia, 49 percent for Indonesia, and 33 percent for Bangladesh.

India’s Apparel Export

India remained a much smaller apparel exporter than China, Vietnam, and Bangladesh. According to the World Trade Organization (WTO), India exported about $15 billion in apparel in 2023, ranked the world’s sixth largestor 2.8 percent of the global total.  Similarly, in 2023, India accounted for 5.5 percent of U.S. apparel imports and 3.5 percent of the EU, showing its position as a significant supplier but not among the largest. However, unlike most other developing Asian countries, India exports less than half of its apparel output due to its massive domestic market with a population of 1.43 billion. This implies that India’s substantial untapped apparel export potential should not be ignored.

Why Sourcing from India?

Firstly, aligned with trade statistics, many U.S. fashion companies already source from India, although in a relatively small volume.  For example, the USFIA benchmarking survey respondents consistently ranked India as the 3rd or 4th most utilized apparel sourcing base from 2021 to 2024, after China and Vietnam. However, U.S. fashion companies typically place less than 10 percent of their total sourcing value or volume in India. The recent USITC study also raised concerns that India’s apparel factories were primarily small and medium-sized, which could limit their ability to fulfill large-volume sourcing orders.

Secondly, “Made in India” clothing is not necessarily cheap but could be perceived as “worth the value.” Notably, from January to October 2024, clothing labeled “Made in India” sold in the U.S. retail market was, on average, priced much higher than imports from Bangladesh and Vietnam, particularly in the mass market segment. Meanwhile, in the premium market segment, clothing “Made in India” was, on average, priced relatively lower than “Made in China,” such as dresses, tops, and bottoms. These results suggest that U.S. fashion companies do not typically consider India a preferred sourcing base for basic and price-sensitive items. Instead, India may be seen as a more cost-effective alternative to China for high-quality, value-added clothing.

Thirdly, India has been strengthening its competitiveness in export flexibility and agility, enabling its vendors to quickly adjust the delivery, volume, and product of the sourcing order upon customers’ requests. In the latest 2024 USFIA survey, respondents rated India’s sourcing flexibility and agility second only to China, surpassing Bangladesh, Cambodia, and Central American countries. Likewise, India was regarded as one of the few Asian countries that could fulfill apparel sourcing orders with relatively low “minimum order quantity (MOQ)” requirements.

One major factor contributing to India’s perceived advantages in sourcing flexibility and agility is its ability to produce a wide range of apparel products. For example, the Herfindahl-Hirschman Index (HHI) calculated using trade data at the 6-digit HS code level indicates that U.S. apparel imports from India cover more diverse product categories than most Asian countries.

Moreover, due to India’s position as one of the world’s leading cotton producers, in the first ten months of 2024, nearly 60 percent of U.S. apparel imports from India contained cotton fibers, including 13 percent using organic cotton. This percentage was much higher than imports from other Asian suppliers such as China and Vietnam. In comparison, over the same period, U.S. apparel imports from India appear less likely to contain man-made fibers like polyester, nylon, spandex, and recycled polyester. This fiber composition explains why India has yet to become a leading supplier of certain apparel product categories, like outerwear, which more commonly uses man-made fiber than cotton.

Additionally, in the first ten months of 2024, over 45 percent of India’s apparel newly introduced to the U.S. market targeted the luxury and premium segment, closely matching China’s nearly 50 percent and exceeding other Asian suppliers such as Vietnam (20 percent), Bangladesh (13 percent), Cambodia (5 percent), and Indonesia (18 percent). This result explains why U.S. fashion companies increasingly consider India a strategic alternative to sourcing from China, given the similarities in their product offerings.

Reflections

India’s large country size and population, the presence of an already highly integrated and sophisticated textile and apparel supply chain, and its ability to make a great variety of high-quality products suitable for various market segments position it well in the export competition. U.S. fashion companies’ eagerness to reduce sourcing from China due to rising geopolitical concerns and the limited sourcing capacity elsewhere created historical opportunities for India to expand its apparel exports to the U.S. market further.

Nevertheless, it remains a question mark whether India is fully committed to expanding labor-intensive apparel production and exports, given the country’s economy is moving toward more capital and technology-intensive sectors. Notably, in value, apparel only accounted for about 5.6 percent of India’s total merchandise exports in 2023, similar to China’s 5.3 percent but much lower than other lesser-developed Asian countries, including Vietnam (10 percent), Bangladesh (88 percent), and Cambodia (44 percent).

Moreover, while India is not a primary focus for compliance issues like forced labor, sourcing from the country still carries general social and environmental compliance risks similar to those in most developing countries (note: see the 2024 USITC report). It remains to be seen whether India’s textile and apparel mills are technically and financially prepared to meet more stringent social and environmental standards being adopted in the U.S. and can effectively compete in the growing market for “sustainable apparel.”

by Gabriella Giolli (Honors Marketing major & Fashion management minor, University of Delaware) and Sheng Lu

FASH455 Discussion: How likely will US fashion companies increase apparel sourcing from Guatemala in 2025 compared to 2024?

Note: The video was taken during a Guatemala garment factory visit in May 2024. Credit: Sheng Lu

Discussion instructions:

The following two scenarios are generated by ChatGPT using input from FASH455 students’ proposed discussion questions*. Based on what we learned in class and additional information you collected online (not from ChatGPT or any AI tools), please critique the scenarios presented, including the strengths and weaknesses of the argument, any viewpoints you agree or disagree with, and any additional factors that could be considered. In your response, please share the link to any further resources you consulted.

Scenario 1: US apparel import from Guatemala would increase in 2025

In 2025, U.S. apparel imports from Guatemala are projected to experience a significant increase, driven by a confluence of favorable economic conditions, strategic supply chain shifts, and improvements in local manufacturing capabilities. The U.S. economy is expected to grow at a rate of 2.2%, which, coupled with rising consumer confidence, is likely to sustain robust demand for apparel. Guatemala’s geographic proximity to the U.S. presents a logistical advantage, allowing for shorter shipping times and reduced transportation costs compared to Asian suppliers. Moreover, U.S. apparel imports from Guatemala, which have historically averaged around $1.5 billion, could see a notable increase around 2-5%. This increase is further supported by Guatemala’s investments in modernizing its textile industry, including advancements in sustainable practices and technology adoption that align with growing consumer preferences for ethically sourced and environmentally friendly products.

Additionally, the Central America-Dominican Republic Free Trade Agreement (CAFTA-DR) has enabled duty-free access for certain apparel products, encouraging more U.S. brands to explore sourcing options in Guatemala. With a utilization rate of around 70% under CAFTA-DR, brands are beginning to leverage the agreement more effectively, which could lead to a higher volume of apparel imports as they seek to optimize their supply chains. In this context, the increasing trend toward sustainable fashion could further elevate Guatemala’s status as a preferred sourcing location, particularly for companies looking to enhance their corporate social responsibility profiles. As a result, the combination of economic growth, logistical advantages, and strategic shifts in sourcing could lead to a substantial increase in U.S. apparel imports from Guatemala in 2025.

Scenario 2: US apparel import from Guatemala would remain stagnant in 2025

U.S. apparel imports from Guatemala are poised to remain stagnant in 2025, continuing a troubling trend that has characterized the market for over a decade. Despite a projected U.S. GDP growth of 2.2%, the apparel market faces significant challenges that hinder any potential growth in trade volume. Historical data illustrates that U.S. imports from Guatemala have stagnated around $1.5 billion, primarily due to intense competition from Asian manufacturers who can offer lower prices and greater production capacity. With the global supply chain still recovering from disruptions and high inflation pressure, U.S. companies may prioritize sourcing from countries that can provide more cost-effective solutions, further sidelining Guatemala.

Moreover, Guatemala’s textile sector grapples with persistent capacity constraints and labor shortages, limiting its ability to scale operations effectively in response to market demands. The country’s utilization of CAFTA-DR benefits remains suboptimal, hovering around 70%, and many brands have yet to fully exploit the agreement to its potential. This underutilization could be a significant barrier to increasing trade volume, as companies may prefer sourcing from countries that can more efficiently navigate trade agreements and provide better pricing structures. Additionally, the growing trend toward fast fashion and quick turnaround times poses a challenge for Guatemalan manufacturers, who may struggle to compete with the rapid production cycles of Asian suppliers. Given these persistent issues, U.S. apparel imports from Guatemala are likely to remain stagnant at approximately $1.5 billion in 2025, as the country continues to face formidable obstacles in enhancing its role in the global apparel supply chain.

*Questions FASH455 students proposed to generate initial information. Read the ChatGPT responses here.

  • Compare the most likely scenario of Trump or Harris becoming the next U.S. president and its impact on US apparel sourcing from Guatemala.
  • Here is the latest US GDP growth and forecast: 2.9% in 2023, 2.8% in 2024 and 2.2% in 2025. Analyze the historical data you have access to and predict US apparel imports from Guatemala in 2025. Ideally, please provide numerical results
  • US apparel imports from Guatemala have stagnated over the past decade. What are the critical reasons for the lack of growth? Will any factors likely change in 2025, or will they remain mostly the same?
  • Does Guatemala have the capacity to handle increased US apparel sourcing demand in 2025 from 2024? Say 5% increase or 10% increase? Please use data to justify your viewpoint.
  • What factors would impact US fashion companies sourcing with Guatemala in the future? Will any factors change in 2025, and why?
  • What is the relationship between CAFTA-DR’s utilization and the value of US apparel imports from Guatemala? Based on historical data, will the utilization rate significantly affect the trade volume?
  • Will offering more flexibility in CAFTA-DR’s apparel rules of origin encourage more apparel imports from Guatemala, and why?
  • Will recycled textiles significantly boost US apparel sourcing in 2025 vs 2024? or instead, this is a niche product and won’t affect the sourcing volume much
  • Is Guatemala a preferred sourcing base among fashion companies for fast fashion items? Can Guantema compete with Asian countries for such orders in 2025?

New Study: PVH Corporation’s Evolving Apparel Sourcing Strategies (updated Septmeber 2024)

PVH Corporation (PVH), which owns well-known brands including Calvin Klein, Tommy Hilfiger, Van Heusen, Arrow, and Izod, is one of the largest US fashion companies with nearly $9.2 billion in sales revenues in 2022.

By leveraging PVH’s publically released factory lists, this article analyzes the company’s detailed sourcing strategies and changes from 2021 to 2022. Key findings:

Trend 1: PVH adopts a diverse apparel sourcing base and continues to work with more vendors. Specifically, in 2022, PVH sourced apparel from as many as 37 countries in Asia, Europe, America, the Middle East, and Africa, the same as in 2021. Despite not expanding the number of countries it sources from, PVH increased its total number of vendors from 503 in 2021 to 553 in 2022, highlighting the company’s ongoing commitment to diversifying its sourcing base.

Trend 2: Asia is PVH’s dominant sourcing base for finished garments and textile raw materials.

Specifically, about 56.2% of PVH’s apparel suppliers were Asia-based in 2022, followed by the EU (20.3%). Compared with a year ago, PVH even added twenty new Asia-based factories to its supplier list in 2022, suggesting no intention of reducing sourcing from the region. Moreover, From 2021 to 2022, as many as 83% of PVH’s raw material suppliers were Asia-based, far exceeding any other regions.

Trend 3: PVH’s China sourcing strategies are evolving and more complicated than simply “reducing China exposure.”

  • First, PVH continued to work with MORE Chinese factories. Specifically, between 2021 and 2022, PVH added 17 Chinese factories to its apparel supplier list, more than other countries. However, the expansion could be because of PVH’s growing sales in China.
  • Second, PVH’s garment factories in China are smaller than their peers in other Asian countries. For example, in 2022, most PVH’s contracted garment factories in top Asian supplying countries, such as Bangladesh (87.5%), Vietnam (63.3%), and Sri Lanka (65.3%), had more than 1,000 workers. In comparison, only 11.3% of PVH’s Chinese vendors had 1,000 workers, and more than 62.5% had fewer than 500 workers. The result suggests that PVH treats China as an apparel sourcing base for flexibility and agility, particularly those orders that may include a greater variety of products in relatively smaller quantities.
  • Further, PVH often priced apparel “Made in China” higher than those sourced from the rest of Asia.

Trend 4: PVH actively used “emerging” sourcing destinations outside Asia. Other than those top Asian suppliers, PVH’s apparel sourcing base includes several countries in America, the EU, and Africa that deserve more attention, including Portugal, Brazil, Tunisia, and Turkey. Overall, PVH sourced from these countries for various reasons, from serving local consumers, seeking sourcing flexibility, accessing raw materials, and lowering sourcing costs.

by Sheng Lu and Ally Botwinick

Further reading: Lu, Sheng & Botwinick, Ally (2023). US fashion companies’ evolving sourcing strategies – a PVH case study. Just-Style. Retrieved from https://www.just-style.com/features/us-fashion-companies-evolving-sourcing-strategies-a-pvh-case-study/

PVH’s market shares in the China apparel retail market

(discussion for this post is closed)

China’s Textile and Clothing Export: Latest Patterns and Trends (updated August 2024)

The newly released World Trade Organization statistics and data from the United Nations (UNComtrade) suggest several patterns of China’s textile and clothing exports.

Firstly, while China remained the world’s largest clothing exporter in 2023, rising geopolitical tensions and Western fashion companies’ ongoing de-risking efforts pose increasing challenges to its export outlook.

To some extent, 2023 wasn’t too bad for clothing “Made in China.” In value, China’s clothing exports totaled $164 billion, accounting for 31.6% of the world—unchanged from 2022. While China’s clothing exports decreased by 9.7 percent in 2023 compared to the previous year due to weaker market demand, this performance was better than most other top ten suppliers, including Bangladesh (down 16 percent), Vietnam (down 12 percent), India (down 13 percent), and Indonesia (down 17 percent).

However, China’s clothing exporters face significant challenges ahead. Despite maintaining its overall market share, China is losing momentum in nearly all key Western clothing markets, including the United States, the European Union, the UK, and Canada. This trend is primarily driven by perceived heightened sourcing risks associated with China, ranging from concerns over forced labor in the Xinjiang region to escalating geopolitical tensions involving the country.

For example, according to the 2024 Fashion Industry Benchmarking Study released by the US Fashion Industry Association (USFIA) in July, a record 43 percent of surveyed leading US fashion companies reported sourcing less than 10 percent of their apparel products from China in 2024, compared to only 18 percent in 2018. Likewise, nearly 60 percent of respondents no longer use China as their top apparel supplier in 2024, much higher than the 25-30 percent range before the pandemic. Additionally, nearly 80 percent of respondents plan to further reduce their apparel sourcing from China over the next two years through 2026, citing perceived high sourcing risks as the primary concern.

Secondly, China has been diversifying its clothing exports beyond traditional Western markets in response to the “de-risking” movement. For example, the US, EU, UK, and Canada combined accounted for 43-45 percent of China’s clothing exports in 2023, lower than over 50 percent in the past. In comparison, these four Western markets typically accounted for 70 to 90 percent of an Asian country’s clothing exports. Meanwhile, since 2021, Asian economies, especially members of the Regional Comprehensive Economic Partnership (RCEP) and Africa, have become more important export markets for China. Nevertheless, since RCEP members and those in Africa primarily consist of developing economies with ambitions to expand their own clothing production and exports, the long-term growth prospects for their demand for “Made in China” clothing remain uncertain.

Thirdly, China’s weakened economy could lead to an increased supply of low-cost Chinese clothing in the global market.

Despite being known as the world’s largest clothing exporter, between 2013 and 2022 (the latest available data), over 70%–80% of clothing produced in China was consumed domestically, with only about 20%–30% being exported. However, as China’s economic growth has slowed and consumer spending on clothing has stalled, more clothing made in China could enter the international market and intensify the price competition. Notably, between June 2023 and June 2024, the average unit price of US apparel imports from China decreased unusually by 7.6 percent, signaling that an increased supply of Chinese clothing began to suppress market prices. Likewise, it doesn’t seem reasonable that the unit price of U.S. apparel imports from China was 40% lower than that of imports from Bangladesh in the first half of 2024. Thus, the growing influx of cheap Chinese products raises the risk of market disruptions, potentially leading to additional trade tensions and restrictive measures against Chinese products.

Fourthly, there is an early sign that Asian countries have become more cautious about using Chinese yarns and fabrics. China remained a key supplier of textile raw materials to leading apparel-exporting countries in Asia. However, Asian countries appeared to be sourcing fewer yarns and fabrics from China in 2023, possibly due to the enforcement of anti-forced labor laws, such as the Uyghur Forced Labor Prevention Act (UFLPA), and the perceived risks associated with sourcing Chinese cotton. Instead, more Asian countries’ yarns and fabrics now came from regional suppliers other than China.

by Sheng Lu

Additional reading: China has turned inward to sell Xinjiang cotton after a trade ban. Will it be enough? (South China Morning Post, August 11, 2024).

Mega Trade Agreements in the Asia-Pacific Region and Textiles and Apparel Trade (Updated August 2024)

Speaker: Dr. Deborah Elms, Founder and Executive Director of the Asian Trade Centre and the President of the Asia Business Trade Association. The clip was part of the webinar “Asia’s Noodle Bowl Of Trade” (March 2023).

Background

The Asia-Pacific region includes several mega free trade agreements:

ASEAN (Association of Southeast Asian Nations) is a regional intergovernmental organization comprising ten countries in Southeast Asia (Brunei, Cambodia, Indonesia, Laos, Malaysia, Myanmar, the Philippines, Singapore, Thailand, and Vietnam). In 2022, ASEAN members have a combined nominal GDP of $3.6 trillion and a population of 671.6 million.

CPTPP (Comprehensive and Progressive Agreement for Trans-Pacific Partnership) is a free trade agreement signed by 11 countries in the Asia-Pacific region, including Japan, Malaysia, Vietnam, Australia, Singapore, Brunei, New Zealand, Canada, Mexico, Peru, and Chile. The CPTPP covers a market of 495 million people with a combined GDP of $13.5 trillion in 2021. The United States was originally a participant in the Trans-Pacific Partnership (TPP) negotiations, but in January 2017, former US President Trump withdrew the US from the agreement. The Biden administration has indicated no interest in rejoining CPTPP. Additionally, China is actively seeking to join CPTPP (as of March 2024).

RCEP (Regional Comprehensive Economic Partnership) is a free trade agreement signed by 15 countries in the Asia-Pacific region, including China, Japan, South Korea, Australia, New Zealand, Brunei, Cambodia, Indonesia, Laos, Malaysia, Myanmar, the Philippines, Singapore, Thailand, Vietnam. In 2021, RCEP members collectively represented a market of 2.3 billion people with a combined GDP of $26.3 trillion. India was an RCEP member but withdrew from the agreement due to concerns about import competition with China.

IPEF (Indo-Pacific Economic Framework for Prosperity) is a US-led economic cooperation framework that aims to “link major economies and emerging ones to tackle 21st-century challenges and promote fair and resilient trade for years to come.” IPEF is NOT a traditional free trade agreement, and it does not address market access issues like tariff cuts. Instead, IPEF includes four pillars: trade, supply chains, clean economy, and fair economy. IPEF members in the Asia-Pacific region include the United States, Japan, Australia, New Zealand, South Korea, India, Fiji, Brunei, Indonesia, Malaysia, the Philippines, Singapore, Thailand, and Vietnam. The IPEF is designed to be flexible, meaning that IPEF partners are not required to join all four pillars. For example, India chooses not to join the trade pillar of the framework. In 2021, IPEF countries collectively represented a market of 2.1 billion people with a combined GDP of $23.3 trillion. The potential economic impact of IPEF remains too early to tell.

Notably, ASEAN, CPTPP, RCEP, and IPEF members play significant roles in the world textile and apparel trade. Specifically:

ASEAN and RCEP members have established a highly integrated regional textile and apparel supply chain. For example, a substantial portion of ASEAN and RECP members’ textile imports came from within the region.

ASEAN and RCEP members’ supply chain connection with China has substantially strengthened over the past decade. In contrast, the US barely participated in Asia-based textile and apparel supply chains. For example, other than CPTPP, the US accounted for less than 2% of ASEAN, RCEP, and IPEF members’ textile imports in 2022.

ASEAN and RCEP members also hold significant market shares in the world textile and apparel exports (over 50%). Meanwhile, the US and EU are indispensable export markets for ASEAN and RCEP members.

Because of the inclusion of the United States, IPEF represented one of the world’s largest apparel import markets (i.e., 33.7% in 2021, measured in value). Similarly, in 2022, about 26% of US apparel imports came from current IPEF members. Should IPEF address market access issues, it could offer significant duty-saving opportunities for textile and apparel products.

Additionally, the UK’s membership in CPTPP may have a limited direct impact on the textile and apparel sector, at least in the short to medium terms. For example, current CPTPP members only accounted for about 6% of the UK’s apparel imports in 2022.

Exploring the Production and Export Strategies of U.S. Textiles and Apparel Manufacturers

The full study is available HERE.

Textiles and apparel “Made in the USA” have gained growing attention in recent years amid the increasing supply chain disruptions during the pandemic, the rising geopolitical tensions worldwide, and consumers’ increasing interest in sustainable apparel and faster speed to market. Statistics from the U.S. Bureau of Economic Analysis showed that U.S. textile and apparel production totaled nearly $28 billion in 2022, a record high in the most recent five years. Meanwhile, unlike in the old days, a growing proportion of textiles and apparel “Made in the USA” are sold overseas today. For example, according to the Office of Textiles and Apparel (OTEXA) under the U.S. Department of Commerce, U.S. textiles and apparel exports exceeded $24.8 billion in 2022, up nearly 12% from ten years ago.

By leveraging U.S. Department of Commerce Office of Textiles and Apparel (OTEXA)’s “Made in U.S.A. Sourcing & Products Directory,” this study explored U.S. textiles and apparel manufacturers’ detailed production and export practices. Altogether, 432 manufacturers included in the directory as of October 1, 2023, were analyzed. These manufacturers explicitly mentioned making one of the following products: fiber, yarn, fabric, garment, home textiles, and technical textiles.

Key findings:

First, U.S. textile manufacturers exhibit a notable geographic concentration, whereas apparel manufacturers are dispersed throughout the country. Meanwhile, by the number of textile and apparel manufacturers, California and North Carolina are the only two states that rank in the top five across all product categories, showcasing the most comprehensive textile and apparel supply chain there.

Second, U.S. textile and apparel manufacturers have a high concentration of small and medium-sized enterprises (SMEs). Highly consistent with the macro statistics, few textile and apparel manufacturers in the OTEXA database reported having more than 500 employees. Particularly, over 74% of apparel and nearly 60% of home textile manufacturers are “micro-factories” with less than 50 employees.

Third, U.S. textile and apparel manufacturers have limited vertical manufacturing capability. A vertically integrated manufacturer generally makes products covering various production stages, from raw materials to finished products. Results show that only one-third of U.S. textile and apparel manufacturers in OTEXA’s database reported making more than one product type (e.g., yarn or fabric). Meanwhile, specific types of vertically integrated production models are relatively popular among U.S. textile and apparel manufacturers, such as:

  • Apparel + home textiles (5.8%)
  • Fabric + technical textiles (5.1%)
  • Yarn + fabric (3.9%)

However, the lack of fabric mills (N=38 out of 432) appears to be a critical bottleneck preventing the building of a more vertically integrated U.S. textile and apparel supply chain.

Fourth, it is not uncommon for U.S. textile and apparel manufacturers to use imported components. Specifically, among the manufacturers in the OTEXA database, nearly 20% of apparel and fabric mills explicitly say they utilized imported components. In comparison, given the product nature, fiber and yarn manufacturers had a lower percentage using imported components (11%). Furthermore, smaller U.S. textile and apparel manufacturers appear to be more likely to use imported components. For example, whereas 20% of manufacturers with less than 50 employees used imported input, only 10.2% of those with 50-499 employees and 7.7% with 500 or more employees did so. The results indicate the necessity of supporting SME U.S. textile and apparel manufacturers to access textile input through mechanisms such as the Miscellaneous Tariff Bill (MTB).

Fifth, many US textile and apparel manufacturers have already explored overseas markets. Specifically, factories making textile products reported a higher percentage of engagement in exports, including fiber and yarn manufacturers (68.4%), fabric mills (78.9%), and technical textiles producers (69.1%). In comparison, relatively fewer U.S. apparel and home textile producers reported selling overseas.

Sixth, U.S. textile and apparel manufacturers’ export markets are relatively concentrated. Specifically, as many as 72% of apparel mills and 57% of home textiles manufacturers in the OTEXA database reported selling their products in less than two markets. These manufacturers also have a high percentage of selling to the U.S. domestic market. Likewise, because of the reliance on the Western Hemisphere supply chain, more than half of U.S. fiber and yarn manufacturers reported only selling in two markets or less. In comparison, reflecting the global demand for their products, U.S. technical textile manufacturers had the most diverse markets, with nearly 40% exporting to more than ten countries.

Seventh, while the Western Hemisphere remains the top export market, many U.S. textile and apparel manufacturers also export to Asia, Europe, and the rest of the world. For example, nearly half of U.S. textile and apparel manufacturers in OTEXA’s database reported exporting to Asia, and over 60% of U.S. technical textile manufacturers sold their products to European customers.

Additionally, over half of U.S. textile and apparel mills engaged in exports leveraged U.S. free trade agreements (FTAs). U.S. textile mills, on average, reported a higher percentage of using FTAs than apparel and home textile manufacturers. As most U.S.-led FTAs adopt the yarn-forward rules of origin, the results suggest that while such a rule may favor the export of U.S. textile products, its effectiveness and relevance in supporting U.S. apparel exports could be revisited.

Moreover, in line with the macro trade statistics, U.S. textile and apparel manufacturers in the OTEXA database reported a relatively high usage of USMCA, given Mexico and Canada being the two most important export markets. In comparison, U.S. textile and apparel manufacturers’ use of CAFTA-DR was notably lower, even for fiber and yarn manufacturers (37%) and fabric mills (33.3%).

by Kendall Ludwig, Miranda Rack and Sheng Lu

Picture above: On December 13, 2023, Kendall Ludwig and Miranda Rack, FASH 4+1 graduate students and Dr. Sheng Lu, had the unique opportunity to present the study’s findings to senior U.S. trade officials from OTEXA and the Office of the U.S. Trade Representative (USTR) in Washington DC, including Jennifer Knight (Deputy Assistant Secretary for Textiles, Consumer Goods and Materials), Laurie-Ann Agama (Acting Assistant US Trade Representative for Textiles), Maria D’Andrea-Yothers (Director of OTEXA), Natalie Hanson (Deputy Assistant US Trade Representative for Textiles) and Richard Stetson (Deputy Director of OTEXA).

Check the Udaily article that features the research project and the presentation (February 2024).

FASH455 Video Discussion: The Outlook of China as an Apparel Sourcing Destination

Video 1: I Visited a Chinese Factory
Video 2: Comments from Kim Glas, President of the National Council of Textile Organizations (2023)

Additional background reading: China’s U.S. Exports See Biggest Drop in 30 Years (Source: Sourcing Journal| January 19, 2024)

Discussion questions:

#1 What makes China a controversial apparel-sourcing destination with heated debate? What are the benefits of sourcing from China, and what are the concerns?

#2 As noted in the background reading, China accounted for about 21% of US apparel imports 2023, which marked a new record low in the past decade. What are the key drivers behind this shift, and do you anticipate this trend to continue in the next 3-5 years? Why or why not?

#3 Should US fashion companies decouple or derisk with China and to what extent? Please provide reasoning for your recommendation.

#4 Why do you think the US textile industry cares about apparel imports from China? What factual data/statistics supports or challenges the comments in the second video?

#5 Feel free to share any other reflections on the two videos (e.g., anything you find interesting, surprising or thought-provoking).

Transition Pathway for EU Textiles: For Sustainable and Circular Value Chains (Webinar)

Speakers

  • Antonio de Sousa Maia, Legal Officer, European Commission;
  • Cecilia Nilsson-Bottka, Policy Officer, European Commission;
  • Enrico Venturini, Senior Researcher, NEXT TECHNOLOGY TECNOTESSILE;
  • Dirk Vantyghem, Director General, EURATEX;
  • Clara Mallart, Senior Specialist for Sustainability, MODACC.

Summary of remarks by Dirk Vantyghem (Director General of the European Apparel and Textile Confederation, EURATEX)

  • EU textile and apparel companies are still struggling with an adverse business environment, from high energy bills and hiking inflation to an economic slowdown. Many companies are in trouble. New “green measures” must be careful about their impacts on companies’ business operations.
  • Textile and apparel is one of the most globalized sectors in the EU. Government sustainability policy must consider the global dimension of their implications on EU companies, such as the impact on fair competition and investments across borders.
  • Consumers’ demand for sustainable textile and apparel products, especially their willingness to pay a premium, remains a question mark.
  • If new sustainability regulations are implemented, it is imperative for the government to assist companies going through the transition. Small and medium-sized enterprises (SMEs) form the backbones of the textile and apparel industry. These SMEs must survive as they provide critical products and services to large-scale fashion brands.
  • Many green legislations impacting the EU textile and apparel industry are coming (e.g., new labeling requirements on sustainable materials). Close collaboration and dialogue between the industry and legislators are essential.

Explore the Recycled Clothing Market in Five European (EU) Countries

Abstract

By leveraging industry sources and a content analysis of companies’ websites, this study explores how retailers carry and sell clothing made from recycled textile materials in the five largest European economies, namely the United Kingdom (UK), Italy, Germany, France, and Spain.

The results show that:

  • The recycled clothing market in the five EU countries has enjoyed fast growth over the past three years. However, recycled clothing remains a niche product. Ultimately, recycled clothing only accounted for 1.5% of clothing launched in the five EU markets as of 2022.
  • EU retailers adopt distinct merchandising strategies for clothing made from recycled textile materials. For example, clothing made from recycled materials concentrates on specific product categories, including outwear, swimwear, and bottoms, but is less likely to be available for categories including tops and dresses.
  • Affected by the recycling technologies and the raw material supply, recycled clothing sold in the five EU countries mainly uses recycled polyester or a combination of two or more recycled fibers. In comparison, it is still rare to see clothing made from 100% recycled cotton (less than 1% of the market total), given the technical difficulty of making recycled cotton strong and durable enough. The unbalanced supply of recycled textile raw materials by fiber types also contributes to the phenomenon that recycled clothing concentrates on specific categories.
  • Recycled clothing looks more “boring” or “dull” than regular new clothing overall–as much as 80% of recycled clothing available in the five EU countries adopted the plain pattern (i.e., the apparel item does not contain any graphics, spots, florals, or other designs) compared to only 60% of regular new clothing.
  • Retailers in the five EU countries generally tend to price recycled clothing lower than regular new clothing in the luxury & premium segment but often higher in the mass & value market. The results reflect the dilemma of pricing recycled clothing: whereas the production costs could be higher, consumers do not often see the value of such product (i.e., unwilling to pay a price premium).

The findings enhance our understanding of the business aspect of recycled clothing, especially from retailers’ perspectives. The results suggest that advancing recycling technologies will be critical to overcoming the physical shortcomings of recycled clothing and diversifying the product offers in the market. Meanwhile, in collaboration with other stakeholders, retailers can do more to help consumers better understand the benefits of shopping for recycled clothing and change their perceptions about its low value and inferior quality.

Short bio: Leah Marsh is a Fashion Merchandising and Management major at the University of Delaware (UD) & 2022 UD summer scholar. She is also a World Scholar, a competitive UD program aiming to offer students with unique global learning experiences and networking. Leah is recently admitted to the 4+1 fashion and apparel studies graduate program at the University of Delaware. Additionally, Leah is a UD BlueHen Social Media Ambassador.

Further reading: Leah Marsh & Sheng Lu (2022). Unleashing the potential of Europe’s recycled clothing market. Just-Style Magazine

Sourcing Apparel from the CAFTA-DR Region—The Modern Cotton Story Podcast

Discussion questions:

  • What are the advantages and disadvantages of CAFTA-DR as an apparel-sourcing base for US fashion companies?
  • What are the key bottlenecks that prevent more apparel sourcing from CAFTA-DR members?
  • Do you support liberalizing the rules of origin or keeping the strict “yarn-forward” rules of origin in CAFTA-DR, and why?

The Shifts in US Textile Manufacturing Raise Questions About the Availability of US-made Textile Inputs for the Western Hemisphere Apparel Supply Chain

The full study is available here (need Just-Style subscription)

By leveraging production and trade statistics from government databases, we examined the critical trends of US textile manufacturing and supply. Particularly, we try to understand the strengths and weaknesses of the United States as a textile raw material supplier for domestic garment manufacturers and those in the Western Hemisphere. Below are the key findings:

First, fiber, yarn, and thread manufacturing is a long-time strength in the US, whereas fabric production is much smaller in scale. Specifically, fiber, yarn, and thread (NAICS 31311) accounted for nearly 18% of US textile mills’ total output in 2019. In comparison, less than 13% of the production went to woven fabrics (NAICS 31321) and only about 5% for knit fabrics (NAICS 31324).

Second, the US textile industry shifts to make more technical textiles and less apparel-related yarns, fabrics, and other raw materials. Data shows that from 2015 to 2019, the value of US fiber, yarn, and thread manufacturing (NAICS code 31311) dropped by as much as 16.8 percent. Likewise, US broadwoven fabric manufacturing (NAICS code 31321) and knit fabric (NAICS code 31324) decreased by 2.0 percent and 2.7 percent over the same period. Labor cost, material cost, and capital expenditure are critical factors behind the structural shift of US textile manufacturing.

Third, the structural change of US textile manufacturing directly affects the role of the US serving as a textile supplier for domestic apparel producers and those in the Western Hemisphere.

On the one hand, the US remains a critical yarns and threads supplier in the Western Hemisphere. For example, from 2010 to 2019, the value of US fibers, yarn and threads exports (NAICS31311) increased by 25%, much higher than other textile categories. Likewise, in 2021, fibers, yarns, and threads accounted for about 23.3% of US textile exports, higher than 21.0% in 2010. Additionally, nearly 40% of Mexico and CAFTA-DR members’ yarn imports in 2021 (SITC 651) still came from the US, the single largest source. This trend has stayed stable over the past decade.

On the other hand, the US couldn’t sufficiently supply fabrics and other textile accessories for garment producers in the Western Hemisphere, and the problem seems to worsen. Corresponding to the decline in manufacturing, US broadwoven fabric (NAICS 31321) and knit fabric (NAICS 31324) exports decreased substantially.

The US also plays a declining role as a fabric and textile accessories supplier for garment factories in the Western Hemisphere. Garment producers in Mexico and CAFTA-DR members had to source 60%-80% of woven fabrics and 75-82% of knit fabrics from non-US sources in 2021. Likewise, only 40% and 14.6% of Mexico and CAFTA-DR members’ textile accessories, such as labels and trims, came from the US in 2021.

Likewise, the limited US fabric supply affects the raw material sourcing of domestic apparel manufacturers. For example, according to the “Made in the USA” database managed by the Office of Textiles and Apparel (OTEXA), around 36% of US-based apparel mills explicitly say they use “imported material,” primarily fabrics.

The study’s findings echo some previous studies suggesting that textile raw material supply, especially fabrics and textile accessories, could be the single most significant bottleneck preventing more apparel “Made in the USA” and near-sourcing from the Western Hemisphere.

Meanwhile, how to overcome the bottleneck could trigger heated public policy debate. For example, US policymakers could encourage an expansion of domestic fabric and textile accessories manufacturing as one option. However, to make it happen takes time and requires substantial new investments. Also, economic factors may continue to favor technical textiles production over apparel-related fabrics in the US.

As an alternative, US policymakers could make it easier for garment producers in the Western Hemisphere to access their needed fabrics and textile accessories outside the US, such as improving the rules of origin flexibility in CAFTA-DR or USMCA. But this option is likely to face strong opposition from US yarn producers and be politically challenging to implement.

(About the authors: Dr Sheng Lu is an associate professor in fashion and apparel studies at the University of Delaware; Anna Matteson is a research assistant in fashion and apparel studies at the University of Delaware).

Exclusive Interview with FIBRE2FASHION about the Latest World Textile and Apparel Trade Patterns (October 2021)

The full interview is available HERE

Selected interview questions

The virus is here to stay. What steps the companies must take to mitigate its impact?

Sheng: Earlier this year, I, together with the US Fashion Industry Association, surveyed about 30 leading US fashion brands and retailers to understand COVID-19’s impact on their sourcing practices. Respondents emphasized two major strategies they adopted in response to the current market environment. One is to strengthen the relationship with key vendors, and the other is to improve flexibility and agility in sourcing. These two strategies are also highly connected. As one respondent told us “We’re adjusting our sourcing model mix (direct vs. indirect) & establishing stronger strategic supplier relationships across entire matrix continue to build flexibility and dual sourcing options.” Many respondents, especially those large-scale fashion brands and retailers, also say they plan to reduce the number of vendors in the next few years to improve operational efficiency and obtain greater leverage in sourcing.

Which are the countries benefitting out of the US-China tariff war and why?

Sheng: The trade war benefits nobody, period. Today, textiles and apparel are produced through a highly integrated supply chain, meaning the US-China tariff war could increase everyone’s production and sourcing costs. Back in 2018, when the tariff war initially started, the unit price of US apparel imports from Vietnam, Bangladesh, and India all experienced a notable increase. Whereas companies tried to switch their sourcing orders, the production capacity was limited outside China.  Meanwhile, China plays an increasingly significant role as a leading textile supplier for many apparel exporting countries in Asia. Despite the trade war, removing China from the textile and apparel supply chain is impossible and unrealistic.

How do you compare the African and Asian markets when it comes to sourcing and manufacturing? Which are the advantages both offer?

Sheng: Asia as a whole remains the world’s dominant textile and apparel sourcing base. According to statistics from the United Nations (i.e., UNComtrade), Asian countries as a whole contributed about 65% of the world’s total textile and apparel exports in 2020. In the same year, Asian countries altogether imported around 31% of the world’s textiles and 19% of apparel. Asian countries have also established a highly efficient and integrated regional supply chain by leveraging regional free trade agreements or arrangements. For example, as much as 85% of Asian countries’ textile imports came from other Asian countries in 2019, a substantial increase from only 70% in the 2000s. With the recent reaching of several mega free trade agreements among countries in the Asia-Pacific region, such as the Regional Comprehensive Economic Partnership (RCEP), the pattern of “Made in Asia for Asia” is likely to strengthen further.

In comparison, only about 1% of the world’s apparel imports come from Africa today. And this percentage has barely changed over the past decades. Many western fashion brands and retailers have expressed interest in expanding more apparel sourcing from Africa. However, the tricky part is that these fashion companies are hesitant to invest directly in Africa, without which it is highly challenging to expand African countries’ production and export capacity. Political instability is another primary concern that discourages more investment and sourcing from Africa. For example, because of the recent political turmoil, Ethiopia, one of Africa’s leading apparel sourcing bases, could be suspended for its eligibility for the African Growth and Opportunity Act (AGOA). Without AGOA’s critical support, Ethiopia’s apparel exports to the US market could see a detrimental decline. On the other hand, while these trade preference programs are crucial in supporting Africa’s apparel exports, they haven’t effectively solved the structural issues hindering the long-term development of the textile and apparel industry in the region. More work needs to be done to help African apparel producers improve their genuine export competitiveness.

Another issue is Brexit. Is that having any significant impact on the sourcing scenario of the world or is it just limited to the European nations?

Sheng: Despite Brexit, the trade and business ties between the UK and the rest of the EU for textile and apparel products continue to strengthen. Thanks to the regional supply chain, EU countries remain a critical source of apparel imports for UK fashion brands and apparel retailers. Nearly 35% of the UK’s apparel imports came from the EU region in 2019, a record high since 2010. Meanwhile, the EU region also is the single largest export market for UK fashion companies—about 79% of the UK’s apparel exports went to the EU region in 2019 before the pandemic.

However, trade statistics in the short run may not fully illustrate the impacts of Brexit. For example, some recent studies suggest that Brexit has increased fashion companies’ logistics costs, delayed customs clearance, and made talent-hiring more inconvenient. Meanwhile, Brexit provides more freedom and flexibility for the UK to reach trade deals based on its national interests. For example, the UK recently submitted its application to join the Comprehensive Progressive Agreement of the Trans-Pacific Partnership (CPTPP). The UK is also negotiating a bilateral trade agreement with the United States. The reaching of these new trade agreements, particularly with non-EU countries, could significantly promote the UK’s luxury apparel exports and help the UK diversity its source of imports.

How do you think the power shortages happening across Europe, China, and other nations, are going to impact the apparel supply chains?

Sheng: One of my primary concerns is that the new power shortage could exacerbate inflation further and result in a more severe price hike throughout the entire textile and apparel supply chain. When Chinese factories are forced to cease production because of power shortage, the impact could be far worse than recent COVID-related lockdowns in Vietnam and Bangladesh. As mentioned earlier, more than half of many leading Asian apparel exporting countries’ textile supplies come from China today. Also, no country can still compete with China in terms of the variety of apparel products to offer. In other words, for many western fashion brands and retailers, their stores and shelves could look more empty (i.e., having less variety of products to sell) because of China’s power shortage problem.

US Textile and Apparel Manufacturing and Sourcing During COVID-19: Discussion Questions from FASH455

#1:  As of June 2021, US textile production had resumed about 98.8% of its production capacity at the pre-COVID level. Based on the readings, why or why not do you think the industry is already “out of the woods”? How to understand the impact of COVID-19 on the international competitiveness of US textile production?

#2: To which extent do you think the state of the US textile and apparel industry and its performance during the pandemic challenge the conclusions of the classic trade and economic development theories we learned in the class (e.g., comparative advantage, factor proportion, the international division of labor, and stage of development theories)? Do you find any trade or production patterns that existing theories cannot fully explain?

#3 Many US fashion companies’ strategies to “consolidate existing sourcing base and strengthen the relationship with key vendors” during the pandemic. What is your evaluation of this strategy—is it a short-term reaction toward COVID-19 or a long-term trend likely to stay? What does this strategy mean for vendors in the apparel supplying countries?

#4: What are the notable changes in fashion companies’ sourcing criteria during the pandemic? How to explain such changes? Who are the winners and losers? Why?

#5: It is of concern that sustainability and social responsibility become a lower priority for the apparel industry during the pandemic, given the unprecedented operational and financial challenges companies face. What is your assessment based on the readings?

#6: What is your vision for the US textile and apparel industry in the post-COVID world? What are the key issues/questions/development trends we shall watch?

(Welcome to our online discussion. For students in FASH455, please address at least two questions and mention the question number (#) in your reply)

China’s Membership in CPTPP and the US Textile Industry

As one breaking news, on 16 September 2021, China officially presented its application to join the 11-member Comprehensive and Progressive Agreement for Trans-Pacific Partnership (CPTPP). While the approval of China’s membership in CPTPP remains a long shot and won’t happen anytime soon, the debate on the potential impact of China’s accession to the trade agreement already starts to heat up.

Like many other sectors, textile and apparel companies are on the alert. Notably, China plus current CPTPP members accounted for nearly half of the world’s textile and apparel exports in 2020. Many non-CPTPP countries are also critical stakeholders of China’s membership in the agreement. In particular, the Western Hemisphere textile and apparel supply chain, which involves the US textile industry, could face unrepresented challenges once China joins CPTPP. 

First, once China joins CPTPP, the tariff cut could provide strong financial incentives for Mexico and Canada to use more Chinese textiles. China is already a leading textile supplier for many CPTPP members. In 2019, as much as 47.7% of CPTPP countries’ textile imports (i.e., yarns, fabrics, and accessories) came from China, far more than the United States (12.1%), the other leading textile exporter in the region. 

Notably, thanks to the Western Hemisphere supply chain and the US-Mexico-Canada Trade Agreement (USMCA, previously NAFTA), the United States remains the largest textile supplier for Mexico (48.2%) and Canada (37.2%). Mexico and Canada also serve as the largest export market for US textile producers, accounting for as many as 46.4% of total US yarn and fabric exports in 2020.

However, US textile exporters face growing competition from China, offering more choices of textile products at a more competitive price (e.g., knitted fabrics and man-made fiber woven fabrics). From 2005 to 2019, US textile suppliers lost nearly 20 percentage points of market shares in Mexico and Canada, equivalent to what China gained in these two markets over the same period.

Further, China’s membership in CPTPP means its textile exports to Mexico and Canada could eventually enjoy duty-free market access. The significant tariff cut (e.g., from 9.8% to zero in Mexico) could make Chinese textiles even more price-competitive and less so for US products. This also means the US textile industry could lose its most critical export market in Mexico and Canada even if the Biden administration stays away from the agreement.

Second, if both China and the US become CPTPP members, the situation would be even worse for the US textile industry. In such a case, even the most restrictive rules of origin would NOT prevent Mexico and Canada from using more textiles from China and then export the finished garments to the US duty-free. Considering its heavy reliance on exporting to Mexico and Canada, this will be a devastating scenario for the US textile industry.

Even worse, the US textile exports to CAFTA-DR members, another critical export market, would drop significantly when China and the US became CPTPP members. Under the so-called Western-Hemisphere textile and apparel supply chain, how much textiles (i.e., yarns and fabrics) US exports to CAFTA-DR countries depends on how much garments CAFTA-DR members can export to the US. In comparison, US apparel imports from Asia mostly use Asian-made textiles. For example, as a developing country, Vietnam relies on imported yarns and fabrics for its apparel production. However, over 97% of Vietnam’s textile imports come from Asian countries, led by China (57.1%), South Korea, Taiwan, and Japan (about 25%), as opposed to less than 1% from the United States.

The US textile industry also deeply worries about Vietnam becoming a more competitive apparel exporter with the help of China under CPTPP. Notably, among the CPTPP members, Vietnam is already the second-largest apparel exporter to the United States, next only to China. Despite the high tariff rate, the value of US apparel imports from Vietnam increased by 131% between 2010 and 2020, much higher than 17% of the world average. Vietnam’s US apparel import market shares quickly increased from only 7.6% in 2010 to 16.6% in 2020 (and reached 19.3% in the first half of 2021). The lowered non-tariff and investment barriers provided by CPTPP could encourage more Chinese investments to come to Vietnam and further strengthen Vietnam’s competitiveness in apparel exports.  

Understandably, when apparel exports from China and Vietnam became more price-competitive thanks to their CPTPP memberships, more sourcing orders could be moved away from CAFTA-DR countries, resulting in their declined demand for US textiles. Notably, a substantial portion of US apparel imports from CAFTA-DR countries focuses on relatively simple products like T-shirts, polo shirts, and trousers, which primarily compete on price. Losing both the USMCA and CAFTA-DR export markets, which currently account for nearly 70% of total US yarns and fabrics exports, could directly threaten the survival of the US textile industry.

by Sheng Lu

Related readings:

Why Sourcing from China? A Case Study on VF Corporation’s Textile and Apparel Sourcing and Supply Chain Strategy

The prospect of China as a textile and apparel sourcing base for US fashion companies is becoming ever more intriguing. While China remains the top textile and apparel supplier to the US market, US fashion companies have been actively seeking China’s alternatives due to concerns ranging from rising wages, trade wars to perceived supply chain risks.

Recently, VF Corporation, one of the most historical and largest US apparel corporations, released the entire supply chain of its 20 popular apparel items, such as Authentic Chino Stretch, Men’s Merino Long Sleeve Crewe, and Women’s Down Sierra Parka. VF Corporation used 326 factories worldwide to make these apparel items and related textile raw materials. We conducted a statistical analysis of these factories, focusing on exploring their geographic locations, production features, and related factors. The results help us gain new insights into VF Corporation’s supply chain strategy and offer a unique firm-level perspective to understand China’s outlook as a textile and apparel sourcing base for US fashion companies. Specifically:

First, China remains the single largest sourcing base across VF Corporation’s entire textile and apparel supply chain. Specifically, as many as 113 (or 35%) of the total 326 factories used by VF Corporation are China-based, far exceeding any other country or region. Besides China, VF Corporation sourced products from the US (42), Taiwan (31), South Korea (16), Mexico (13), Honduras (12), Vietnam (11), Indonesia (8), as well as a few EU countries, such as Germany, Czech Republic, and France.

Notably, thanks to its unparalleled production capacity, China also offered the most variety of textiles and apparel among all suppliers. Chinese factories supplied products ranging from chemicals, yarns, fibers, trims, threads, labels, packing materials to finished garments. In comparison, most other countries or regions serve a narrower role in VF Corporation’s supply chain. For example, 65% of US-based factories supplied yarns, threads, trims, and fabrics; 80% of Taiwan-based factories supplied trims, fabrics, and zippers; and VF Corporation used most factories from Vietnam, Mexico, Honduras, and Indonesia to cut and sew garments only.

Second, VF Corporation is more likely to source from China when a higher percentage of the production processes across the apparel supply chain happens in Asia. For example, VF did not use any Chinese textile and apparel factory for its Williamson Dickies’s Original 874® Work Pant. Instead, Williamson Dickies’s supply chain was primarily based in the Western Hemisphere, involving the US (yarns, trims, and fabric suppliers), Mexico (fabric suppliers and garment manufacturers), Honduras (garment manufacturers), and Nicaragua (garment manufacturers).

In comparison, VF used China-made textiles for Napapijri’s Parka Coat Celsius. Nearly 83% of this product’s production processes also happened in the Asia region, such as Taiwan (fabrics, zippers, plastic suppliers), Hong Kong (trim suppliers), and Vietnam (garment manufacturers). This pattern reflects China’s deep involvement and central role in the Asia-based regional textile and apparel production network. We may also expect such an Asia-based regional supply chain to become more economically integrated and efficient after implementing the Regional Comprehensive and Economic Partnership (RCEP) and other regional trade facilitation initiatives in the next few years.

Third, reflecting the evolving nature of China’s textile and apparel industry, the result shows that VF Corporation is more likely to use China as a supplier of textile intermediaries than the finished garment. Due to various reasons, from the US Section 301 tariffs to the wage increases, China already plays a less significant role as a garment supplier for VF Corporation, accounting for just around 10% of the company’s tier 1 suppliers. This result is highly consistent with the official trade statistics—measured by value, only 23.7% of US apparel imports came from China in 2020, a new record low over the past decade.

Fourth, interesting enough, the results indicate that when an apparel item involves more production stages or needs a greater variety of inputs, it will reduce VF Corporation’s likelihood of sourcing from China. For example, the supply chain of Icebreaker’s Men’s Merino 200 Oasis Long Sleeve Crewe included five different processes (e.g., wool fiber, wool yarn, and finished garments). VF Corporation used around 21 various factories and facilities across the supply chain, of which 57.1% were China-based. In comparison, North Face’s Women’s Denali 2 Jacket included around 21 different processes (e.g., polyester yarn, nylon yarn, tape, zipper, trim, polyester interlining, thread, eyelet, label, and finished products). The supply chain included around 24 various factories and facilities, of which only 16.7% were China-based. One possible contributing factor behind this phenomenon is the cost of moving intermediaries across China’s borders. Sourcing from China seems to be disadvantaged by the relatively high trade barriers and a lack of free trade agreements with key trading partners, especially when some components in the supply chain need to come from outside the Asia region, such as the Western Hemisphere and the EU.

Additionally, NO clear evidence suggests that pricing and environmental and social compliance significantly affect VF Corporation’s decision to source from China. For example, the apparel items using either China-made textile raw material or cut and sew in China had a wide price range in the retail market, from as little as $26 to as much as $740. The retail price of those apparel cut and sew in China ranged from $56 to $86, which was neither exceptionally high nor low (i.e., no particular pattern).

Meanwhile, according to VF Corporation, around 61.9% of its China-based factories across the apparel supply chain had received at least one type of “environmental & chemical management certification.” This record was on par with non-Chinese factories (64.8%). Likewise, around 29.0% of China-based tier 1 & tier 2 factories had received one type of “Health, Safety and Social Responsibility Certification(s),” similar to 22.5% of non-Chinese factories. Overall, how US fashion companies like VF Corporation factored in pricing, environmental, and social compliance in their sourcing decisions need to be explored further.

By Sheng Lu

The study will be presented at the 2021 ITAA-KSCT Joint Symposium in November 2021

WTO Reports World Textiles and Apparel Trade in 2019

Updated data in 2020 is now available: WTO Reports World Textiles and Apparel Trade in 2020

According to the World Trade Statistical Review 2020 newly released by the World Trade Organization (WTO):

First, the volume of world textiles and apparel trade reduced in 2019 due to weakened demand and the negative impacts of trade tensions. According to the WTO, the value of the world textiles (SITC 65) and apparel (SITC 84) exports totaled $305bn and $492bn in 2019, respectively, decreased by 2.4% and 0.4% from a year ago. The world merchandise trade also fell by nearly 3% measured by value and 0.1% measured by volume 2018-2019, in contrast with a positive 2.8% growth 2017-2018. Put these numbers in context, the year 2019 was the first time that world merchandise trade fell since the 2008 global financial crisis, and the decline happened even before the pandemic. As noted by the WTO, the economic slowdown and the escalating trade tensions, particularly the tariff war between the United States and China, were among the major contributing factors for the contraction of trade flows. 

Second, the pattern of world textile exports overall stays stable in 2019; Meanwhile, China and Vietnam continue to gain momentum. China, European Union (EU28), and India remained the world’s top three exporters of textiles in 2019. Altogether, these top three accounted for 66.9% of the value of world textile exports in 2019, almost no change from two years ago. Notably, despite the headwinds, China and Vietnam stilled enjoy the positive growth of their textile exports in 2019, up 0.9%, and 8.3%, respectively. In particular, Vietnam exceeded Taiwan and ranked the world’s seventh-largest textile exporter in 2019 ($8.8bn of exports, up 8.3% from a year earlier), the first time in history. The change also reflects Vietnam’s efforts to continuously upgrade its textile and apparel industry and strengthen the local textile production capacity are paying off.

Third, the pattern of world apparel exports reflects fashion companies’ shifting strategies to reduce sourcing from China. China, the European Union (EU28), Bangladesh, and Vietnam unshakably remained the world’s top four exporters of apparel in 2019. Altogether, these top four accounted for as much as 71.4% of world market shares in 2019, which, however, was lower than 74% from 2016 to 2018—primarily due to China’s reduced market shares.

China is exporting less apparel and more textiles to the world. Notably, China’s market shares in world apparel exports fell from its peak of 38.8% in 2014 to a record low of 30.8% in 2019 (was 31.3% in 2018). Meanwhile, China accounted for 39.2% of world textile exports in 2019, which was a new record high. It is important to recognize that China is playing an increasingly critical role as a textile supplier for many apparel-exporting countries in Asia.

On the other hand, even though apparel exports from Vietnam (up 7.7%) and Bangladesh (up 2.1%) enjoyed fast growth in absolute terms in 2019, their gains in market shares were quite limited (i.e., no change for Vietnam and marginally up 0.3 percentage point from 6.8% to 6.5% for Bangladesh). This result indicates that due to capacity limits, no single country has yet emerged to become the “Next China.” Instead, China’s lost market shares in apparel exports were fulfilled by a group of Asian countries altogether.

Fourth, associated with the shifting pattern of world apparel production, the world textile import is increasingly driven by apparel-exporting countries in the developing world. Notably, 2019 marks the first time that Vietnam emerged to become one of the world’s top three largest importers of textiles, primarily due to its expanded apparel production and heavy dependence on imported textile raw materials. In comparison, although the US and the EU remain the world’s top two largest textile importers, their total market shares had declined from nearly 40% in 2010 to only 31.2% in 2019, the lowest in the past ten years. Furthermore, both the US and the EU have been importing more finished textile products (such as home furnishings and carpets) as well as highly specialized technical textiles, rather than conventional yarns and fabrics for apparel production purposes. The weakening import demand for intermediary textile raw materials also suggests that reshoring (i.e., making apparel locally rather than sourcing from overseas) has NOT become a mainstream industry practice in the developed economies like the US and the EU.

Fifth, the world apparel import market is becoming ever more diversified as import demand is increasingly coming from emerging economies with a booming middle class. Affected by consumers’ purchasing power (often measured by GDP per capita) and size of the population, the European Union (EU28), US, and Japan remained the world’s top three importers of apparel in 2019. This pattern has lasted for decades. Altogether, these top three absorbed 58.1% of world apparel in 2019, which, however, was a new historic low (was 84% back in 2005). Behind the numbers, it is not the case that consumers in the EU, US, and Japan are necessarily purchasing less clothing. Instead, several emerging economies are becoming fast-growing apparel consumption markets and starting to import more. For example, China’s apparel imports totaled $8.9bn in 2019, up 8.1% from a year earlier. From 2010 to 2019, China’s apparel imports enjoyed a nearly 15% annual growth, compared with only 1.9% of the traditional top three.

by Sheng Lu

Additional reading: Lu, S. (2020). Five ways world textile and apparel trade is changing. Just-Style.

Appendix:

Production and Export Strategies of U.S. Textile and Apparel Manufacturers

Presenter: Kendall Keough (MS 2020, Fashion and Apparel Studies)

Textiles and apparel “Made in the USA” are gaining growing attention in recent years amid the escalating U.S.-China trade war, the rising cost of imports, and consumers’ increasing demand for “speed to market.” Statistics show that the value of U.S. textile and apparel (T&A) production totaled $US28.1bn in 2018, which was a record high since 2010. Meanwhile, different from the old days, more and more T&A “Made in the USA” are sold overseas today. According to the Office of Textiles and Apparel (OTEXA) under the U.S. Department of Commerce, the value of U.S. T&A exports reached US$22.9bn in 2019, up nearly 20% from ten years ago.

Despite the strong performance in production and export, however, U.S. T&A manufacturers do not seem to be “visible” enough. Given the information gap, we recently analyzed the 122 U.S. T&A manufacturers included in the OTEXA “Made in the USA” database. Information in the database is self-reported by companies and then verified by OTEXA. Our analysis intends to gain more insights into the state of U.S. T&A mills, including their demographics, production and supply chain strategies, as well as their export behaviors.

Key findings:

First, U.S. T&A manufacturers display a relatively high concentration of geographic locations. Notably, as much as 61% of self-reported yarn manufacturers are from North Carolina (NC), followed by South Carolina (SC), which accounts for another 11%. The concentration of yarn manufacturing in the south, in particular, can be attributed to the abundant cotton supply in that region. Meanwhile, California (CA) has one of the most complete T&A supply chains in the country, with the presence of manufacturers across all T&A sub-sectors.

Second, large-size textile mills are gradually emerging in the United States, whereas U.S. apparel manufacturers are predominantly small and medium-sized. U.S. textile mills, in general, have a high concentration of factories with over 100 employees, particularly those engaged in producing yarns (53%), fabrics (37%), and technical textiles (38%). In the past decade, many relatively small-sized U.S. textile mills had merged into larger ones to take advantage of the economies of scale and reduce production cost. In comparison, over half of the apparel mills in the OTEXA database reported having less than 50 employees. Notably, because of the significant disadvantage in labor cost, U.S. apparel mills are not trying to replace imports, but instead focusing on their “niche market.” For example, designer-based micro-factories are popular these days in U.S. fashion centers such as New York City and California. These factories typically provide customized services, ranging from proto-typing to sample production.

Third, “fabric + apparel” and “fabric + technical textiles” are the two most popular types of vertical integration among U.S. T&A mills. A relatively small proportion of T&A mills included in the OTEXA database had adopted the vertical integration business strategy. Notably, fabric mills seem to be most actively engaged in the vertical integration strategy–around one-third of them reported also making apparel, technical textiles, or home textiles. Additionally, 20% of technical textile manufacturers in the OTEXA database have incorporated an apparel component to their product portfolio. This is a significant trend to watch as more and more sportswear brands are developing technology-driven functional apparel. However, we find few U.S. T&A mills have created a vertical integration model that covers three or more different nature of products.

Fourth, U.S. T&A mills have shifted from only making products to also offering various value-added services. Notably, the majority of companies included in the OTEXA “Made in the USA” database reported having the in-house design capability, including apparel mills (86%), fabric mills (80%), yarn manufacturers (61%), home textiles manufacturers (71%) as well as those making technical textiles (91%). U.S. T&A mills also commonly describe themselves as “innovators” and “solutions providers” on their websites to highlight that the nature of their core business is to serve customers’ needs rather than just “making” physical products.

Fifth, exporting has become an important economic activity of U.S. T&A manufacturers today. Notably, of all the 122 U.S. T&A manufacturers in the OTEXA “Made in the USA” database, as many as 70.5% reported engaged in export, a trend which echoes the rising value of U.S. textile and apparel exports in recent years. Regarding the particular export behaviors of U.S. T&A mills, several patterns are interesting to note:

  • U.S. textile mills (76%) are more actively engaged in export than those that make apparel products only (37%).
  • Larger U.S. T&A mills overall had a higher percentage engaged in export than those manufacturers smaller in size.
  • The Western Hemisphere is the dominant export market for U.S. yarn, fabric, and home textile mills, whereas the export markets for U.S. apparel mills and technical textile producers are relatively more diverse.
  • Except for apparel producers, the export diversification strategy is commonly adopted by U.S. T&A mills. As many as 77% of yarn manufacturers included in the OTEXA database reported exporting to three or more different markets in the world. Likewise, around 40% of the fabric, home textiles, and technical textiles mills did the same.
  • Free trade agreements support U.S. T&A exports. A high percentage of U.S. T&A mills that reported exporting to the Western Hemisphere said they took advantage of NAFTA and CAFTA-DR, two primary U.S. free trade agreements with the region. The utilization of NAFTA and CAFTA-DR is particularly high among U.S. yarn producers (83.3%).

Sixth, imports support textile and apparel “Made in the USA”.  Using imported inputs such as cut parts, fabrics, accessories and trims is a very common practice among U.S. textile and apparel manufacturers. Notably, more than 76% of companies which make apparel in the United States say they use imported inputs, followed by companies which make technical textiles (52%) and fabrics (46%). Moreover, the lack of sufficient supply of locally made fabrics is the top reason why U.S. textile and apparel companies use imports as alternatives. 

Additional reading: Kendall Keough and Sheng Lu. (2020). ‘Made in the USA’ textiles and apparel – Key production and export trends. Just-Style.

WTO Reports World Textile and Apparel Trade in 2018

Updated data in 2019 is now available: WTO Reports World Textiles and Apparel Trade in 2019
1

2.jpg

According to the World Trade Statistical Review 2019 newly released by the World Trade Organization (WTO), the current dollar value of world textiles (SITC 65) and apparel (SITC 84) exports totaled $315 billion and $505 billion in 2018 respectively, increased by 6.4% and 11.1% from a year earlier. This has been the fastest growth of world textile and apparel trade since 2012. Specifically: 

I. Textile export

China, European Union (EU28), and India remained the world’s top three exporters of textiles in 2018. Altogether, these top three accounted for 66.9% of world textile exports in 2018, a new record high since 2011. Notably, China and EU (28) also enjoyed a faster-than-world-average export growth in 2018, up 7.9% and 6.9% respectively. The United States remained the world’s fourth top textile exporter in 2018, accounting for 4.4% of the shares, down slightly from 4.6% in 2017.

II. Apparel export

China, the European Union (EU28), Bangladesh, and Vietnam unshakably remained the world’s top four largest exporters in 2018. Altogether, these top four accounted for as much as 72.3% of world market shares in 2018, which, however, was lower than 75.8% in 2017 and 74.3% in 2016—primarily due to China’s declining market shares. Notably, even though apparel exports from Vietnam (up 13.4%) and Bangladesh (up 11.1%) enjoyed a fast growth in absolute terms in 2018, their gains in market shares were quite limited (up 0.3 percentage point from 5.9% to 6.2% for Vietnam and up 0.1 percentage point from 6.4% to 6.5% for Bangladesh). This result once again suggests that due to capacity limits, no single country has emerged to become the “Next China.” Instead, China’s lost market shares in apparel exports were fulfilled by a group of countries, a phenomenon which can be linked with fashion brands and retailers’ sourcing diversification strategy.

III. Textile import

The European Union (EU28), the United States, and China were the top three largest importers of textiles in 2018, accounting for 37.5% of the world’s total textile imports that year. Although the market shares of the top three in 2018 were close to 37.7% a year earlier, it nevertheless was much lower than over 50% back in the 2000s. The increasing diversification of textile import market is associated with the shifting pattern of world apparel manufacturing and export closely.

IV. Apparel import

Affected by consumers’ purchasing power (often measured by GDP per capita) and size of the population, the European Union, the United States, and Japan remained the world’s top three importers of apparel in 2018. Altogether, these top three absorbed 61.5% of world apparel in 2018, which, however, was lower than 62.3% in 2017 and a significant drop from 84% back in 2005. Behind the result, it is not the case that consumers in the EU, U.S., and Japan are importing less clothing. Instead, several emerging economies (such as China) are becoming fast-growing apparel consumption markets and starting to import more. As consumers’ purchasing power in these emerging economies continues to improve, we could expect a more diversified world apparel import market in the years ahead.

textile

clothing.jpg

Additional reading: Latest trends in world textile and apparel trade

U.S. Textile and Apparel Industry is NOT Immune to the U.S.-China Tariff War

The full article is available HERE

This article tries to evaluate the potential impact of the U.S.-China tariff war on the U.S. textile and apparel (T&A) industry, including manufacturing and related trade activities.

The quantitative evaluation conducted is based on the Global Trade Analysis Project (GTAP) model. Data came from the latest GTAP9 database, which covers trade, employment and production in 57 sectors in 140 countries. In correspondence to the recent development of the U.S.-China tariff war, the analysis focuses on the following three scenarios:

  • Scenario 1: 10% punitive tariff + base year tariff rate in 2017 applied to products traded between the U.S. and China, except textiles and apparel
  • Scenario 2: 10% punitive tariff + base year tariff rate in 2017 applied to products traded between the U.S. and China, including textiles and apparel
  • Scenario 3: 25% punitive tariff + base year tariff rate in 2017 applied to products traded between the U.S. and China, including textiles and apparel

Three findings are of note:

First, the tariff war with China will increase the market price for T&A in the United States and consequentially incentivize more production of T&A “Made in the USA.” As shown in Figure 1, the annual U.S. T&A production will increase when the punitive tariff is imposed on textile and apparel imports from China. The most significant increase will happen in scenario 3 (textile output expands by US$8,829 million and apparel output expands by US$6,044 million) when a 25 percent punitive tariff is imposed and the market price of T&A in the U.S. also correspondingly goes up by nearly 1.5% compared with the base year level in 2017.

Second, the tariff war with China will hurt U.S. textile exports. The results show that the tariff war will increase the production cost of “Made in the USA,” and result in a decline of U.S. textile exports due to reduced price competitiveness. This is the case even in scenario 1 when the tariff war does not target T&A directly, but nevertheless, raises the price of intermediaries for producing textiles in the United States. The results further show that the annual U.S. textile exports will suffer the most significant decline in scenario 3 (down US$1,136 million), especially to China and other Asian countries where U.S. textile products are facing intense competition from local suppliers. In comparison, U.S. textile exports to the Western Hemisphere will suffer a loss as well in the tariff war, but to a much less extent due to the strong supply-chain relationship with the region.

Third, the trade diversion effect of the tariff war will bring in more apparel imports to the U.S. market from Asian suppliers other than China. As shown in the figure above, when the punitive tariff imposed on textile and apparel products, the value of U.S. apparel imports from China will decline ranging from US$4,573 million (10 percent punitive tariff imposed) to US$8,858 million (25 percent punitive tariff imposed) annually compared with the base year level in 2017. This result reflects U.S. apparel importers and retailers’ mounting concerns about sourcing cost in the setting of the tariff war. However, apparently, the tariff war will do little to help U.S. domestic apparel manufacturers reduce the competitive pressure with imports. Particularly, in scenario 3, U.S. apparel imports from suppliers other than China will increase as much as US$10,400 million, worsening the U.S. trade deficit in the apparel sector further.

by Sheng Lu

Apparel Specific Rules of Origin in NAFTA 2.0 (US-Mexico-Canada Free Trade Agreement)

Untitled

The full article is available HERE

Key findings:

First, in general, USMCA still adopts the so-called “yarn-forward” rules of origin. This means that fibers may be produced anywhere, but each component starting with the yarn used to make the garments must be formed within the free trade area – that is, by USMCA members. 

Second, other than the source of yarns and fabrics, USMCA now requires that some specific parts of an apparel item (such as pocket bag fabric) need to use inputs made in the USMCA region so that the finished apparel item can qualify for the import duty-free treatment.

Third, USMCA allows a relatively more generous De minimis than NAFTA 1.0.

Fourth, USMCA seems to be a “balanced deal” that has accommodated the arguments from all sides regarding the tariff preference level (TPL) mechanism:

  • 1) Compared with NAFTA, USMCA will cut the TPL level, but only to those product categories with a low TPL utilization rate;
  • 2) Compared with NAFTA, USMCA will expand the TPL level for a few product categories with a high TPL utilization rate.

Fifth, USMCA will make no change to the Commercial availability/short supply list mechanism in NAFTA 1.0.

Sixth, it remains to be seen whether USMCA will boost Made-in-the-USA fibers, yarns and fabrics by limiting the use of non-USMCA textile inputs. For example, while the new agreement expands the TPL level for U.S. cotton/man-made fiber apparel exports to Canada (currently with a 100 percent utilization rate), these apparel products are NOT required to use U.S.-made yarns and fabrics. The utilization rate of USMCA will also be important to watch in the future.

About USMCA

On 30 September 2018, The United States reached an agreement with Canada, alongside Mexico on the updated North American Free Trade Agreement (NAFTA), now called the United States-Mexico-Canada Agreement (USMCA)

Before taking into effect, USMCA still needs to be ratified by all member countries. In the United States, the earliest that President Trump can sign the agreement will be 11/29/2018 (i.e., 90 days after notifying the Congress). The U.S. International Trade Commission has until 3/14/2019 (i.e., 150 days after President signing the agreement) to release an assessment of the new trade agreement. Afterward, the Trump Administration will need to work with the Congress to develop legislation to approve and implement the agreement.

WTO Reports World Textile and Apparel Trade in 2017

Statistical review of world textile and apparel trade in 2018 is now available

Figure 1Figure 2

According to the newly released World Trade Statistical Review 2018 by the World Trade Organization (WTO), the current dollar value of world textiles (SITC 65) and apparel (SITC 84) exports totaled $296.1bn and $454.5bn respectively in 2017, increased by 4.2% and 2.8% from a year earlier. This is the first time since 2015 that the value of world textile and apparel exports enjoyed a growth.

Textiles and apparel are not alone. Driven by rising demand for imports globally, the current dollar value of world merchandise exports also grew by 4.7% in 2017–its most robust growth in six years, to reach $17.43 trillion. Particularly, the ratio of trade growth to GDP growth finally returned to its historic average of 1.5, compared to the much lower 1.0 ratio recorded in the years following the 2008 financial crisis.

China, European Union (EU28), and India remained the world’s top three exporters of textiles in 2017. Altogether, these top three accounted for 66.3% of world textile exports in 2017, up from 65.9% in 2016. All the top three also enjoyed a faster-than-average export growth in 2017, including 5.0% of China, 5.8% of EU(28) and 5.9% of India. The United States remained the world’s fourth top textile exporter in 2017, accounting for 4.6 percent of the shares, the same as a year earlier.

Regarding apparel, China, the European Union (EU28), Bangladesh and Vietnam unshakably remained the world’s top four largest exporters in 2017. Altogether, these top four accounted for as much as 75.8% of world market shares in 2017, which was higher than 74.3% a year earlier and a substantial increase from 68.3% back in 2007.

Continuing with the emerging trend in recent years, China is exporting less apparel and more textiles to the world. Notably, China’s market shares in world apparel exports fell from its peak—38.8% in 2014 to a record low of 34.9% in 2017. Meanwhile, China accounted for 37.1% of world textile exports in 2017, which was a new record high. It is important to recognize that China is playing an increasingly critical role as a textile supplier for many apparel-exporting countries in Asia. Measured by value, 47% of Bangladesh’s textile imports came from China in 2017, up from 39% in 2005. We observe similar trends in Cambodia (up from 30% to 65 %), Vietnam (up from 23 % to 50 %), Pakistan (up from 32 % to 71 %), Malaysia (up from 25 % to 54 %), Indonesia (up from 28 % to 46 %), Philippines (up from 19 % to 41 %) and Sri Lanka (up from 15 % to 39 %) over the same period.

Figure 3

Figure 4

Additional readings: 
Lu, S. (2018). Changing trends in world textile and apparel trade. Just-Style.
Lu, S. (2018). How regional supply chains are shaping world textile and apparel trade. Just-Style.