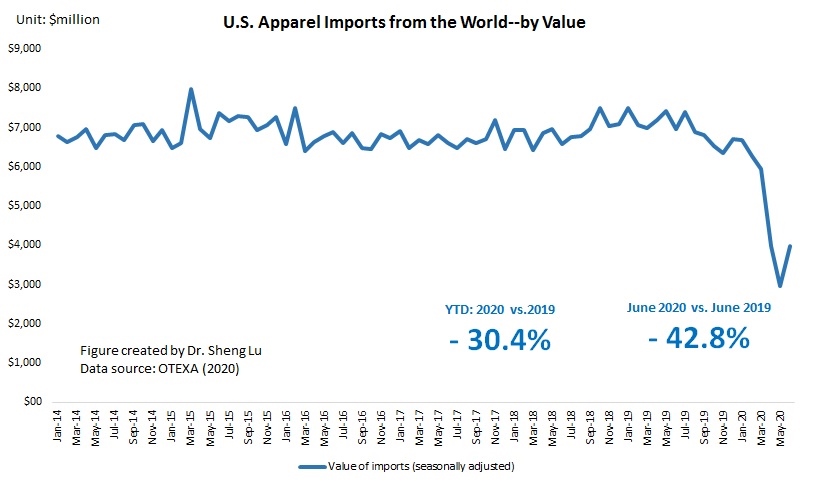
The latest statistics from the Office of Textiles and Apparel (OTEXA) show that while the negative impacts of COVID-19 on U.S. apparel imports continued in June 2020, there appeared to be early signs of economic recovery. Specifically:
While the value of U.S. apparel imports decreased by 42.8% in June 2020 from a year ago, the speed of the decline has slowed (was down 60% year over year in May 2020). Nevertheless, between January and June 2020, the value of U.S. apparel imports decreased by 30.4% year over year, which has been much worse than the performance during the 2008-2009 global financial crisis (down 11.8%).
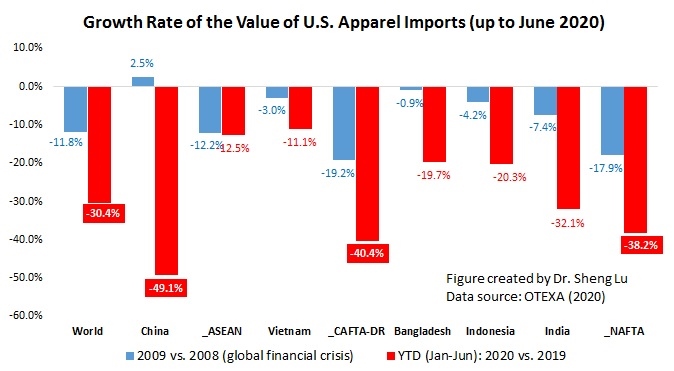
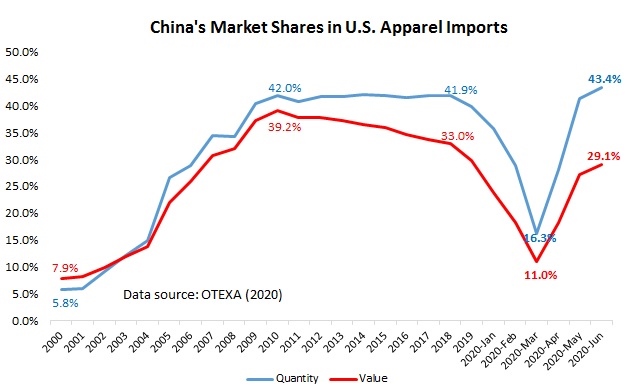
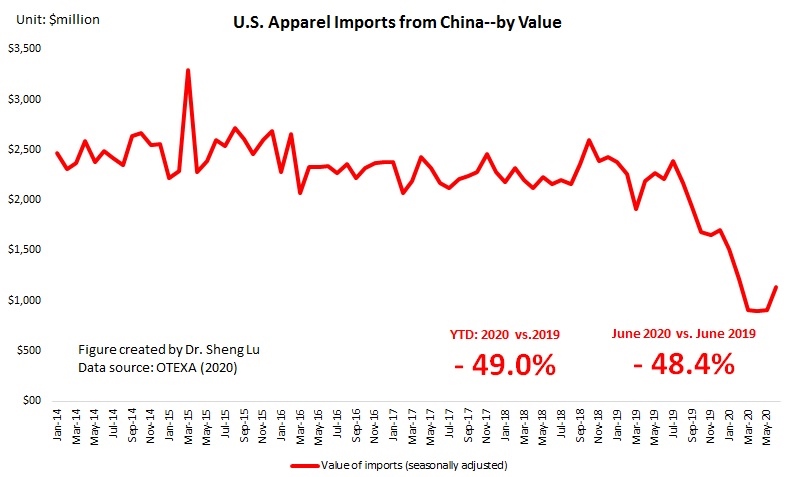
The latest trade statistics support the view that U.S. fashion companies continue to treat China as an essential apparel-sourcing base, despite COVID-19, the trade war, and companies’ sourcing diversification strategy. As the first country hit by COVID-19, China’s apparel exports to the U.S. dropped by as much as 49.0% from January to June 2020 year over year. In February 2020, China’s market shares slipped to only 11%, and both in March and April 2020, U.S. fashion companies imported more apparel from Vietnam than from China. However, China’s apparel exports to the U.S. are experiencing a “V-shape” recovery: as of June 2020, China had quickly regained its position as the top apparel supplier to the U.S., with a 29.1% market share in value and 43.4% share in quantity.
Moreover, U.S. apparel imports from China are also becoming more price-competitive—the unit price slipped from $2.25/Square meters equivalent (SME) in 2019 to $1.88/SME in 2020 (January to June), or down more than 16% (compared with a 4.6% price drop of the world average). As of June 2020, the unit price of U.S. apparel import from China was only 65% of the world average, and around 25—35 percent lower than those imported from other Asian countries. On the other hand, the official Chinese statistics report a 19.4% drop in China’s apparel exports to the world in the first half of 2020.
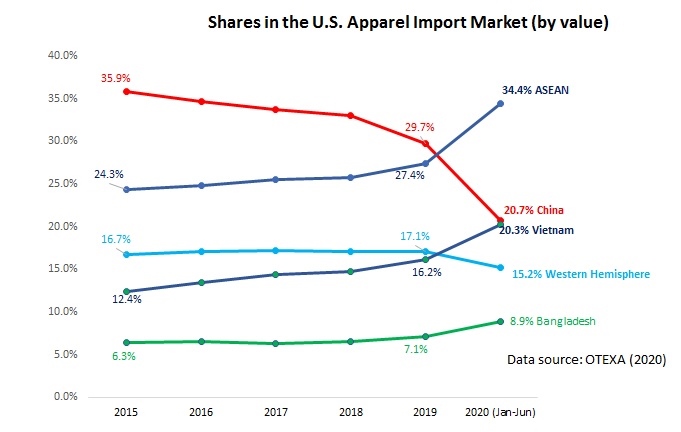
Despite Covid-19, Asia as a whole remains the single largest source of apparel for the U.S. market. Other than China, Vietnam (20.3% YTD in 2020 vs. 16.2% in 2019), ASEAN (34.4% YTD in 2020 and vs. 27.4% in 2019), Bangladesh (8.9% YTD in 2020 vs.7.1% in 2019), and Cambodia (4.5% YTD in 2020 vs. 3.2% in 2019) all gain additional market shares in 2020 from a year ago.
However, still, no clear evidence suggests that U.S. fashion brands and retailers have been giving more apparel sourcing orders to suppliers from the Western Hemisphere because of COVID-19 and the trade war. In the first six months of 2020, only 8.8% of U.S. apparel imports came from CAFTA-DR members (down from 10.3% in 2019) and 4.2% from NAFTA members (down from 4.5% in 2019).
Notably, U.S. fashion companies source products from Asia (including China) and the Western Hemisphere for different purposes. In general, US companies tend to source either price-sensitive or more sophisticated items from Asia, where factories overall have higher productivity and more advanced production techniques. Meanwhile, the Western Hemisphere is typically used to source products that require faster speed-to-market or more frequent replenishments during the selling season. Some studies further show that there is more divergence in the products imported into the United States from Asian countries and the Western Hemisphere from 2015 to 2019. In contrast, over the same period, China, ASEAN, and Bangladesh appear to be exporting increasingly similar products to the United States.
That being said, as USMCA enters into force on July 1, 2020, a more stable trading environment could encourage more U.S. apparel sourcing from Mexico down the road (assuming garment factories there can gradually resume production and no further COVID-19 related shutdown).
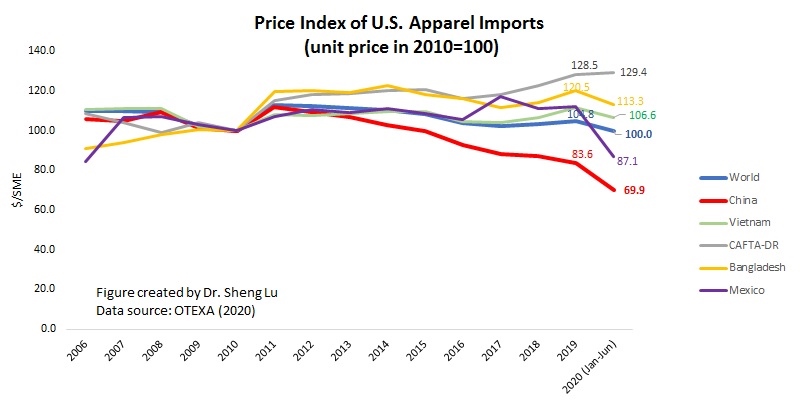
As a reflection of weak demand, the unit price of U.S. apparel imports dropped in the first six months of 2020 (price index =100, meaning the same nominal price as in 2010). The price index was 104.7 in 2019. The imports from Mexico (price index =87.1 YTD in 2020 vs. 112.1 in 2019) and China (price index = 69.9 YTD in 2020 vs. 83.5 in 2019) have seen the most notable price decrease so far.
by Sheng Lu
