Blog Articles

Trade War Looms over New York Fashion Week

Discussion questions:

  • Why does the U.S. textile industry call for additional tariffs on textile and apparel imports from China whereas U.S. fashion brands and apparel retailers oppose the tariffs?
  • Based on the trade theories we have learned so far, why or why not would you recommend President Trump to impose 25% punitive tariffs on imports from China?

Appendix: Comments on the Proposed Section 301 Tariffs on Imports from China (August 2018)

For the complete timeline of the U.S. Section 301 tariff action against China, please click HERE

Textile and Apparel “Made in the World”

NCTO-textile-final

garment_industry_inline_02

NorthCarolina4

$_3

m_58a7bf17680278972302d0a2

presentation1

While shopping in SoHo (NYC), Nicole Farese, a student from FASH455, found the label of a Splendid sweater reads “Made of Italian Yarn” and “Made in China”. Splendid is a casual wear store which is known for their high-quality clothing sold at a premium price.

Exercise: Check your wardrobe and can you find any clothing that is also made through a “global supply chain?” Please feel free to submit your picture with a brief description of your item to shenglu@udel.edu.

BIS Released Assessment Report of the U.S. Textile and Apparel Manufacturing Sector

bis

The Bureau of Industry and Security (BIS) under the U.S. Department of Commerce recently released its assessment report of the U.S. textile and apparel (T&A) manufacturing sector. The report was based on a survey of 571 U.S. T&A manufacturers in summer 2017. These respondents include 230 textile mills (NAICS 313), 128 textile product mills (NAICS 314), and 213 apparel manufacturers (NAICS 315).

Below are the key findings of the study:

The state of the U.S. textile and apparel (T&A) manufacturing sector

  • U.S. T&A manufacturing has shrunk significantly: the value of T&A shipments (seasonally adjusted) in 2016 ($68 billion) was almost 56% decrease in real terms since 1995 ($153 billion).
  • U.S. T&A manufacturing has undergone substantial structural change: textiles and textile products accounted for 82% of the total shipments of the U.S. T&A industry as of 2016, compared to 57% in 1995. Notably, only 18% of shipments came from apparel manufacturing in 2016, compared to 43% in 1995.
  • U.S. T&A manufacturing sector is hiring less: Between 1990 and 2016, total employment decreased by 79%, from 1.7 million to 352,000 workers; over the same period, over 86% of apparel manufacturing jobs disappeared.
  • U.S. T&A manufacturers are making more capital investments: The overall total Capital Expenditures (CAPEX) of the 571 respondents increased 90 percent from 2012 to 2016 (from $1.6 billion to $3.1 billion). Particularly, the CAPEX of textile mills grew by 80 percent over that period—mostly on “Machinery, Equipment, and Vehicles.”
  • North Carolina hosted the largest number of U.S. T&A facilities (22 percent of the respondents), followed by Georgia (10 percent), and South Carolina (9 percent).
  • China, Mexico, and Canada are the most popular destinations for foreign investments by U.S. T&A manufacturers.

Competition landscape and factors

  • Respondents listed a total of 1,309 U.S. competitors and 552 non-U.S. competitors. Chinese companies were cited as the number one source of foreign competition.
  • “Quality,” “Lead Time,” and “Innovation” were the top three competitive advantages of U.S. T&A manufacturers as they related to foreign competition. “Labor Costs” was regarded as the top disadvantage of U.S. T&A manufacturing.
  • 43 percent of respondents believed that reshoring was occurring in U.S. T&A manufacturing. Almost all of these respondents believed that “Shorter Lead Times” and the “Marketability of the ‘Made in USA’ Label” were the factors driving the trend.
  • The Affordable Care Act (ACA), Minimum Wage regulations (Federal, State, and Local), and U.S. Trade Policy were the top governmental regulations and provisions cited as negatively impacting the competitiveness of U.S. T&A manufacturers.
  • 61 percent of respondents reported that they had difficulties hiring and/or retaining employees for their T&A operations, specifically production line workers such as operators and machine technicians. The skill gaps in the labor market for those positions were by far the biggest ones identified for the industry.
  • 43 percent of respondents believed that reshoring was occurring in T&A manufacturing (i.e., the practice of transferring a business operation that was moved to a non-U.S. location back to the United States.) Textile manufacturers were more likely to be aware of reshoring.

Trade and U.S. textile and apparel manufacturing

  • On average, respondents say 48 percent of their textile and textile products are “100 percent made in the U.S.”, while for apparel it was around 54 percent.
  • U.S. T&A exports dropped 10 percent between 2012 and 2016, from $2.2 billion to $1.98 billion. On average, exports accounted for only 12 percent of respondents’ total sales.
  • 33 percent of respondents considered themselves to be dependent on foreign sources for supplies, which was highest among textile mills.
  • 37 percent of respondents reported that they considered themselves to be dependent on non-U.S. sourcing for their machinery or equipment.

Berry Amendment and U.S. textile and apparel manufacturing

  • For textile mills, an average of 12 percent of U.S. output was Berry Amendment-related; for textile product mills the average was 21 percent, and for apparel production, it averaged 26 percent. 67 percent of respondents believed that the Berry Amendment had a positive impact on their organization’s business.

U.S. and Mexico Reached a Deal to Replace NAFTA

us-mexico-trade-agreement

The Office of U.S. Trade Representative (USTR) announced that the United States and Mexico have “reached a preliminary agreement in principle” to update the 24-year old North American Free Trade Agreement (NAFTA). According to USTR, compared with the existing NAFTA, the new deal will

  • strengthen the labor and environmental protection provisions
  • provide stronger and more effective protection and enforcement of intellectual property right protection
  • reduce various non-tariff barriers facing U.S. agriculture exports
  • include new rules of origin and origin procedures for autos (including requiring 75 percent of auto content be made in the United States and Mexico AND 40-45 percent of auto content be made by workers earning at least $16 per hour.)
  • include new chapters dealing with digital trade and textiles
  • include a 16-year “sunset period” with a review every six years, at which time the parties can renew the deal for another 16 years.

Specifically for the textile and apparel sector, USTR said that “The new provisions on textiles incentivize greater United States and Mexican production in textiles and apparel trade, strengthen customs enforcement, and facilitate broader consultation and cooperation among the Parties on issues related to textiles and apparel trade.” More specifically, the new textile chapter in renegotiated NAFTA will:

1) Promote greater use of Made-in-the-USA fibers, yarns, and fabrics by limiting rules that allow for some use of non-NAFTA inputs in textile and apparel trade; and requiring that sewing thread, pocketing fabric, narrow elastic bands, and coated fabric, when incorporated in apparel and other finished products, be made in the region for those finished products to qualify for trade benefits. “

2) Include textile-specific verification and customs cooperation provisions that provide new tools for strengthening customs enforcement and preventing fraud and circumvention.

Based on USTR’s statement, it is likely, although not confirmed, that the US-Mexico deal will allow more limited tariff preference level (TPL) than the existing NAFTA.

USTR’s statement also said that the new deal would be subject to “finalization and implementation,” and its relationship with NAFTA remain unclear. The statement did not mention anything about Canada, another NAFTA member, either. Interesting enough, when announcing the US-Mexico deal in front of the press, President Trump said I will terminate the existing deal (NAFTA).  When that happens, I can’t quite tell you; it depends on what the timetable is with Congress.  But I’ll be terminating the existing deal and going into this deal.  We’ll start negotiating with Canada relatively soon.”

In a statement released on the same day, the American Apparel and Footwear Association (AAFA) said it welcomed the conclusion of bilateral talks with Mexico on NAFTA and emphasized the need for Canada to be a part of any final agreement: “The conclusion of talks between the U.S. and Mexico is a positive step in the NAFTA negotiations, however, it is essential that the updated agreement remain trilateral. At the same time, we encourage the administration to share the details of the agreement so the business community can inspect the impact on North American supply chains and share feedback with the administration and Congress…Any update to the agreement must continue to support these American jobs, promote trade linkages, and be seamlessly implemented to be considered a success. It is with this in mind that we are deeply concerned to hear any mention of withdrawal or termination of the existing agreement at this late stage.”

According to Inside U.S. Trade, the National Council of Textile Organizations (NCTO) which represents the U.S. textile industry says it is “encouraged by the information released by USTR with respect to strengthening the rules of origin for textiles and apparel in the announced agreement with Mexico. U.S. talks with Canada are still ongoing, however, and NCTO will wait to review the text of any final agreement before issuing a more detailed statement on the negotiation outcome.”

WTO Reports World Textile and Apparel Trade in 2017

Statistical review of world textile and apparel trade in 2018 is now available

Figure 1Figure 2

According to the newly released World Trade Statistical Review 2018 by the World Trade Organization (WTO), the current dollar value of world textiles (SITC 65) and apparel (SITC 84) exports totaled $296.1bn and $454.5bn respectively in 2017, increased by 4.2% and 2.8% from a year earlier. This is the first time since 2015 that the value of world textile and apparel exports enjoyed a growth.

Textiles and apparel are not alone. Driven by rising demand for imports globally, the current dollar value of world merchandise exports also grew by 4.7% in 2017–its most robust growth in six years, to reach $17.43 trillion. Particularly, the ratio of trade growth to GDP growth finally returned to its historic average of 1.5, compared to the much lower 1.0 ratio recorded in the years following the 2008 financial crisis.

China, European Union (EU28), and India remained the world’s top three exporters of textiles in 2017. Altogether, these top three accounted for 66.3% of world textile exports in 2017, up from 65.9% in 2016. All the top three also enjoyed a faster-than-average export growth in 2017, including 5.0% of China, 5.8% of EU(28) and 5.9% of India. The United States remained the world’s fourth top textile exporter in 2017, accounting for 4.6 percent of the shares, the same as a year earlier.

Regarding apparel, China, the European Union (EU28), Bangladesh and Vietnam unshakably remained the world’s top four largest exporters in 2017. Altogether, these top four accounted for as much as 75.8% of world market shares in 2017, which was higher than 74.3% a year earlier and a substantial increase from 68.3% back in 2007.

Continuing with the emerging trend in recent years, China is exporting less apparel and more textiles to the world. Notably, China’s market shares in world apparel exports fell from its peak—38.8% in 2014 to a record low of 34.9% in 2017. Meanwhile, China accounted for 37.1% of world textile exports in 2017, which was a new record high. It is important to recognize that China is playing an increasingly critical role as a textile supplier for many apparel-exporting countries in Asia. Measured by value, 47% of Bangladesh’s textile imports came from China in 2017, up from 39% in 2005. We observe similar trends in Cambodia (up from 30% to 65 %), Vietnam (up from 23 % to 50 %), Pakistan (up from 32 % to 71 %), Malaysia (up from 25 % to 54 %), Indonesia (up from 28 % to 46 %), Philippines (up from 19 % to 41 %) and Sri Lanka (up from 15 % to 39 %) over the same period.

Figure 3

Figure 4

Additional readings: 
Lu, S. (2018). Changing trends in world textile and apparel trade. Just-Style.
Lu, S. (2018). How regional supply chains are shaping world textile and apparel trade. Just-Style.

2018 U.S. Fashion Industry Benchmarking Study Released

The 2019 U.S. Fashion Industry Benchmarking Study is now availablecover

The report can be downloaded from HERE

Key findings of this year’s study:

Business challenges facing U.S. fashion companies: Protectionism is the top challenge for the U.S. fashion industry in 2018. More companies worry about increases in production or sourcing cost, too. For the second year in a row, “protectionist trade policy agenda in the United States” ranks the top challenge for U.S. fashion companies in 2018.

Industry outlook: Despite concerns about trade policy and cost, executives are more confident about the five-year outlook for the U.S. fashion industry in 2018 than they were a year ago, although confidence has not fully recovered to the level seen in 2015 and 2016. In addition, 100 percent of respondents say they plan to hire more employees in the next five years, compared with 80-85 percent in previous studies; market analysts, data scientists, sustainability/compliance related specialists or managers, and supply chain specialists are expected to be the most in-demand.

U.S. fashion companies’ sourcing strategy: When it comes to sourcing, diversification is key for many companies.

  • Most respondents continue to maintain a diverse sourcing base, with 60.7 percent currently sourcing from 10+ different countries or regions, up from 57.6 percent in 2017.
  • Larger companies, in general, continue to be more diversified than smaller companies.
  • Reflecting the U.S. fashion industry’s growing global reach, respondents report sourcing from as many as 51 countries or regions in 2018, the same as in 2017. Asia as a whole continues to take the lead as the dominant sourcing region. Meanwhile, with the growing importance of speed-to-market and flexibility, the Western Hemisphere is becoming an indispensable sourcing base.
  • Keeping a relatively diverse sourcing base will remain a key element of U.S. fashion companies’ sourcing strategy. Nearly 80 percent of respondents plan to source from the same number of countries, or more countries, in the next two years. However, respondents are equally divided on whether to increase or decrease the number of suppliers they will work with.
  • China plus Vietnam plus Many” has become an ever more popular sourcing model among respondents. And this model is evolving as companies further diversify their China production. In particular, China now typically accounts for only 11-30 percent of companies’ total sourcing value or volume, compared with 30-50 percent in the past.
  • Although China’s position as the top sourcing destination is unshakable, companies are actively seeking alternatives to “Made in China.” This does not seem to be due to concerns about cost, but rather the worries about the escalating U.S.-China trade tensions.
  • Benefiting from the diversification away from China, Vietnam and Bangladesh are expected to play a bigger role as apparel suppliers for the U.S. market in the near future.

Rules of origin and the utilization of trade agreements for sourcing: Rules of origin, and exceptions to the rules of origin, significantly impact whether companies use free trade agreements (FTAs) and trade preference programs for sourcing.

  • While FTAs and trade preference programs remain largely underutilized by U.S. fashion companies, more companies are using NAFTA (65 percent), CAFTA-DR (58 percent) and AGOA (50 percent) than in the past two years.
  • Still, it’s concerning that companies often do not claim the duty-free benefits when sourcing from countries with FTAs or preference programs. Companies say this is primarily due to the strict rules of origin.
  • Exceptions to the “yarn-forward” rules of origin, including tariff preference levels (TPLs), commercial availability/short supply lists, and cumulation, are priorities for respondents; 48 percent say they currently use these mechanisms for sourcing. These exceptions provide critical flexibilities that make companies more likely to use FTAs and source from FTA regions.

NAFTA: U.S. fashion companies call for a further reduction of trade barriers and urge trade negotiators to “do no harm” to NAFTA, the most-utilized free trade agreement by respondents.

  • Respondents predominantly support initiatives to eliminate trade barriers of all kinds, from high tariffs to overcomplicated documentation requirements, to restrictive rules of origin in NAFTA and future free trade agreements.
  • More than half of respondents explicitly say NAFTA is important to their business—and they have grave concerns about the uncertain future of the agreement.

Sourcing in sustainable and socially compliant ways: Overall, U.S. fashion companies are making more commitments to sustainability and social responsibility.

  • 85 percent of respondents plan to allocate more resources for sustainability and social compliance in the next two years, in areas including providing training to suppliers and internal employees, adding more employees, and working more closely with third-party certification programs on sustainability and social compliance. However, the availability of operational budget remains the primary hurdle for companies that want to do more.
  • 100 percent of respondents map their supply chains (i.e., keep records of name, location, and function of suppliers), up from 90 percent in 2017. Over 80 percent of respondents track not only Tier 1 suppliers (i.e., factory where the final product is assembled), but also Tier 2 suppliers (i.e., subcontractors or major component suppliers, such as fabrics). However, it’s less common for companies to map Tier 3 (i.e., yarn spinners, finding and trimming suppliers) and Tier 4 suppliers (i.e., raw materials suppliers, such as cattle/pig hides, rubber, cotton, wool, goose down, minerals/metals and chemicals).
  • 100 percent of respondents audit their suppliers for issues including building safety, fire safety, and treatment of workers. The vast majority of respondents (96 percent) currently use third-party certification programs to audit, with both announced and unannounced audits.

The US Fashion Industry Benchmarking Study from 2014 to 2017 can be downloaded from HERE

U.S. Textile and Apparel Industry Responds to Trump’s Tariff Announcement against China

FOREIGN201708211521000183597989940

On June 15, 2018, the Trump Administration announced to impose a 25% punitive tariff on a list of Chinese goods based on the results of its Section 301 investigation, which targeted against China’s unfair trade practices related to the forced transfer of American technology and intellectual property. The additional duty will first apply to 818 lines of products on July 6, 2018, which cover approximately $34 billion worth of imports from China. Office of the U.S. Trade Representative (USTR) said it would issue a final determination on the second set of 284 proposed tariff lines, which cover approximately $16 billion worth of imports from China shortly. The total 1,102 tariff lines targeted by USTR generally focuses on products from industrial sectors that contribute to or benefit from the “Made in China 2025” industrial policy, which include industries such as aerospace, information and communications technology, robotics, industrial machinery, new materials, and automobiles.

In response to the U.S. action, China’s Ministry of Commerce (MOFCOM) quickly announced its proposed countermeasures, including a 25% punitive tariff on approximately $34 billion worth of U.S. soybean, autos, and fruits effective July 6, 2018. China is also ready to impose the punitive tariff on another list of products, which cover approximately $16 billion worth of medical device, chemicals and energy imports from the United States.

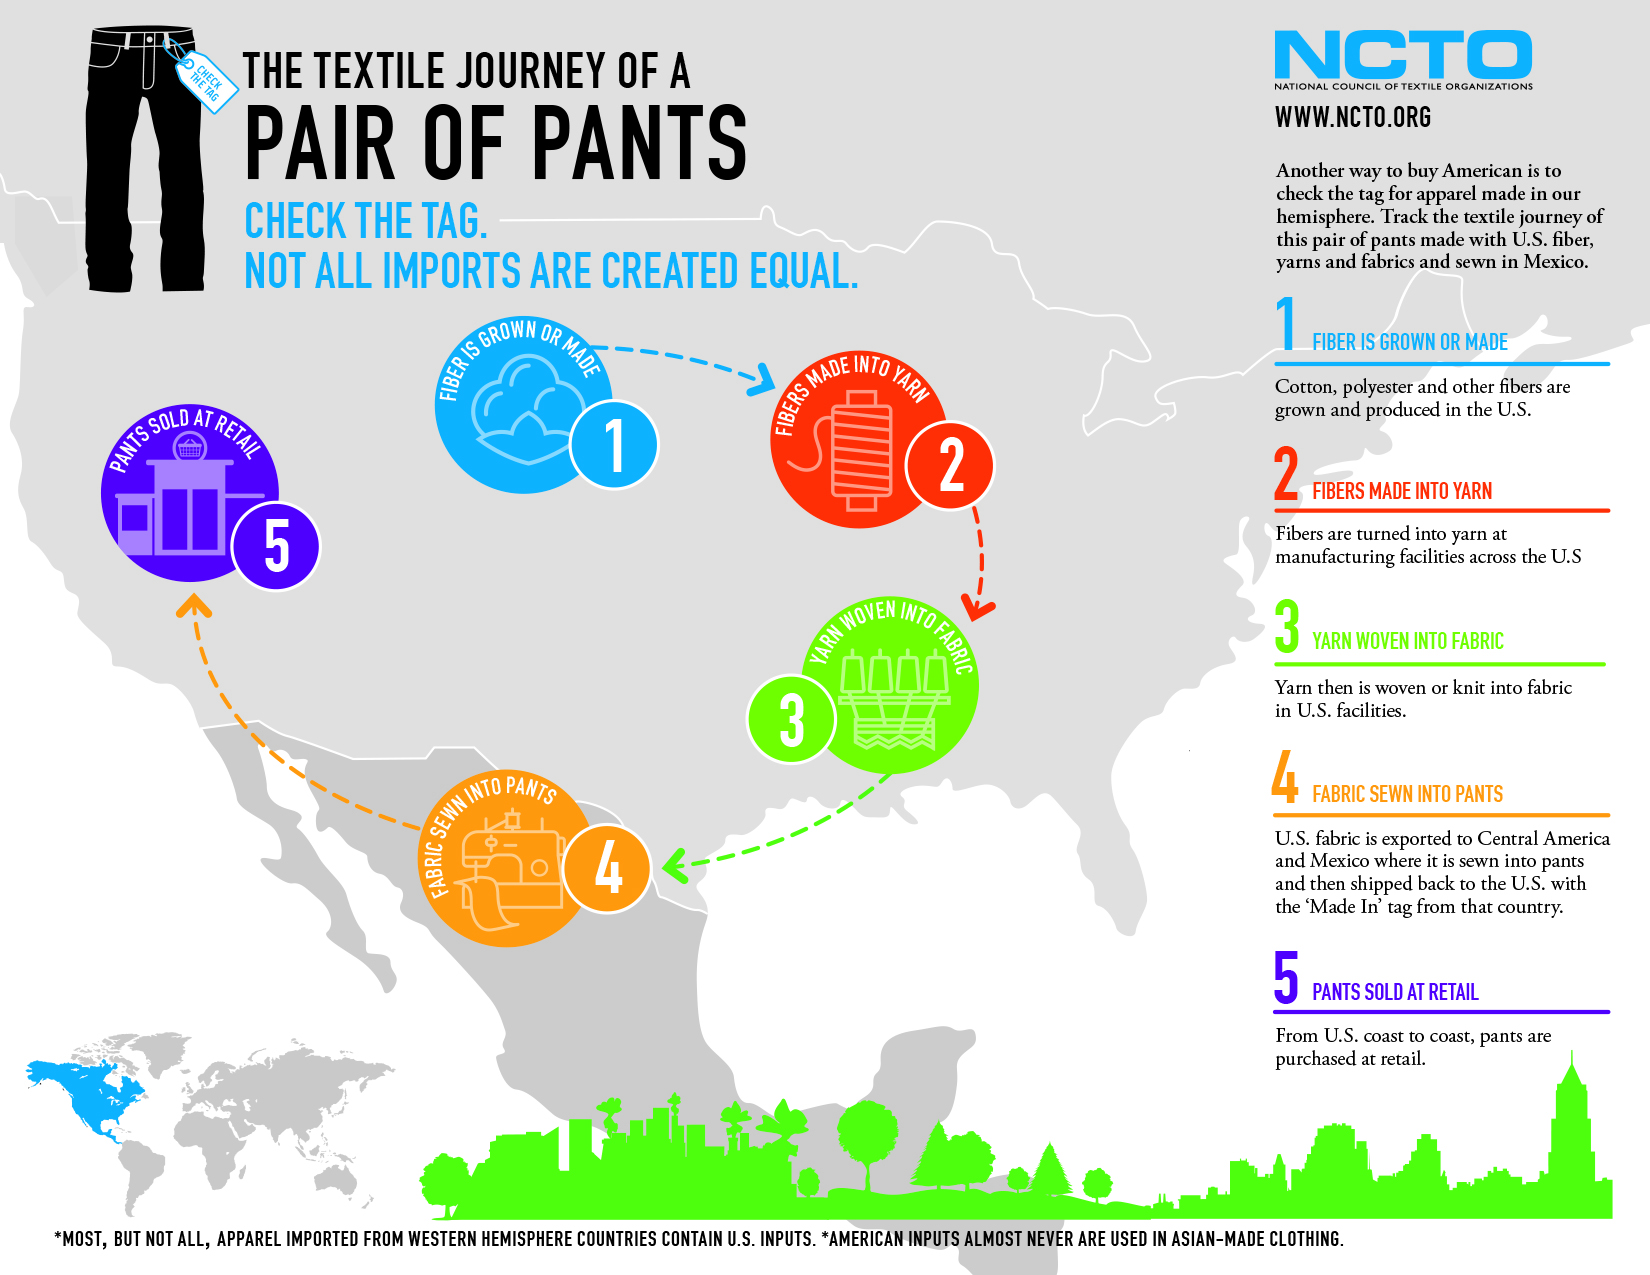
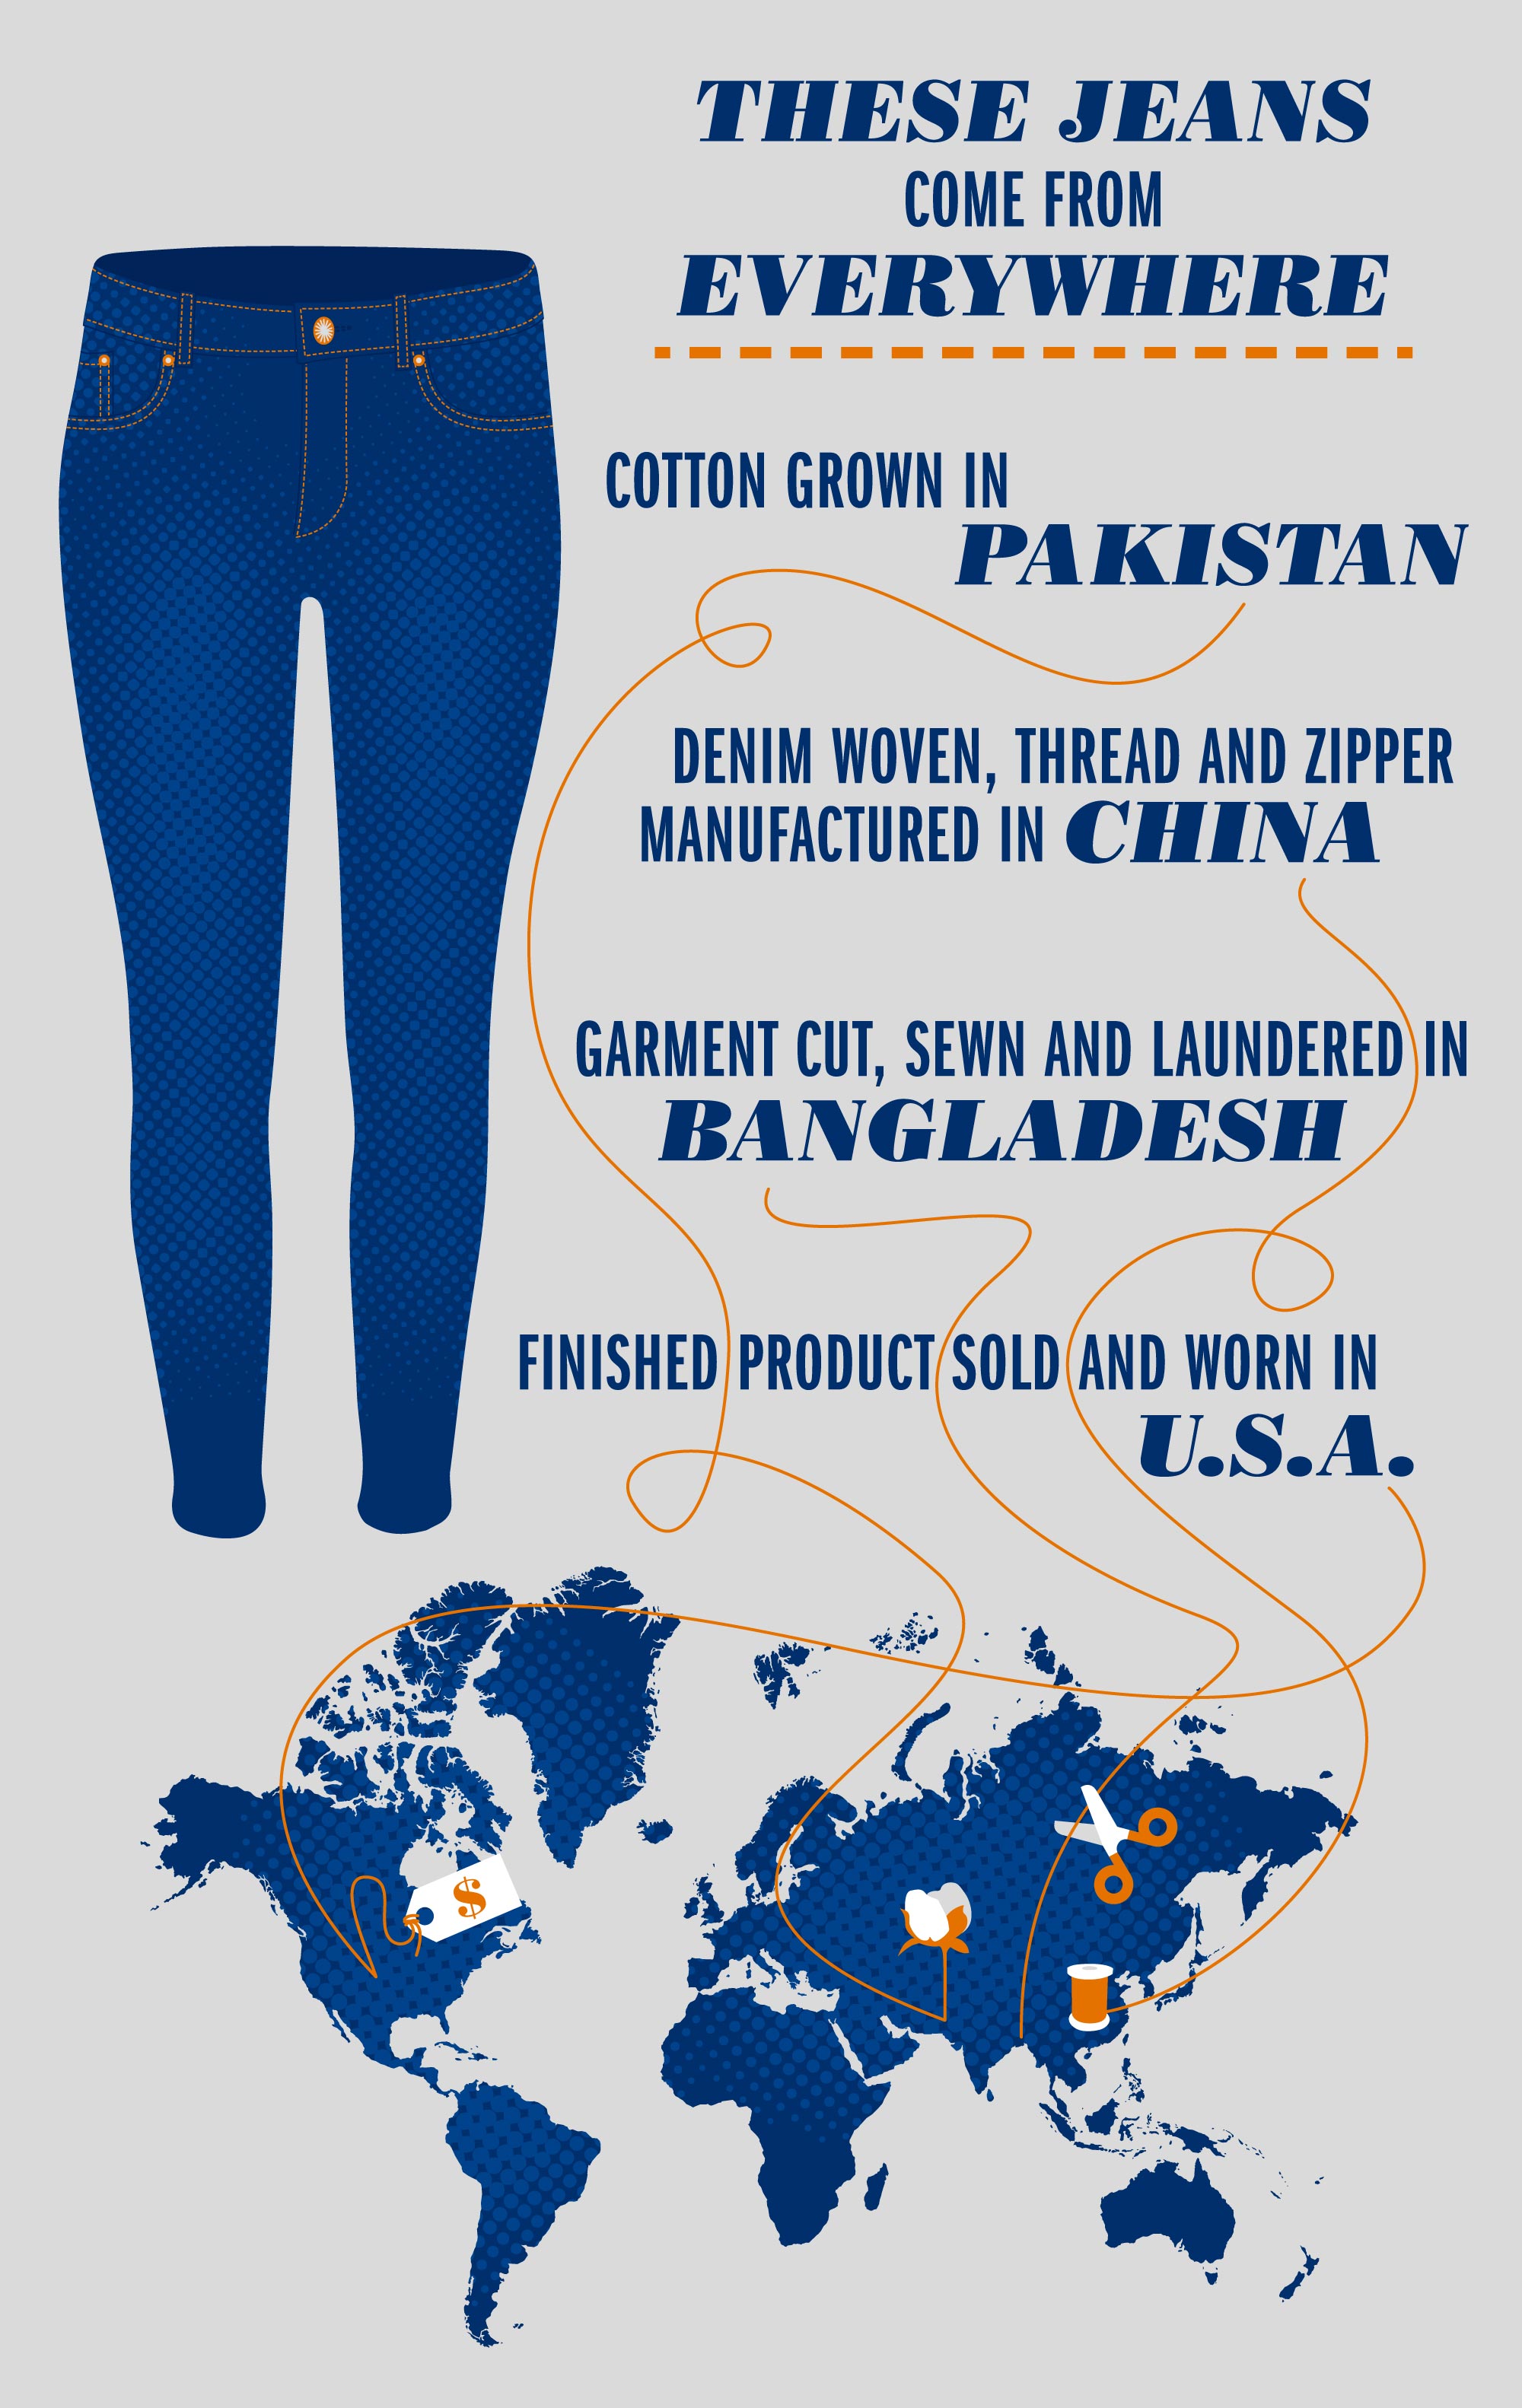
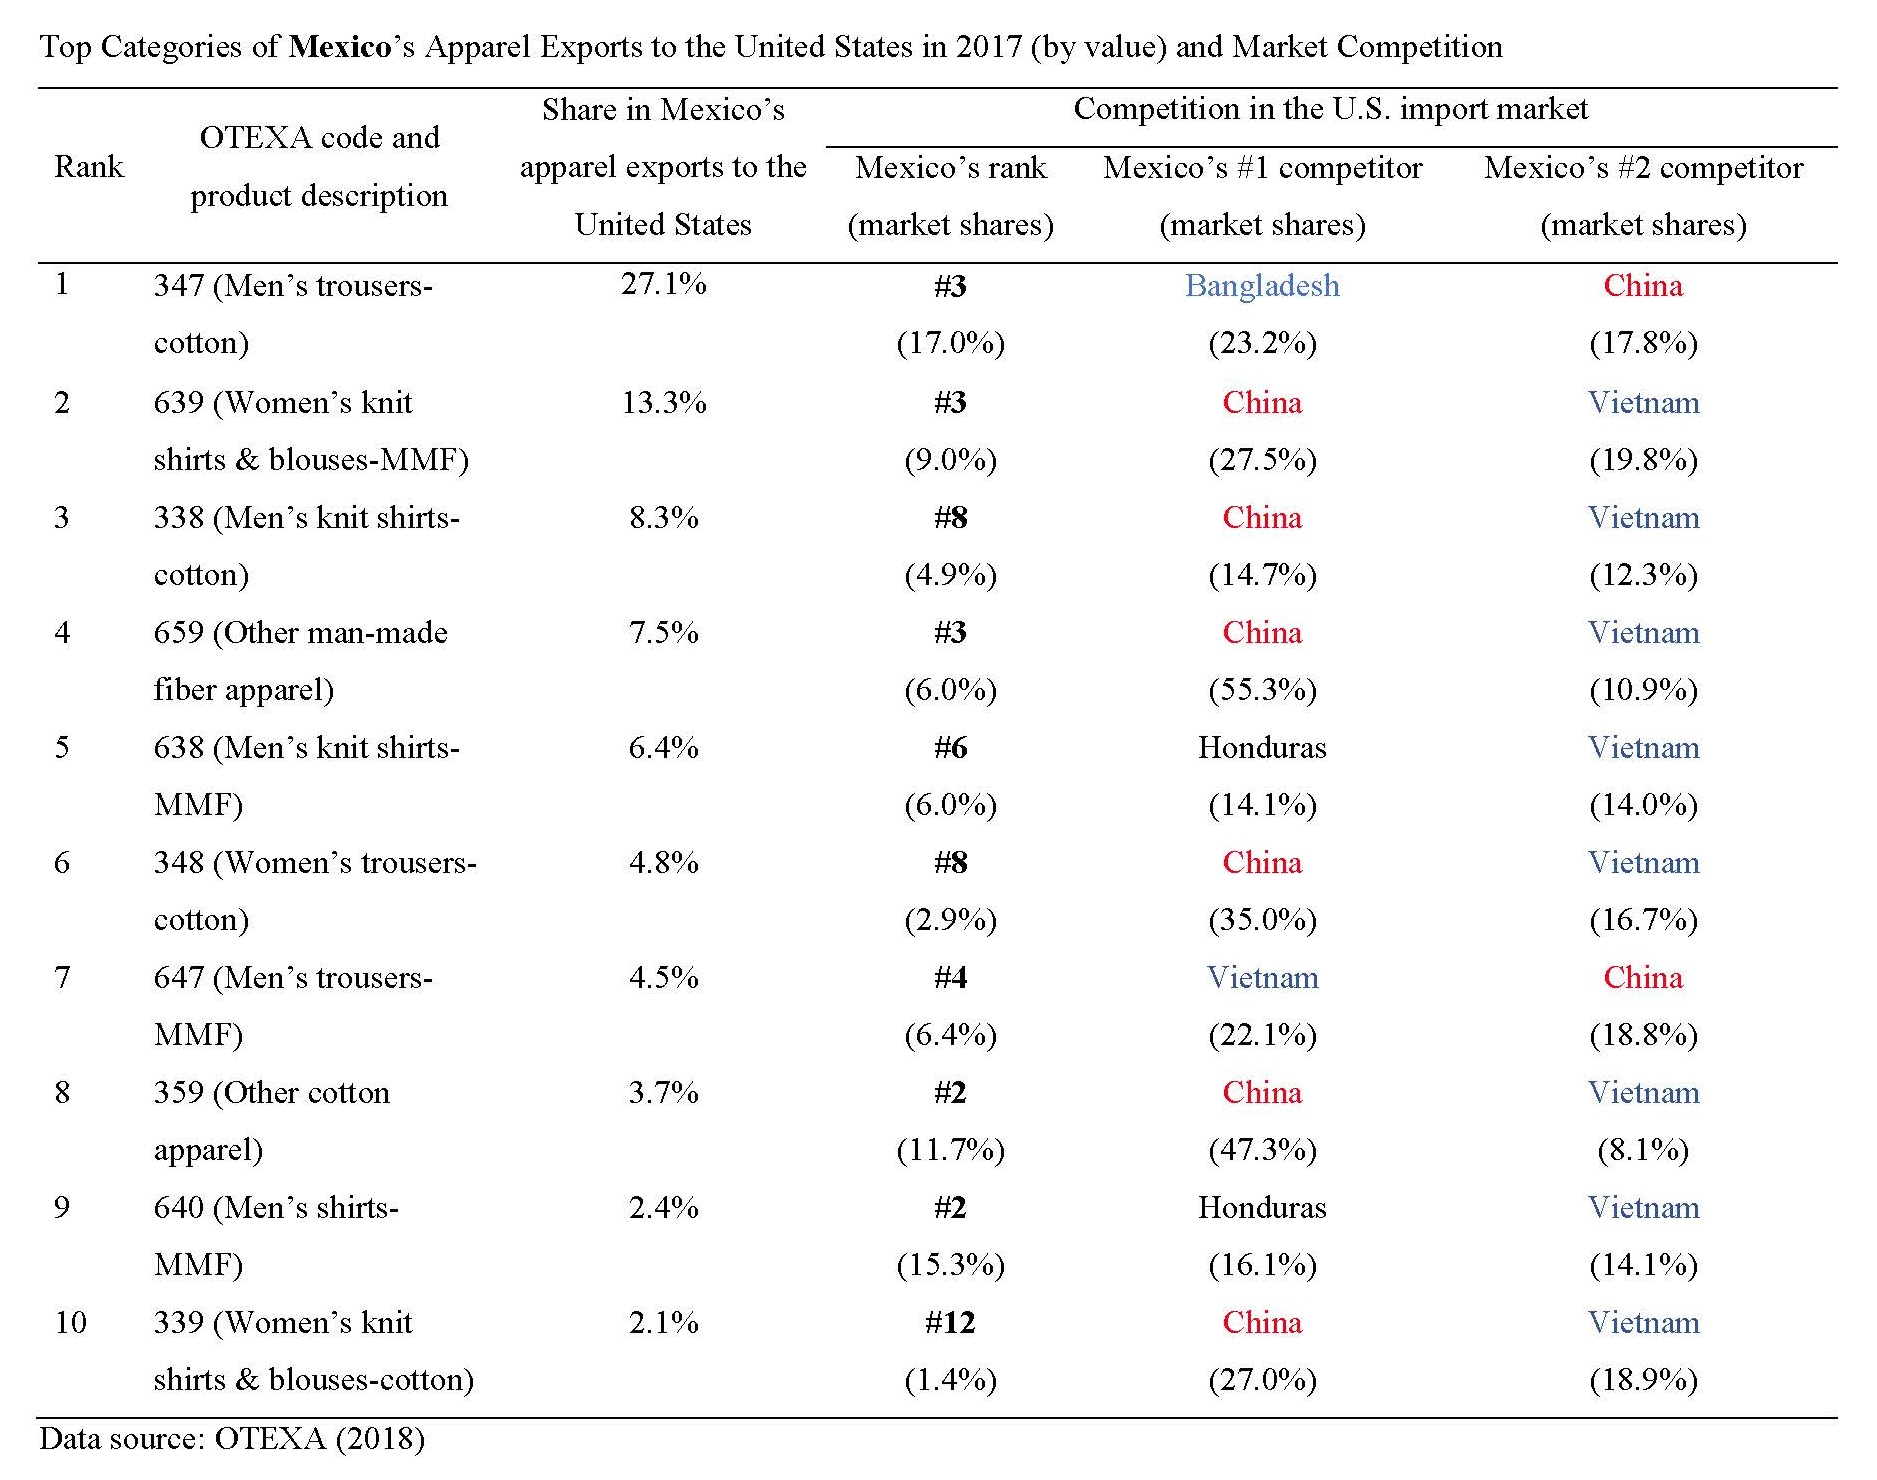
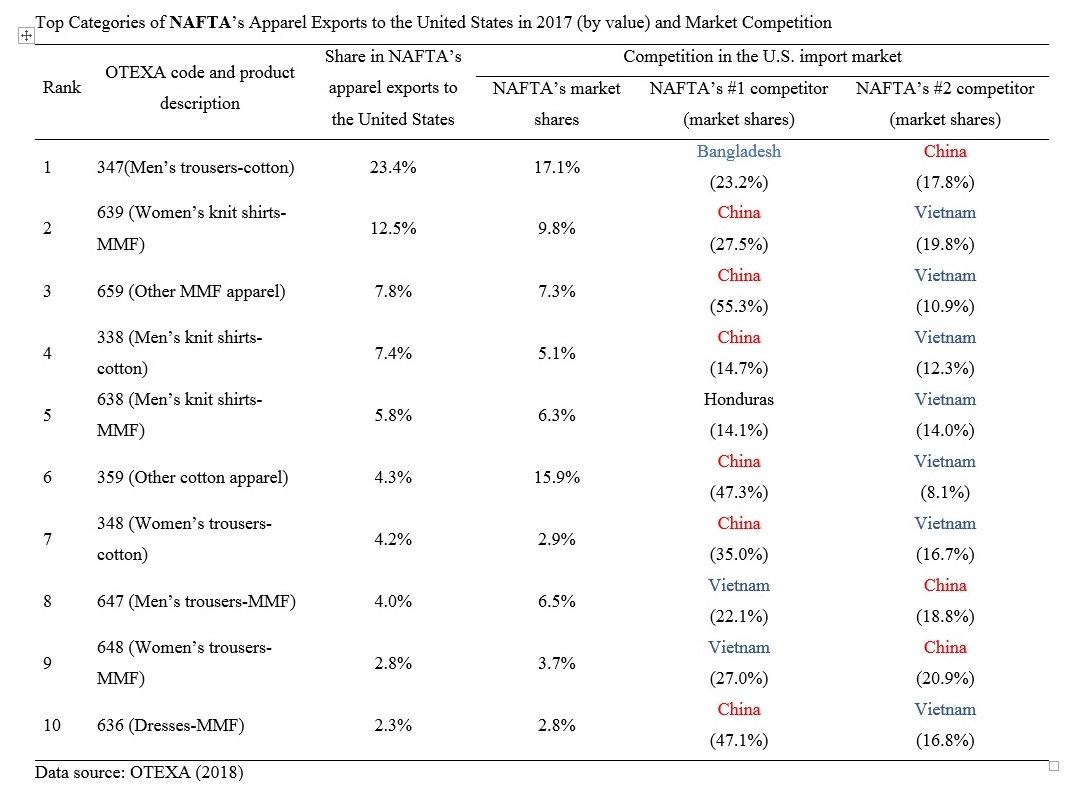
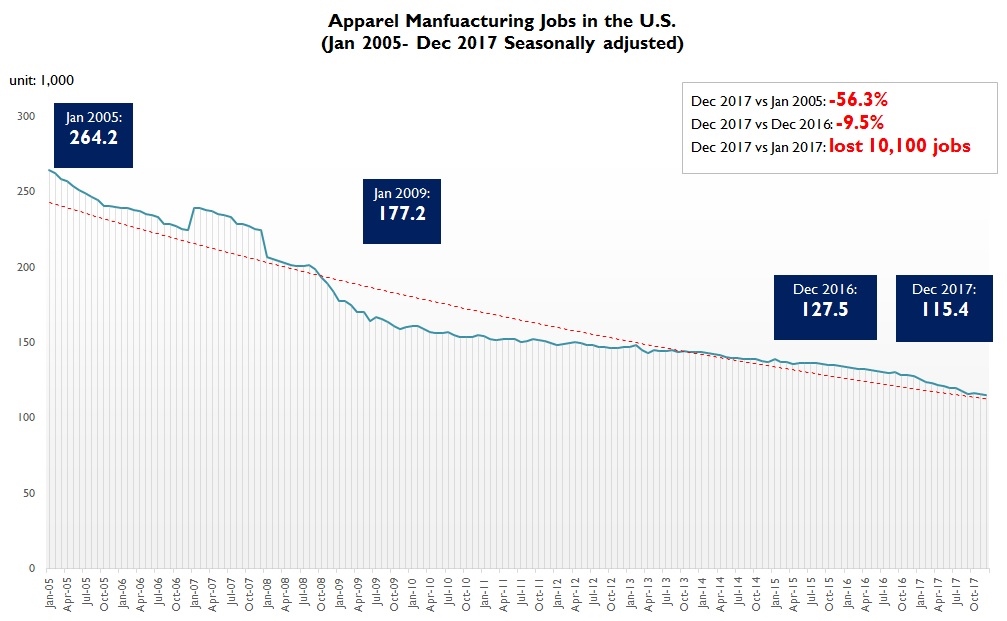
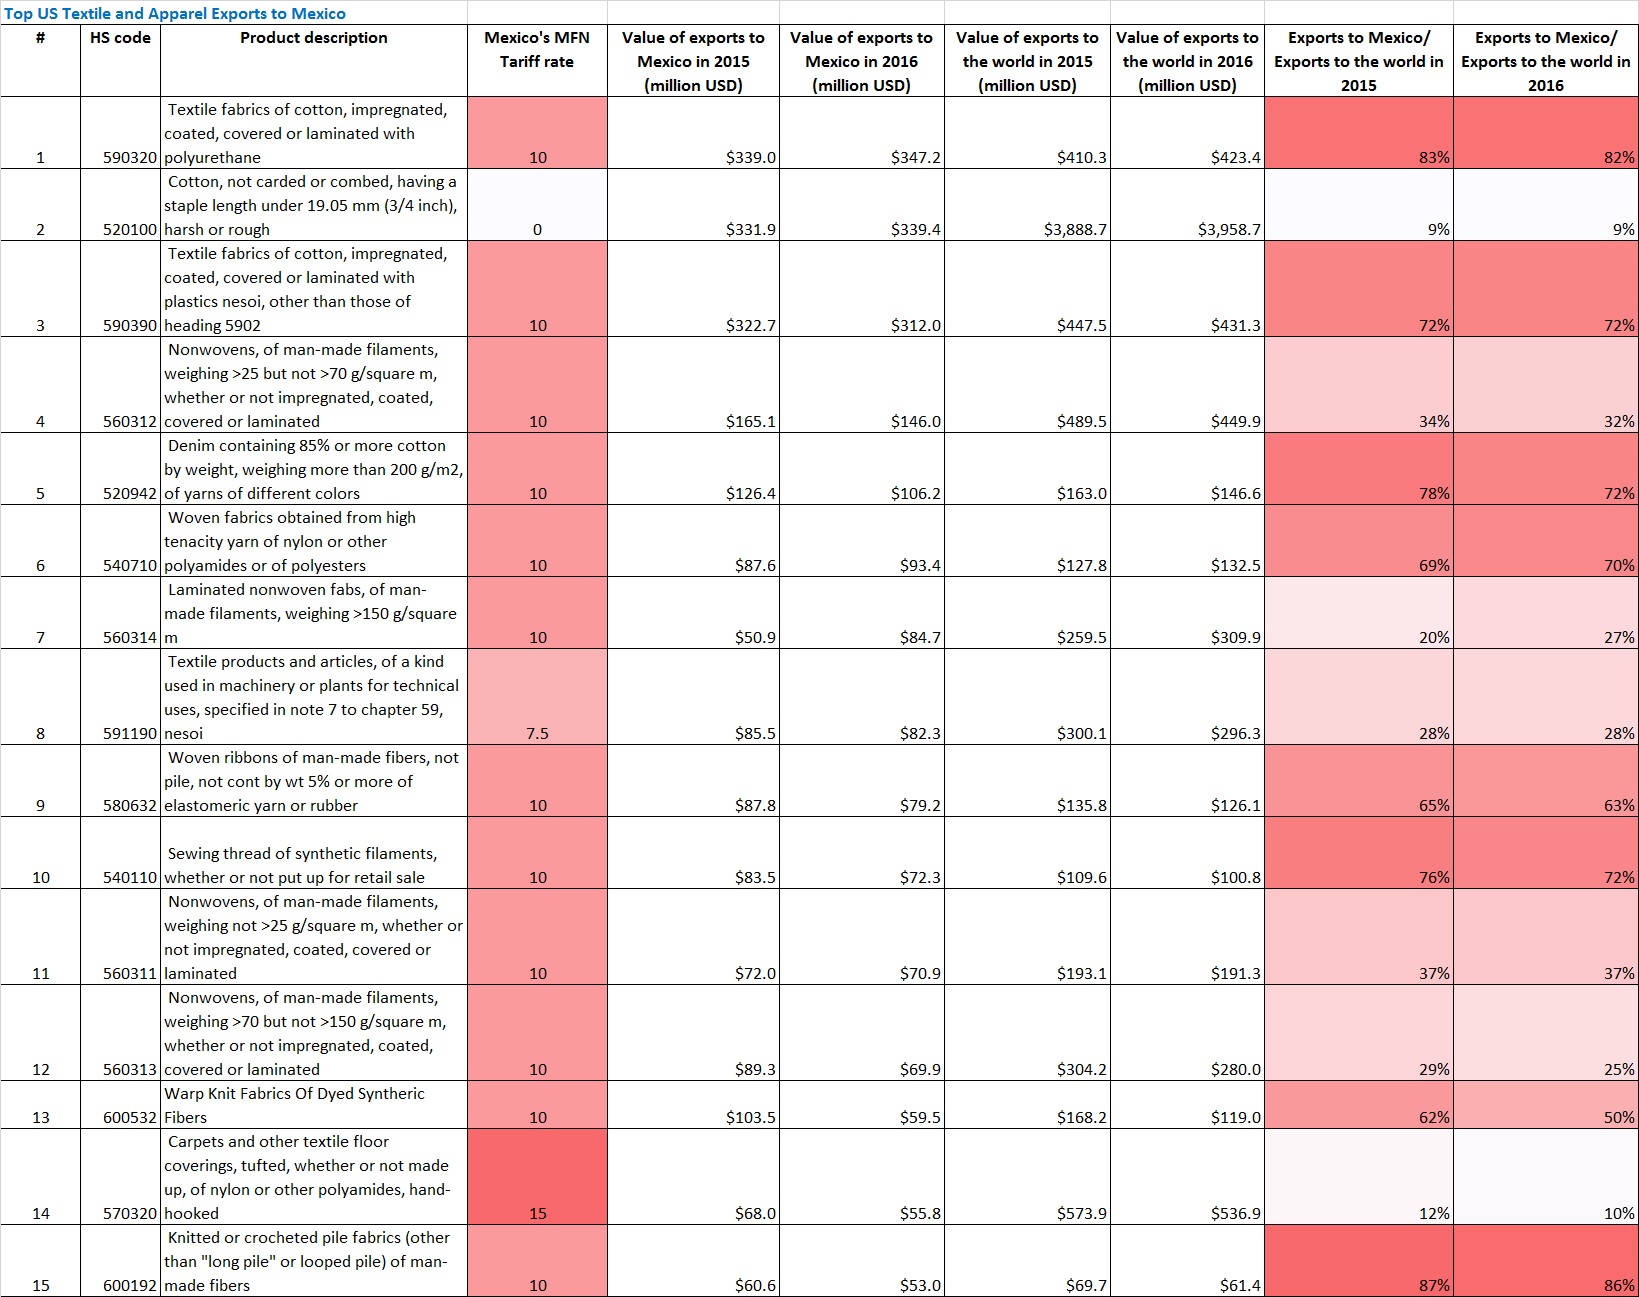
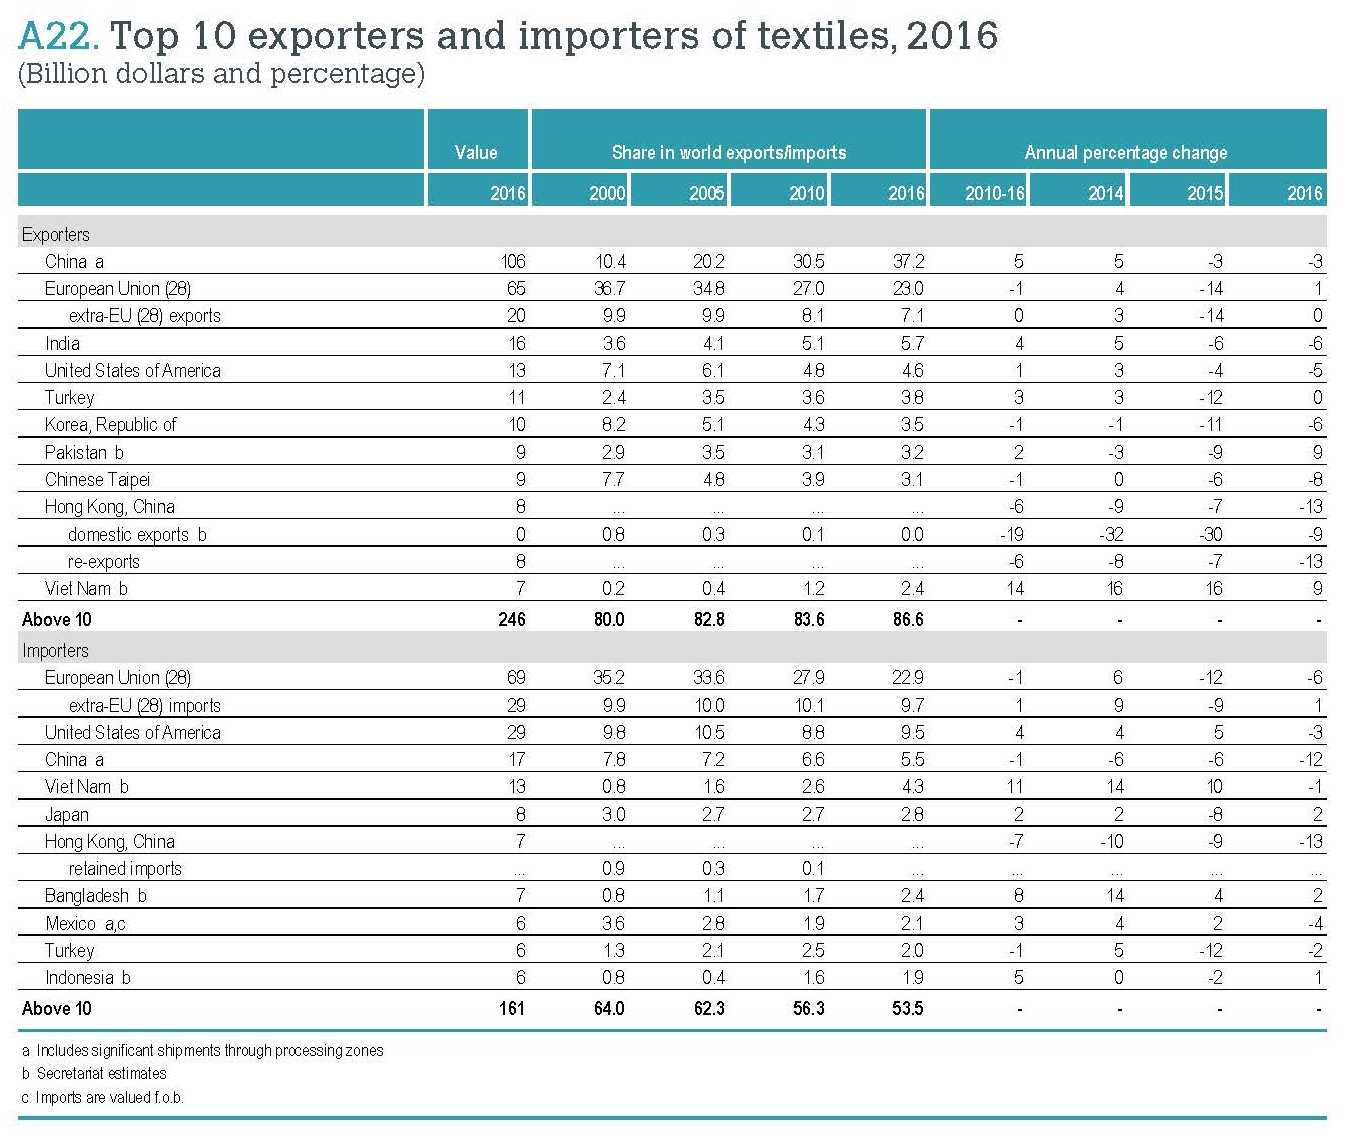
The U.S. textile and apparel industry keeps a close watch on the U.S.-China trade dispute since as much as 36% of U.S. textile and apparel imports come from China. In an announcement released on June 16, 2018, the American Apparel and Footwear Association (AAFA) called a victory that no textile and apparel products are subject to the punitive tariff proposed by USTR. The June 15 USTR list also removes the majority of the textile machinery initially on the retaliation product list back in April 2018. However, U.S. fashion brands and apparel retailers remain deeply concerned about Trump’s tariff action and its potential negative economic impacts on the apparel sector.

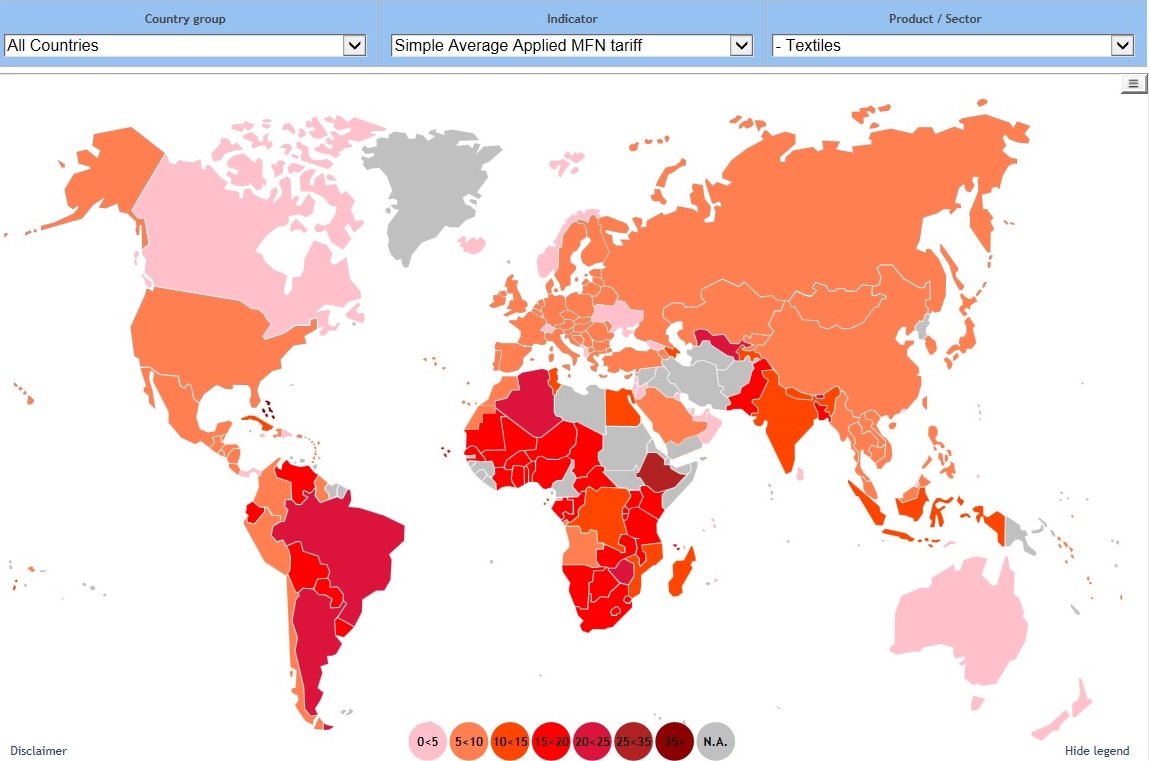
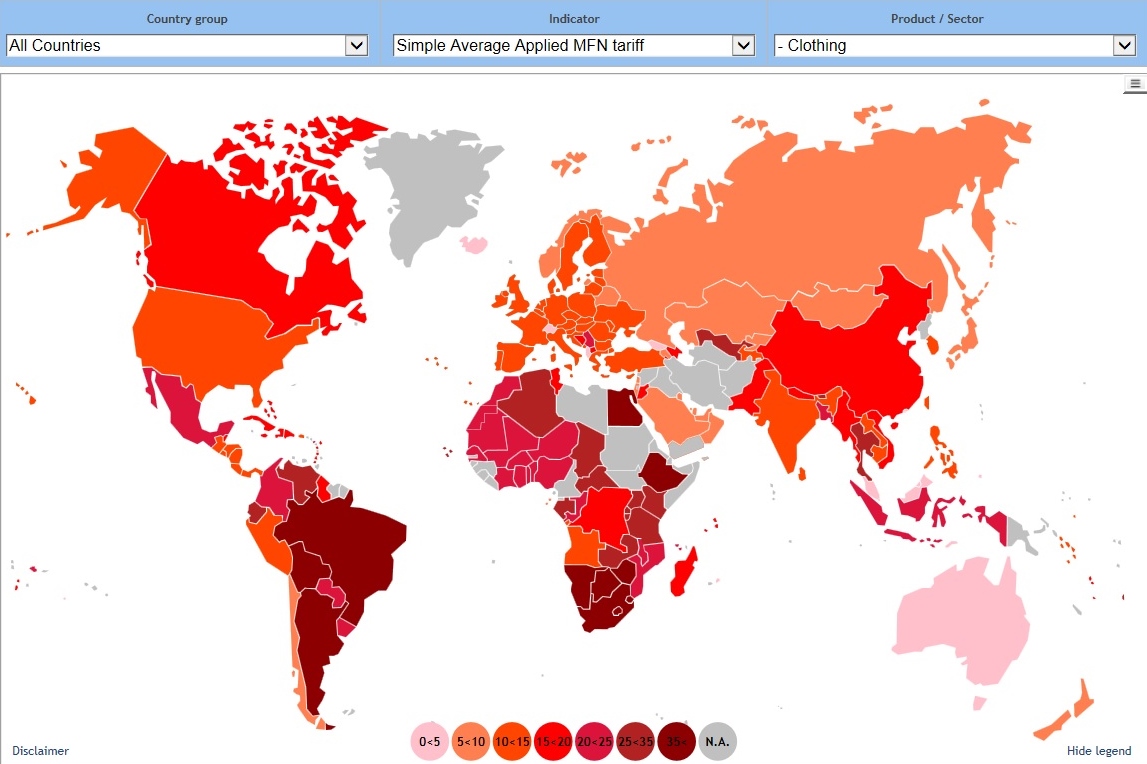
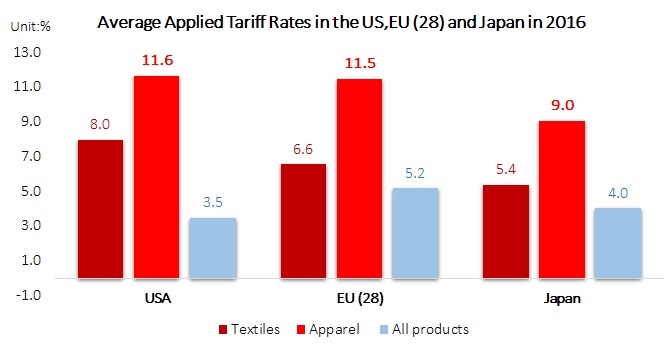
In contrast, the U.S. textile industry, represented by the National Council of Textile Organizations (NCTO) praised the Trump administration’s tariff announcement. NCTO also called on the Trump administration to include finished textile and apparel products on any future lists of imports from China to be made subject to Section 301 tariffs.  Not surprisingly, NCTO’s proposal is opposed strongly by AAFA and the U.S. Fashion Industry Association, representing U.S. fashion brands and apparel retailers. As argued by USFIA, the U.S. tariff rates on apparel and fashion products are already the highest among manufactured goods, reaching 32 percent for man-made fiber apparel and 67 percent for footwear. Any additional tariff would constitute a huge, regressive tax increase and have a negative impact on the American jobs.

Appendix: Timeline of U.S. Section 301 Investigation against China

June 15, 2018: The Trump Administration announced to impose a 25% punitive tariff on a list of Chinese goods based on the results of its section 301 investigation

June 4, 2018: Secretary of Commerce Wilbur Ross concluded his two-day trade negotiation with China in Beijing. A White House statement said “the meetings focused on reducing the United States’ trade deficit by facilitating the supply of agricultural and energy products to meet China’s growing consumption needs, which will help support growth and employment in the United States. The United States officials conveyed President Donald J. Trump’s clear goal for achieving a fair trading relationship with China.” While the announcement didn’t mention the next round, it says that the delegation will “receive guidance on the path forward.”

May 29, 2018: President Trump suddenly announced that the United States will impose a 25 percent tariff on $50 billion of goods imported from China containing industrially significant technology, including those related to the “Made in China 2025” program.  The final list of covered imports will be announced by June 15, 2018. The announcement also said that the U.S. Trade Representative Office (USTR) will continue WTO dispute settlement against China originally initiated in March to address China’s discriminatory technology licensing requirements. Additionally, the United States will implement specific investment restrictions and enhanced export controls for Chinese persons and entities related to the acquisition of industrially significant technology. The list of restrictions and controls will be announced by June 30, 2018.

May 19, 2018: A joint statement released by the White House said that the United States and China had led to an agreement for China to buy more goods and services, including “meaningful increases in U.S. agriculture and energy exports.” The statement also said that both sides attach importance to intellectual property protections, agreed to encourage two-way investment and to strive to create a fair, level playing field for competition, and agreed to engage at high levels on trade and investment issues. Additionally, the statement said that the United States would send a team to China to work out the details of the agreement. However, the statement did not contain a specific target for reducing the $375 billion trade deficits.

April 5, 2018: President Trump announced that he has instructed the Office of the U.S. Trade Representative (USTR) to consider $100 billion additional retaliatory tariffs on China, in response to China’s own retaliation against the Section 301 tariffs announced in late March. In a statement released the next day, USTR confirms the proposed new measures. USTR also says that any additional tariffs proposed will be subject to a similar public comment process as the proposed tariffs announced on April 3, 2018. No tariffs will go into effect until the respective process is complete. 

April 3, 2018: USTR released the proposed list of Chinese products to be subject to the retaliatory tariff under the Section 301 action. The proposed list covers approximately 1,300 separate tariff lines and will undergo further review in a public notice and comment process, including a hearing (scheduled at around May 15, 2018). The USTR statement says it will make a final decision on whether to implement the proposed tariff action after the whole process. 

March 26, 2018: USTR filed a WTO case against China’s discriminatory technology licensing requirements (DS542). The US claimed that China’s measures appear to be inconsistent with Articles 3, 28.1(a) and (b) and 28.2 of the Trade-Related Intellectual Property Rights Agreement (TRIPS). As of April 8, 2018, the European Union, Japan, Ukraine and Saudi Arabia have requested to join the dispute as third parties. According to the WTO rule, China shall enter into consultation with the US no later than April 26, 2018. If the dispute is not resolved by May 25, 2018 (i.e., 60 days after the request for consultation), the United States may request a WTO panel. As of June 17, 2018, the case is still in consultations.

March 22, 2018: President Trump announced his decisions on the actions the Administration will take in response to China’s unfair trade practices covered in the USTR Section 301 investigation of China’s Acts, Policies, and Practices Related to Technology Transfer, Intellectual Property, and Innovation. U.S. Trade Representative Robert Lighthizer initiated the investigation in August 2017 at the direction of President Trump. In the Memorandum he signed, President Trump directed the US Trade Representative to level tariffs on about $50 billion worth of Chinese imports. 

January 2018: the U.S. Trade Representative Office submitted its annual report on China’s WTO Compliance to U.S. Congress. The report says that “It seems clear that the United States erred in supporting China’s entry into the WTO on terms that have proven to be ineffective in securing China’s embrace of an open, market-orientated trade regime.”

August 14, 2017: President Trump issued a memorandum directing the USTR to determine if China’s policies regarding IPR theft and forced technology requirements “may be harming American intellectual property rights, innovation, or technology development,” and thus warrant USTR action under Section 301of the 1974 Trade Act.

Related reading: The Section 301 Investigation against China Divides the U.S. Textile Industry and U.S. Fashion Brands and Retailers

Sourcing Strategy of Leading U.S. Fashion Brands and Apparel Retailers (updated in May 2018)

The Section 301 Investigation against China Divides the U.S. Textile Industry and U.S. Fashion Brands and Retailers

FOREIGN201708211603000328832175771

On April 3, 2018, the U.S. Trade Representative Office (USTR) released the proposed list of Chinese products to be subject to the retaliatory tariff under the Section 301 action. The proposed list covers approximately 1,300 separate tariff lines, including textile machinery. However, textile and apparel (HS chapters 50 to 63) were not on the list.

USTR says it will make a final decision on whether to implement the proposed tariff action after a public hearing process scheduled at around May 15, 2018. Most U.S.-based textile and apparel industry associated have submitted their public comments regarding the section 301 investigation. Because of their respective commercial interests, not surprisingly, the U.S. textile industry favors the retaliatory tariffs on imports from China whereas U.S. fashion brands and retailers oppose the action strongly. Specifically:

National Council of Textile Organizations (NCTO)

  • NCTO applauds the Trump Administration’s formal initiation of a Section 301 case designed to address China’s persistent and highly damaging actions in the area of intellectual property theft. NCTO argues that illegal activity on the part of the government of China has gone on for far too long, at the direct expense of U.S. manufacturers and the loss of millions of U.S. manufacturing jobs.
  • The U.S. textile industry is severely disappointed that the retaliation list published by USTR on April 3 does not contain a single textile or apparel product.
  • NCTO argues that China’s illegal IPR activities have damaged the U.S. textile industry and recommend that textile and apparel products be added to the retaliation list.

The United States Fashion Industry Association (USFIA)

  • USFIA opposes adding apparel (items classifiable under chapters 61 and 62 of the HTSUS) and other fashion products (such as footwear, handbags, and luggage) to the retaliation list against China.
  • USFIA argues that tariffs are NOT the appropriate mechanism to redress the activities outlined in USTR’s report to the White House. Imposing tariffs on imports of fashion products would do nothing to solve the concerns about China’s IP policies and practices outlined in USTR’s Section 301 report.
  • USFIA believes that the best way to address concerns about China’s IPR practices is action at the multilateral level that includes other US trading partners.

American Apparel and Footwear Association (AAFA)

  • AAFA strongly opposes the proposed imposition of tariffs on textile, apparel, and footwear equipment and machinery as this will result in increased costs for AAFA members who are making yarns, fabrics, clothes, and shoes in the United States.
  • AAFA believes that a tariff on textile and apparel products would be a hidden tax on U.S. consumers, particularly since China represents such a large source of U.S. imports of these products.
  • AAFA strongly supports the Trump Administration’s efforts to improve the protection of intellectual property rights in China.

New CRS Report: U.S. Trade with Free Trade Agreement (FTA) Partners

3Key findings:

  • Between 1985 and 2011, the United States entered into 14 free trade agreements (FTAs) with 20 countries. Data from the Census shows that U.S. merchandise trade (or trade in goods) with FTA partner countries represents nearly 70% of all U.S. exports in goods and services, and more than 80% of all U.S. imports of goods and services.
  • In 2016, the United States ran a merchandise trade deficit of -$71.3 billion with the 20 FTA partner countries and a services surplus of $68.9 billion. The share of the U.S. trade deficit with FTA partners, however, has fallen by nearly half over the 2007-2017 period, from 18% to only about 10% of the total -$734.4 billion U.S. merchandise trade deficit.

1

  • Regarding the economic impact of FTAs on the United States, a study conducted by the U.S. International Trade Commission suggests that bilateral and regional trade agreements increased U.S. aggregate trade by about 3%, but less than 1% for U.S. employment (or 159,300 full-time equivalent employees). Specifically, the study finds that rising imports, due in part to the Agreement on Textiles and Clothing (ATC), accounted for most of the reduction in U.S. employment in the apparel industry between 1998 and 2014.
  • Current trade data treat exports and imports as though the full value of an export was produced domestically and the full value of an import was produced abroad. However, the rapid growth of global value chains and intra-industry trade (importing and exporting goods in the same industry) has significantly increased the amount of trade in intermediate goods in ways that can blur the distinction between domestic and foreign firms and goods. For example, foreign value added accounts for about 11% of the content of U.S. exports in 2010. As a result of the growth in value chains, traditional methods of measuring trade may obscure the actual sources of goods and services and the allocation of resources that are used in producing those goods and services.

2

  • Trade agreements of the type currently being negotiated by the United States comprise a broad range of issues that could have significant economic effects on trade and commercial relations over the long run between the negotiating parties, particularly for developing and emerging economies. However, the negative effects of international trade and trade agreements, particularly potential job losses and lower wages, often are distributed disproportionately with the effects falling more heavily on some workers and on some firms.

The full report can be downloaded from HERE

Resources for Learning about Cotton: FASH455 Exclusive Interview with Shannon Brady, CottonWorks™ Student Ambassador

IMG_1605

The picture above: Shannon Brady, Junior, UD Fashion Merchandising Major (Fourth one from the left in the front row) visited Cotton Inc together with other Cotton Student Ambassadors.

Question: What is the CottonWorks™ Ambassador program about and what is your role as an ambassador?

The CottonWorks™ ambassador program is a program where students in fashion and apparel related majors get to promote CottonWorks™ on their college campuses. Ambassadors are charged with helping faculty and students understand the resources available through CottonWorks™ as well as promote this resource through social media. This semester there are twelve ambassadors (including myself) from 12 different schools across the country.

My role as an ambassador is to raise awareness about CottonWorks™ on campus as it is a new program here at the University of Delaware. In January of this year, I had the opportunity to visit the Cotton Incorporated Headquarters in Cary, North Carolina. I, along with other CottonWorks™ ambassadors participated in an all-day CottonWorks™ training as well as a tour of the production facilities at Cotton Incorporated. I got to see everything from raw cotton to state-of-the-art laser finished denim. It was a unique experience and such a cool way to see the material I learned about in class come to life. 

Question: Cotton Incorporated recently launched a new CottonWorksTMprogram to help industry professionals and emerging professionals (like our FASH students) know more about cotton. Can you give us an overview of the program, particularly the learning resources related to the sourcing of cotton products?

CottonWorks™ is a free website where students and professionals can access a multitude of resources about cotton and the fashion and apparel industry.  The site offers many learning resources. Detailed guides are offered on topics such as sourcing and manufacturing, retail and marketing, fabric and technology, fashion and trend, and sustainability. These topics really apply to the fashion curriculum at UD. Additionally, the site offers a mobile-friendly textile encyclopedia where students can look up any textile related word anytime, anywhere.

However, the site offers more than just learning resources. CottonWorks™ is a great supplemental learning tool, but the site also offers emerging professionals ways to get engaged with their industry. Free webinars and workshops are offered through the website and are a great way to engage with industry professionals and learn about the issues pressing the industry right now. Their next webinar is on Tuesday 24 April 2018 registration is open on the CottonWorks™ website, and the topic of discussion is Cotton’s Biodegradability in Aquatic Environments.

Particularly regarding learning resources on sourcing cotton products, the sources and manufacturing topic on the website offers dozens of guides all kinds of cotton products, ranging from denim to cotton nonwovens.

Last but not the least, the Executive Cotton Update and Monthly Economic Letter, both posted every month at cottonworks.com/news are great resources for students and industry professionals interested in knowing what is happening in the U.S. and world cotton industry.

Question: Developing a sustainable supply chain is critical for the textile and apparel industry. So how is cotton related to sustainability? What are the facts important to know?

Cotton Incorporated is committed to being at the forefront of cotton sustainability, and the CottonWorks™ site offers many resources on how cotton is related to sustainability, including guides on responsible cotton production and manufacturing because sustainability happens throughout the lifecycle of cotton.

Cotton is a natural fiber, unlike some manmade fibers such as polyester it can biodegrade. If you log on to CottonWorks™ website you can view a recap of their webinar last month that went in depth about cotton’s biodegradability in soil and septic environments.

Additionally, CottonWorks™ has information on campaigns such as Cotton LEADS™ and Blue Jeans Go Green™ to promote the sustainability of cotton. Cotton LEADS™ is a joint program with Australia and the United States that supports a reliable and responsible cotton supply chain through five core principles of sustainability, use of best practices and traceability in the supply chain. Blue Jeans Go Green™ initiative collects denim sent to landfills and recycles it in partnership with Bonded Logic Inc. You can learn more about both these initiatives on the CottonWorks™ site at cottonworks.com/topics/sustainability.

Question: What are the opportunities for our FASH and UD students to get involved with CottonWorks™ and learn more about cotton?

Students can get started today! By registering for a free account on cottonworks.com, they have access to all of the amazing resources I touched on and many more. Additionally, they can follow @cotton_works on Instagram and Twitter to learn more about cotton and get cotton inspiration for their projects. 

I will also be hosting a tabling event where students can learn more about these resources, talk to me, and win free food and prizes on Thursday 19 April 2018 in Perkins! There will be more tabling events in the future that I will be posting about in my social media as well.

This slideshow requires JavaScript.

Regional Textile and Apparel Supply Chains–Questions from FASH455

References and tables_Page_1

NAFTA and Textile and Apparel Rules of Origin

#1 How do rules of origin (RoO) and free trade agreement (FTA) regulations affect speed to market in apparel sourcing? Do countries who are part of an FTA find it to be easier to get to market in a shorter amount of time if they are working with other FTA members? Or could RoO slow down the production process because producers have to be more careful about compliance with the complicated RoO?

#2 Why or why not the “yarn forward” rules of origin remains an effective way to promote textile and apparel production in the Western-Hemisphere?  What other options are available to improve the competitiveness of the Western-Hemisphere textile and apparel supply chain?

#3 What would happen to the Western-Hemisphere textile and apparel supply chain should NAFTA no longer exist?

#4 Should NAFTA be responsible for the loss of US apparel manufacturing jobs? Any hard evidence?

#5 If you were U.S. trade negotiators, what would you do with TPL in NAFTA given the competing views from the U.S. textile industry and U.S. fashion brands and retailers?

The Outlook of “Factory-Asia”

#6 From the perspective of the U.S. textile and apparel industry, is it a good idea for the United States to reach free trade agreement (FTA) with Asian countries? If so, what countries should be included in the new FTA? If not, why?

#7 How can U.S. companies get involved in the Asia-based textile and apparel supply chain?

#8 Why or why not is the “Flying geese model” unique to Asia? Can the model be replicated in America too?

(Welcome to join our online discussion. Please mention the question number in your reply)

Competition in the U.S. Apparel Import Market (Updated March 2018)

market shares in the US (2017)_Page_2market shares in the US (2017)_Page_3CAFTA-DRNAFTA

CPTPP Tariff Phaseout Schedule for Textiles and Apparel

The Comprehensive and Progressive Agreement for Trans-Pacific Partnership (CPTPP),  signed on March 8, 2018, is a new free trade agreement between Australia, Brunei, Canada, Chile, Japan, Malaysia, Mexico, New Zealand, Peru, Singapore, and Vietnam. Once the CPTPP enters into force, it will be one of the largest free trade agreements in the world and will provide enhanced market access to key Asian markets. Below is the detailed tariff phaseout schedule for textile and apparel products by CPTPP members:

CPTPP

This slideshow requires JavaScript.

by Sheng Lu

Wage Level for Garment Workers in the World (updated in 2017)

wage2

wage1

Statistics from the Public Radio International (PRI) show that garment workers in many parts of the world earn much less than the national average. Of the twenty-one countries investigated by PRI, the monthly wage for garment workers range widely from $1,864 (USA) to $194 (Sri Lanka).

However, a higher wage level in absolute term does not necessarily mean a more decent pay. For example, while garment workers in the US apparently earn much more than their peers in other parts of the world, the wage level nevertheless was only 51 percent of the U.S. national average wage. Likewise, while garment workers in Honduras earn only $650 each month, this amount was approximately 107 percent of the national average wage in the country.

For more information about the wage level for garment workers around the world, please explore the Fair-fashion Quiz created by PRI.

Please also see Minimum Wage Level for Garment Workers in the World (Updated in December 2020)

Social and Economic Impacts of Apparel Trade–Questions from FASH455

Used-clothes-e1501882805445

Debate on Used clothing trade and AGOA

#1 What evidence can support the arguments that cutting off secondhand clothing imports from Africa will allow African nations to build their own textile industry? Likewise, what evidence can support the arguments that African countries overall benefit from importing used clothing from countries like the United States?

#2 Given the debate on used clothing trade on African nations, will you continue to donate used clothing? Why or why not?

#3 China holds a dominant position in textile and apparel production and exports because of their vast amounts of technology, workers, and resources. How do you think least developing countries like Africa will be able to keep up with such steep competition? Why or why not it is a wise decision for the United States to threaten to take away East African countries’ benefits under AGOA?

Social and economic impact of apparel trade

#4 Is factory employment in India a step in the right direction for the country’s gender equality? What effects, positive or negative, could such employment have in regards to gender issues?

#5 We keep arguing that globalization is negative because we are taking jobs away from U.S. workers. But by sending more work to factories in India, we’ve created jobs for these Indian women who, before working in the factories, were sheltered and only sent off into the world for arranged marriage. In this sense, is globalization still negative if we’re creating a sense of freedom and purpose for these women?

#6 As detailed in the article, the working conditions and treatment of workers is extremely unethical in some garment factories.  Can globalization help this issue or hurt it more? 

#7 How do you compare your life to the Indian girls in the article? And please just imagine: ten years later, what will the life of these Indian girls look like? How about yours?

Welcome to our online discussion! Please mention the question # in your comment.

Automation Comes to Fashion

Video Discussion Questions:

#1 Why do you agree or disagree with the video that automation will post a significant challenge to garment workers in developing countries such as Bangladesh? How should policymakers react to the challenges?

#2 Can automation be a permanent solution to the social responsibility problem in the garment industry?

#3 In your view, how will automation affect the big landscape of apparel sourcing and the patterns of world textile and apparel trade?

#4 Why or why not do you anticipate a sizable return of apparel manufacturing to the United States if apparel production can be largely automated?

Additional reading: The robots are coming for garment workers. (WSJ, 2018)

Please feel free to share your views and join our online discussion!

US Continues to Lose Textile and Apparel Manufacturing Jobs in 2017

textile

apparel

It may disappoint those who are hoping a return of textile and apparel manufacturing jobs in the United States. But according to latest statistics from the Bureau of Labor Statistics (BLS), the U.S. textile industry (NAICS 313 and 314) and apparel industry (NAICS 315) respectively lost another 4,100 and 10,100 jobs in 2017.  Between January 2005 and December 2017, 44.2% and 56.3% of jobs in the U.S. textile and apparel sectors were gone.  

From the academic perspective, a sizable return of textile and apparel manufacturing job in the United States seems to be extremely unlikely given the nature of the U.S. and the global economy in the 21st century.

Notably, the rising import is found NOT a significant factor leading to the decline in employment in the U.S. textile industry (NAICS 313). As estimated by a US International Trade Commission study in 2016, imports were found only contributed 0.4 percent of the total 7.6 percent annual employment decline in the U.S. textile industry between 1998 and 2014. Instead, more job losses in the sector were caused by: 1) the improved productivity as a result of capitalization and automation (around 4.6 percent annually); and (2) the shrinkage of domestic demand for the U.S. made textiles (around 3.5 percent annually).

And consistent with the prediction of classic trade theories, as capital and technology abundant developed country, the United States, not surprisingly, continues to lose its comparative advantage in making labor-intensive apparel. Hypothetically, apparel “Made in the USA” may come back if apparel manufacturing can be substantially automated like textile manufacturing. However, net job creation in the sector as a result of automation is hard to tell. Additionally, most U.S. apparel companies heavily rely on global sourcing and non-manufacturing activities such as branding, marketing, and design today. Few companies still regard “manufacturing” a key competitive advantage or an area of strategic importance to invest in the future.

Related reading: Creating High-Quality Jobs in the U.S. Textile and Apparel Industry (UD Biden Institute)

Is It Necessary to Cut Trade Deficit and Achieve Trade Balance?

2

1.jpg

While the Trump Administration is seeking to reduce the U.S. trade deficit and achieve a more “balanced trade” with its trading partners, a newly-released World Economic Forum (WEC) paper questions the necessity and economic rationale of doing so. As argued by the paper:

First, a country’s trade balance is NOT a measurement of its international commercial success. Neither is the case that “imports are bad and exports are good. “Instead, the paper says that “it is more accurate to think of imports as the benefits of trade, and exports as the cost that needs to be paid to obtain these benefits.”

Second, it is a misconception that “trade deficits cause a reduction in employment and production and trade surplus increase them.” Rather, imports could  increase because of an increase in domestic income thereby increasing the aggregate demand. Empirical studies also overwhelmingly find that rapid economic growth and larger trade deficit are associated with faster employment growth in the United States in history (see the graphs above).

Third, as the supply chain goes global, a tax on imported inputs can reduce rather than promote a country’s exports, particularly manufacturing goods (for example high tariffs on imported fabrics will reduce the price competitiveness of clothing exports). Likewise, trade barriers could disrupt production and reduce domestic employment in both the “protected” industries and those downstream sectors that use their outputs.  

Fourth, primarily trade balance is a function of a country’s national saving and investments, not of trade policies. In other words, trade policies, such as higher tariffs and quantitative restrictions, will have no impact on a country’s trade balance. Interesting enough, countries like Singapore which maintain fairly low trade barriers, run a trade surplus equal to as high as 20% of its GDP. In comparison, India was one of the most highly protected economies in the early 1990s when it experienced unsustainable large trade deficits. Further, there is a dynamic balance between a country’s trade balance and exchange rate: in an open economy, reducing a country’s imports could lead to an appreciation of its currency and eventually hurt its exports as well.     

What is your view on the trade deficit and trade balance? Why do you agree or disagree with the arguments of the WEC paper? Do you find any evidence that challenges the findings of the paper? Please feel free to leave your comments.

Outlook 2018: Apparel Industry Issues in the Year Ahead

Outlook 2019: Apparel Industry Issues in the Year Ahead is available 

th.jpg

In January 2018, Just-Style consulted a panel of industry leaders and scholars in its Outlook 2018–Apparel Industry Issues in the Year Ahead management briefing. Below is my contribution to the report. All suggestions and comments are most welcome!

1. What do you see as the biggest challenges – and opportunities – facing the apparel industry in 2018, and why?

One of the biggest opportunities facing the apparel industry in 2018 could be the faster growth of the world economy. According to the International Monetary Fund (IMF), the global growth forecast for 2018 is expected to reach 3.7 percent, about 0.1 percent points higher than 2017 and 0.6 percent points higher than 2016. Notably, the upward economic growth will be broad-based, including the United States, the Euro area, Japan, China, emerging Europe and Russia. Hopefully, the improved growth of the world economy will translate into increased consumer demand for clothing in 2018.

Nevertheless, from the macroeconomic perspective, oversupply will remain a significant challenge facing the apparel industry in 2018. Data from the World Bank and the World Trade Organization (WTO) shows that, while the world population increased by 21.6 percent between 2000 and 2016, the value of clothing exports (inflation-adjusted) surged by 123.5 percent over the same period. Similarly, between 2000 and 2016, the total U.S. population increased by 14.5 percent and the GDP per capita increased by 22.2 percent, but the supply of apparel to the U.S. retail market surged by over 67.8 percent during the same time frame. The problem of oversupply is the root of many challenges faced by apparel companies today, from the intense market competition, pressure of controlling production and sourcing cost, struggling with excessive inventory and deep discounts to balancing sustainability and business growth.

2: What’s happening with sourcing? How is the sourcing landscape likely to shift in 2018, and what can apparel firms and their suppliers do to stay ahead?

The 2017 US Fashion Industry Benchmarking Study, which I conducted in collaboration with the US Fashion Industry Association (USFIA) earlier this year, provides some interesting insights into companies’ latest sourcing strategies and trends. Based on a survey of 34 executives at the leading U.S. fashion companies, we find that:

First, most surveyed companies continue to maintain a relatively diversified sourcing base, with 57.6 percent currently sourcing from 10+ different countries or regions, up from 51.8 percent last year. Larger companies, in general, continue to have a more diversified sourcing base than smaller companies. Further, around 54 percent of respondents expect their sourcing base will become more diversified in the next two years, up from 44 percent in 2016; over 60 percent of those expecting to diversify currently source from more than 10 different countries or regions already. Given the uncertainties in the market and the regulatory environment (such as the Trump Administration’s trade policy agenda), companies may use diversification to mitigate potential market risks and supply chain disruptions due to protectionism.

Second, although U.S. fashion companies continue to seek alternatives to “Made in China” actively, China’s position as top sourcing destination remains unshakable. Many respondents attribute China’s competitiveness to its enormous manufacturing capacity and overall supply chain efficiency. Meanwhile, it is interesting to note that the most common sourcing model is shifting from “China Plus Many” to “China Plus Vietnam Plus Many” (i.e. China typically accounts for 30-50 percent of total sourcing value or volume, 11-30 percent for Vietnam and less than 10 percent for other sourcing destinations). I think this sourcing model will likely to continue in 2018.

Third, social responsibility and sustainability continue to grow in importance in sourcing decisions. In the study, we find that nearly 90 percent of respondents give more weight to sustainability when choosing where to source now than in the past. Around 90 percent of respondents also say they map their supply chains, i.e., keeping records of name, location, and function of suppliers. Notably, more than half of respondents track not only Tier 1 suppliers, suppliers they contract with directly, but also Tier 2 suppliers, i.e., supplier’s suppliers. However, the result also suggests that a more diversified sourcing base makes it more difficult to monitor supply chains closely. Making the apparel supply chain more socially responsible, sustainable and transparent will continue to be a hot topic in 2018.

3: What should apparel firms and their suppliers be doing now if they want to remain competitive further into the future? What will separate the winners from the losers?

I assume many experts will suggest what apparel firms should change to stay competitive into the future. However, the question in my mind is what should companies keep doing regardless of the external business environment? First, I think companies should always strive to understand and impress consumers and control their supply chains. Despite the growing popularity of e-commerce and the adoption of transformative new technologies, the fundamental nature of apparel as a buyer-driven business will remain the same. Second, companies should always leverage their resources and stay “unique,” no matter it means offering differentiated products or value-added services, maintaining exclusive distribution channels or keeping the leadership position in a particular niche market. Third, apparel firms should always follow the principle of “comparative advantage” and smartly define the scope of their core business functions instead of trying to do everything. Additionally, winners will always be those companies that can take advantage of the mega-development trends of the industry and be willing to make long-term and visionary investments, both physical and intangible (such as human talents).

4: What keeps you awake at night? Is there anything else you think the apparel industry should be keeping a close eye on in the year ahead? Do you expect 2018 to be better than 2017, and why?

I think the apparel industry should keep a close eye on the following issues in 2018:

  • The destiny of the North American Free Trade Agreement (NAFTA): The potential policy change to NAFTA means so much to the U.S. textile and apparel industry as well as suppliers in other parts of the world. Notably, through a regional textile and apparel supply chain facilitated by the agreement over the past 23 years, the NAFTA region has grown into the single largest export market for U.S. textile and apparel products as well as a major apparel sourcing base for U.S. fashion brands and retailers. In 2016, as much as half of U.S. textile and apparel exports went to the NAFTA region, totaling US$11billion, and U.S. apparel imports from Mexico and Canada exceeded US$3.9billion. Understandably, if NAFTA no longer exists, sweeping changes in the trade rules, such as import duties, could significantly affect the sourcing and manufacturing behaviors of U.S. textile and apparel companies and consequentially alter the current textile and apparel trade patterns in the NAFTA region. For example, Mexico’s focus on basic apparel items suggests that U.S. importers could quickly source from elsewhere if duty savings under NAFTA are eliminated.
  • The possible reaching of the Regional Comprehensive Economic Partnership (RCEP): Even though RCEP is less well-known than the Trans-Pacific Partnership (TPP), we should not ignore the potential impact of the agreement on the future landscape of textile and apparel supply chain in the Asia-Pacific region. One recent study of mine shows that the RCEP will lead to a more integrated textile and apparel supply chain among its members but make it even harder for non-RCEP members to get involved in the regional T&A supply chain in the Asia-Pacific. This conclusion is backed by the latest data from the World Trade Organization (WTO): In 2016, around 91 percent of Asian countries’ textile imports came from other Asian countries, up from 86 percent in 2006. The more efficient regional supply chain as a result of RCEP will further help improve the price competitiveness of apparel made by “factory Asia” in the world marketplace. Particularly in the past few years, textile and apparel exports from Asia have already posted substantial pressures on the operation of the textile and apparel regional supply chain in the Western Hemisphere.
  • Automation of apparel manufacturing and its impact on the job market: Recall my observations at the MAGIC this August, several vendors showcased their latest technologies which have the potential to automate the cut and sew process entirely or substantially reduce the labor inputs in garment making. The impact of automation on the future of jobs is not a new topic, but the apparel industry presents a unique situation. Globally, over 120 million people remain directly employed in the textile and apparel industries today, a good proportion of whom are females living in poor rural areas. According to the World Trade Organization (WTO), for quite a few low-income and lower-middle income countries such as Bangladesh, Gambia, Pakistan, Madagascar, Sri Lanka, and Cambodia, as much as over 70 percent of their total merchandise exports were textile and apparel products in 2016. Should these labor-intensive garment sewing jobs in the developing countries were replaced by machines, the social and economic impacts will be consequential. I think it is the time to start thinking about the possible scenarios and the appropriate policy responses.

Apparel Sourcing in 2018: Results from the Just-Style State of Sourcing Survey

The latest Just-Style State of Sourcing Survey suggests a few trends of apparel sourcing in 2018:

First, apparel companies are attaching greater importance to speed-to-market in their sourcing decisions. According to the result, the need for a faster, more responsive supply chain is being driven by consumers’ increasing demands for immediacy and constant newness, as well as the speed with which social media can spread new trends.

Second, respondents say the rising sourcing and production cost remains one of their top business challenges in the New Year. Key drivers of cost increase include wage of production workers, raw material price and the social and environmental compliance cost. Notably, almost half expect their sourcing budget to go up, with 15.3% seeing an increase of more than 5%, and 32.8% anticipating a rise of between 1% and 5%. A further 32.1% see their budgets staying the same in the year ahead.

Third, the survey result confirms that China’s dominance of global apparel manufacturing is unlikely to change anytime soon. Asked about their China sourcing plans in 2018, 21.1% of respondents said they would buy more here over the next 12 months, some 30.5% expect their China sourcing to remain roughly the same year-on-year, and 28.9% expect to source less. Respondents say that “no other country can match China regarding the size of its supply base, its range of skills, its quality levels, its product variety and the completeness of its supply chain. The country also continues to lead the way when it comes to efficiency and infrastructure.” Meanwhile, Bangladesh and Vietnam continue to be seen as the two sourcing markets most likely to grow in importance in the next five years.

Fourth, respondents also expressed concerns about uncertainty over trade agreements (64.5%), particularly how the Trump Administration may do with the North American Free Trade Agreement (NAFTA). However, the impact of uncertainty created by Brexit seems to be limited.

The State of the Apparel Supply Chain

  • What is the biggest hurdle to “speed to market”?
  • What’s more important these days? Dollars or days?
  • Is mass customization a nice to have or a need to have?
  • How are companies fostering better partnerships with vendors?
  • How much has your company been impacted by the “Trump effect”?
  • Industry buzzwords: Amazon, sustainability, digitalization, transparency, on-demand manufacturing, data analytics.
  • How well are companies executing on their data?
  • 2017 is the year of _________? And What will 2018 be known for?

Tariff Remains a Critical Trade Barrier for the Textile and Apparel Sector (Updated December 2017)

textile

clothing

According to latest statistics from the World Trade Organization (WTO), in 2016, the average applied tariff rate remained at 10.5% for textiles and 17.5% for apparel worldwide. Compared with the average tariff rate for all sectors, the tariff rate for textile and apparel is 1.4 percentage points and 8.4 percentage points higher respectively. The result suggests that while tariff may no longer be a critical trade barrier for some sectors, it still significantly matters for the textile and apparel industry.

Least developed countries (LDC) overall set a higher tariff rate for textiles and apparel than other more advanced economies. For many poorest countries in the world, tariff remains the single largest source of tax revenue for the local government. However, it is also true that should these LDCs lower their tariff rate for textile inputs such as yarns and fabrics, it may help apparel manufacturers in these countries lower production cost and improve the price competitiveness of their finished apparel products in the world marketplace.

At the country level, countries with the highest tariff rate for textiles include Bahamas (37.1%), Ethiopia (28.0%), Uzbekistan (24.5%), Algeria (24.0%), Argentina (23.3%), and Brazil (23.3%). Whereas countries with the highest tariff rate for apparel include South Africa (41.0%), Namibia (41.0%), Swaziland (41.0%), Botswana (41.0%), Lesotho (41.0%), Bolivia (40.0%), Egypt (38.4%), Argentina (35.0%), Ethiopia (35.0%) and Brazil (35.0%).

tariff rate

Data also shows that the import tariff rates of the US, EU(28) and Japan, the top three largest textile and apparel importers in the world, stay unchanged over the past three years.

Map_630900_I_

TIC

Additionally, there seems to be a positive relationship between a country’s import tariff rate for new clothing (HS 61 & 62) and used clothing (HS 6309). Of the total 180 countries covered by the International Trade Center (ITC) database, about 62.7% set an equal or higher tariff rate for new clothing than used clothing. Some African nations place a particularly high tariff rate for used clothing, including Zimbabwe (167%), South Africa (149%), Rwanda (117%), Namibia (80%), Tanzania (56%), and Uganda (41%).

Detailed tariff rates in Excel can be downloaded from HERE

Regional Supply Chain Remains an Important Feature of Global Textile and Apparel Trade (Updated: November 2017)

Regional supply chain (or production-trade network, RPTN) or refers to a vertical industry collaboration system between countries that are geographically close to each other. Within a regional supply chain, each country specialized in certain portions of production or value-added activities based on their respective comparative advantages to maximize the efficiency of the whole supply chain.

There are three primary textile and apparel (T&A) regional supply chains in the world today:1

4

Asia: within this regional T&A supply chain, more economically advanced Asian countries (such as Japan, South Korea, and China) supply textile raw material to the less economically developed countries in the region (such as Myanmar, Cambodia, and Vietnam). Based on relatively lower wages, the less developed countries typically undertake the most labor-intensive processes of apparel manufacturing and then export finished apparel to major consumption markets around the world.

2

5

Europe: within this regional T&A supply chain, developed countries in Southern and Western Europe such as Italy and Germany serve as the primary textile suppliers. Regarding apparel manufacturing in the European Union,  products for the mass markets are typically produced by developing countries in Southern and Eastern Europe such as Poland and Romania, whereas high-end luxury products are mostly produced by Southern and Western European countries such as Italy and France. Furthermore, a high portion of finished apparel is shipped to developed EU members such as UK, Germany, France, and Italy for consumption.

3

6

America: within the region, the United States serves as the leading textile supplier, whereas developing countries in North, Central and South America (such as Mexico and countries in the Caribbean region) assemble imported textiles from the United States or elsewhere into apparel. The majority of clothing produced in the area is eventually exported to the United States for consumption.

Data from the World Trade Organization (WTO) shows that regional supply chain remains an essential feature of today’s global textile and apparel trade.  Notably, three trade flows are worth watching:

First, Asian countries are increasingly importing more textiles from within the region. In 2016, around 91.2% of Asian countries’ textile imports came from other Asian countries, up from 86.8% in 2006. This change reflects the formation of a more integrated T&A supply-chain in Asia. The more efficient regional supply chain also helps improve the price competitiveness of apparel made by “factory Asia” in the world marketplace. Particularly in the past few years, T&A exports from Asia is posting substantial pressures on the operation of the T&A regional supply chains in the Western Hemisphere.

Second, the intra-region T&A trade in EU remains stable. In 2016, 64.1% of EU countries’ textile imports and 55.6% of EU countries’ apparel imports came from within the EU region. Over the same period, 73.3% of EU countries’ textile exports and 81.6 % of their apparel exports also went to other EU countries.

Third, the Western-Hemisphere T&A supply chain, which involves countries in North, South and Central America, is facing substantial challenges from the increasing competition from Asian T&A exporters. In 2016, only 29.0% of North, South and Central American countries’ textile imports and 18.6% of their apparel imports came from within the region, a record low in the past ten years. Meanwhile, in 2016 Asian countries supplied 60.1% of textiles and 73.7% of clothing imported by countries in the Western Hemisphere, a record high in history. Understandably, if regional free trade agreements, such as NAFTA and CAFTA-DR, no longer exist, it would be even more difficult for the Western-Hemisphere T&A supply chain to survive. The potential losers of the collapse of the Western-Hemisphere T&A supply chain will include not only US textile exporters but also apparel exporters in North, South and Central America. Notably, in 2016, 89.3% of apparel exported by countries in the Western Hemisphere were destined for the region.  

78

Data Source: World Trade Organization (2017)

by Sheng Lu

Apparel Sourcing in U.S. Trade Preference Program Countries

Speakers:

  • Tarek Kabil – Egyptian Ministry of Trade & Industry
  • Ashraf Rabiey – QIZ Minister of Egypt
  • Gabi Bar – QIZ Minister of Israel
  • Mark D’Sa – Special Project Director for Haiti
  • Moderator: Gail Strickler – former Assistant US Trade Representative for Textiles

Discussion questions:

  1. What are the financial incentives for US brands and retailers to source apparel in preference program countries? Why do U.S. apparel imports from members of AGOA, QIZs and HELP overall remain at a fairly low level despite the trade preference programs? How to improve the situation?
  2. Overall, why or why not should the US keep the trade preference programs or any critical reforms are needed?
  3. Any other interesting points you learned from the video or questions you may have?

Interview with Dr. Marsha Dickson, Co-founder of Better Buying

 Dr. Marsha Dickson, Irma Ayers Professor, Department of Fashion and Apparel Studies at the University of Delaware discusses her co-founded Better Buying project(http://www.betterbuying.org), a meaningful effort to improve the social responsibility practices in the global apparel industry. The video is produced by Mallory Metzner, reporter of channel 49 of the University of Delaware.

CRS Releases Report on NAFTA Renegotiation and US Textile Manufacturing

23120124_10155817882672812_4644791366056415981_oKey findings:

U.S. textile and apparel trade with NAFTA members

  • The United States maintains a bilateral trade surplus in yarns and fabrics ($4.1 billion in 2016) as well as made-up textiles ($720 million in 2016) with NAFTA members.
  • Regarding apparel, the United States had a trade surplus with Canada of $1.4 billion and a trade deficit with Mexico of $2.7 billion in 2016.

Impact of NAFTA on employment and production in the U.S. textile and apparel industry

  • The effects of NAFTA are NOT straightforward, and the drop in U.S. domestic textile and apparel production and jobs cannot be blamed solely on NAFTA.
  • The U.S. International Trade Commission (USITC) concluded that imports of textiles had a tiny effect on U.S. textile industry employment (a 0.4% decline) from 1998 to 2014, which covers most of the period since NAFTA’s enactment. However, the collapse of the U.S. domestic apparel industry and changing clothing tastes may have had a more significant impact on domestic textile production.
  • There is little evidence that NAFTA was the decisive factor for the loss of jobs in the U.S. apparel manufacturing sector, given that the major growth in apparel manufacturing for the U.S. market has occurred in Asian countries that receive no preferences under NAFTA.

Impact of the Tariff Preference Level (TPL) in NAFTA

  • In nearly every year since 2010, Mexico has come close to exporting the maximum allowable amount of cotton and man-made fiber apparel with duty-free foreign content. Canada’s TPL fill rates are typically highest for cotton and man-made fiber fabric and made-up products but are not usually fully filled.
  • It is not clear that eliminating the TPL program would result in a substantial return of textile production or jobs to the United States; if it were to raise the cost of Mexican apparel production, it could instead result in imports from other countries displacing imports from Mexico.
  • Other than U.S. fashion brands and retailers, Mexico and Canada reportedly oppose the elimination of the NAFTA TPL program too.

 Possible Effects of Potential NAFTA Modification

  • Mexico’s focus on basic apparel items suggests that S. importers could quickly source from elsewhere if duty savings under NAFTA are eliminated. However, even now, some U.S. fashion companies say the duty savings are not worth the time and resources required to comply with the NAFTA rules of origin and documentation requirements. In 2016, roughly 16% of qualifying textile and apparel imports from NAFTA failed to take advantage of the duty-free benefits and instead paid applicable tariffs.
  • Whatever the outcome of the NAFTA renegotiation, in the medium and long run, the profitability of the North American textile and apparel industry will likely depend less on NAFTA preferences such as yarn forward and more on the capacity of producers in the region to innovate to remain globally competitive.
  • One change in NAFTA proposed by the United States would require motor vehicles to have 85% North American content and 50% U.S. content to qualify for tariff-free treatment. If auto manufacturers were to import more passenger cars from outside the NAFTA region and pay the 2.5% U.S. import duty rather than complying with stricter domestic content requirements, automotive demand for U.S.-made technical textiles could be adversely affected.
  • If the TPP-11 countries strike a trade deal, one possible effect is that Canada and Mexico may import more textile and apparel products from other TPP countries, including Vietnam. This could ultimately be a disadvantage for U.S.-based producers. How the inclusion of Canada and Mexico in a fresh TPP-11 arrangement would affect their participation in NAFTA is unknown.

The full report can be downloaded from HERE

NAFTA Members’ Applied MFN Tariff Rates for Textile and Apparel in 2017

If the North American Free Trade Agreement (NAFTA) is terminated by President Trump, the immediate impact will be an increase in tariff rate for textile and apparel (T&A) products traded between the three NAFTA members from zero to the most-favored-nation (MFN) rates applied for regular trading partners. In 2017, the average applied MFN tariff rates for textile and apparel were 7.9% and 11.6% respectively in the United States, 2.3% and 16.5% in Canada and 9.8% and 21.2% in Mexico (WTO Tariff Profile, 2017).

Below is NAFTA members’ average applied MFN tariff rate in 2017 for chapters 50-63, which cover T&A products:

tariff

US export to mexico

US export to canada

US import from Mexico

US import from Canada

Data source: World Trade Organization (2017); US International Trade Commission (2017)

by Sheng Lu

Related article: What Will Happen to the U.S. Textile and Apparel Industry if NAFTA Is Gone?

WTO Reports World Textile and Apparel Trade in 2016

[The 2017 statistics are available, see WTO Reports World Textile and Apparel Trade in 2017

textile

clothing.jpg

According to the newly released World Trade Statistical Review 2017 by the World Trade Organization (WTO), the current dollar value of world textiles (SITC 65) and apparel (SITC 84) exports totaled $284 billion and $443 billion respectively in 2016, marginally decreased by 2.3 percent and 0.4 percent respectively from a year earlier. This is the second year in a roll since 2015 that the value of world textiles and apparel exports grew negatively.

However, textiles and apparel are not alone. The current dollar value of world merchandise exports also declined by 3 percent in 2015, to $11.2 trillion, mostly caused by the strong decline in exports of fuels and mining products (-14 percent). On the other hand, as noted by the WTO, the steep drop in commodity prices recorded in 2015 mostly halted in 2016, except energy prices.

Textile and apparel exports

Measured in value, China, European Union, and India remained the top three exporters of textiles in 2016. Altogether, these top three accounted for 65.9 percent of world exports in 2016, slightly down from 66.5 percent in 2015, which is mostly due to India’s shrinking market shares.

The United States remained the fourth top textile exporter in 2016, accounting for 4.6 percent of the shares (down from 4.8 percent in 2015). Over half of the top ten exporters experienced a decline in the value of their exports in 2016, with the highest declines seen in Hong Kong (-13 percent), Taiwan (-8 percent), South Korea (-6 percent) and the United States (-6 percent). Notably, Vietnam entered the world’s top ten textile exporters for the first time (2 percent market shares, 9 percent growth rate from 2015).

Top three exporters of apparel include China, the European Union, and Bangladesh. Altogether, they accounted for 69.1 percent of world exports, close to 70.3 percent in 2015. Among the top ten exporters of apparel, increases in export values were recorded by Cambodia (+6 percent), Bangladesh (+6 percent), Vietnam (+5 percent), and European Union (+4 percent). Other leading exporters saw stagnation in their export values (such as Turkey) or recorded a decline (such as China, India, and Indonesia).

Could be negatively affected by the rising labor and production cost, China’s shares in the world textile exports dropped from 37.4 percent in 2015 to 37.2 percent in 2016, and the shares in the world apparel exports fell from 39.2 percent in 2015 to 36.4 percent in 2016—a record low since 2010.

Textile and apparel imports

Measured in value, the European Union, the United States, and China were the top three importers of textiles in 2016. These top three altogether accounted for 38 percent of world textile imports, slightly up from 37 percent in 2015, but remains much lower than over 53 percent back in 2000. Notably, over the past decade, apparel manufacturing continues to shift from developed to developing countries and many developing countries heavily rely on imported textile inputs due to the lack of local manufacturing capacity. This explains why more textile exports now go to the developing nations.

On the other hand, affected by consumers’ purchasing power (often measured by GDP per capita) and size of the population, the European Union, the United States, and Japan remained the top three importers of apparel in 2016. Altogether, these top three accounted for 62.9 percent of world apparel imports in 2016, up from 59 percent in 2015. Notably, China is quickly becoming one of the world’s top apparel importers. From 2010 to 2016, China’s apparel imports enjoyed an annual 17 percent growth, much higher than most other countries.

WTO_Chapter_09_tables_e_Page_1

WTO_Chapter_09_tables_e_Page_2.jpg


Mexico’s Apparel Exports Continue to Rely on the U.S. Market Heavily

Mexcio

Mexico’s textile and apparel (T&A) exports totaled USD$6,441 million in 2016, fell by 5.1% from 2015. Around 63% of these exports were apparel (or USD$4,061 million), and 37% (or USD$2,379 million) was textiles.

Could be negatively affected by the appreciation of the Mexican Peso against the U.S. dollar, plus the uncertainty associated with the renegotiation of the North American Free Trade Agreement (NAFTA), Mexico’s apparel exports further went down 7.2% in the first half of 2017 compared to 2016.

In 2016, the United States remains Mexico’s top T&A export market with an 87.3% share (up from 87.0% in 2015, 86.7% in 2014 and 84.7% in both 2013 and 2012), followed by Canada with a 1.9% share (up from 1.6% in 2015). Overall, Mexico was the sixth largest T&A supplier for the U.S. market, accounting for 4.3% of the market shares measured by value in 2016.

Nevertheless, Mexico’s T&A exports to the United States fell by 4.7% between 2015 and 2016 (from USD$5,902 million to USD$5,625 million). Product categories that suffered the deepest drop include cotton hosiery (down by 57.3%), men’s and boys’ wool suits (down by 35.9%), manmade fiber underwear (down by 29.0%), and men’s and boys’ cotton woven shirts (down by 27.9%).

Overall, Mexican T&A exporters feel relieved that the United States has decided to withdraw from the Trans-Pacific Partnership (TPP). However, without TPP, the Mexican T&A industry is still expected to face an increased competition from Vietnam and China both in the leading export markets (such as the United States and Canada) and the domestic market. Notably, the Mexican government has decided to lower the Most Favored Nation (MFN) import duty rates on the 73 clothing items and seven made-up textile items effective in January 2019.

References: Textile Outlook International (October 2017)