Erin Ennis has been Vice President of the US-China Business Council (USCBC) since May 2005. In that position, she directs the Council’s government affairs and advocacy work for member companies and oversees the Council’s Business Advisory Services. She also leads a coalition of other trade associations on issues of interest to companies doing business with China. Founded in 1973, the US-China Business Council provides extensive China-focused information, advisory, and advocacy services, along with comprehensive events, to nearly 250 US corporations operating within the United States and throughout Asia.
Prior to joining the Council, Ms. Ennis worked at Kissinger McLarty Associates, the international consulting firm headed by former Secretary of State Henry Kissinger and former White House Chief of Staff Thomas “Mack” McLarty. At Kissinger McLarty, Ms. Ennis was responsible for implementing strategies for international business clients on proprietary trade matters, primarily in Vietnam and Japan.
Before entering the private sector, Ms. Ennis held several positions in the US Government. From 1992 to 1996, Ms. Ennis was a legislative aide to former U.S. Senator John Breaux, working on international trade and commerce. She also worked on health care issues during the Senate’s consideration of President Bill Clinton’s health care reform, an issue on which Senator Breaux actively worked to broker a compromise.
At the Office of the US Trade Representative from 1996 to 2000, Ms. Ennis first worked in Congressional Affairs on Asia issues, including annual approvals of China’s most favored nation status and the ill-fated 1997 push to renew presidential “fast track” negotiating authority. Beginning in 1998, she was assistant to Deputy US Trade Representative Richard Fisher, who led US trade negotiations and enforcement with Asia, the Americas, and on intellectual property rights.
Interview Part
Sheng Lu: Our students wonder whether increased trade with China is good or bad for the U.S. economy. Many of them consider the U.S. trade deficit with China to be a serious problem and they are worried about the loss of U.S. jobs to China. What’s your view and insights?
Erin Ennis: We should be realistic about what trade balance data shows and what it doesn’t. There is almost no correlation between a high US trade deficit and a strong US economy. In fact, we tend to have the lowest trade deficits when our economy is doing the worst – take a look at the data from the recent global recession between 2009 and 2010 for example versus what the trade deficit looked like in the 1990s when our economy was booming. We also don’t save much of our earnings, which also factors into the data.
Focusing on a single country as the source of our concerns leads to an inaccurate view that what other countries do has more of an effect on our economy than our own domestic policies. We should indeed be concerned about job creation in the US, but to do that, we should be implementing policies that ensure that we have as competitive an economy as possible. That will require a combination of education, energy, tax and other domestic policies. It also requires our economy to be as open as possible and pursuing market openings globally so that US goods and services have opportunities for sales overseas.
Sheng Lu: The USCBC 2014 China Business Environment Survey describes China as “an extremely difficult business environment along with a vital, growing market for foreign businesses”. We all know that China is an emerging market, but what are the top challenges faced by U.S. companies doing business in China?
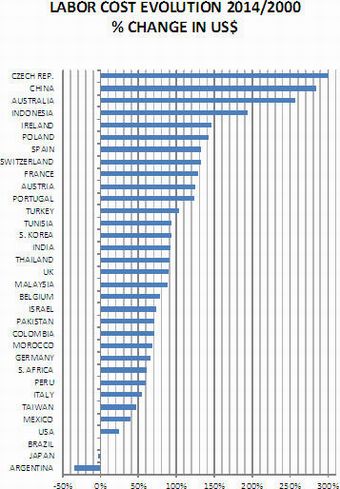
Erin Ennis: Our survey goes into detail about the various challenges that companies experience in China. Competition with Chinese companies was the top issue in 2014, an issue that was not only cited independently, but also factors into several other issues that were cited such as foreign investment restrictions, uneven enforcement of laws, licensing disparities, and discrimination in the market. IPR enforcement is also a top concern for companies. Beyond those, there are also issues that both Chinese and foreign companies are grappling with in the market: a very tight labor market and significant increases in the cost of doing business.
Sheng Lu: Related to the previous question, two numbers in the USCBC survey seem to be very interesting: Although 90 percent of respondents consider rising costs in China a concern, only 14 percent of respondents say they actually reduced or stopped planned investment in China in the past year. How to explain this phenomenon?
Erin Ennis: The simple answer is that companies don’t make decisions on where to do business solely on cost. Most companies report that they are doing business in China to access Chinese customers. While costs may have increased, their opportunities for increased sales have increased too. China’s market grew at about 7% in 2014 – still a rapid rate of growth, even though it is slower than in previous years. Companies are likely to stay in the market, even as costs increase, to continue to access those opportunities.
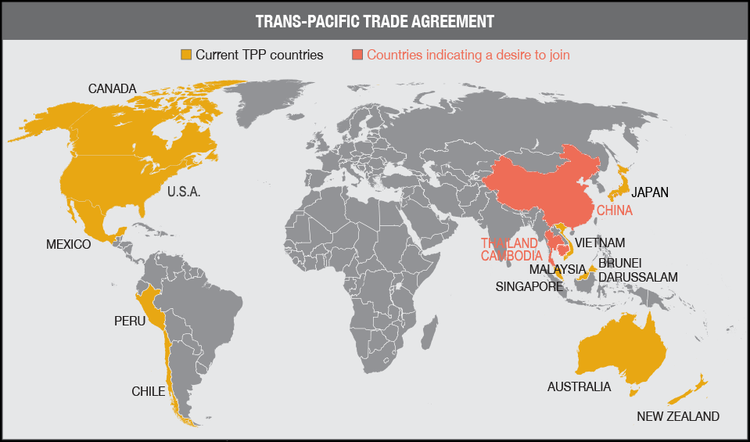
Sheng Lu: While it is under heated discussion whether China should join the Trans-Pacific Partnership (TPP) or not, USCBC suggests that a successful conclusion of the Bilateral Investment Treaty (BIT) negotiations should be the top priority in the US-China economic relationship. What is BIT and why does it matter for U.S. companies?
Erin Ennis: The short answer is that a BIT matters because it will require China to provide the same treatment to foreign companies that it provides to domestic ones and it will require China to open many sectors of its economy to foreign investment that remain closed. More detailed explanations of what the BIT is and why it matters can be found on USCBC’s website here: https://www.uschina.org/advocacy/bilateral-investment-treaty.
Sheng Lu: December 2015 will mark the 15th anniversary of China’s accession to the World Trade Organization (WTO). In your view, what are the most important changes in US-China economic relations since China joins the WTO?
Erin Ennis: China’s WTO access required it to open significant parts of its economy to foreign companies. In general China has done a good job of implementing those commitments. As a consequence, China has grown to be the United States’ third largest trading partners after Canada and Mexico, with whom we have a free trade agreement. More needs to be done, however, to open China’s market. The US-China BIT negotiations will be a useful tool in achieving that goal.
Sheng Lu: China’s recent sweeping anti-graft campaign has attracted the world attention. How does the US business community look at this campaign? Will this campaign have any long-term impact on China’s business environment?
Erin Ennis: In general, the anticorruption campaign is viewed very positively by foreign companies because it is an additional way to ensure that all companies are treated equally in China – bribes and other illegal activities should never be tolerated. To date, the only impact that foreign companies have reported is that it takes longer to get some projects or licenses approved because Chinese officials are being overly cautious in ensuring that there is no appearance of impropriety. Those kinds of delays are ones that companies are willing to deal with.
Sheng Lu: Our students wonder if China presents as a career opportunity for them as well. What’s your observation and do you have any suggestions for our students interested in working/interning in China?
Erin Ennis: If you are serious about working in China, then learning Chinese should be at the top of your to do list – but the same could be said about going to work in any foreign country: learn their language. Beyond that, go to China and experience it. There are plenty of ways to do both of those, but language and on the ground experience will establish your credibility as someone who is serious about the specific opportunities in China, rather than someone who just wants a chance to live in a different country. Final suggestions: read as much as you can and question what you read. China is not a monolith and, as anywhere, there are always multiple sides to every story – that’s especially true in business and politics. Having an informed view of those dynamics will serve you well.
–The End–

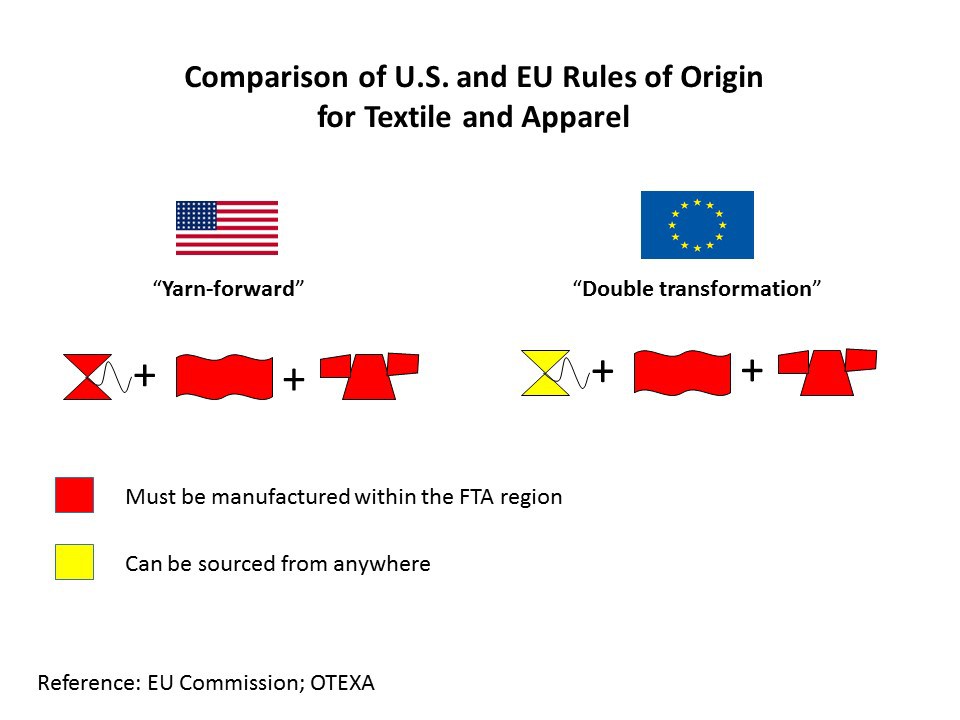
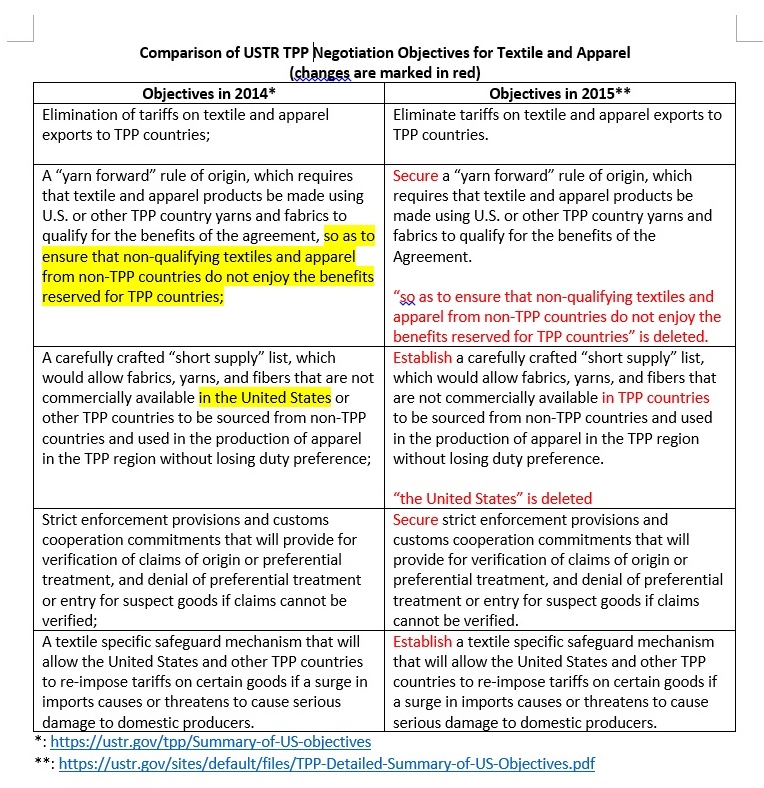 Does the change imply that the U.S. side has agreed to allow more exceptions to the “yarn-forward” rules of origin in TPP, but in the format other than “short supply list”? For example, will it be “earned import allowance” or tariff preference level (TPL)?