A group of eminent panelists will bring their experience on how digital technologies are changing international trade and how international trade cooperation can help governments reap the benefits and address the challenges of digital trade.
Speakers/Panalists:
Roberto Azevêdo, Director-General, World Trade Organization
While U.S. textile manufacturers and the apparel and retail
industries have expressed overall support for the newly reached
US-Mexico-Canada Free Trade Agreement (USMCA or NAFTA2.0), textile producers
and the apparel sector still hold divergent views on certain provisions:
Textile “Yarn-Forward”
Rule of Origin
USMCA vs. NAFTA1.0: The
USMCA will continue to adopt the “yarn-forward” rules of origin. The USMCA will
also newly require sewing thread, coated fabric, narrow elastic strips, and
pocketing fabric used in apparel and other finished products to be made in a
USMCA country to qualify for duty-free access to the United States.
U.S. textile industry: U.S.
textile manufacturers almost always support a strict “yarn-forward” rules of
origin in U.S free trade agreements and
they support eliminating exceptions to the “yarn forward” rule as well. The
National Council of Textile Organization (NCTO) estimates that a yearly USMCA
market for sewing thread and pocketing fabric of more than $300 million.
U.S. apparel and retail
industries: The U.S. apparel industry opposes “yarn forward” and argues
that apparel should be considered of
North American origin under a more flexible regional “cut and sew” standard,
which would provide maximum flexibility for sourcing, including the use of
foreign-made yarns and fabrics.
Tariff Preference
Levels (TPL) for Textiles and Apparel
USMCA vs. NAFTA1.0: With some adjustments, the USMCA would continue a program that allows duty-free access for limited quantities of wool, cotton, and man-made fiber apparel made with yarn or fabric produced or obtained from outside the NAFTA region, including yarns and fabrics from China and other Asian suppliers.
U.S. textile industry: The
textile industry contends China is a major
beneficiary of the current NAFTA TPL mechanism, and it strongly pushed for its
complete elimination in the USMCA.
U.S. apparel and retail
industries: U.S. imports of textiles and apparel covered by the tariff preference level mechanism supply 13% of
total U.S. textile and apparel imports from Canada and Mexico. Apparel
producers assert that these exceptions give regional producers flexibility to
use materials not widely produced in North America.
Viewpoints on other Provisions in USMCA
U.S. textile industry: The
U.S. textile industry also opposes the USMCA newly allows visible lining fabric
for tailored clothing could be sourced
from China or other foreign suppliers, and it would permit up to 10% of a
garment’s content, by weight, to come from outside the USMCA region (up from 7%
in NAFTA1.0). The U.S. textile industry also welcomes that the USMCA would add specific textile verification and
customs procedures aimed at preventing fraud and transshipment. Additionally, the U.S. textile industry is also pleased
that the USMCA would end the Kissell
Amendment. The Kissell Amendment is an exception in NAFTA that allows
manufacturers from Canada and Mexico to qualify as “American” sources when Department
of Homeland Security (DHS) buys textiles, clothing, and footwear using
appropriated funds (about $30 million markets
for textiles, clothing, and shoes altogether).
U.S. apparel and retail
industries: Apparel importers are of
concern that the USMCA continue to incorporate the existing NAFTA short
supply procedure, which is extremely difficult to get a new item approved and
added to the list, limiting their flexibility to source apparel with inputs
from outside North America.
Finally, the report argues that “Regardless of whether the USMCA takes effect, the global competitiveness of U.S. textile producers and U.S.-headquartered apparel firms may depend more on their ability to compete against Asian producers than on the USMCA trade rules.”
Last week in FASH455, we discussed the unique critical role played by textile and apparel trade in generating economic growth in many developing countries. The developed countries also use trade policy tools, such as trade preference programs, to encourage the least developed countries (LDCs) making and exporting more apparel. However, a debate on these trade programs is that they have done little to improve the genuine competitiveness of LDCs’ apparel exports in the world marketplace, but instead have made LDCs rely heavily on these trade programs to continue their apparel exports. Here is one more example:
With growing concerns about “the deterioration of democracy, respect for human rights and the rule of law in Cambodia”, in a statement made on February 12, 2019, the European Union says it has started the process that could lead to a temporary suspension of Cambodia’s eligibility for EU’s Everything But Arms (EBA) program. Specifically, the EU process will include the following three stages:
Stage 1: six
months of intensive monitoring and engagement with the Cambodian government;
Stage 2: another three months for the EU to produce a
report based on the findings in stage 1
Stage 3: after
a total of twelve months in stages 1
& 2, the EU Commission will conclude the procedure with a final decision on
whether or not to withdraw tariff preferences; it is also at this stage that
the Commission will decide the scope and duration of the withdrawal. Any
withdrawal would come into effect after a further six-month period.
However, the EU
Commission also stressed that launching the temporary withdrawal procedure does
not entail an immediate removal of Cambodia’s preferential access to the EU
market, which “would be the option of last resort.”
Developed in 2001, the EBA program establishes duty-free and quota-free
treatment for all Least Developed Countries (LDCs) in the EU market. EBA includes
almost all industries other than arms and armaments. As of February 2019, there
are 49
EBA beneficiary countries.
The EBA program has benefited the apparel sector in particular given clothing accounts for the lion’s share in many LDCs’ total merchandise exports. Because of the preferential duty benefits provided by EBA, many LDCs can compete with other competitive apparel powerhouses such as China. Notably, the EBA program also adopts the “cut and sew” rules of origin for apparel, which is more general than the “double transformation” rules of origin typically required by EU free trade agreement and trade preference programs. Under the “cut and sew” rule, Cambodia’s apparel exports to the EU can enjoy the import duty-free treatment while using yarns and fabrics sourced from anywhere in the world.
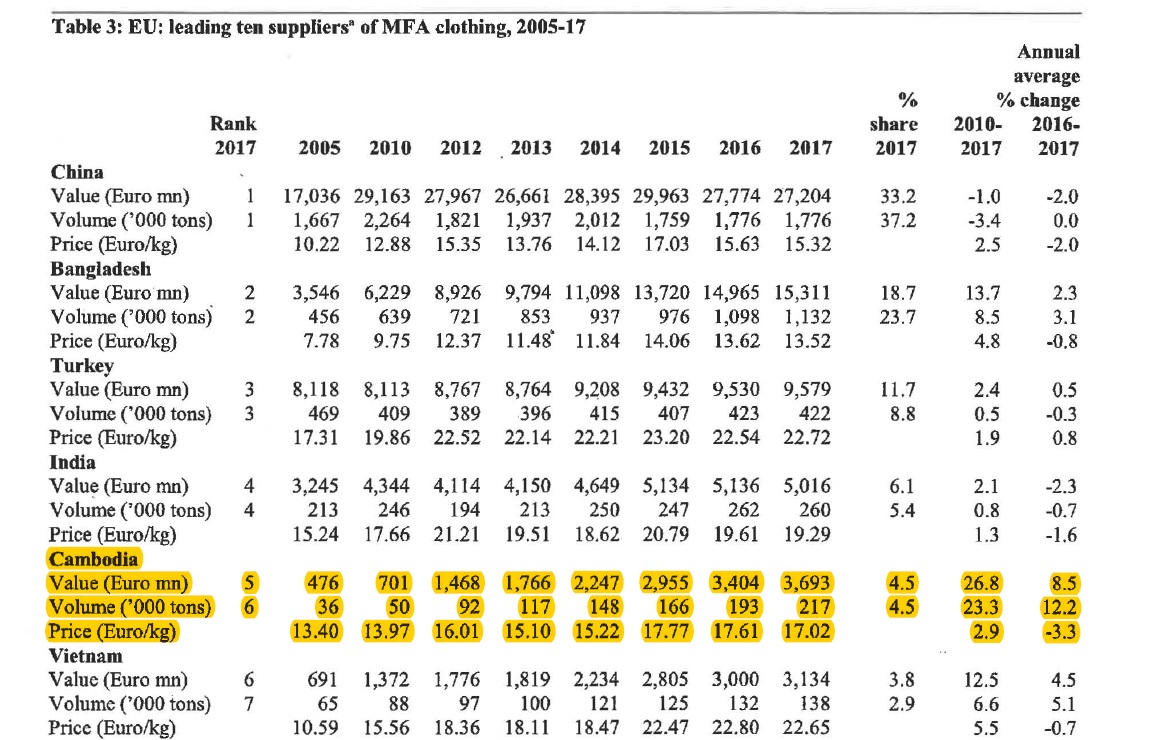
Cambodia is a major apparel supplier for the EU market, accounting for approximately 4% of EU’s
total apparel imports in 2017. Exporting
apparel to EU through the EBA program is also of particular importance to
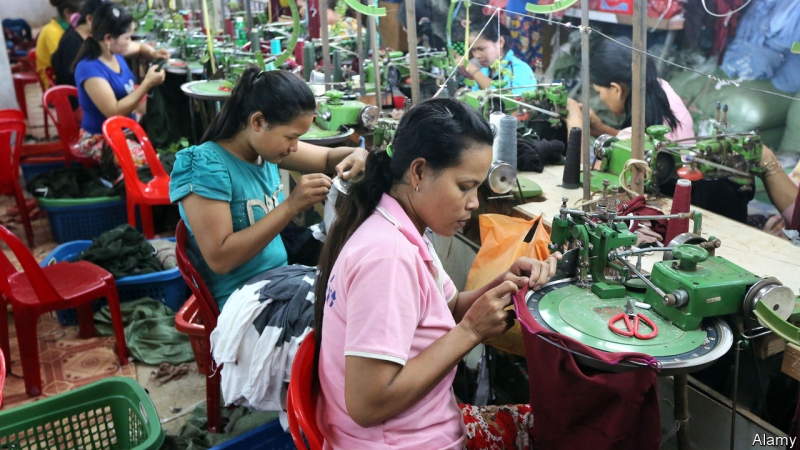
Cambodia economically. In 2016, the apparel sector created over 500,000
jobs in Cambodia, of whom 86% were female, working in 556 registered factories.
According to Eurostat, of EU’s €4.9bn imports from Cambodia in 2017, around 74.9% were apparel (HS chapters 61 and
62). Meanwhile, of EU’s €3.7bn apparel imports from Cambodia in 2017, as high
as 96.6% claimed the EBA benefits. Understandably,
losing the EBA eligibility could hurt Cambodia’s apparel exports to the EU significantly.
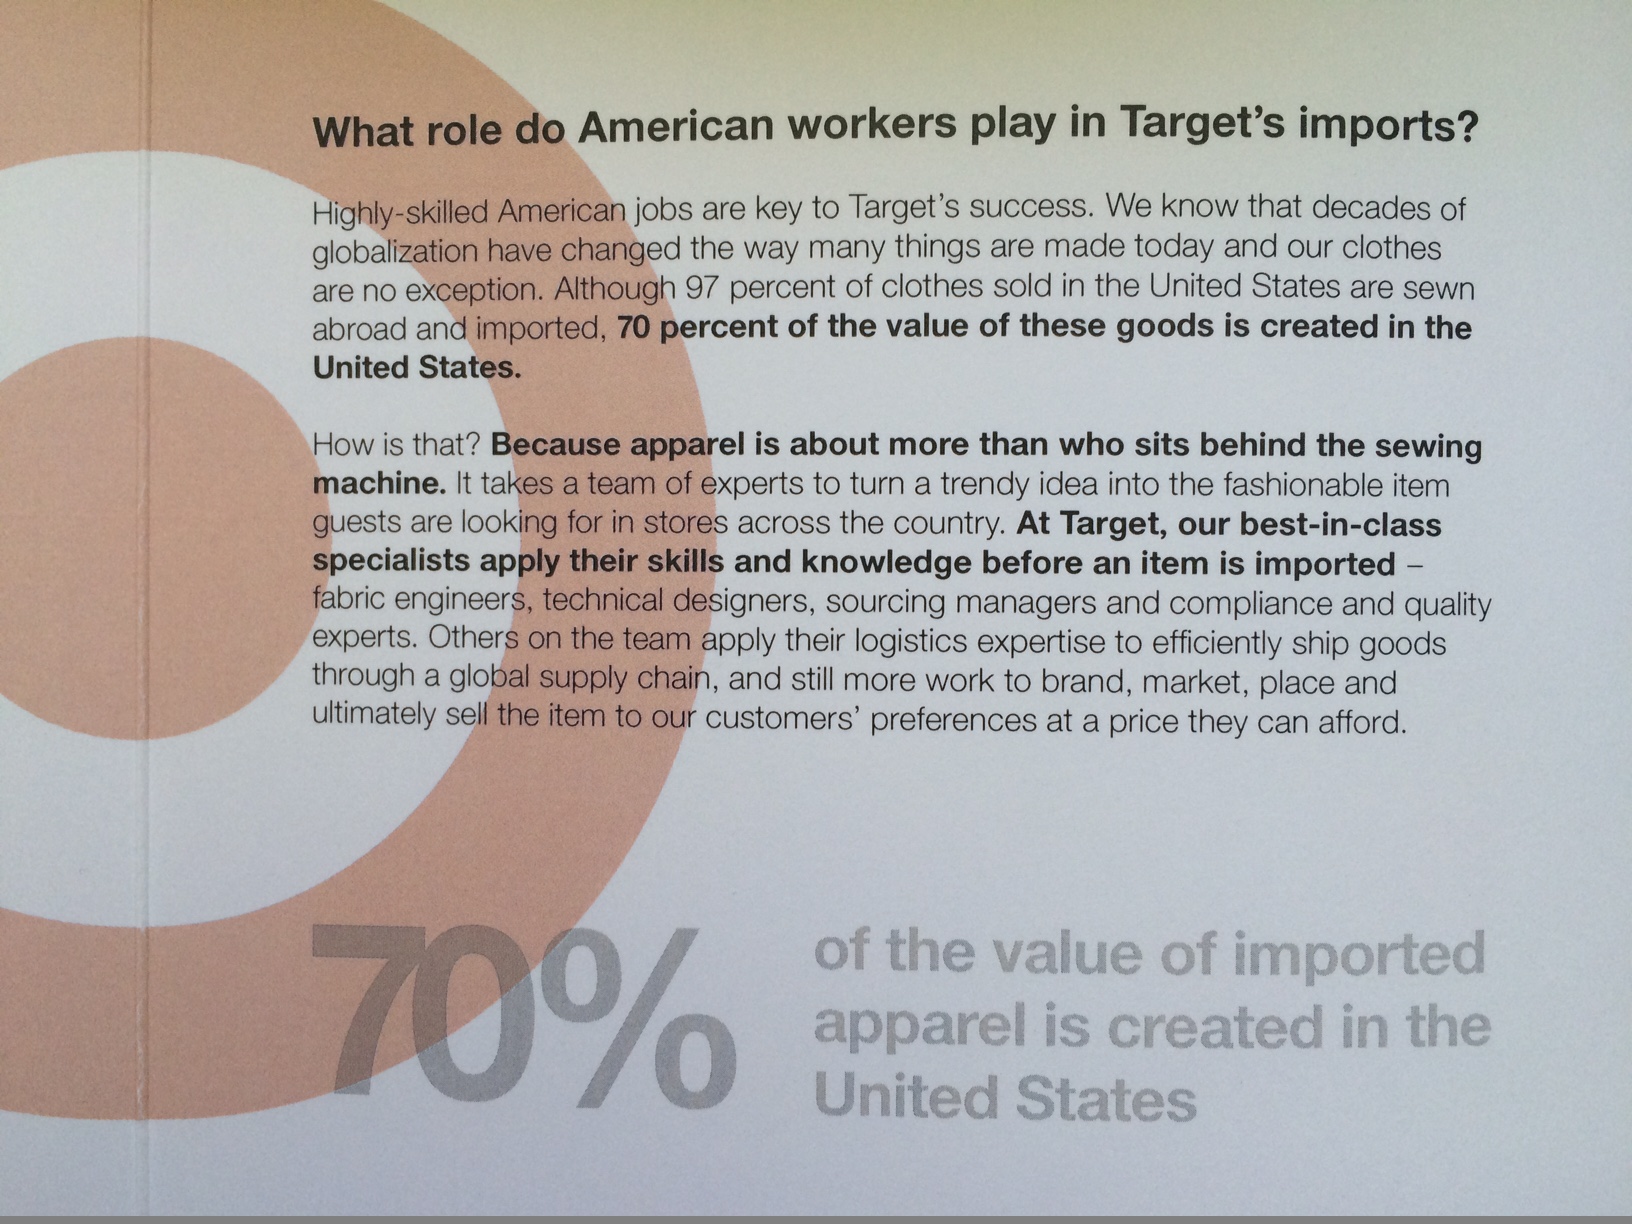
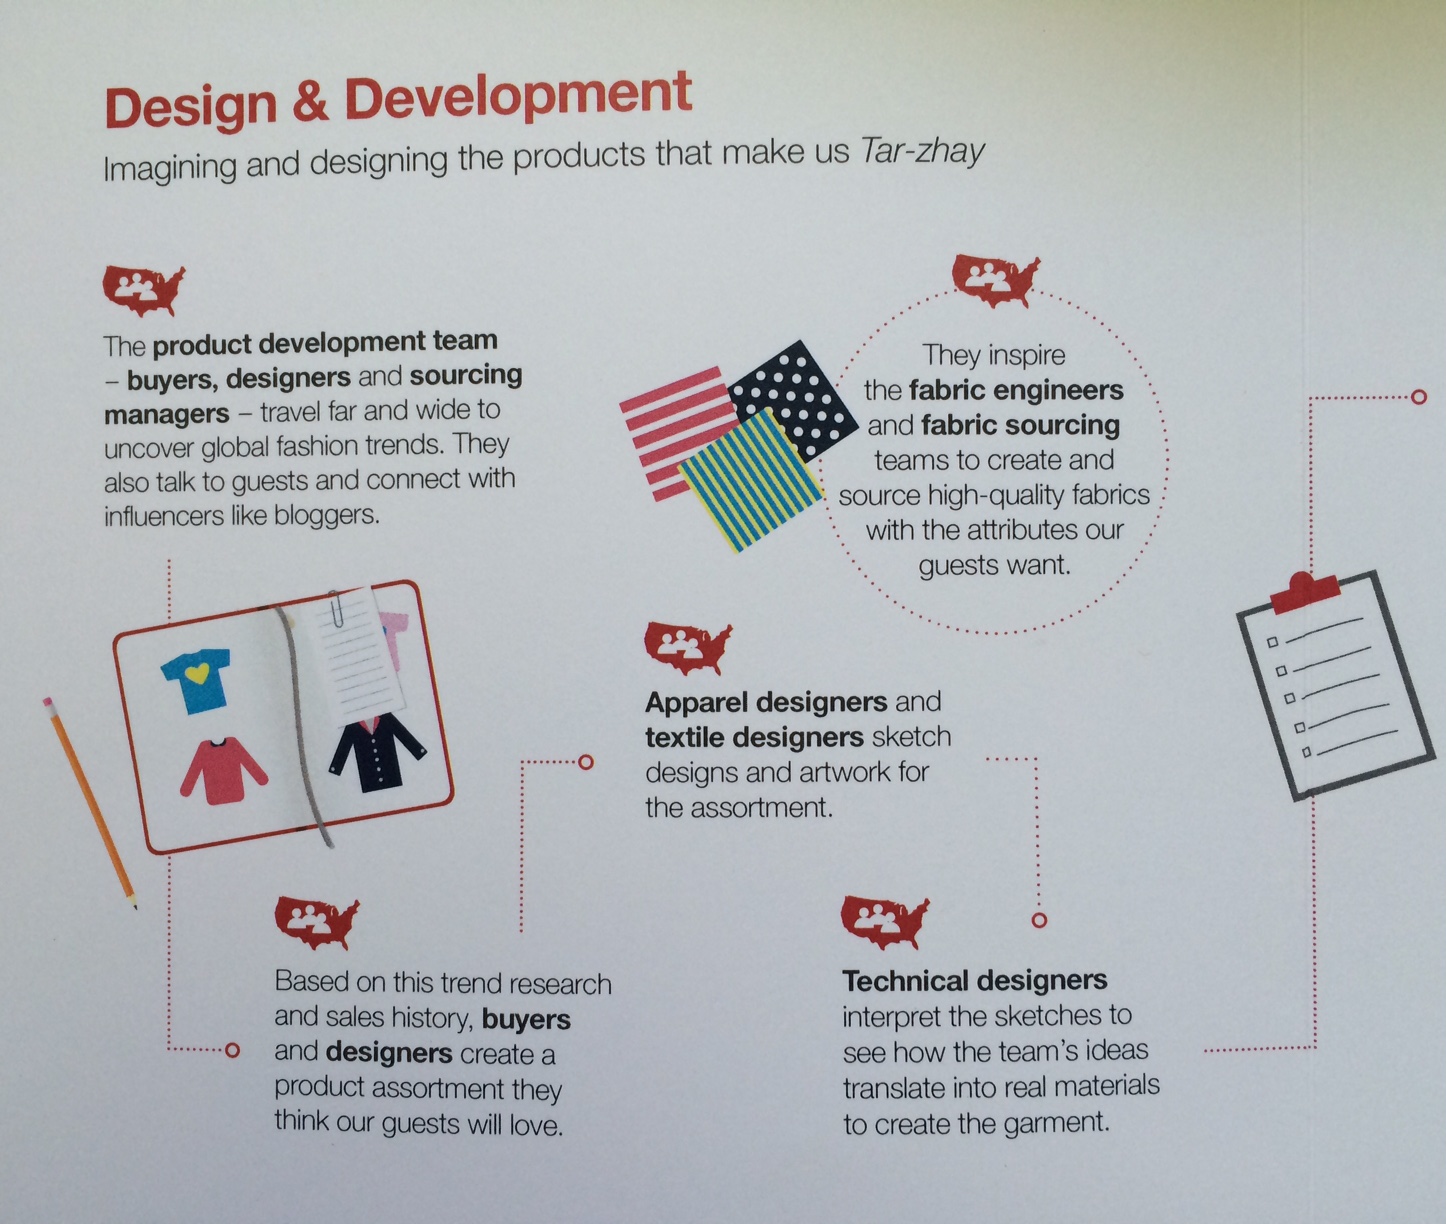
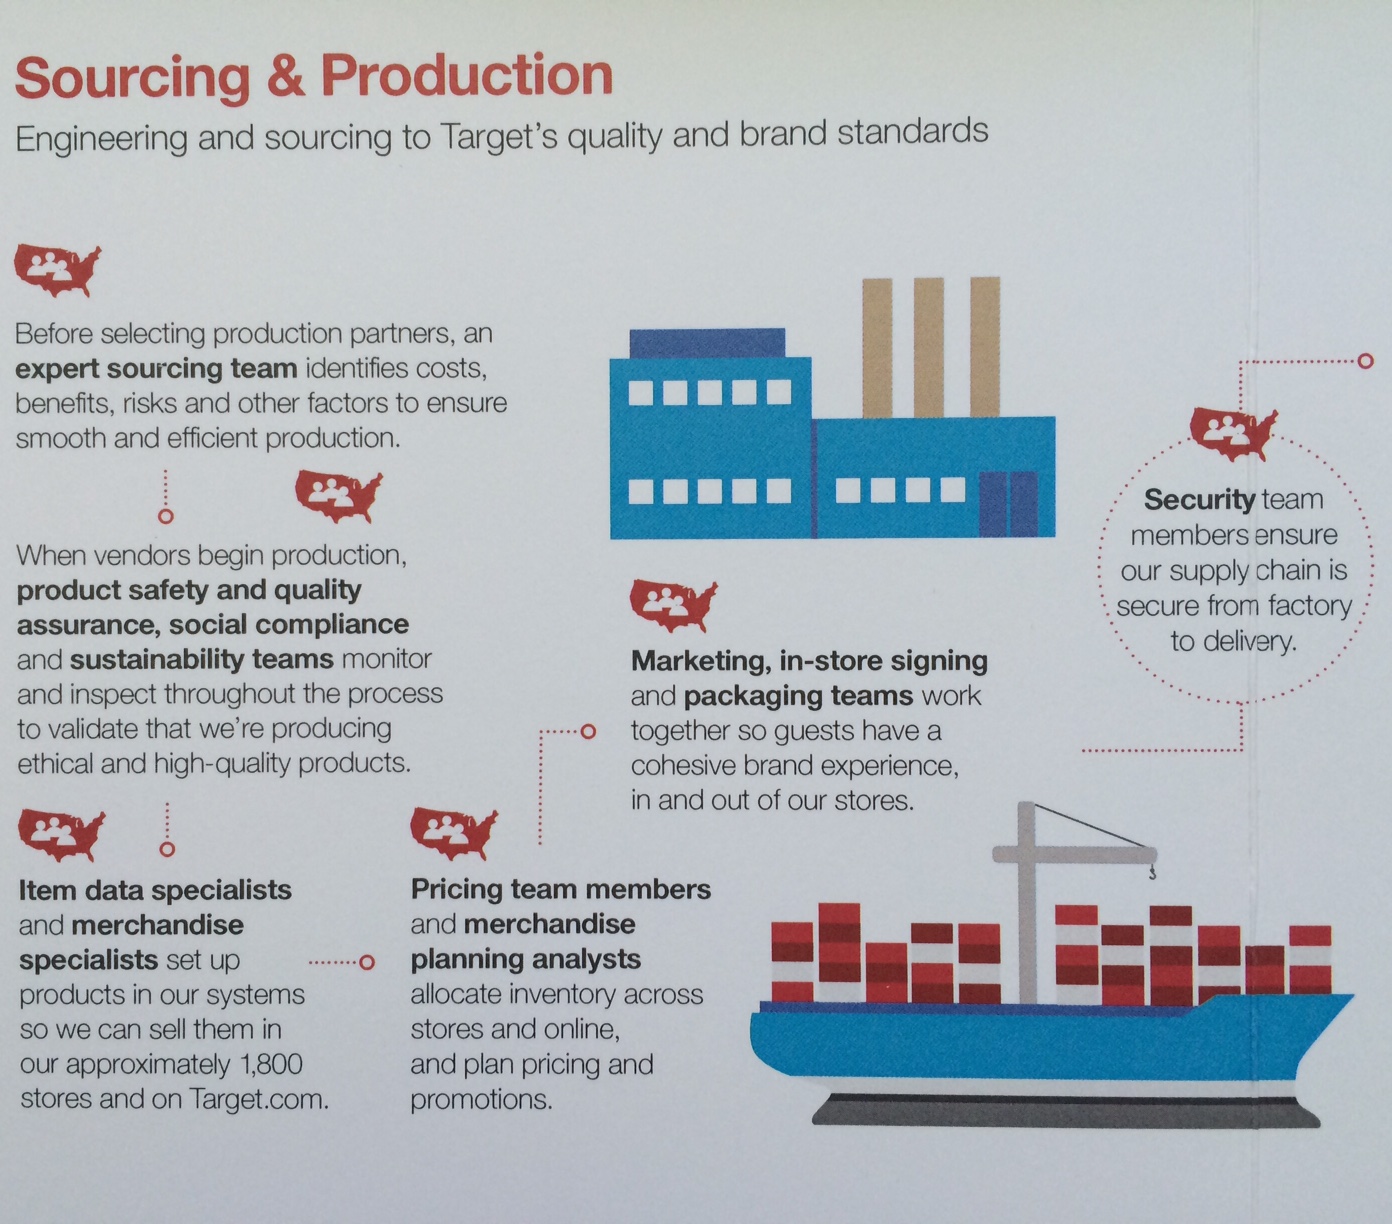
A global view in mind means more career opportunities: except material production and cut and sew, other well-paid jobs in the apparel value chain stay in the United States.
Source: Moongate Association (2017). Analyzing the Value Chain for Apparel Designed in the United States and Manufactured Overseas
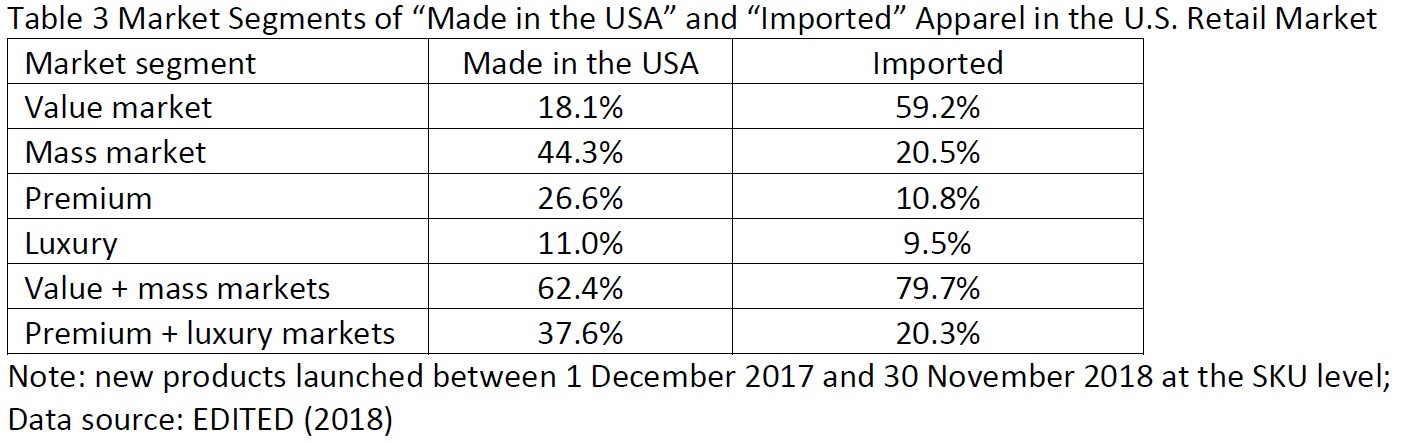
While the majority of apparel consumed in the United States come from overseas, “Made in the USA” is growing in popularity. According to the 2018 U.S. Fashion Industry Benchmarking Study released by the U.S. Fashion Industry Association (USFIA) in July 2018, around 46 percent of surveyed U.S. fashion brands and apparel retailers report currently sourcing “Made in the USA” products, even though local sourcing typically only account for less than 10 percent of these companies’ total sourcing value or volume. Likewise, the State of Fashion 2019 report published by Business of Fashion (BOF) and McKinsey & Company in November also forecasts that over 20 percent of U.S. fashion companies’ sourcing volume could be from nearshore by 2025, thanks to automation technology and consumers’ increasing demand for speed to market.
However, the detailed practice of the “Made in the USA” apparel sourcing strategy–including who is sourcing, what products are sourced, and what the typical price range of these products remain largely unknown.
To answer these questions, we recently analyzed the pricing, product assortment and inventory information of over 90,000 fashion retailers and 300,000,000 fashion apparel products at the Stock-Keeping Unit (SKU) level based on EDITED, a big data and business analytics tool developed for the fashion industry. For the research purpose, we selected apparel products newly launched to the U.S. market in the past twelve months (i.e., between 1 December 2017 and 30 November 2018) with “Made in the USA” explicitly mentioned in the product description. Below are the key findings:
First, “Made in the USA”
apparel overall are treated as a niche product in U.S. fashion brands and
retailers’ sourcing portfolio.
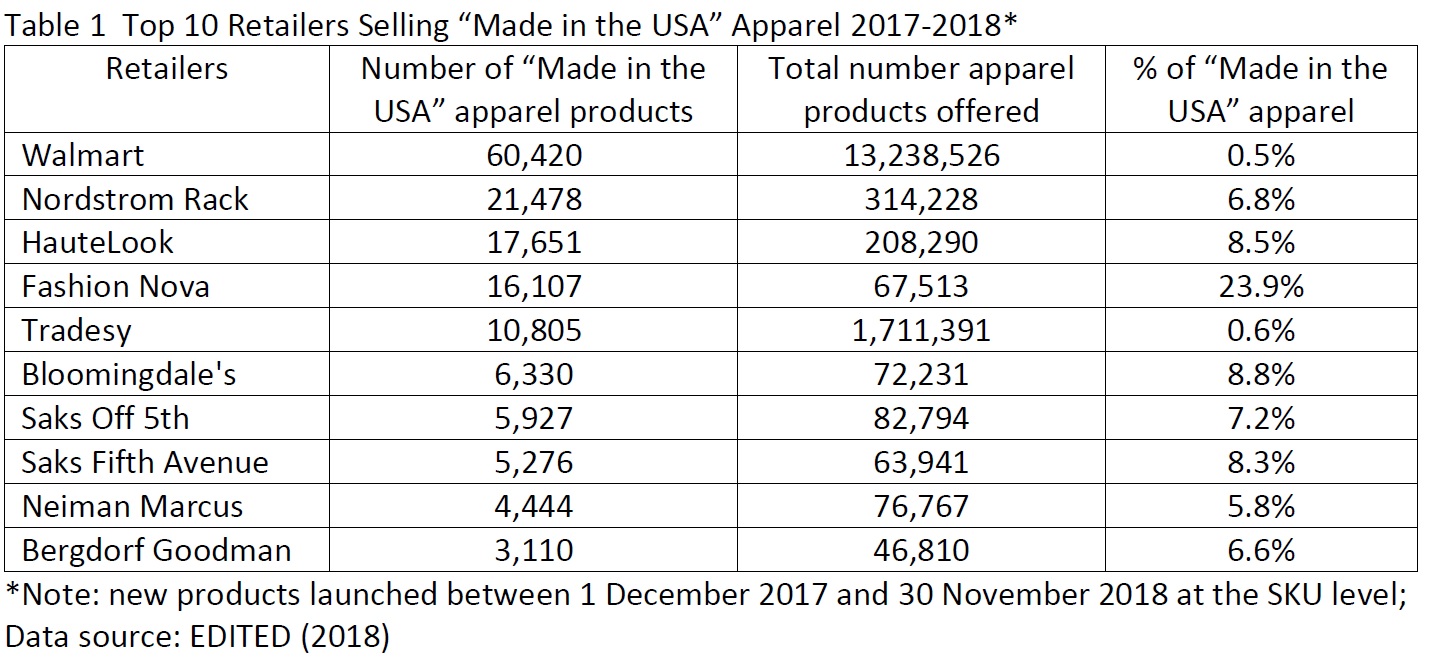
During
the 12 months we examined (1 December 2017-30 November 2018), 94 out of the
total 348 retailers (or 27 percent) sold “Made in the USA” apparel in the U.S.
market. The top 10 sellers list includes BOTH retailers that focus on the value
market such as Walmart and relatively high-end department stores such as
Bloomingdale and Saks Fifth Avenue. However, even for these top sellers, “Made
in the USA” apparel accounted for less than 8 percent of their total product
offers on average.
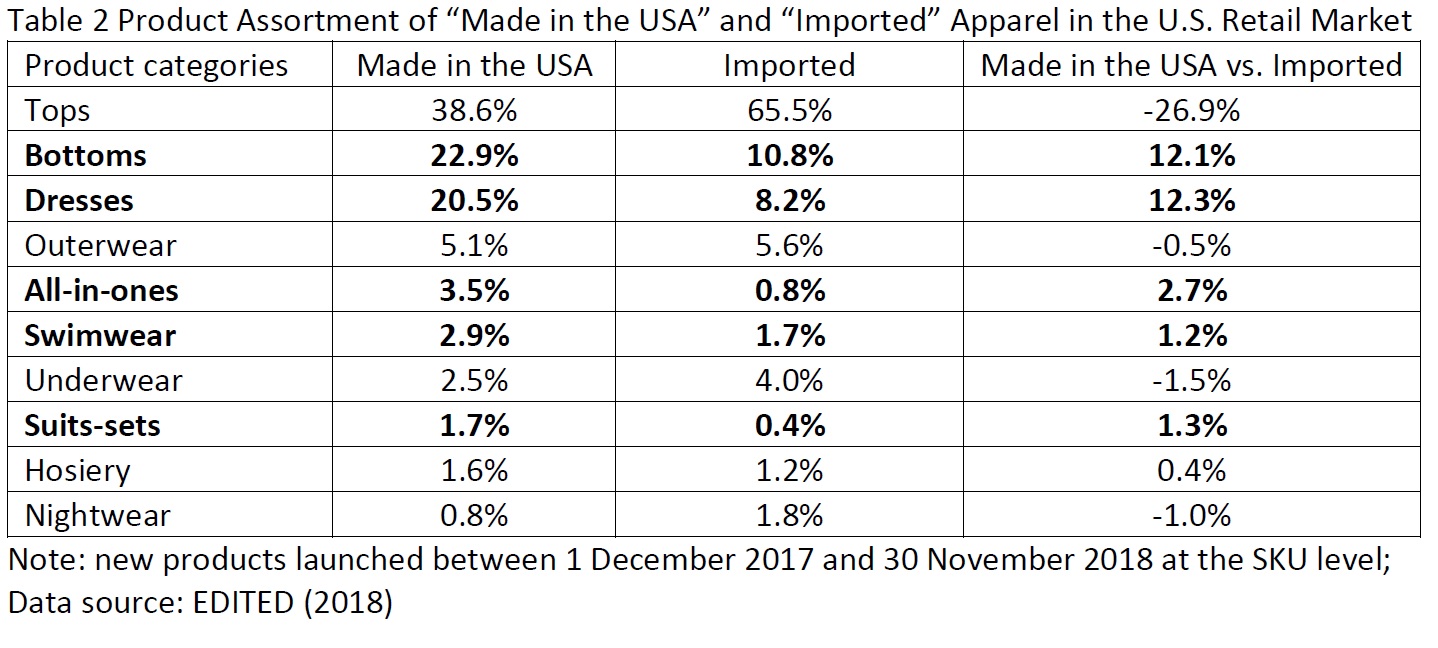
Second, U.S. fashion brands and retailers are most
likely to source“Made in the
USA” apparel for relatively fashion-oriented items, particularly bottoms (such
as skirts, jeans, and trousers), dresses, all-in-ones (such as playsuits and
dungarees), swimwear and suits-sets.
The competitive
edge for these product categories in the retail market, in general, increasingly depends on unique designs, high
product quality, and speed to market,
which makes sourcing from the United States commercially beneficial. In comparison, imported products are more concentrated
on basic fashion items often competing on price in the U.S. retail market,
including tops (such as T-shirt and polo shirt), underwear, and nightwear.
It is also interesting to note that
“Made in the USA” apparel were predominately women’s wear (92 percent), whereas imported
clothing adopted a more balanced gender combination (63 percent women’s wear
and 37 percent men’s wear). Because the fashion trends for women’s wear usually
are shorter-lived and harder to predict, this result once again indicates that seeking
quick response and shorter lead time for stylish and trendy items could be an
important incentive for local sourcing by U.S. fashion brands and retailers.
Third, consistent with the common perception,
“Made in the USA” apparel overall are pricier than imported ones in the U.S.
retail market.
Taking the U.S.
apparel retail market as a whole, close to 40 percent of “Made in the USA” offering
in the past 12 months targeted the premium or luxury market, compared with only
20 percent of imported products. In
contrast, as few as 18 percent of “Made in the USA” offering were in the value
market, which, however, accounted for approximately 60 percent of all imported apparel
sold in the U.S. market. In totality, it
seems U.S. fashion brands and retailers are purposefully targeting “Made in the
USA” apparel for less price-sensitive segments of the market to balance the
high domestic production cost.
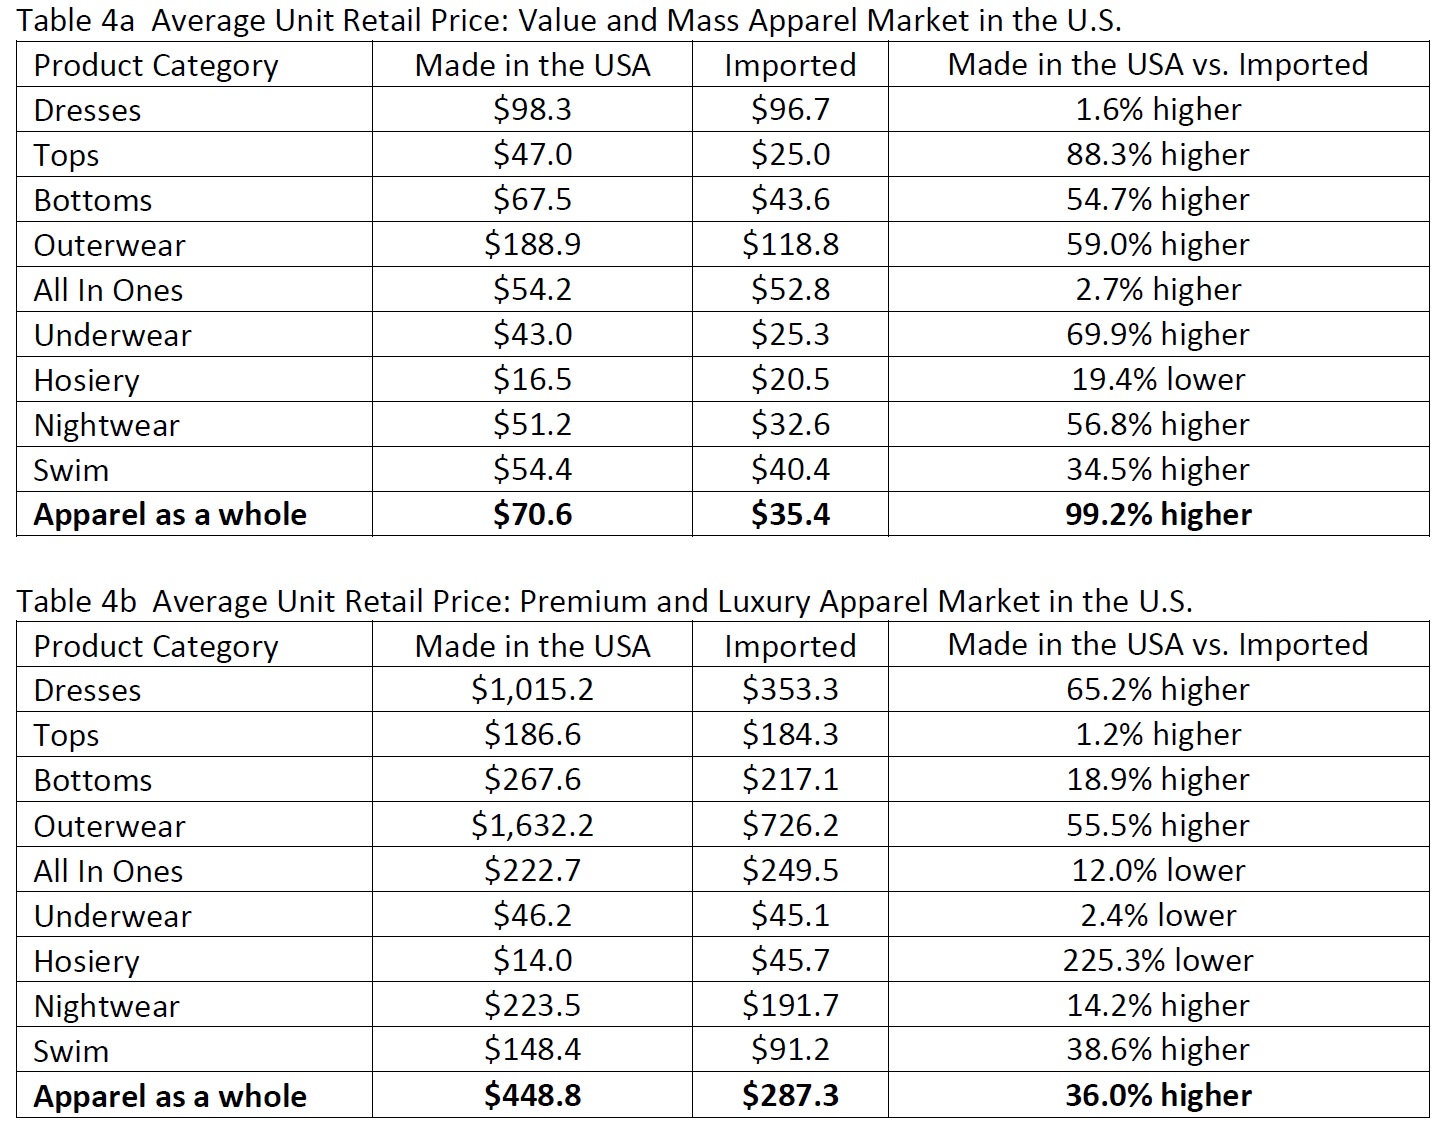
On the other hand, when examining
U.S. fashion brands and retailers’ pricing strategy at the product level, “Made
in the USA” clothing was still priced much higher than imported ones for almost
all major apparel categories, except hosiery. Notably, in the past 12 months, the
average unit retail price of “Made in the USA” clothing was 99.2 percent higher
than imported ones in the value and mass market and 36.0 percent higher in the
premium and luxury market. This interesting phenomenon supports the arguments that
U.S. consumers somehow are willing to pay a premium price for products with the
“Made in the USA” label.
Additionally, during the past 12
months, around 46.3 percent of “Made in the USA” apparel were sold at a
discount compared with more than 54.6 percent of imported ones. The advantage
of proximity to the market, which makes speedy replenishment for in-season items
possible, is an important factor behind the more successful control of
markdowns for “Made in the USA” products. For example, data shows that U.S.
fashion brands and retailers replenished approximately 12.7 percent of their “Made
in the USA” offering in the past 12 months but only 2.8 percent of imported
clothing.
In conclusion, the findings of this study concur with the view that “Made in the USA” apparel are still relevant today. Meanwhile, it does not seem to be the case that “Made in the USA” apparel and imported ones are necessarily competing with each other in the U.S. retail market. With apparel sourcing increasingly requiring striking a balance among various factors ranging from cost, flexibility, compliance to speed to market, it is hopeful that “Made in the USA” apparel will continue to have its unique role to play in U.S. fashion brands and retailers’ merchandising and sourcing strategies.
1: What do you see as the biggest challenges – and opportunities – facing the apparel industry in 2019, and why?
In my view, uncertainty will remain the single biggest challenge facing the apparel industry in 2019, ranging from a more volatile global economy, the unpredictable outlook of the U.S.-China trade talks to the various possible scenarios of Brexit. While uncertainty creates exciting new research opportunities for scholars like me, it could be a big headache for companies seeking a foreseeable market environment to guide their future business plan and investments.
Meanwhile, the increasing digitalization of the apparel supply chain based on big-data tools and artificial intelligence (AI) technologies means a huge opportunity for fashion companies. Indeed, the apparel industry is quickly changing in nature—becoming ever more globalized, supply-chain based, technology-intensive and data-driven. Take talent recruitment as an example. In the 2018 US Fashion Industry Benchmarking Study, which I conducted in collaboration with the US Fashion Industry Association (USFIA), as much as 68 percent of surveyed leading U.S. fashion brands and apparel retailers say they plan to increase hiring of data scientists in the next five years. Googling “apparel industry” together with terms such as “big data” and “data science” also returns much more results than in the past. It is hopeful that the advancement of digital technologies and the smarter use of data will enable apparel companies to overcome market uncertainties better and improve many aspects of their businesses such as speed to market, operational efficiency and even sustainability.
2: What’s happening with sourcing? How is the sourcing landscape likely to shift in 2019, and what can apparel firms and their suppliers do to stay ahead?
Based on my research, I have three observations regarding apparel companies’ sourcing trends and the overall sourcing landscape in 2019:
First, apparel companies overall will continue to maintain a diverse sourcing base. For example, in a recent study, we examined the detailed sourcing portfolios of the 50 largest U.S.-based apparel companies ranked by the Apparel Magazine. Notably, on average these companies sourced from over 20 different countries or regions using more than 200 vendors in 2017. Similarly, in the 2018 US Fashion Industry Benchmarking Study, which I conducted in collaboration with the US Fashion Industry Association (USFIA), we also found companies with more than 1,000 employees typically source from more than ten different countries and regions. Since no sourcing destination is perfect, maintaining a relatively diverse sourcing base allows apparel companies to strike a balance among various sourcing factors ranging from cost, speed, flexibility, to risk management.
Second, while apparel companies are actively seeking new sourcing bases, many of them are reducing either the number of countries they source from or the number of vendors they work with. According to our study, some apparel companies have been strategically reducing the number of sourcing facilities with the purpose of ensuring closer collaborations with their suppliers on social and environmental compliance issues. Some other companies are consolidating their sourcing base within certain regions to improve efficiency and maximize productivity in the supply chain. Related to this trend, it is interesting to note that approximately half of the 50 largest U.S. apparel companies report allocating more sourcing orders to their largest vendor in 2017 than three years ago.
Third, nearshoring or onshoring will become more visible. Take “Made in the USA” apparel for example. According to the 2018 U.S. Fashion Industry Benchmarking Study, around 46 percent of surveyed U.S. fashion brands and apparel retailers report currently sourcing “Made in the USA” products, even though local sourcing typically only account for less than 10 percent of these companies’ total sourcing value or volume. In a recent study, we find that 94 out of the total 348 retailers (or 27 percent) sold “Made in the USA” apparel in the U.S. market between December 2017 and November 2018. These “Made in the USA” apparel items, in general, focus on fashion-oriented women’s wear, particularly in the categories of bottoms (such as skirts, jeans, and trousers), dresses, all-in-ones (such as playsuits and dungarees), swimwear and suits-sets. The advantage of proximity to the market, which makes speedy replenishment for in-season items possible, also allows retailers to price “Made in the USA” apparel substantially higher than imported ones and avoid offering deep discounts. Looking ahead, thanks to automation technology and consumers’ increasing demand for speed to market, I think nearshoring or onshoring, including ”Made in the USA” apparel, will continue to have its unique role to play in fashion brands and retailers’ merchandising and sourcing strategies.
3: What should apparel firms and their suppliers be doing now if they want to remain competitive further into the future? What will separate the winners from the losers?
2019 will be a year to test apparel companies’ resources, particularly in the sourcing area. For example, winners will be those companies that have built a sophisticated but nimble global sourcing network that can handle market uncertainties effectively. Likewise, companies that understand and leverage the evolving “rules of the game”, such as the apparel-specific rules of origin and tariff phase-out schedules of existing or newly-reached free trade agreements, will be able to control sourcing cost better and achieve higher profit margins. Given the heavy involvement of trade policy in apparel sourcing this year, companies with solid government relations should also enjoy unique competitive advantages.
On the other hand, as apparel business is changing in nature, to stay competitive, apparel companies need to start investing the future. This includes but not limited to exploring new sourcing destinations, studying the changing consumer demographics, recruiting new talents with expertise in emerging areas, and adopting new technologies fitting for the digital age.
4: What keeps you awake at night? Is there anything else you think the apparel industry should be keeping a close eye on in the year ahead? Do you expect 2019 to be better than 2018, and why?
Two things are at the top of my watchlist:
First, what is the future of China as an apparel sourcing base? While external factors such as the U.S.-China tariff war have attracted most of the public attention, the genuine evolution of China’s textile and apparel industry is something even more critical to watch in the long run. From my observation, China is playing an increasingly important role as a textile supplier for apparel-exporting countries in Asia. For example, measured by value, 47 percent of Bangladesh’s textile imports came from China in 2017, up from 39 percent in 2005. Similar trends are seen in Cambodia (up from 30 percent to 65 percent), Vietnam (up from 23 percent to 50 percent), Pakistan (up from 32 percent to 71 percent), Malaysia (up from 25 percent to 54 percent), Indonesia (up from 28 percent to 46 percent), Philippines (up from 19 percent to 41 percent) and Sri Lanka (up from 15 percent to 39 percent) over the same time frame. A key question in my mind is how quickly China’s textile and apparel industry will continue to evolve and upgrade by following the paths of most other advanced economies in history.
Second, how will the implementation of several newly-reached free trade agreements (FTAs) affect the big landscape of apparel sourcing and the existing regional apparel supply chains? For example:
The newly-reached U.S.-Mexico-Canada Free Trade Agreement (USMCA or commonly called NAFTA2.0) includes several interesting changes to the textile and apparel specific rules of origin provisions, such as the adjustment of the tariff-preference level (TPL) mechanism. Whether these changes will boost textile and apparel production in the Western-Hemisphere and attract more sourcing from the region will be something interesting to watch.
The implementation of the Comprehensive and Progressive Agreement of the Trans-Pacific Partnership (CPTPP)and the EU-Vietnam Free Trade Agreement (EVFTA)will allow Vietnam to get access to nearly 40% of the world apparel import market (i.e., EU + Japan) duty-free. However, restrained by the country’s relatively small population, the apparel industry is increasingly facing the challenge of competing for labor with other export-oriented sectors in Vietnam. Realistically, what is the growth potential of apparel “Made in Vietnam” after the implementation of CPTPP and EVFTA?
In 2017, close to 80% of Asian countries’ textile imports came from other Asian countries, up from around 70% in the 2000s. Similarly, in 2017, 85.6% of Asian countries’ apparel imports also came from within the region. The negotiation of the Regional Comprehensive and Economic Partnership (RCEP) is likely to conclude in 2019, whose membership includes member states of the Association of Southeast Asian Nations (ASEAN) and other six economies in the Asia-Pacific region (Australia, China, India, Japan, South Korea and New Zealand). Will RCEP result in an ever more integrated Asia-based textile and apparel supply chain and make the Asia region even more competitive as an apparel sourcing destination?
On
October 16, 2018, the Trump
Administration notified U.S. Congress its intention to negotiate the
U.S.-EU Free Trade Agreement. Between
2013 and 2016, the United States and EU were also engaged in the negotiation of
a comprehensive free trade agreement– Trans-Atlantic Trade and Investment Partnership
(T-TIP) with the goal to unlock market access opportunities for
businesses on both sides of the Atlantic through the ambitious elimination of
trade and investment barriers as well as enhanced regulatory coherence. The T-TIP
negotiation was stalled since 2017, although
the Trump Administration has never officially announced to withdraw from the
agreement.
II. Negotiating Objectives
On
January 11, 2019, the Office of the U.S. Trade Representative (USTR) released
thenegotiating
objectives of the proposed U.S.-EU Free Trade Agreement after
seeking inputs from the public. Overall, the proposed agreement aims to address
both tariff and non-tariff barriers and to “achieve fairer, more balanced trade”
between the two sides.
Regarding textiles and apparel, USTR says it will secure duty-free access for U.S. textile and
apparel products and seek to improve competitive opportunities for exports of
U.S. textile and apparel products while taking into account U.S. import
sensitivities” during the negotiation. The proposed U.S.-EU free trade
agreement also will “establish origin procedures for the certification and
verification of rules of origin that promote strong enforcement, including with respect to textiles.” T-TIP
had adopted similar negotiating objectives for the textile and apparel sector.
III. Industry viewpoints on the agreement
As of
January 2019, leading trade associations
representing the U.S. apparel industry and the EU textile and apparel industries
have expressed support for the proposed U.S.-EU Free Trade Agreement. In general,
these industry associations recommend the agreement to achieve the following
goals:
First, eliminate import duties. For example:
American
Apparel and Footwear Association (AAFA): “We
support the immediate and reciprocal elimination of the high duties that both
countries maintain on textiles, travel goods, footwear, and apparel.”…” We also
support the immediate elimination of any retaliatory duties imposed by the
E.U., as well as any duties imposed by the U.S. (that led to that retaliation).
The duties impose costs on activities, including manufacturing activities in
the U.S., and undermine markets for U.S. exporters in Europe.”
European
Apparel and Textile Confederation (Euratex):“The
European Textile and Clothing sector faces high tariffs while exporting to the
US market from 11% to up to 32% for some products, namely sewing thread of
man-made filaments, suits, woven fabrics of cotton, trousers and t-shirts. Zero
customs duties while ensuring modern rules of origin will allow EU companies to
boost exports and offer more choice to American consumers and professional
buyers.”
Second, promote regulatory coherence (Harmonization). For example:
AAFA: “The E.U. and the
United States both maintain an extensive array of product safety, chemical management,
and labeling requirements regarding apparel (including legwear), footwear,
textiles, and travel goods.”…” Yet they often contain different requirements,
such as testing or certification, that greatly add compliance costs.”…” We
believe the U.S.‐E.U. trade agreement presents an important opportunity to achieve
harmonization or alignment for these regulations.”
Euratex: “Maintaining high
level of standards while eliminating unnecessary burdens, removing additional
requirements and facilitating customs procedures that impede business are top
priorities. Mutual recognition of the EU and US standards will preserve high
level of consumer protection on both sides of the Atlantic. Convergence on labelling (fibre
names, care symbols and wool labelling),
consumer safety on children products and flammability standards is key for the
T&C sector.” “EURATEX believes the EU and US standardization bodies should
cooperate on setting standards for Smart Textiles taking into account the
industry views for facilitating development and trade of such products of the
future.”
Third, adopt flexible/modern rules of origin. For example:
AAFA: “We should also support higher usage of the agreement by making sure the rules of origin reflect the realities of the industry today…”the yarn forward” rules, although theoretically promote usage of trade partner inputs, in practice they operate as significant barriers that restrict the ability of companies to use a trade agreement in many cases”…” We need to incorporate sufficient flexibilities into the rules of origin so that different supply chains –and the U.S. jobs they support – can take advantage of the agreement.”
Euratex: “Zero customs
duties while ensuring modern rules of
origin will allow EU companies to boost exports and offer more choice to
American consumers and professional buyers.”
The National Council of Textile Organizations (NCTO), which represents the U.S. textile industry, hasn’t publically stated its position on the proposed U.S.-EU Free Trade Agreement. However, NCTO had strongly urged U.S. trade negotiators to adopt a yarn-forward rule of origin in T-TIP. NCTO also opposed opening the U.S. government procurement market protected by the Berry Amendment to EU companies.
IV. Patterns of U.S.-EU textile and apparel trade
The
United States and the EU are mutually important textile and apparel (T&A)
trading partners. For example, the United States is EU’s largest extra-region
export market for textiles, and EU’s fifth largest extra-region supplier of
textiles in 2017 (Euratex, 2018).
Meanwhile,
the EU is one of the leading export markets for U.S.-made technical textiles as
well as an important source of high-end apparel products for U.S. consumers (OTEXA,
2018). Specifically, in 2017, U.S. T&A exports to the European Union
totaled $2,572 million, of which 73.2% were textile products, such as specialty
& industrial fabrics, felts & other non-woven fabrics and filament
yarns. In comparison, EU’s T&A exports to the United States totaled $4,163
million in 2017, among which textiles and apparel evenly accounted for 48.7%
and 51.3% respectively.
V. Potential economic impact of the agreement
By adopting the Global Trade Analysis Project (GTAP) model, Lu (2017) quantitatively evaluated the potential impact of a free trade agreement between the U.S. and EU on the textile and apparel sector. According to the study:
First,
the trade creation effect of the agreement will expand the EU-U.S.
intra-industry trade for textiles. Meanwhile, the agreement is likely to
significantly expand EU’s apparel exports to the United States.
Second,
the trade diversion effect of the U.S.-EU Free Trade Agreement will affect other
T&A exporters negatively, including Asia’s T&A exports to the U.S. market
and EU and Turkey’s T&A exports to the EU market.
Third, the U.S.-EU Textile and Apparel Trade might affect the intra-region T&A trade in the EU region negatively but in a limited way.
Overall, the study suggests that the EU T&A industry will benefit from the additional market access opportunities created by the U.S.-EU Free Trade Agreement.One important factor is that the U.S. and EU T&A industries do not constitute a major competing relationship. For example, the United States is no longer a major apparel producer, and EU’s apparel exports to the United States fulfill U.S. consumers’ demand for high-end luxury products. The U.S.-EU Free Trade Agreement is also likely to create additional export opportunities for EU textile companies in the U.S. market, especially in the technical textiles area, which accounted for approximately 40% of EU’s total textile exports to the United States in 2017 measured in value. Compared with traditional yarns and fabrics for apparel making purposes, technical textiles are with a greater variety in usage, which allows EU companies to be able to differentiate products and find their niche in the U.S. market.
Further, the study suggests that we shall pay more attention to the details of non-tariff barrier removal under the U.S.-EU Free Trade Agreement, which could result in bigger economic impacts than tariff elimination.
To better understand companies’ latest sourcing practices, we recently examined the detailed sourcing portfolios of the 50 largest U.S.-based apparel companies ranked by the Apparel Magazine. Specifically, we conducted a content analysis of each company’s publicly released annual reports and their financial statements from 2014 to 2017 (the latest information available), with a focus on the following two research questions: 1) How have the sourcing strategies of U.S. apparel companies evolved? 2) How have the evolving sourcing strategies affected companies’ financial performance? Here are the key findings:
First, U.S.
apparel companies overall adopt a diverse sourcing base. Among the 50
companies we examined, on average they sourced from over 20 different countries
or regions using more than 200 vendors in 2017. These results echo the findings
of the 2018 U.S. Fashion Industry Benchmarking Study released by the U.S.
Fashion Industry Association (USFIA) in July. Based on a survey of nearly 30
executives from leading U.S. fashion brands and apparel retailers, the study
also found companies with more than 1,000 employees typically source from more
than ten different countries and regions. Also, larger companies, in general,
adopt a more diverse sourcing base than smaller ones.
Second, while U.S.
apparel companies are actively seeking new sourcing bases, many of them are
reducing either the number of countries they source from or the number of
vendors they work with. Specifically, among the top 50 U.S. apparel
companies examined, around 28 percent increased the number of countries or
regions they use as sourcing bases between 2014 and 2017. However, over the
same period, 52 percent chose to consolidate their existing sources base, but
on a small scale. Likewise, among the top 50 U.S. apparel companies examined,
approximately half reduced the number of vendors they use between 2014 and
2017, compared with 33 percent that chose to source from more vendors.
Third, for risk
control purposes, most U.S. apparel companies avoid relying too much on any
single vendor; however, some companies have begun to allocate more sourcing
orders to its largest vendors. The top 50 U.S. apparel companies we
examined on average assigned no more than 10 percent of their total sourcing
value or volumes to any single vendor in 2017. This practice suggests that
minimizing supply chain risks is a critical consideration of U.S. apparel
companies’ sourcing strategy. Nevertheless, between 2014 and 2017, around 45
percent of apparel companies we examined raised the cap slightly.
Fourth, regarding the financial implications of the adjustment of sourcing strategies, companies that diversified their sourcing bases between 2014 and 2017, in general, were able to reduce sourcing cost and improve gross margin. In comparison, U.S. apparel companies we examined that consolidated their sourcing base between 2014 and 2017 suffered a slight decline in their gross margin percentage.
On the other hand, however, there was no clear pattern between a company’s choice of sourcing strategy and their net profit margin. While multiple factors could come into play, one possible explanation for the results is that that either diversifying or considering the sourcing base would incur additional management cost for the company.
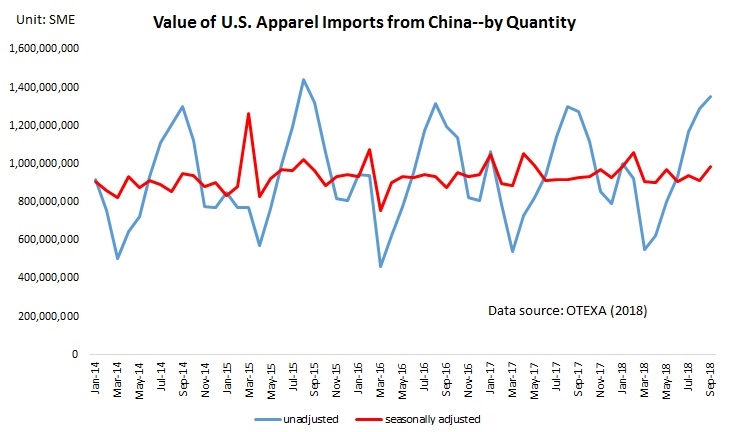
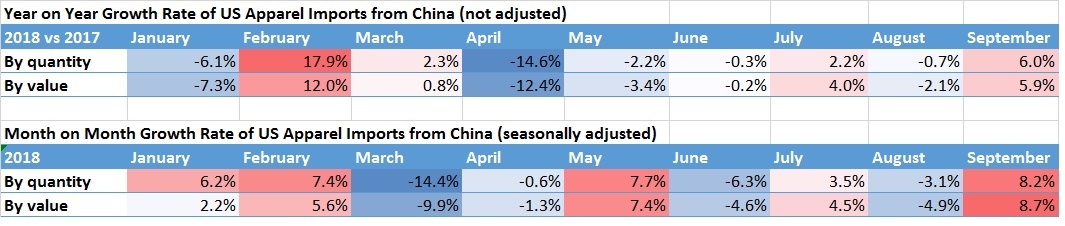
While apparel products are not subject to the Section 301 tariff yet, the trade action nevertheless has created huge market uncertainties for U.S. fashion brands and apparel retailers. Here is how the monthly trade flow of U.S. apparel imports has reflected the impacts of the U.S.-China tariff war:
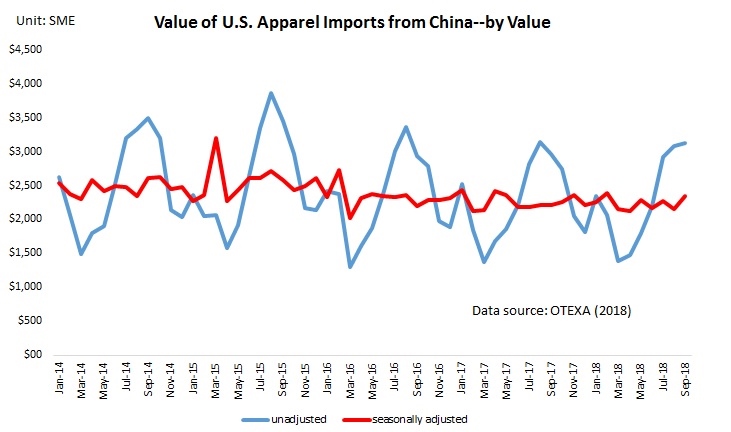
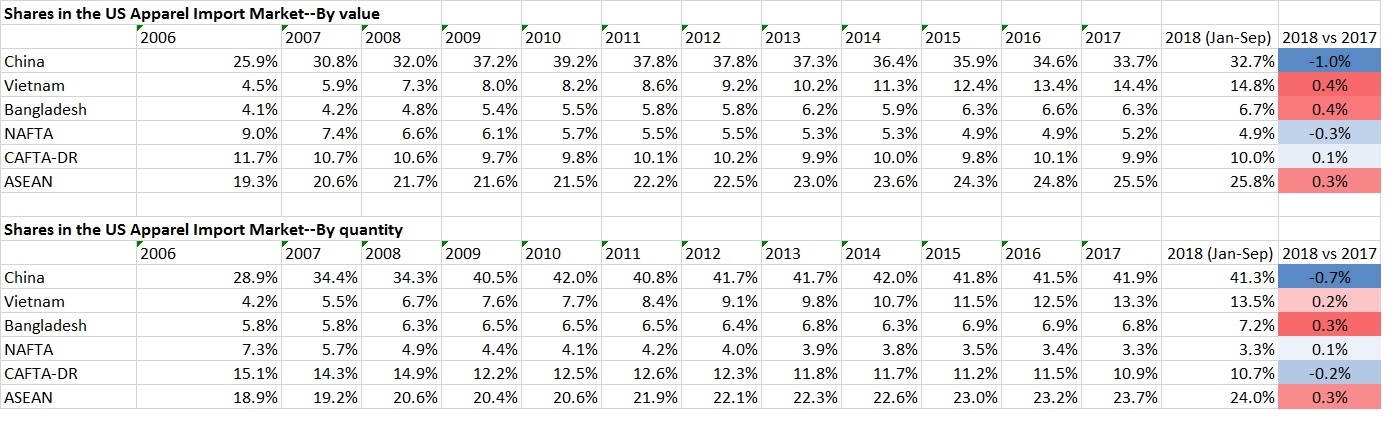
First, U.S. companies did NOT stop importing from China. Seasonally adjusted data shows that between January and September 2018, the value of U.S. apparel imports from China decreased by 0.6 percent in volume and 0.05 percent in value year on year. Despite the decline, China remained the No.1 apparel supplier for the U.S. market in the first nine months of 2018, accounting for 32.3 percent market share in value and 41.3 percent shares in quantity, only marginally dropped by 1 and 0.7 percentage points from a year earlier respectively .
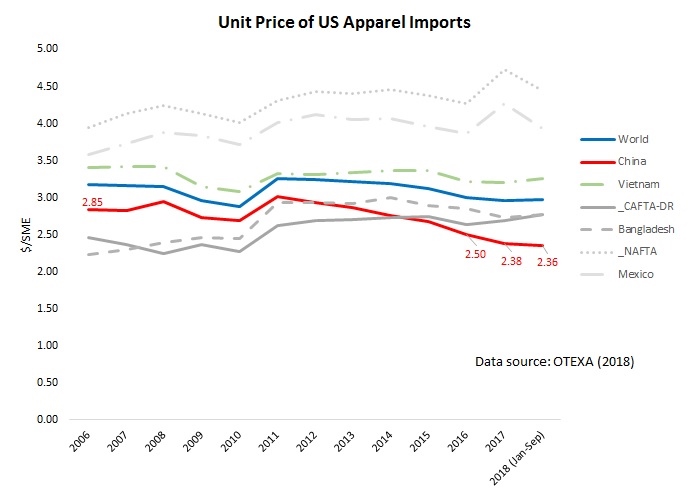
Second, apparel “Made in China” are becoming even cheaper. Notably, the average unit price of U.S. apparel imports from China dropped from $2.5/SME in 2016,$2.38/SME in 2017 to $2.36/SME in the first nine months of 2018. On the one hand, this result suggests that cost concern is not the most influential factor that drives U.S. companies to source less from China. However, it is also likely that Chinese exporters are intentionally reducing their price to keep their orders and overcome the challenges caused by the Section 301.
Third, there is no perfect replacement for “Made in China”. In response to the market uncertainty created by the Section 301 trade action, U.S. apparel importers are diversifying their sourcing base. That being said, it is difficult to identify a single largest beneficiary–notably, the market shares of apparel exports from Vietnam, Bangladesh, NAFTA, and CAFTA regions only marginally increased in the first nine months of 2018 compared with a year ago.
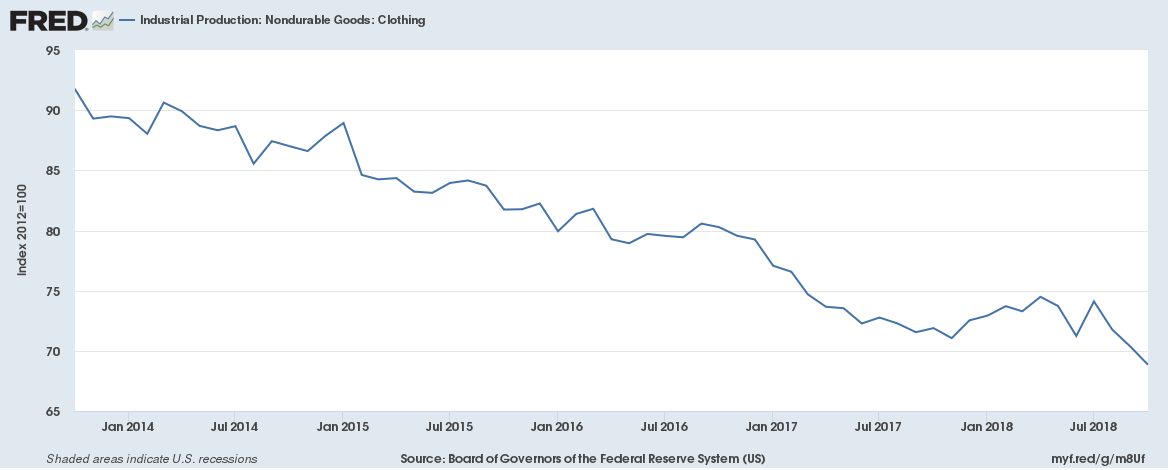
Additionally, it remains unclear whether the section 301 trade action has benefited U.S. textile and apparel manufacturing. Data shows that in the first ten months of 2018, the production index (2012=100) of textile manufacturing in the United States slightly increased from 92.8 in 2017to 94.3. However, over the same period, the index of apparel manufacturing decreased from 73.6 to 72.4.
Looking ahead, the volume of US textile and apparel imports from China is likely to increase in the short run since U.S. importers are eager to complete their sourcing orders before the new tariff hit. Usually, companies place sourcing orders several months ahead of the selling season. However, it will be interesting to see if the trade data in the first half of 2019 will reveal the negative impact of the Section 301 action on China’s apparel exports to the U.S. market.
First, Canada is one of the largest and fastest growing apparel import markets in the world. Data from the UN Comtrade show that the value of Canada’s apparel imports totaled $10.7bn in 2017, which ranked the fifth in the world, only after the European Union (EU), the United States, Japan, and Hong Kong.
Second, the Asian region as a whole is the dominant apparel supplier for Canada. Measured in value, as much as 80.9 percent of Canada’s apparel imports in 2017 came from Asia. Specifically, China (40.6 percent), Bangladesh (11.1 percent), Cambodia (8.1 percent) and Vietnam (7.7 percent) were the top individual supplier for Canada in 2017, and all of them are located in Asia. Meanwhile, Canadian apparel companies are gradually diversifying their sourcing base: the Herfindahl Index (HHI), a commonly adopted measure of market concentration, declined from 0.3 in 2010 to 0.19 in 2017.
Third, the NAFTA-region remains an important apparel-sourcing base for Canada, but its overall influence is in decline. Measured in value, the United States and Mexico were the 6th and 9th top apparel supplier for Canada in 2017 respectively. However, facing the competition from Asia, the United States and Mexico combined accounted for only 6.4 percent of Canada’s apparel imports in 2017, a significant drop from 9.8 percent back in 2007.
Fourth, free trade agreements and trade preference programs provide duty-saving opportunities for apparel sourcing in Canada. In 2017, Canada applied an average tariff rate of 17.1 percent on imports of knitted apparel (HS Chapter 61) and 15.9 percent on woven apparel (HS chapter 62). As of August 2018, Canada has 17 free trade agreements (FTAs) and trade preference programs (TPAs) in force, offering preferential or duty-free market access to Canada. Traditionally, a substantial portion of Canada’s FTA partners come from the Western Hemisphere, such as Chile, Costa Rica, Colombia, Peru, Honduras, and Panama. However, in recent years, Canada has been actively negotiating and reaching new FTAs with countries in Asia (such as South Korea, India, and Japan) and Europe (including the European Union and Ukraine).
Compared with the United States, in general, Canada adopts more liberal rules of origin (RoO) for apparel products. Quite a few Canada FTAs allow companies to source yarns or even fabrics from anywhere in the world – with the finished products still enjoying duty-free treatment when exported to Canada.
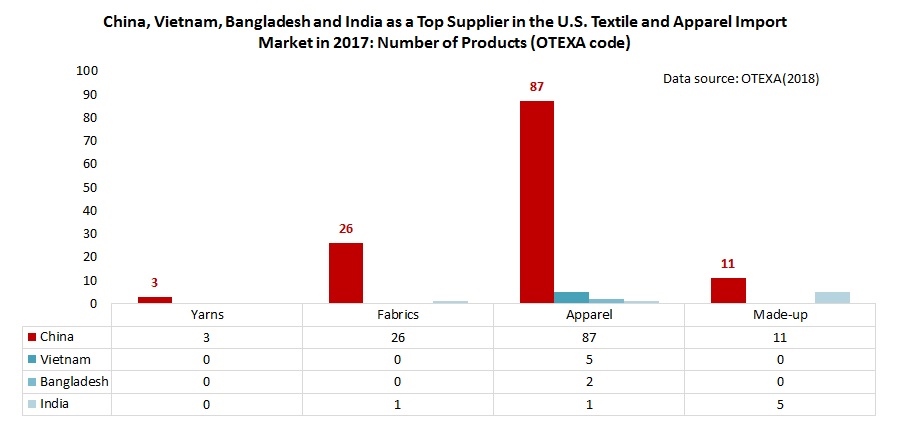
A fact-checking review of trade statistics in 2017 of a total 167 categories of textile and apparel (T&A) products categorized by the Office of Textiles and Apparel (OTEXA) suggests that T&A products “Made in China” still have no near competitors in the U.S. import market. Specifically, in 2017:
Of the total 11 categories of yarn, China was the top supplier for 3 categories (or 27.3%);
Of the total 34 categories of fabric, China was the top supplier for 26 categories (or 76.5%);
Of the total 106 categories of apparel, China was the top supplier for 87 categories (or 82.1%);
Of the total 16 categories of made-up textiles, China was the top supplier for 11 categories (or 68.8%);
In comparison, for those Asian T&A suppliers regarded as China’s top competitors:
Vietnam was the top supplier for only 5 categories of apparel (less than 5% of the total);
Bangladesh was the top supplier for only 2 categories of apparel (less than 2% of the total)
India was the top supplier for 1 category of fabric (2.9% of the total), 1 category of apparel (1% of the total) and 5 categories of made-up textiles (41.7% of the total)
Notably, China not only was the top supplier for many T&A products but also held a lion’s market shares. For example, in 2017:
For the 26 categories of fabric that China was the top supplier, China’s average market shares reached 40.5%, 22 percentage points higher than the 2nd top suppliers for these categories
For the 87 categories of apparel that China was the top supplier, China’s average market shares reached 52.4%, 36 percentage points higher than the 2nd top suppliers for these categories.
For the 11 categories of made-up textiles that China was the top supplier, China’s average market shares reached 58%, 43 percentage points higher than the 2nd top suppliers for these categories.
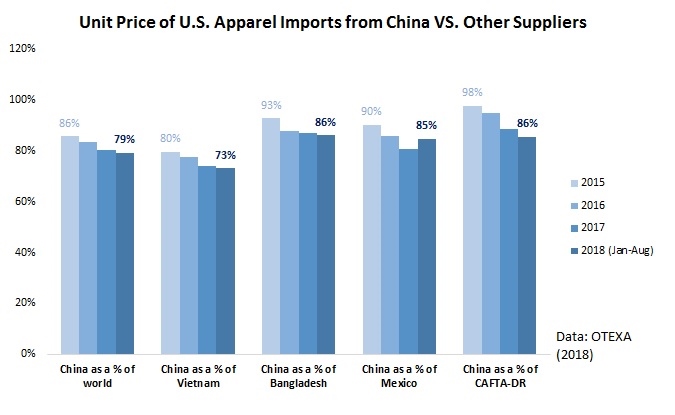
Furthermore, T&A “Made in China” are demonstrating even bigger price competitiveness compared to other suppliers in the U.S. market. For example, in 2017, the unit price of apparel “Made China” was only 74% of the price of “Made in Vietnam” (in 2015 was 80%), 86% of “Made in Bangladesh” (in 2015 was 93%), 85% of “Made in Mexico” (in 2015 was 90%) and 86% of products by members of CAFTA-DR (in 2012 was 98%).
Last but not least, the U.S.-China tariff war apparently has NOT affected China’s textile and apparel exports to the United States significantly. From January to August this year, China’s apparel exports to the U.S. declined by 1% in value and 0.3% in quantity from a year earlier, but China’s textile exports to the U.S. increased by 12.3% in value and 7.2% in quantity. China’s market shares in the U.S. market also remains overall stable.
Are the results surprising? How to explain China’s increasing price competitiveness despite its reported rising labor cost? What’s your outlook for the future of China as a sourcing destination for U.S. fashion brands and retailers? Please feel free to share your views.
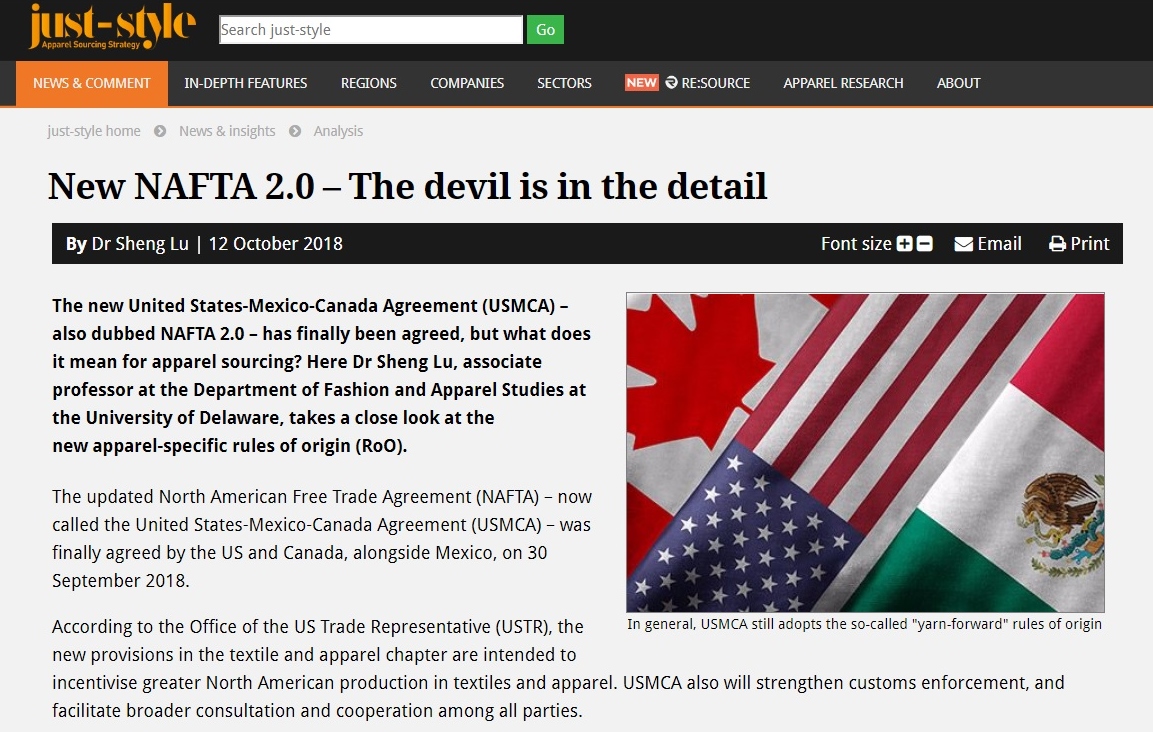
First, in general, USMCA still adopts the so-called “yarn-forward” rules of origin. This means that fibers may be produced anywhere, but each component starting with the yarn used to make the garments must be formed within the free trade area – that is, by USMCA members.
Second, other than the source of yarns and fabrics, USMCA now requires that some specific parts of an apparel item (such as pocket bag fabric) need to use inputs made in the USMCA region so that the finished apparel item can qualify for the import duty-free treatment.
Third, USMCA allows a relatively more generous De minimis than NAFTA 1.0.
1) Compared with NAFTA, USMCA will cut the TPL level, but only to those product categories with a low TPL utilization rate;
2) Compared with NAFTA, USMCA will expand the TPL level for a few product categories with a high TPL utilization rate.
Fifth, USMCA will make no change to the Commercial availability/short supply list mechanism in NAFTA 1.0.
Sixth, it remains to be seen whether USMCA will boost Made-in-the-USA fibers, yarns and fabrics by limiting the use of non-USMCA textile inputs. For example, while the new agreement expands the TPL level for U.S. cotton/man-made fiber apparel exports to Canada (currently with a 100 percent utilization rate), these apparel products are NOT required to use U.S.-made yarns and fabrics. The utilization rate of USMCA will also be important to watch in the future.
About USMCA
On 30 September 2018, The United States reached an agreement with Canada, alongside Mexico on the updated North American Free Trade Agreement (NAFTA), now called the United States-Mexico-Canada Agreement (USMCA).
Before taking into effect, USMCA still needs to be ratified by all member countries. In the United States, the earliest that President Trump can sign the agreement will be 11/29/2018 (i.e., 90 days after notifying the Congress). The U.S. International Trade Commission has until 3/14/2019 (i.e., 150 days after President signing the agreement) to release an assessment of the new trade agreement. Afterward, the Trump Administration will need to work with the Congress to develop legislation to approve and implement the agreement.
Business challenges facing U.S. fashion companies: Protectionism is the top challenge for the U.S. fashion industry in 2018. More companies worry about increases in production or sourcing cost, too. For the second year in a row, “protectionist trade policy agenda in the United States” ranks the top challenge for U.S. fashion companies in 2018.
Industry outlook:Despite concerns about trade policy and cost, executives are more confident about the five-year outlook for the U.S. fashion industry in 2018 than they were a year ago, although confidence has not fully recovered to the level seen in 2015 and 2016. In addition, 100 percent of respondents say they plan to hire more employees in the next five years, compared with 80-85 percent in previous studies; market analysts, data scientists, sustainability/compliance related specialists or managers, and supply chain specialists are expected to be the most in-demand.
U.S. fashion companies’ sourcing strategy: When it comes to sourcing, diversification is key for many companies.
Most respondents continue to maintain a diverse sourcing base, with 60.7 percent currently sourcing from 10+ different countries or regions, up from 57.6 percent in 2017.
Larger companies, in general, continue to be more diversified than smaller companies.
Reflecting the U.S. fashion industry’s growing global reach, respondents report sourcing from as many as 51 countries or regions in 2018, the same as in 2017. Asia as a whole continues to take the lead as the dominant sourcing region. Meanwhile, with the growing importance of speed-to-market and flexibility, the Western Hemisphere is becoming an indispensable sourcing base.
Keeping a relatively diverse sourcing base will remain a key element of U.S. fashion companies’ sourcing strategy. Nearly 80 percent of respondents plan to source from the same number of countries, or more countries, in the next two years. However, respondents are equally divided on whether to increase or decrease the number of suppliers they will work with.
“China plus Vietnam plus Many” has become an ever more popular sourcing model among respondents. And this model is evolving as companies further diversify their China production. In particular, China now typically accounts for only 11-30 percent of companies’ total sourcing value or volume, compared with 30-50 percent in the past.
Although China’s position as the top sourcing destination is unshakable, companies are actively seeking alternatives to “Made in China.” This does not seem to be due to concerns about cost, but rather the worries about the escalating U.S.-China trade tensions.
Benefiting from the diversification away from China, Vietnam and Bangladesh are expected to play a bigger role as apparel suppliers for the U.S. market in the near future.
Rules of origin and the utilization of trade agreements for sourcing: Rules of origin, and exceptions to the rules of origin, significantly impact whether companies use free trade agreements (FTAs) and trade preference programs for sourcing.
While FTAs and trade preference programs remain largely underutilized by U.S. fashion companies, more companies are using NAFTA (65 percent), CAFTA-DR (58 percent) and AGOA (50 percent) than in the past two years.
Still, it’s concerning that companies often do not claim the duty-free benefits when sourcing from countries with FTAs or preference programs. Companies say this is primarily due to the strict rules of origin.
Exceptions to the “yarn-forward” rules of origin, including tariff preference levels (TPLs), commercial availability/short supply lists, and cumulation, are priorities for respondents; 48 percent say they currently use these mechanisms for sourcing. These exceptions provide critical flexibilities that make companies more likely to use FTAs and source from FTA regions.
NAFTA: U.S. fashion companies call for a further reduction of trade barriers and urge trade negotiators to “do no harm” to NAFTA, the most-utilized free trade agreement by respondents.
Respondents predominantly support initiatives to eliminate trade barriers of all kinds, from high tariffs to overcomplicated documentation requirements, to restrictive rules of origin in NAFTA and future free trade agreements.
More than half of respondents explicitly say NAFTA is important to their business—and they have grave concerns about the uncertain future of the agreement.
Sourcing in sustainable and socially compliant ways: Overall, U.S. fashion companies are making more commitments to sustainability and social responsibility.
85 percent of respondents plan to allocate more resources for sustainability and social compliance in the next two years, in areas including providing training to suppliers and internal employees, adding more employees, and working more closely with third-party certification programs on sustainability and social compliance. However, the availability of operational budget remains the primary hurdle for companies that want to do more.
100 percent of respondents map their supply chains (i.e., keep records of name, location, and function of suppliers), up from 90 percent in 2017. Over 80 percent of respondents track not only Tier 1 suppliers (i.e., factory where the final product is assembled), but also Tier 2 suppliers (i.e., subcontractors or major component suppliers, such as fabrics). However, it’s less common for companies to map Tier 3 (i.e., yarn spinners, finding and trimming suppliers) and Tier 4 suppliers (i.e., raw materials suppliers, such as cattle/pig hides, rubber, cotton, wool, goose down, minerals/metals and chemicals).
100 percent of respondents audit their suppliers for issues including building safety, fire safety, and treatment of workers. The vast majority of respondents (96 percent) currently use third-party certification programs to audit, with both announced and unannounced audits.
The US Fashion Industry Benchmarking Study from 2014 to 2017 can be downloaded from HERE
Statistics from the Public Radio International (PRI) show that garment workers in many parts of the world earn much less than the national average. Of the twenty-one countries investigated by PRI, the monthly wage for garment workers range widely from $1,864 (USA) to $194 (Sri Lanka).
However, a higher wage level in absolute term does not necessarily mean a more decent pay. For example, while garment workers in the US apparently earn much more than their peers in other parts of the world, the wage level nevertheless was only 51 percent of the U.S. national average wage. Likewise, while garment workers in Honduras earn only $650 each month, this amount was approximately 107 percent of the national average wage in the country.
For more information about the wage level for garment workers around the world, please explore the Fair-fashion Quiz created by PRI.
#1 What evidence can support the arguments that cutting off secondhand clothing imports from Africa will allow African nations to build their own textile industry? Likewise, what evidence can support the arguments that African countries overall benefit from importing used clothing from countries like the United States?
#2 Given the debate on used clothing trade on African nations, will you continue to donate used clothing? Why or why not?
#3 China holds a dominant position in textile and apparel production and exports because of their vast amounts of technology, workers, and resources. How do you think least developing countries like Africa will be able to keep up with such steep competition? Why or why not it is a wise decision for the United States to threaten to take away East African countries’ benefits under AGOA?
Social and economic impact of apparel trade
#4 Is factory employment in India a step in the right direction for the country’s gender equality? What effects, positive or negative, could such employment have in regards to gender issues?
#5 We keep arguing that globalization is negative because we are taking jobs away from U.S. workers. But by sending more work to factories in India, we’ve created jobs for these Indian women who, before working in the factories, were sheltered and only sent off into the world for arranged marriage. In this sense, is globalization still negative if we’re creating a sense of freedom and purpose for these women?
#6 As detailed in the article, the working conditions and treatment of workers is extremely unethical in some garment factories. Can globalization help this issue or hurt it more?
#7 How do you compare your life to the Indian girls in the article? And please just imagine: ten years later, what will the life of these Indian girls look like? How about yours?
Welcome to our online discussion! Please mention the question # in your comment.
#1 Why do you agree or disagree with the video that automation will post a significant challenge to garment workers in developing countries such as Bangladesh? How should policymakers react to the challenges?
#2 Can automation be a permanent solution to the social responsibility problem in the garment industry?
#3 In your view, how will automation affect the big landscape of apparel sourcing and the patterns of world textile and apparel trade?
#4 Why or why not do you anticipate a sizable return of apparel manufacturing to the United States if apparel production can be largely automated?
In January 2018, Just-Style consulted a panel of industry leaders and scholars in its Outlook 2018–Apparel Industry Issues in the Year Ahead management briefing. Below is my contribution to the report. All suggestions and comments are most welcome!
1. What do you see as the biggest challenges – and opportunities – facing the apparel industry in 2018, and why?
One of the biggest opportunities facing the apparel industry in 2018 could be the faster growth of the world economy. According to the International Monetary Fund (IMF), the global growth forecast for 2018 is expected to reach 3.7 percent, about 0.1 percent points higher than 2017 and 0.6 percent points higher than 2016. Notably, the upward economic growth will be broad-based, including the United States, the Euro area, Japan, China, emerging Europe and Russia. Hopefully, the improved growth of the world economy will translate into increased consumer demand for clothing in 2018.
Nevertheless, from the macroeconomic perspective, oversupply will remain a significant challenge facing the apparel industry in 2018. Data from the World Bank and the World Trade Organization (WTO) shows that, while the world population increased by 21.6 percent between 2000 and 2016, the value of clothing exports (inflation-adjusted) surged by 123.5 percent over the same period. Similarly, between 2000 and 2016, the total U.S. population increased by 14.5 percent and the GDP per capita increased by 22.2 percent, but the supply of apparel to the U.S. retail market surged by over 67.8 percent during the same time frame. The problem of oversupply is the root of many challenges faced by apparel companies today, from the intense market competition, pressure of controlling production and sourcing cost, struggling with excessive inventory and deep discounts to balancing sustainability and business growth.
2: What’s happening with sourcing? How is the sourcing landscape likely to shift in 2018, and what can apparel firms and their suppliers do to stay ahead?
The 2017 US Fashion Industry Benchmarking Study, which I conducted in collaboration with the US Fashion Industry Association (USFIA) earlier this year, provides some interesting insights into companies’ latest sourcing strategies and trends. Based on a survey of 34 executives at the leading U.S. fashion companies, we find that:
First, most surveyed companies continue to maintain a relatively diversified sourcing base, with 57.6 percent currently sourcing from 10+ different countries or regions, up from 51.8 percent last year. Larger companies, in general, continue to have a more diversified sourcing base than smaller companies. Further, around 54 percent of respondents expect their sourcing base will become more diversified in the next two years, up from 44 percent in 2016; over 60 percent of those expecting to diversify currently source from more than 10 different countries or regions already. Given the uncertainties in the market and the regulatory environment (such as the Trump Administration’s trade policy agenda), companies may use diversification to mitigate potential market risks and supply chain disruptions due to protectionism.
Second, although U.S. fashion companies continue to seek alternatives to “Made in China” actively, China’s position as top sourcing destination remains unshakable. Many respondents attribute China’s competitiveness to its enormous manufacturing capacity and overall supply chain efficiency. Meanwhile, it is interesting to note that the most common sourcing model is shifting from “China Plus Many” to “China Plus Vietnam Plus Many” (i.e. China typically accounts for 30-50 percent of total sourcing value or volume, 11-30 percent for Vietnam and less than 10 percent for other sourcing destinations). I think this sourcing model will likely to continue in 2018.
Third, social responsibility and sustainability continue to grow in importance in sourcing decisions. In the study, we find that nearly 90 percent of respondents give more weight to sustainability when choosing where to source now than in the past. Around 90 percent of respondents also say they map their supply chains, i.e., keeping records of name, location, and function of suppliers. Notably, more than half of respondents track not only Tier 1 suppliers, suppliers they contract with directly, but also Tier 2 suppliers, i.e., supplier’s suppliers. However, the result also suggests that a more diversified sourcing base makes it more difficult to monitor supply chains closely. Making the apparel supply chain more socially responsible, sustainable and transparent will continue to be a hot topic in 2018.
3: What should apparel firms and their suppliers be doing now if they want to remain competitive further into the future? What will separate the winners from the losers?
I assume many experts will suggest what apparel firms should change to stay competitive into the future. However, the question in my mind is what should companies keep doing regardless of the external business environment? First, I think companies should always strive to understand and impress consumers and control their supply chains. Despite the growing popularity of e-commerce and the adoption of transformative new technologies, the fundamental nature of apparel as a buyer-driven business will remain the same. Second, companies should always leverage their resources and stay “unique,” no matter it means offering differentiated products or value-added services, maintaining exclusive distribution channels or keeping the leadership position in a particular niche market. Third, apparel firms should always follow the principle of “comparative advantage” and smartly define the scope of their core business functions instead of trying to do everything. Additionally, winners will always be those companies that can take advantage of the mega-development trends of the industry and be willing to make long-term and visionary investments, both physical and intangible (such as human talents).
4: What keeps you awake at night? Is there anything else you think the apparel industry should be keeping a close eye on in the year ahead? Do you expect 2018 to be better than 2017, and why?
I think the apparel industry should keep a close eye on the following issues in 2018:
The possible reaching of the Regional Comprehensive Economic Partnership (RCEP): Even though RCEP is less well-known than the Trans-Pacific Partnership (TPP), we should not ignore the potential impact of the agreement on the future landscape of textile and apparel supply chain in the Asia-Pacific region. One recent study of mine shows that the RCEP will lead to a more integrated textile and apparel supply chain among its members but make it even harder for non-RCEP members to get involved in the regional T&A supply chain in the Asia-Pacific. This conclusion is backed by the latest data from the World Trade Organization (WTO): In 2016, around 91 percent of Asian countries’ textile imports came from other Asian countries, up from 86 percent in 2006. The more efficient regional supply chain as a result of RCEP will further help improve the price competitiveness of apparel made by “factory Asia” in the world marketplace. Particularly in the past few years, textile and apparel exports from Asia have already posted substantial pressures on the operation of the textile and apparel regional supply chain in the Western Hemisphere.
Automation of apparel manufacturing and its impact on the job market: Recall my observations at the MAGIC this August, several vendors showcased their latest technologies which have the potential to automate the cut and sew process entirely or substantially reduce the labor inputs in garment making. The impact of automation on the future of jobs is not a new topic, but the apparel industry presents a unique situation. Globally, over 120 million people remain directly employed in the textile and apparel industries today, a good proportion of whom are females living in poor rural areas. According to the World Trade Organization (WTO), for quite a few low-income and lower-middle income countries such as Bangladesh, Gambia, Pakistan, Madagascar, Sri Lanka, and Cambodia, as much as over 70 percent of their total merchandise exports were textile and apparel products in 2016. Should these labor-intensive garment sewing jobs in the developing countries were replaced by machines, the social and economic impacts will be consequential. I think it is the time to start thinking about the possible scenarios and the appropriate policy responses.
First, apparel companies are attaching greater importance to speed-to-market in their sourcing decisions. According to the result, the need for a faster, more responsive supply chain is being driven by consumers’ increasing demands for immediacy and constant newness, as well as the speed with which social media can spread new trends.
Second, respondents say the rising sourcing and production cost remains one of their top business challenges in the New Year. Key drivers of cost increase include wage of production workers, raw material price and the social and environmental compliance cost. Notably, almost half expect their sourcing budget to go up, with 15.3% seeing an increase of more than 5%, and 32.8% anticipating a rise of between 1% and 5%. A further 32.1% see their budgets staying the same in the year ahead.
Third, the survey result confirms that China’s dominance of global apparel manufacturing is unlikely to change anytime soon. Asked about their China sourcing plans in 2018, 21.1% of respondents said they would buy more here over the next 12 months, some 30.5% expect their China sourcing to remain roughly the same year-on-year, and 28.9% expect to source less. Respondents say that “no other country can match China regarding the size of its supply base, its range of skills, its quality levels, its product variety and the completeness of its supply chain. The country also continues to lead the way when it comes to efficiency and infrastructure.” Meanwhile, Bangladesh and Vietnam continue to be seen as the two sourcing markets most likely to grow in importance in the next five years.
Fourth, respondents also expressed concerns about uncertainty over trade agreements (64.5%), particularly how the Trump Administration may do with the North American Free Trade Agreement (NAFTA). However, the impact of uncertainty created by Brexit seems to be limited.
Tarek Kabil – Egyptian Ministry of Trade & Industry
Ashraf Rabiey – QIZ Minister of Egypt
Gabi Bar – QIZ Minister of Israel
Mark D’Sa – Special Project Director for Haiti
Moderator: Gail Strickler – former Assistant US Trade Representative for Textiles
Discussion questions:
What are the financial incentives for US brands and retailers to source apparel in preference program countries? Why do U.S. apparel imports from members of AGOA, QIZs and HELP overall remain at a fairly low level despite the trade preference programs? How to improve the situation?
Overall, why or why not should the US keep the trade preference programs or any critical reforms are needed?
Any other interesting points you learned from the video or questions you may have?
Dr. Marsha Dickson, Irma Ayers Professor, Department of Fashion and Apparel Studies at the University of Delaware discusses her co-founded Better Buying project(http://www.betterbuying.org), a meaningful effort to improve the social responsibility practices in the global apparel industry. The video is produced by Mallory Metzner, reporter of channel 49 of the University of Delaware.
The United States maintains a bilateral trade surplus in yarns and fabrics ($4.1 billion in 2016) as well as made-up textiles ($720 million in 2016) with NAFTA members.
Regarding apparel, the United States had a trade surplus with Canada of $1.4 billion and a trade deficit with Mexico of $2.7 billion in 2016.
Impact of NAFTA on employment and production in the U.S. textile and apparel industry
The effects of NAFTA are NOT straightforward, and the drop in U.S. domestic textile and apparel production and jobs cannot be blamed solely on NAFTA.
The U.S. International Trade Commission (USITC) concluded that imports of textiles had a tiny effect on U.S. textile industry employment (a 0.4% decline) from 1998 to 2014, which covers most of the period since NAFTA’s enactment. However, the collapse of the U.S. domestic apparel industry and changing clothing tastes may have had a more significant impact on domestic textile production.
There is little evidence that NAFTA was the decisive factor for the loss of jobs in the U.S. apparel manufacturing sector, given that the major growth in apparel manufacturing for the U.S. market has occurred in Asian countries that receive no preferences under NAFTA.
Impact of the Tariff Preference Level (TPL) in NAFTA
In nearly every year since 2010, Mexico has come close to exporting the maximum allowable amount of cotton and man-made fiber apparel with duty-free foreign content. Canada’s TPL fill rates are typically highest for cotton and man-made fiber fabric and made-up products but are not usually fully filled.
It is not clear that eliminating the TPL program would result in a substantial return of textile production or jobs to the United States;if it were to raise the cost of Mexican apparel production, it could instead result in imports from other countries displacing imports from Mexico.
Other than U.S. fashion brands and retailers, Mexico and Canada reportedly oppose the elimination of the NAFTA TPL program too.
Possible Effects of Potential NAFTA Modification
Mexico’s focus on basic apparel items suggests that S. importers could quickly source from elsewhere if duty savings under NAFTA are eliminated. However, even now, some U.S. fashion companies say the duty savings are not worth the time and resources required to comply with the NAFTA rules of origin and documentation requirements. In 2016, roughly 16% of qualifying textile and apparel imports from NAFTA failed to take advantage of the duty-free benefits and instead paid applicable tariffs.
Whatever the outcome of the NAFTA renegotiation, in the medium and long run, the profitability of the North American textile and apparel industry will likely depend less on NAFTA preferences such as yarn forward and more on the capacity of producers in the region to innovate to remain globally competitive.
One change in NAFTA proposed by the United States would require motor vehicles to have 85% North American content and 50% U.S. content to qualify for tariff-free treatment. If auto manufacturers were to import more passenger cars from outside the NAFTA region and pay the 2.5% U.S. import duty rather than complying with stricter domestic content requirements, automotive demand for U.S.-made technical textiles could be adversely affected.
If the TPP-11 countries strike a trade deal, one possible effect is that Canada and Mexico may import more textile and apparel products from other TPP countries, including Vietnam. This could ultimately be a disadvantage for U.S.-based producers. How the inclusion of Canada and Mexico in a fresh TPP-11 arrangement would affect their participation in NAFTA is unknown.
Pete Bauman, Senior VP, Burlington Worldwide / ITG
Joann Kim, Director, Johnny’s Fashion Studio
Tricia Carey, Business Development Manager, Lenzing USA
Michael Penner, CEO, Peds Legwear
Moderator: Arthur Friedman, Senior Editor, Textiles and Trade, WWD
Video Discussion Questions
How does “Made in the USA” fit into US textile and apparel companies’ overall business strategy today?
What measures have been taken by US textile and apparel companies to bring more production back to the US? Can any measures be linked to the restructuring strategies we discussed in the class?
What are the significant obstacles to bringing textile and apparel manufacturing back to the US?
Any other exciting points/buzzwords did you learn from the panel discussion?
This video is a great reminder of the impact of our fashion apparel industry, in particular through trade and sourcing. One key learning objective of FASH455 is to help students get aware of those critical global agendas that are highly relevant to the textile and apparel sector.
Discussion Question: After watching the video, do you have any new thoughts about how you can contribute to the building of a better world as a FASH major?
The latest Just-Style State of Sourcing Survey conducted in December 2016 suggests a few trends of apparel sourcing in 2017:
Exchange rate volatility and rising raw material and labor costs are among the top concerns for apparel sourcing in 2017. Around 69% of survey respondents expect overall sourcing costs to rise in 2017, compared with 54.5% in last year’s survey. The fluctuating exchange rate, buyer’s expectation for higher quality of products and complex compliance requirements are among the major factors driving up the sourcing cost.
Apparel companies expect more uncertainties regarding the political and policy environment in 2017. Specific concerns for apparel companies include trade policy under Trump’s Administration, possible renegotiation of trade agreements such as the North American Free Trade Agreement (NAFTA) and Trump’s threats to impose a 45% punitive tariff on US textile and apparel imports from China. Respondents say the uncertainties make it challenging for companies to do strategic planning in advance
Sourcing will play an increasingly important role helping companies achieve strategic goals. It is highly expected that sourcing can contribute to meeting the fast-evolving demands of omni-channel retailing, consumers’ expectations for a more convenient shopping experience, as well as greater product innovation across all sales channels. A few respondents say they will use process and productivity improvement and closer collaboration with key suppliers to try to achieve these goals and mitigate any sourcing cost increases.
Sourcing destinations may continue to slightly adjust in 2017. Specifically, 72.1% of respondents say they are looking for alternative source of supply in 2017 compared with 69.2% last year. Popular emerging sourcing destinations include Central America and the United States, EU, UK, Vietnam, Bangladesh, Indonesia and Kenya. However, the survey also confirms that China‘s dominance as the top apparel supplier is unlikely to change anytime soon – with a rise in the number of respondents looking to increase orders from the country in the upcoming year.
Respondents of the survey include manufacturers (29%), importers, agents or sourcing office executives (23%), retailers (12%), fiber, yarn, or fabric suppliers (11%), consulting, research, government, trade institute, NGO and university fields (14%) and software suppliers (2.6%).
First, TPP is suggested to have a limited impact on U.S. domestic textile and apparel manufacturing, because:
1) Automation rather than imports is found to be the top factor causing job losses in the U.S. textile industry in the past decade;
2) U.S. is one of the very few TPP members whose textile output mostly went into home textiles, floor coverings and other technical textile products rather than apparel.
3) More than 90% of apparel sold in the United States is already imported. Some companies maintain U.S. manufacturing of high-value products or products requiring quick delivery, which are not likely to be supplied by other TPP members.
4) A quantitative assessment conducted by the U.S. International Trade Commission (USITC) in May also suggests that U.S. imports of textiles will only climb 1.6% by 2032 if TPP enters into force in 2017. Over the same 15-year period, both output and employment in the U.S. textile industry could slightly shrink by 0.4% as a result of the implementation of TPP.
Second, TPP could challenge the Western-Hemisphere supply chain and negatively affect U.S. textile exports to the region:
1) TPP will make apparel manufacturers located in Mexico and Central America lose one important advantage—duty free access to the U.S. market, when competing with Asian TPP members such as Vietnam and Malaysia. The Central American-Dominican Republic Apparel and Textile Council also estimates the CAFTA-DR region could see a contraction of 15%-18% in industrial employment resulting from lost production orders in the first year after the TPP agreement is implemented.
2) The major products sourced by U.S. apparel companies from the Western Hemisphere region include basic, low-value knitwear garments such as shirts, pants, underwear, and nightwear, with a focus on men’s and boys’ wear. However, these products are with low time sensitivity but high price sensitivity, meaning Asian TPP members can easily offer a more competitive price and take away sourcing orders after the implementation of TPP.
3) Because of physical distance and abundance of local supply, leading Asian TPP apparel exporters such as Vietnam seldom use US-made yarns and fabrics. Supported by foreign investments, Vietnam is also quickly building up its own textile manufacturing capacity, which is expected to reach 2 million metric tons for fabrics and 650,000 metric tons for fibers by 2020. This implies that TPP may help little creating new export markets for US textile products, despite the restrictive yarn forward rules of origin.
Additionally, TPP could result in intensified competition in the technical textile area, which is of strategic importance to the future of the U.S. textile industry:
1) If the proposed agreement is implemented, those segments of the U.S. textile industry that supply industrial textiles are likely to face greater competition from rising imports from Japan.
2) TPP will allow Japanese industrial textiles to newly get duty free access to Mexico and Canada, which are the largest export markets for U.S. industrial fabrics in 2015. However, TPP won’t help US companies get more favorable access to China, which is the top export market for Japanese industrial fabrics.